Article

Assessing the Benefits of Electrification for the Mackinac Island Ferry from an Environmental and Economic Perspective

APS LABS, Michigan Technological University, Houghton, MI 49931, USA
*
Author to whom correspondence should be addressed.
Sustainability 2024, 16(10), 4297; https://doi.org/10.3390/su16104297
Submission received: 1 March 2024 / Revised: 26 April 2024 / Accepted: 10 May 2024 / Published: 20 May 2024

Abstract

:
Ferry electrification has gained attention in the last decade as a potential path to reduce greenhouse gas emissions. This study, conducted by APS LABS at Michigan Technological University for the Mackinac Economic Alliance (MEA) and funded by the Michigan Economic Development Corporation (MEDC), looked at the feasibility and potential benefits of electrification of a particular vessel that is part of a ferry service from Mackinaw City, Michigan, USA, to Mackinac Island, Michigan, USA. The study included a comprehensive analysis of the feasibility of retrofitting the current configuration of the ferry into an all-electric ferry based on the availability of components in today’s market. A life-cycle assessment was conducted to compare the emissions between the baseline ferry rebuilt with new internal combustion engines and an all-electric ferry to understand the potential environmental benefits of ferry electrification and find the most sustainable solution for propulsion. The final prong of the three-pronged approach to this project consisted of estimating the difference in expenditures and profits for a rebuilt internal combustion (IC) engine versus electric configurations for a company operating the ferry. The analysis indicated that in the current scenario, electrification of the Mackinac Island ferry is not beneficial, and replacing the ferry’s current diesel engines with modern diesel engines is the preferred solution.

1. Introduction

With the increasing energy demand globally, environmental pollution and greenhouse gas (GHG) emissions are challenges faced by every transportation sector. Water-based transport is not devoid of the issue of increasing emissions. Without changes to the current emission policies, the total maritime emissions are estimated to increase from 29 billion tons in 2009 to 43 billion tons in 2035 [1]. In order to curb GHG emissions from ships and ferries, the International Maritime Organization (IMO) set a goal in April 2018 to reduce GHG emissions by at least 50% by the year 2050, with emissions from 2008 as the baseline [2]. In response to the goal set by the IMO, many countries have implemented policies to push ‘green ships’, as these are seen as the best path to reduction of emissions [3]. To meet the emission regulations set by countries, there has been a significant push for electrification and hybridization of ships in the last few years [4,5].
Of the well documented electrification/hybridization projects up to the year 2018, the country of Norway leads the way with 7 ships/ferries from a total of 26 [6]. The 26 electrified ferries make up approximately 2% of global passenger ferries and 0.3% passenger ships [7], but that number is bound to rise in the years to come. The push for electrification in Norway is logical, as over 99% of Norway’s electricity generation is from renewable sources of energy [8], as shown in Figure 1. Even if all the inefficiencies of electricity transmission, battery charging, battery discharging, and the onboard electronics are taken into consideration, the electrification of ferries still leads to a significant reduction in CO2 emissions.
However, this is not the situation in all regions and countries. For example, the renewable/non-renewable energy split in the United States of America (USA) is shown in Figure 2. According to 2021 data [9], 60% of the electricity generation in the country is using conventional non-renewable sources of energy like coal and natural gas (NG), which leads to significantly more CO2 emissions per unit of electricity on the grid. (The most recent reliable grid data for Norway and the United States while the project was ongoing was for the year 2021. At the time of writing the manuscript, grid data for the year 2022 are available. However, as there is not a significant difference in the distribution of energy generation for the two years, the authors decided to go with the data used in the analysis of the project.).
The electricity generation in the state of Michigan resembles the national picture, with coal and natural gas power plants supplying approximately 62% of the state’s energy as shown in Table 1 [10]. The remaining 38% comes from nuclear and renewable sources of energy. In this scenario, CO2 reduction through electrification/hybridization is not as straightforward of a solution as it is in Norway. Because of CO2 emissions at the source of electricity generation, a fully electrified ferry charged from the grid could potentially lead to an increase in CO2 emissions. For this reason, to obtain a complete picture for the most sustainable configuration, the emissions at the power plants needs to be taken into account while conducting the analysis of whether electrification can be beneficial from the standpoint of reducing GHG emissions.
Figure 3 shows the distribution of diesel consumption for non-road sources in the United States from 2010 to 2020 [11]. Although ships and boats only make up 8% of the non-road diesel consumption, this is not an insignificant number and provides an opportunity for a reduction in CO2 emissions.
This research study provides an engineering analysis on the potential electrification of a ferry that travels between Michigan’s Mackinaw City and the Mackinac Island State Park located in Lake Huron. The ferry under consideration, the Voyager (name changed for anonymity purposes), is one of the ferries in the fleet operated by a prominent Mackinac Island ferry company (name not mentioned for anonymity purposes). The paper looks into the goals and motivation for this analysis, takes a deep dive into the methodology deployed in conducting the analysis, explores the results, and wraps up with discussion and conclusions based on the results.

2. Goal and Motivation

Mackinac Island is one of the most popular tourist destinations in Michigan during the summer months. It is estimated that around one million people make the trip from the mainland to the island each summer with each ferry making approximately 1400 round trips every season (discussions with the Mackinac Island ferry company). Even if there is a slight reduction in emissions and cost from electrification per ferry trip, the overall impact for the entire season can be sizable.
The Voyager was commissioned by the ferry company in question in 1991, and by making over 1000 trips per season, it has accrued significant hours on the propulsion system. Over the years, the operators have observed a reduction in cruising speed for a given relative load (fuel rate), thus indicating a reduction in the operating efficiency of the vessel. In addition to that, a Detroit Diesel 12V71 engine was installed a few years ago to keep the ferry operational at the required speeds. The company was considering replacing the propulsion diesel engines of the ferry, making it an appropriate time to investigate whether the benefits of retrofitting the ferry into a battery electric vehicle (BEV) outweigh those of replacing the engines.
The analysis conducted as a part of this study included assessing the feasibility of a retrofit electric Mackinac Island Ferry with respect to the following:
  • Technological readiness—Is it physically possible to convert the Voyager into a battery electric vehicle based on the current commercially available technology?
  • Environmental impact—Does it benefit the environment to convert the Voyager into a BEV? Will electrifying the ferry be a net benefit in terms of long-term sustainability?
  • Economics—Is it economical for the ferry company to convert the Voyager into a BEV?
To put it succinctly, the goal of this study was to conduct an engineering analysis to determine what was the better choice for the Voyager:
(1)
Replace the ferry’s diesel engines with modern diesel engines.
(2)
Convert the ferry to a BEV.

3. Methodology

At the onset of this project, the constraints were very clearly defined by the stakeholders (the Mackinac Island ferry company and Mackinac Economic Alliance). This method was very effective at minimizing the scope-creep that often occurs with research projects. The following are the major constraints that were utilized in the project:
  • The comparison had to be between petroleum diesel IC engine propulsion and pure BEV propulsion. Hybrid electrified configurations were outside the scope of this project, as were alternative and low-carbon fuels. Analyzing these potential alternatives is, however, recommended for future work.
  • The speed of the BEV configuration had to match that of the IC engine configuration, so that trip time was not impacted.
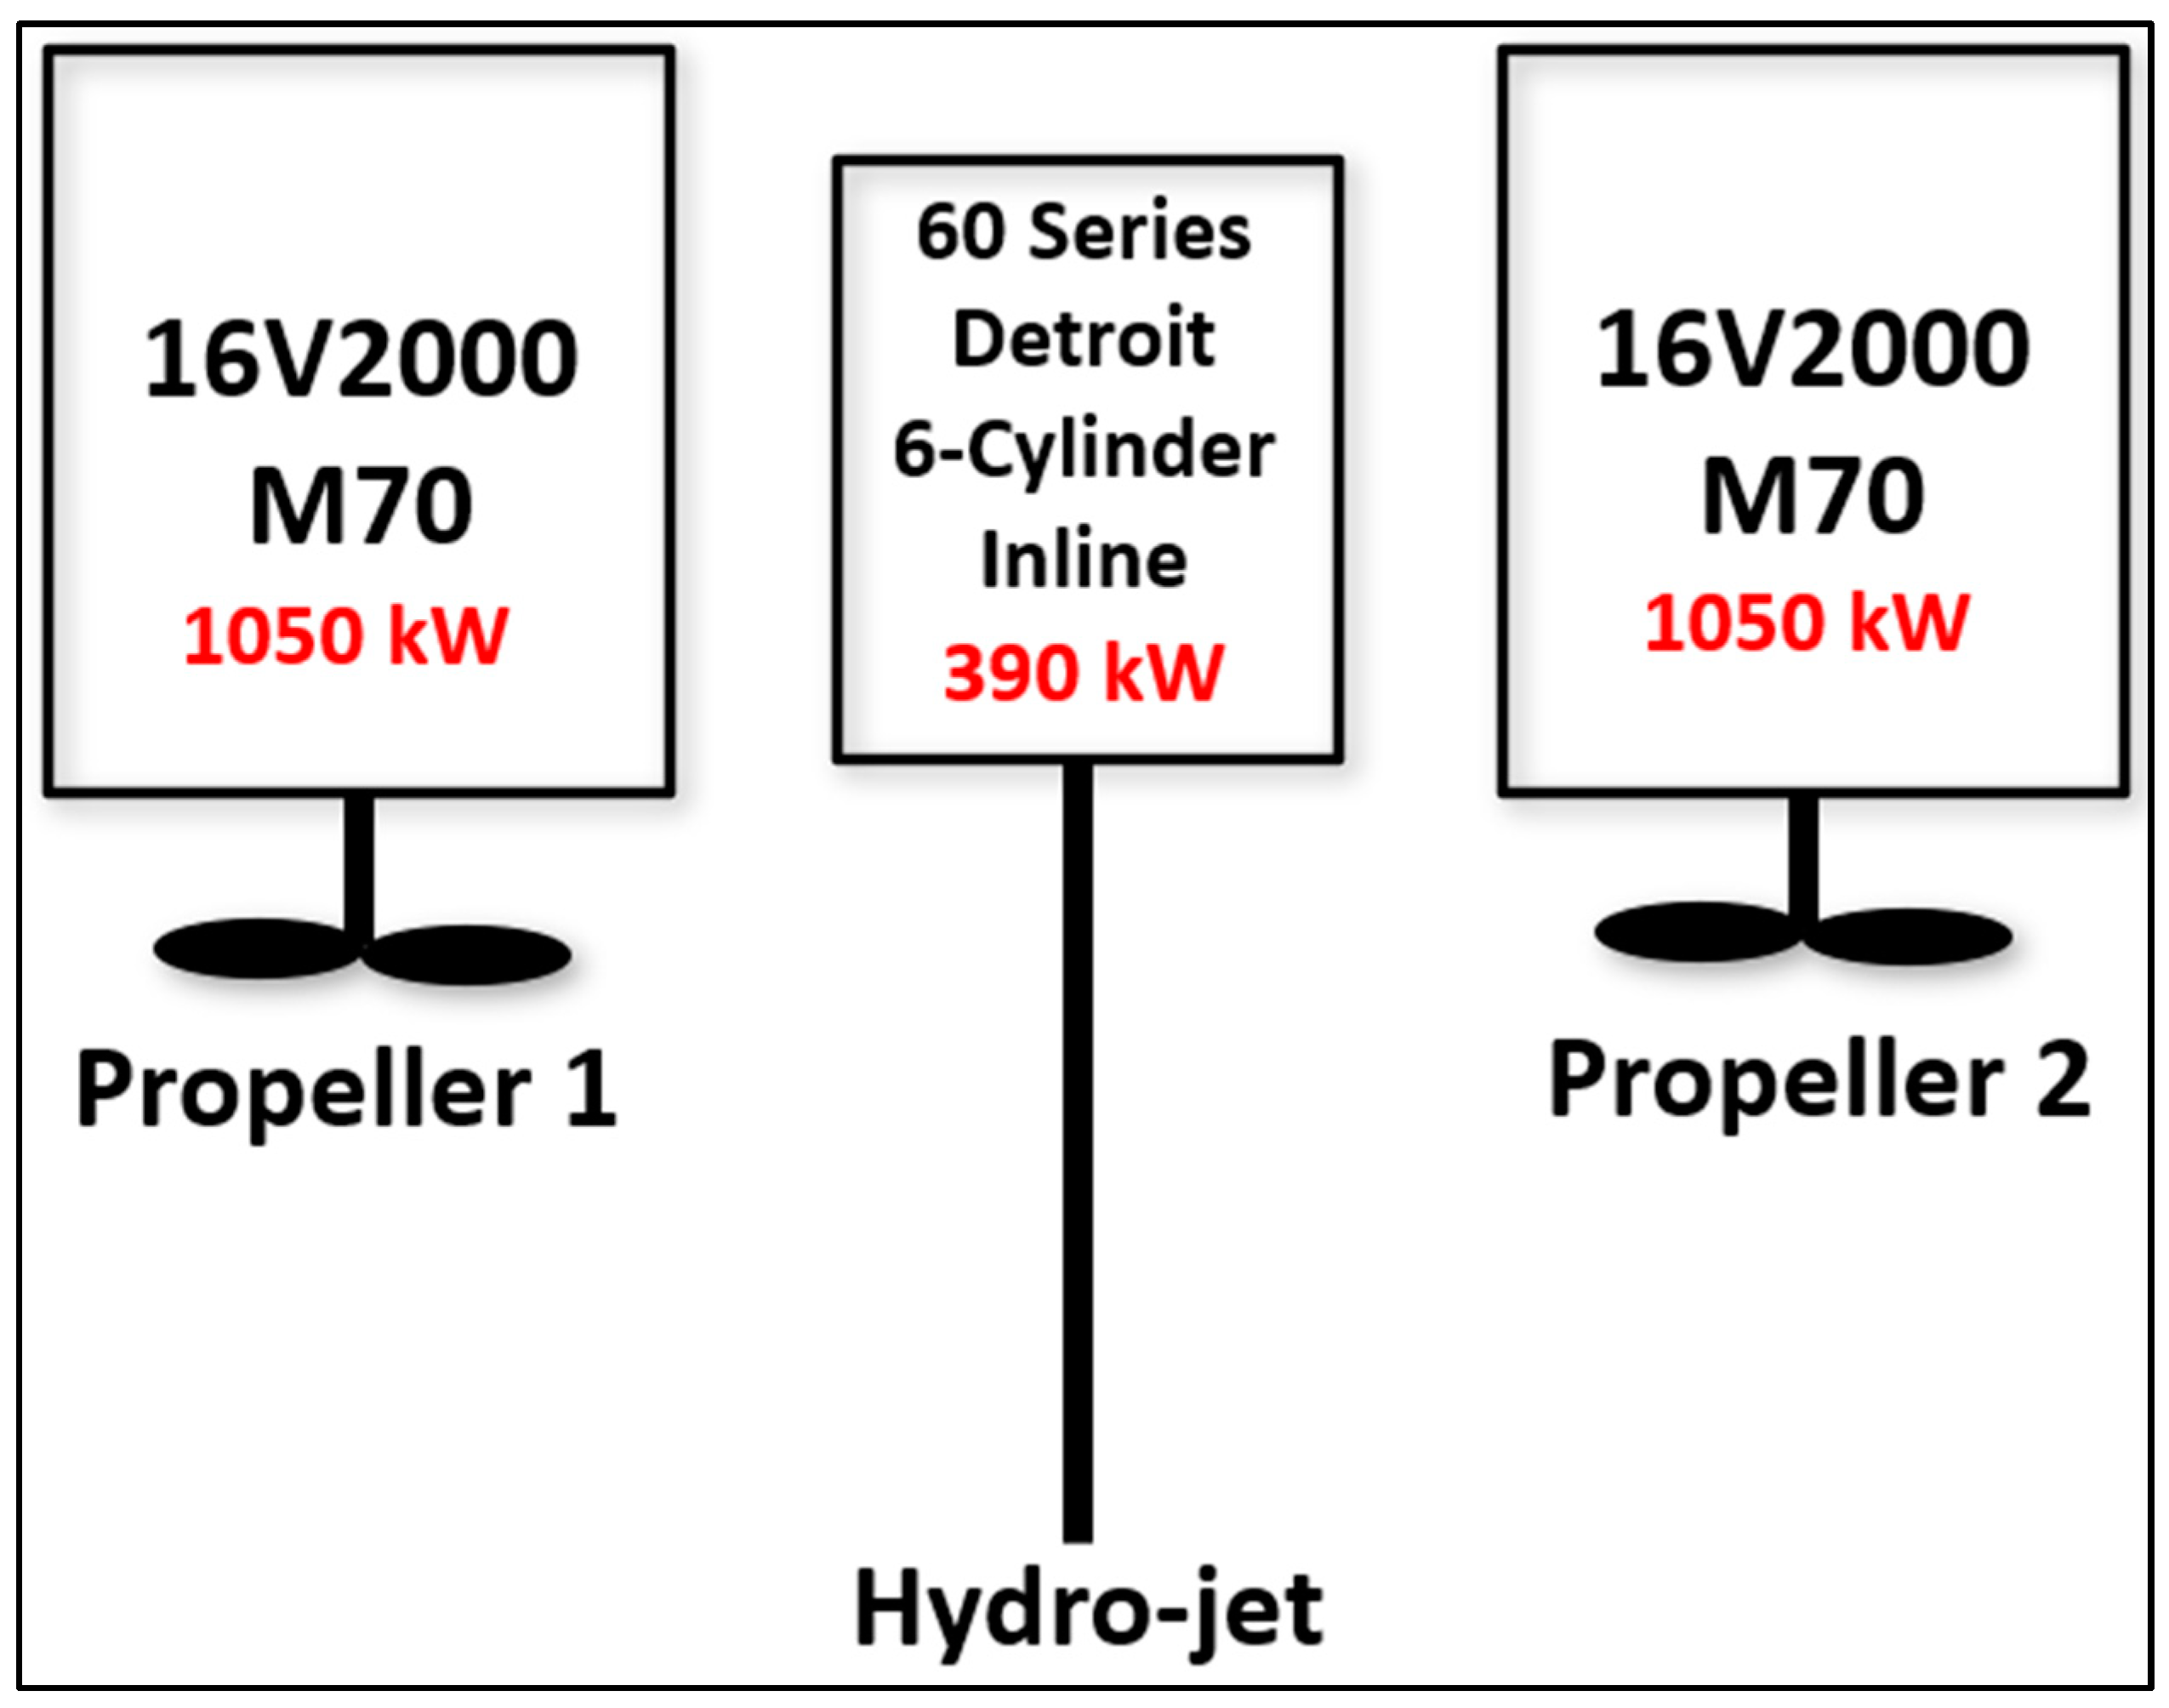
  • The hydro-jet, which is a unique feature of the ferry company’s fleet, was to be included in the analysis of both the ICE and BEV configurations.
To understand the operation of the ferries traveling to and from Mackinac Island, and to establish a well-defined operating cycle for the analysis, the authors traveled to Mackinaw City to ride the ferries and collect data first-hand. Extensive interviews with the captains, crew, and maintenance staff regarding speeds and loads, weather patterns throughout a season, and how the weather affects the energy consumption, passenger and cargo loading and unloading, maintenance schedules, docking, etc., of the ferries shed further light on the questions at hand.
GPS data were logged to obtain speed vs. time data for the ferries. A representative data set depicting the route is shown in Figure 4.
Travel from Mackinaw City to Mackinac Island and back is approximately a 25 km (15.6 mile) route. The logged drive cycle starts from Mackinaw City, docks at Mackinac Island, and then returns to the mainland. The speed vs. time data for this drive cycle for the Voyager and the Liberty II (names changed for anonymity purposes), which are two of the ferries in the ferry company’s fleet, are shown below in Figure 5. The two ferries are similar in length and passenger capacity. For all parts of the drive cycle, the fuel flow rate displayed on the captain’s control panel was noted.
The drive cycle data sheds light on the fact that the Voyager cannot cruise as fast as the Liberty II even with an additional engine, because of the deterioration of its engines. Hence, while determining the total fuel and energy consumption for a drive cycle, the Liberty II data were used. The engines used in the Liberty II are shown in Figure 6. This is the proposed configuration for the Voyager if it is to be rebuilt with new engines.
The Liberty II has two MTU 16V2000 M70 diesel propulsion engines. A third Detroit Diesel Series 60 6-cylinder engine is used to power the hydro-jet at the back of each ferry. The hydro-jet does not contribute to the propulsion of the ferry. Rather it creates a unique decorative feature which has become synonymous with the brand image of the company. As noted earlier, in scoping the project with the ferry company, it was stated that the hydro-jet must remain part of the rebuilt Voyager.
The main takeaways from the Liberty II drive cycle are as follows:
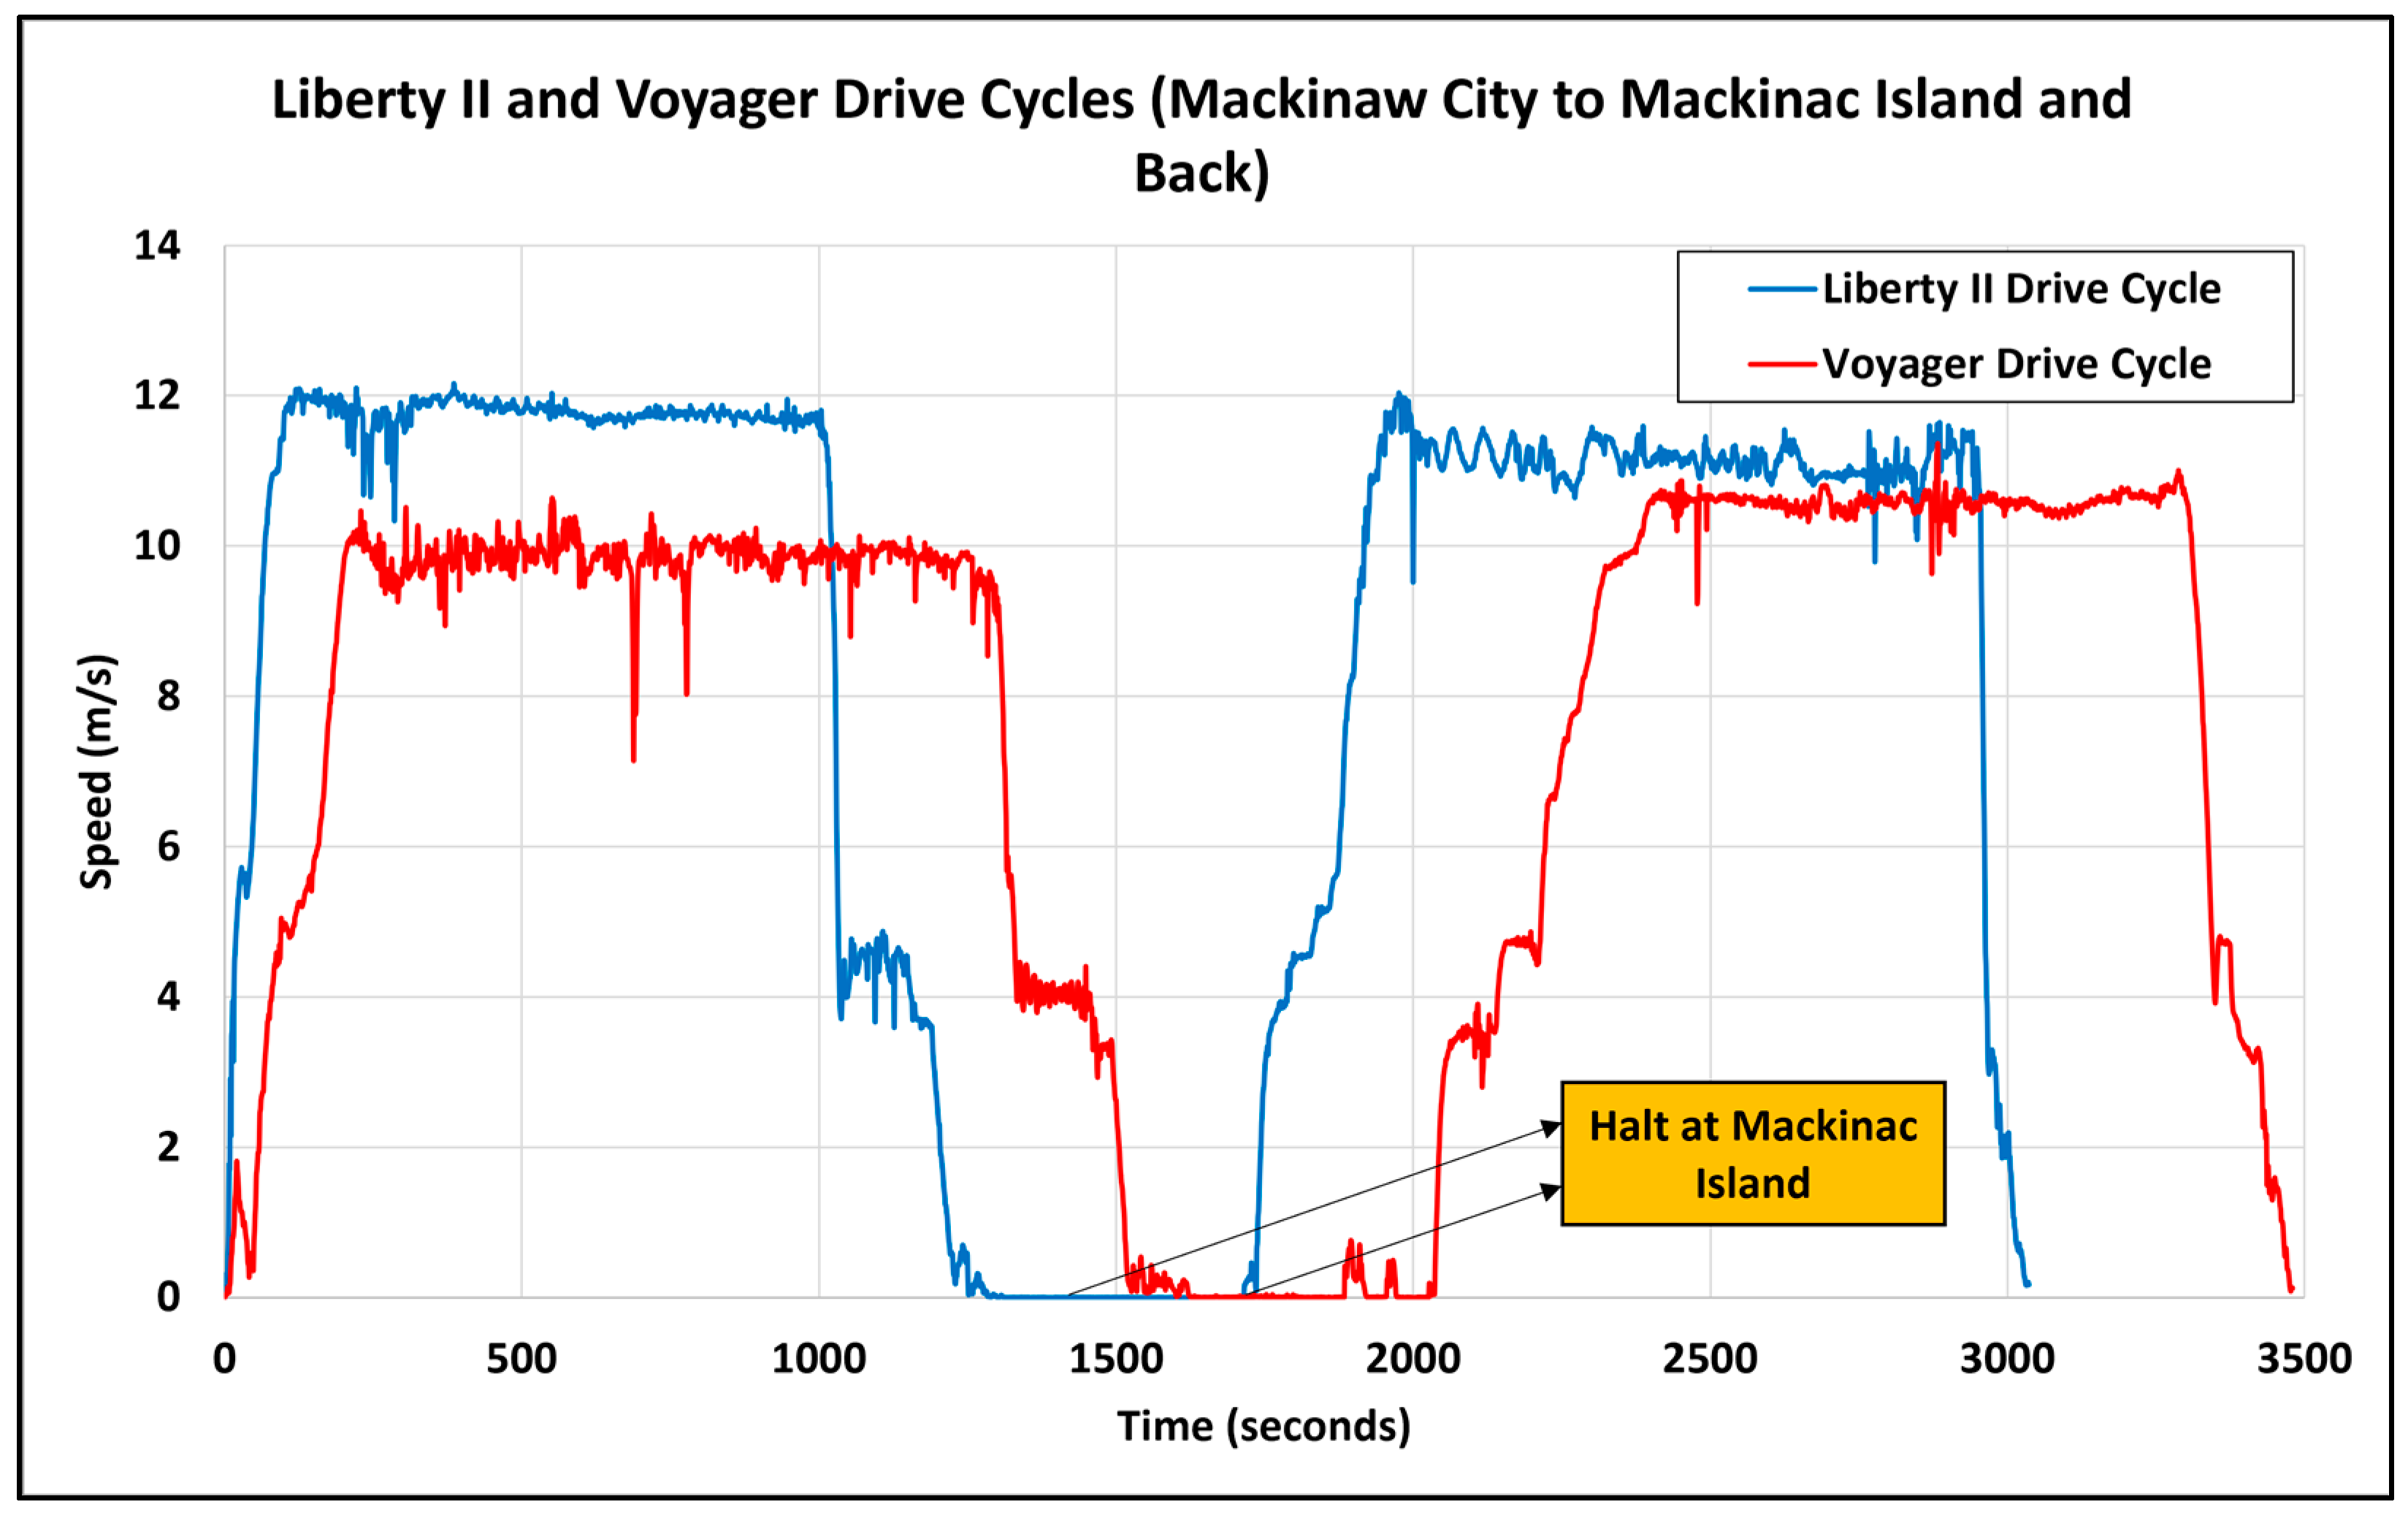
  • For the majority of the drive cycle, the ferry cruises at around 12 m/s (26.8 mph or 23.3 knots).
  • A total of 90% of the trip’s fuel consumption happens during the cruise portion.
  • The ferry is quick to accelerate from 0 speed to cruising speed (approximately 2 min when leaving from Mackinaw City and 4 min when leaving from Mackinac Island).
  • The ferry company uses a ‘turn n’ burn’ approach, where docking time is consistently 6 to 8 min. This approach helps them reduce the wait times for passengers at the dock.
  • Based on the data collected from the drive cycle of the Liberty II, the fuel consumption was calculated to be 320 L (84.6 gallons) per round trip to and from the island. This included fuel used by the two propulsion engines as well as the hydro-jet engine. The ferry is fueled once at the end of each day and does not require refueling in the middle of operations.
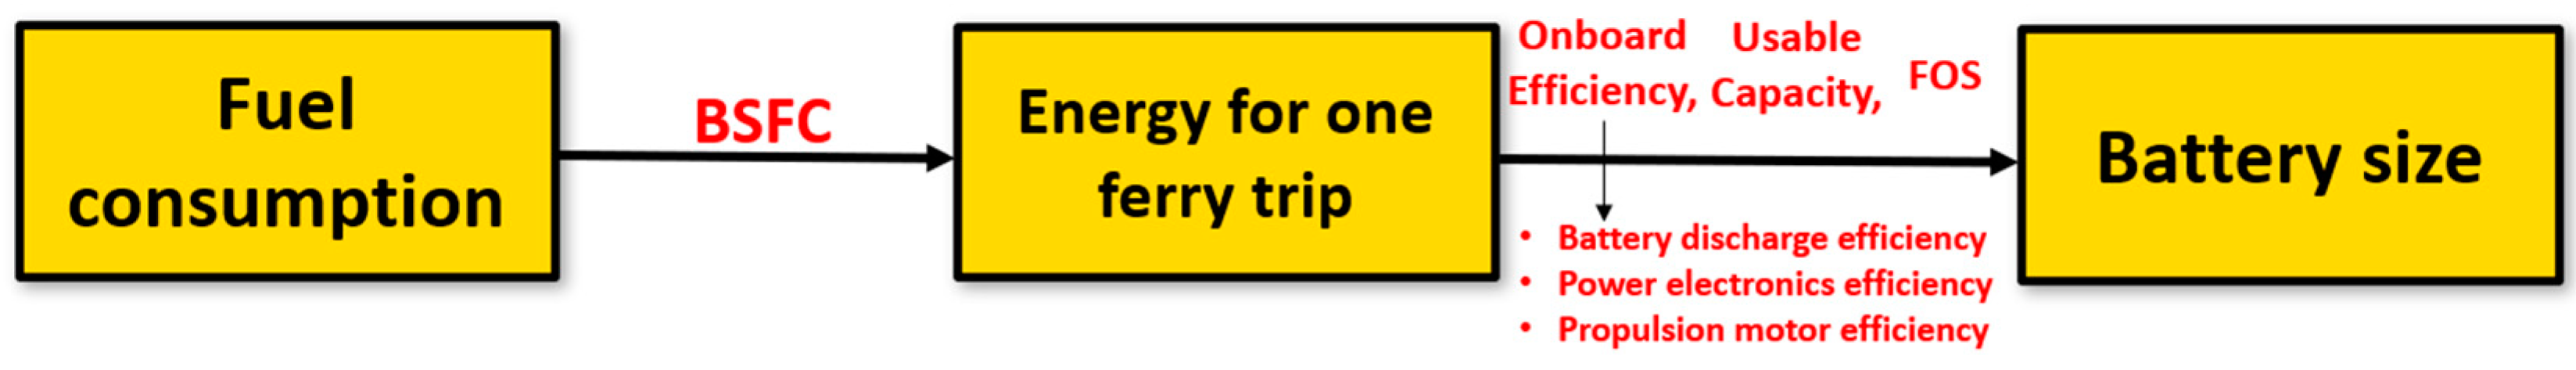
3.1. Battery Sizing

Based on the fuel consumption, the lower heating value (LHV) of the off-road diesel fuel, and the brake specific fuel consumption (BSFC) of the propulsion engines, the total energy requirement of the ferry for one trip was calculated to be 1642 kWh. Interstate Power Systems provided the BSFC curve for the engine which was used with the drive cycle data (engine speed and relative load) to estimate a cruising BSFC of 205 g/kW-h. The Brake Thermal Efficiency of the engine at that operating condition is approximately 41%.
The BSFC data of the hydro-jet engine were unavailable. An assumption was made about the hydro-jet engine having similar efficiency numbers as the propulsion engines, as it was run at a similar speed and load condition. A schematic of the process of battery sizing is shown in Figure 7.
Based on the energy requirement deduced from the drive cycles, an aggressive factor of safety (FOS) of 1.2, a battery depth of discharge (DoD) of 80%, and onboard efficiencies, the battery required for a BEV ferry was sized to 2379 kWh. The parameters used in the energy calculation and battery sizing are included in Table 2. The battery was sized based on Equation (1).
B a t t e r y   S i z e = F u e l   C o n s u m p t i o n   p e r   T r i p   ×   D e n s i t y   o f   F u e l   ×   L H V   o f   F u e l E n g i n e   B r a k e   T h e r m a l   E f f i c i e n c y O n b o a r d   E f f i c i e n c y   ×   D e p t h   o f   D i s c h a r g e × F O S
where
Onboard Efficiency = (Battery discharge efficiency × Power electronics efficiency × Propulsion motor efficiency)
An 80% DoD indicates that the battery is charged from 10% to 90% of its full capacity. This is performed in order to extend the life of the battery. Additional details regarding the selection of the DoD are provided in Section 4.1.
The factor of safety as used here is intended to provide sufficient onboard energy to ensure the vessel can make 1 round trip on a fully charged battery. The FOS accounts for such variations as the impacts of wind, waves, and cargo mass on resistance; delays in docking due to backed up vessel traffic; delays in departing the dock due to loading/unloading complications; routing deviations; variation in hotel loads including cabin HVAC; and potential impacts of cold weather on battery efficiency (the vessels run until ice begins forming on the lake). The authors felt the assumed 20% FOS is likely to be too aggressive for comfort (part of which being range anxiety) in a mass adoption scenario. However, it is acceptable for a proof of concept as is considered here. In this case, a larger battery size impacts the passenger carrying capacity of the ferry because the increased weight reduces the total number of passengers allowed on a trip.

3.2. Motor Sizing

The sizing of motors for the BEV configuration was based on the criteria that the electric ferry would have to traverse the drive cycle shown in Figure 4 at the same speeds as the Liberty II shown in Figure 5. Thus, electric propulsion motors with similar speed/torque characteristics to the MTU 16V2000 M70 engines would be required. At its maximum cruising speed, the ferry demands a torque of 11,500 Nm at 950 RPM from each of the two propellers.
The availability of the required motors was confirmed through meetings with Interstate Power Systems and ABB. The cost and weight of the motors was used for further analysis.

4. Results

The results are divided into three subsections, based on the goals of the project mentioned in Section 2. The first subsection will deal with the feasibility of retrofitting the Voyager into a BEV, the second will look at the environmental impact of the two scenarios by comparing the emissions for the IC engine and electric configurations, and the third will estimate the difference in revenue for the ferry company for the two configurations over five years.

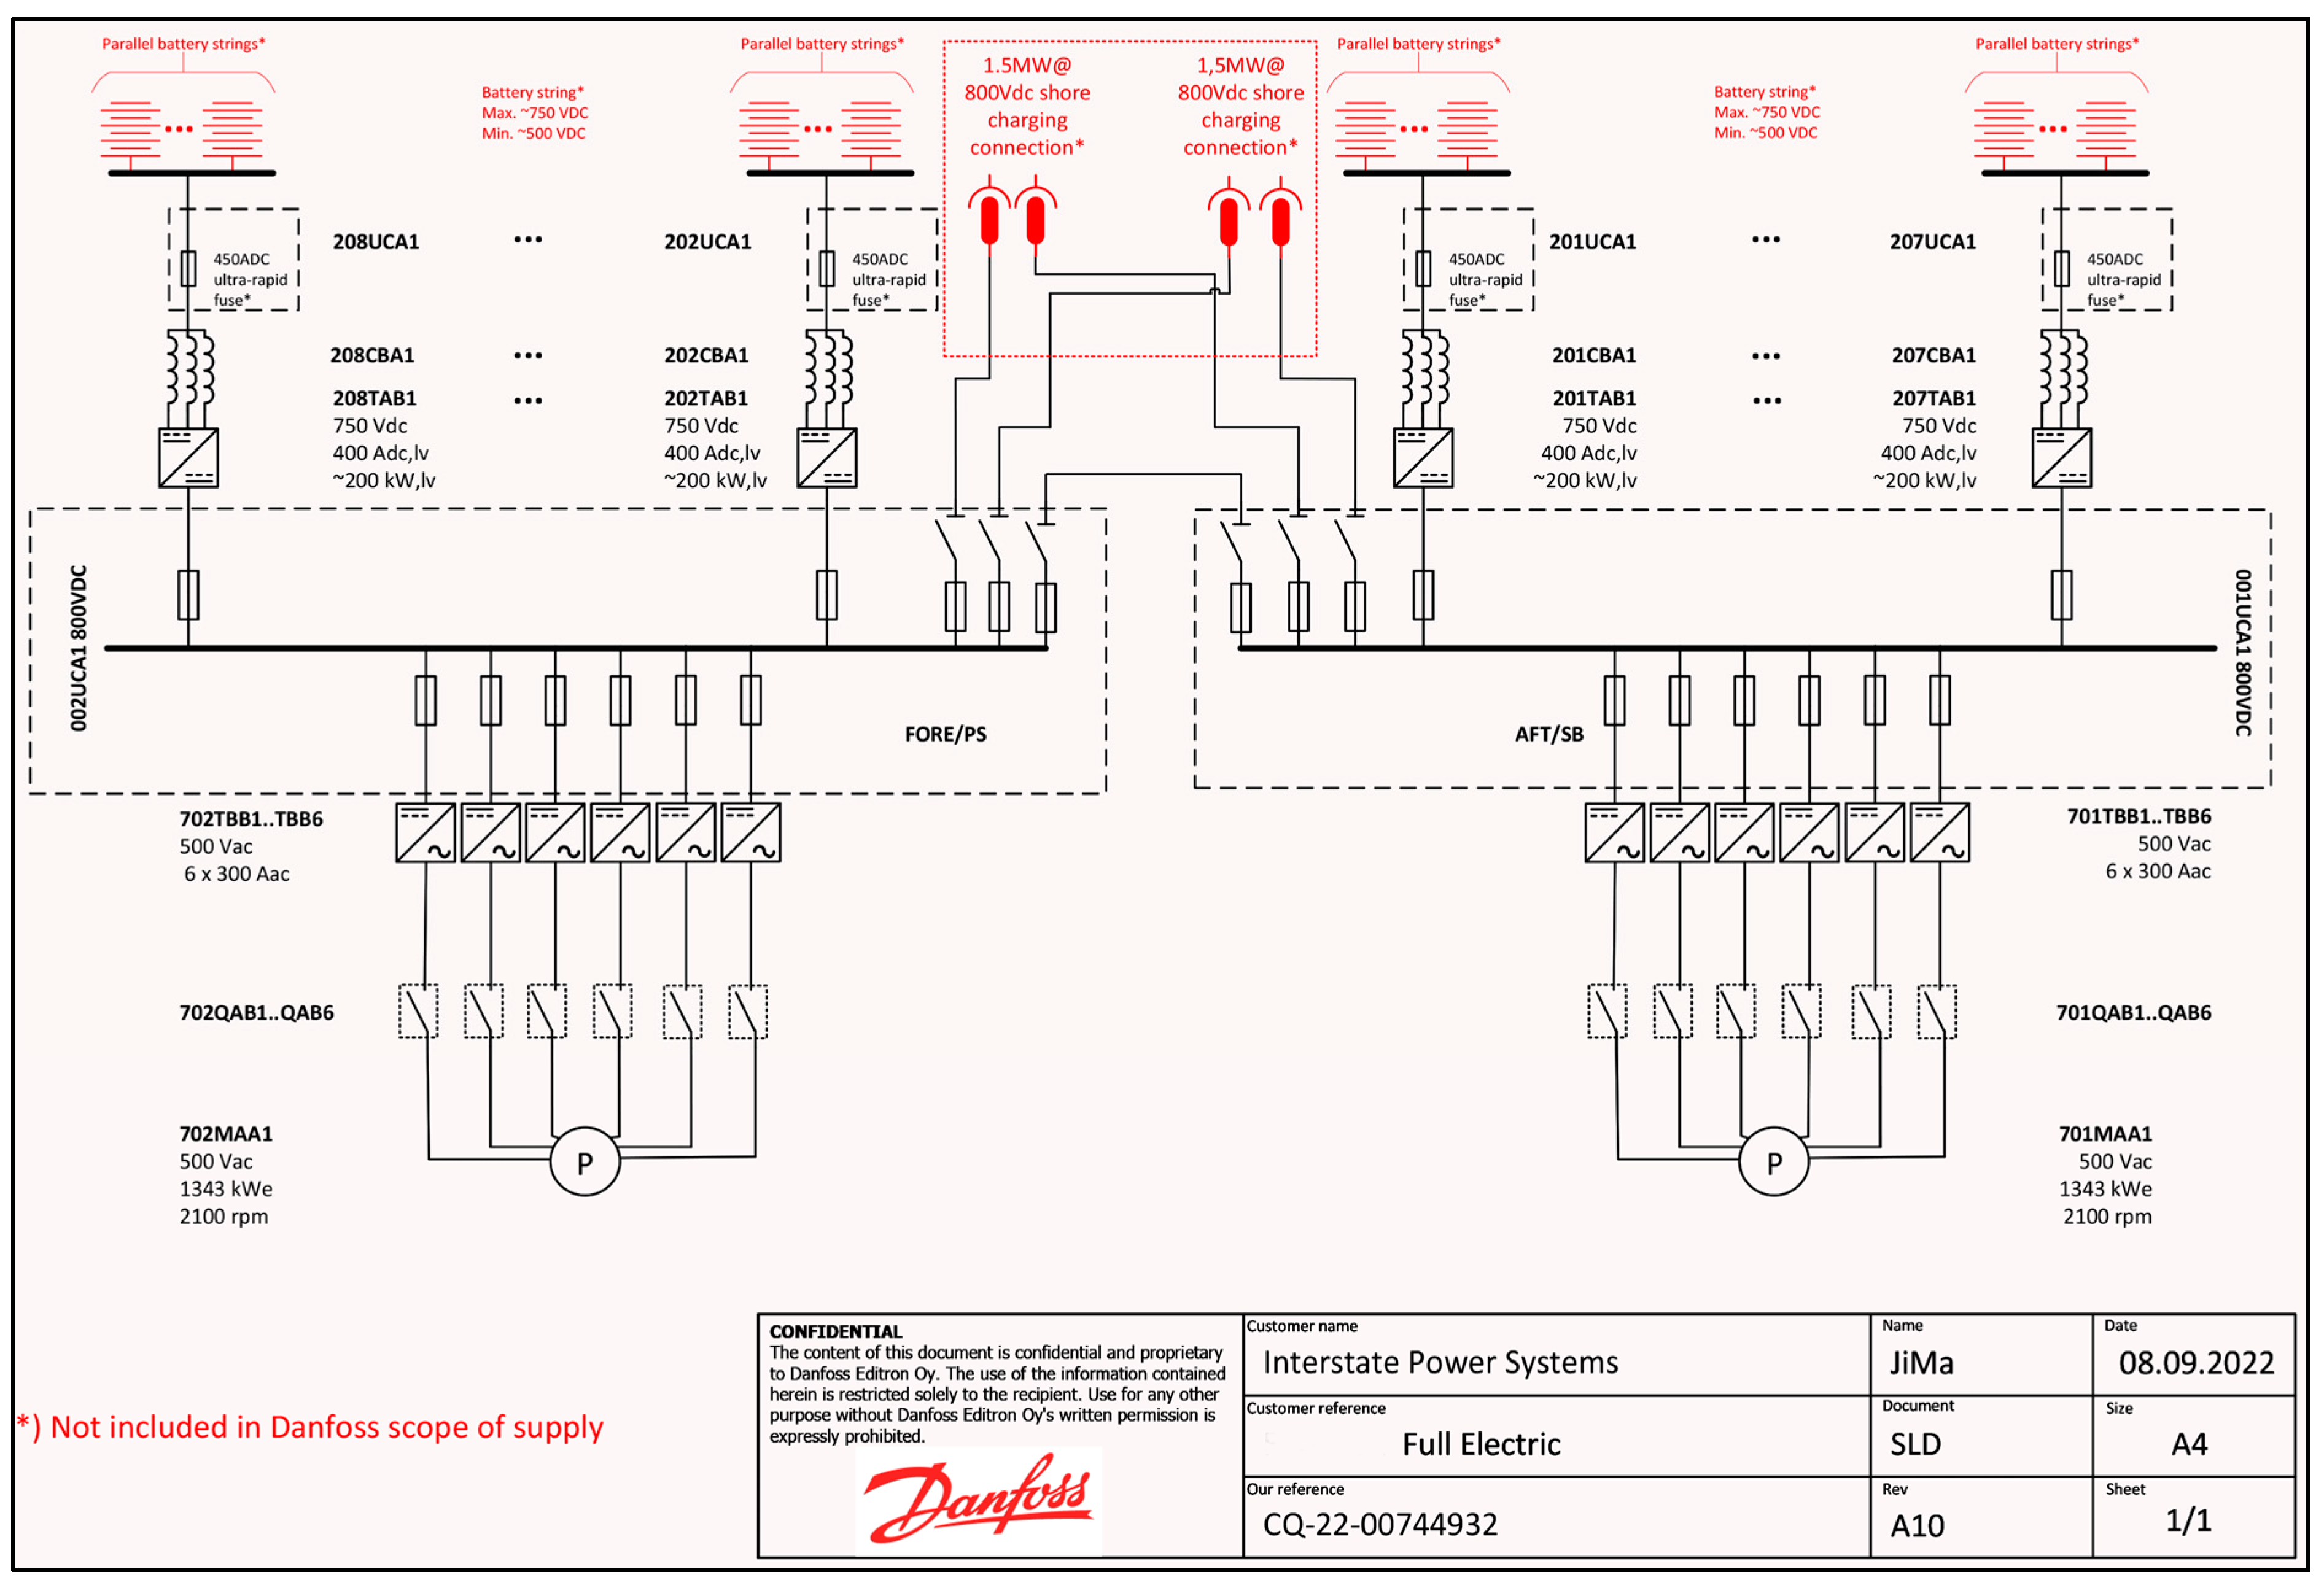
4.1. Technological Readiness and Feasibility of Retrofit

In the previous section, the battery size required for an electric ferry was estimated at 2379 kWh. APS LABS had multiple meetings with Spear Power Systems, a company specializing in maritime batteries. Spear Power Systems confirmed that the required battery would not be available off the shelf but could be custom manufactured for the ferry. The proposed battery chemistry was NMC. The 80% DoD used in the analysis was decided such that the battery would last for 1400 trips (one season) to and from the island (1400 charge–discharge cycles). Reducing the depth of discharge would unnecessarily increase the battery mass, battery cost, and the CO2 emissions from battery manufacturing.
Based on the propulsion power of the engines in the Liberty II, Interstate Power Systems obtained a single-line diagram (SLD) of a fully electric Voyager from Danfoss using commercially available technology. The SLD of the Voyager has been included in Appendix A with permission from Danfoss.
For charging with a 1C rate, a charging capacity of 2.4 MW will be necessary and will fully charge the battery in 48 min (for an 80% DoD), so that the BEV ferry can complete one round trip every two hours. The required charge time is based on Equation (2).
B a t t e r y   C h a r g e   T i m e = D e p t h   o f   D i s c h a r g e C r a t e
Although bad for battery life, charging can be completed in less time with higher C rates. Commercially available EVSE in this power level is not yet mainstream, but it is available. The mainland ports operated by the ferry company today would need significant infrastructure upgrades as there is very minimal infrastructure required to sell tickets and muster passengers. However, these levels of power are frequently found at large factories and other industrial facilities, so the transformers, switchgear, cabling, etc., are available. Verifying zoning (for example, current ports are not in industrial zones), easements, proximity to substation, etc., was outside the scope of this study.
The overarching conclusion in terms of the feasibility of retrofitting an existing ferry into a BEV was that the technology required for retrofitting the Voyager into a fully electric ferry exists and is available for purchase.

4.2. Environmental Impact

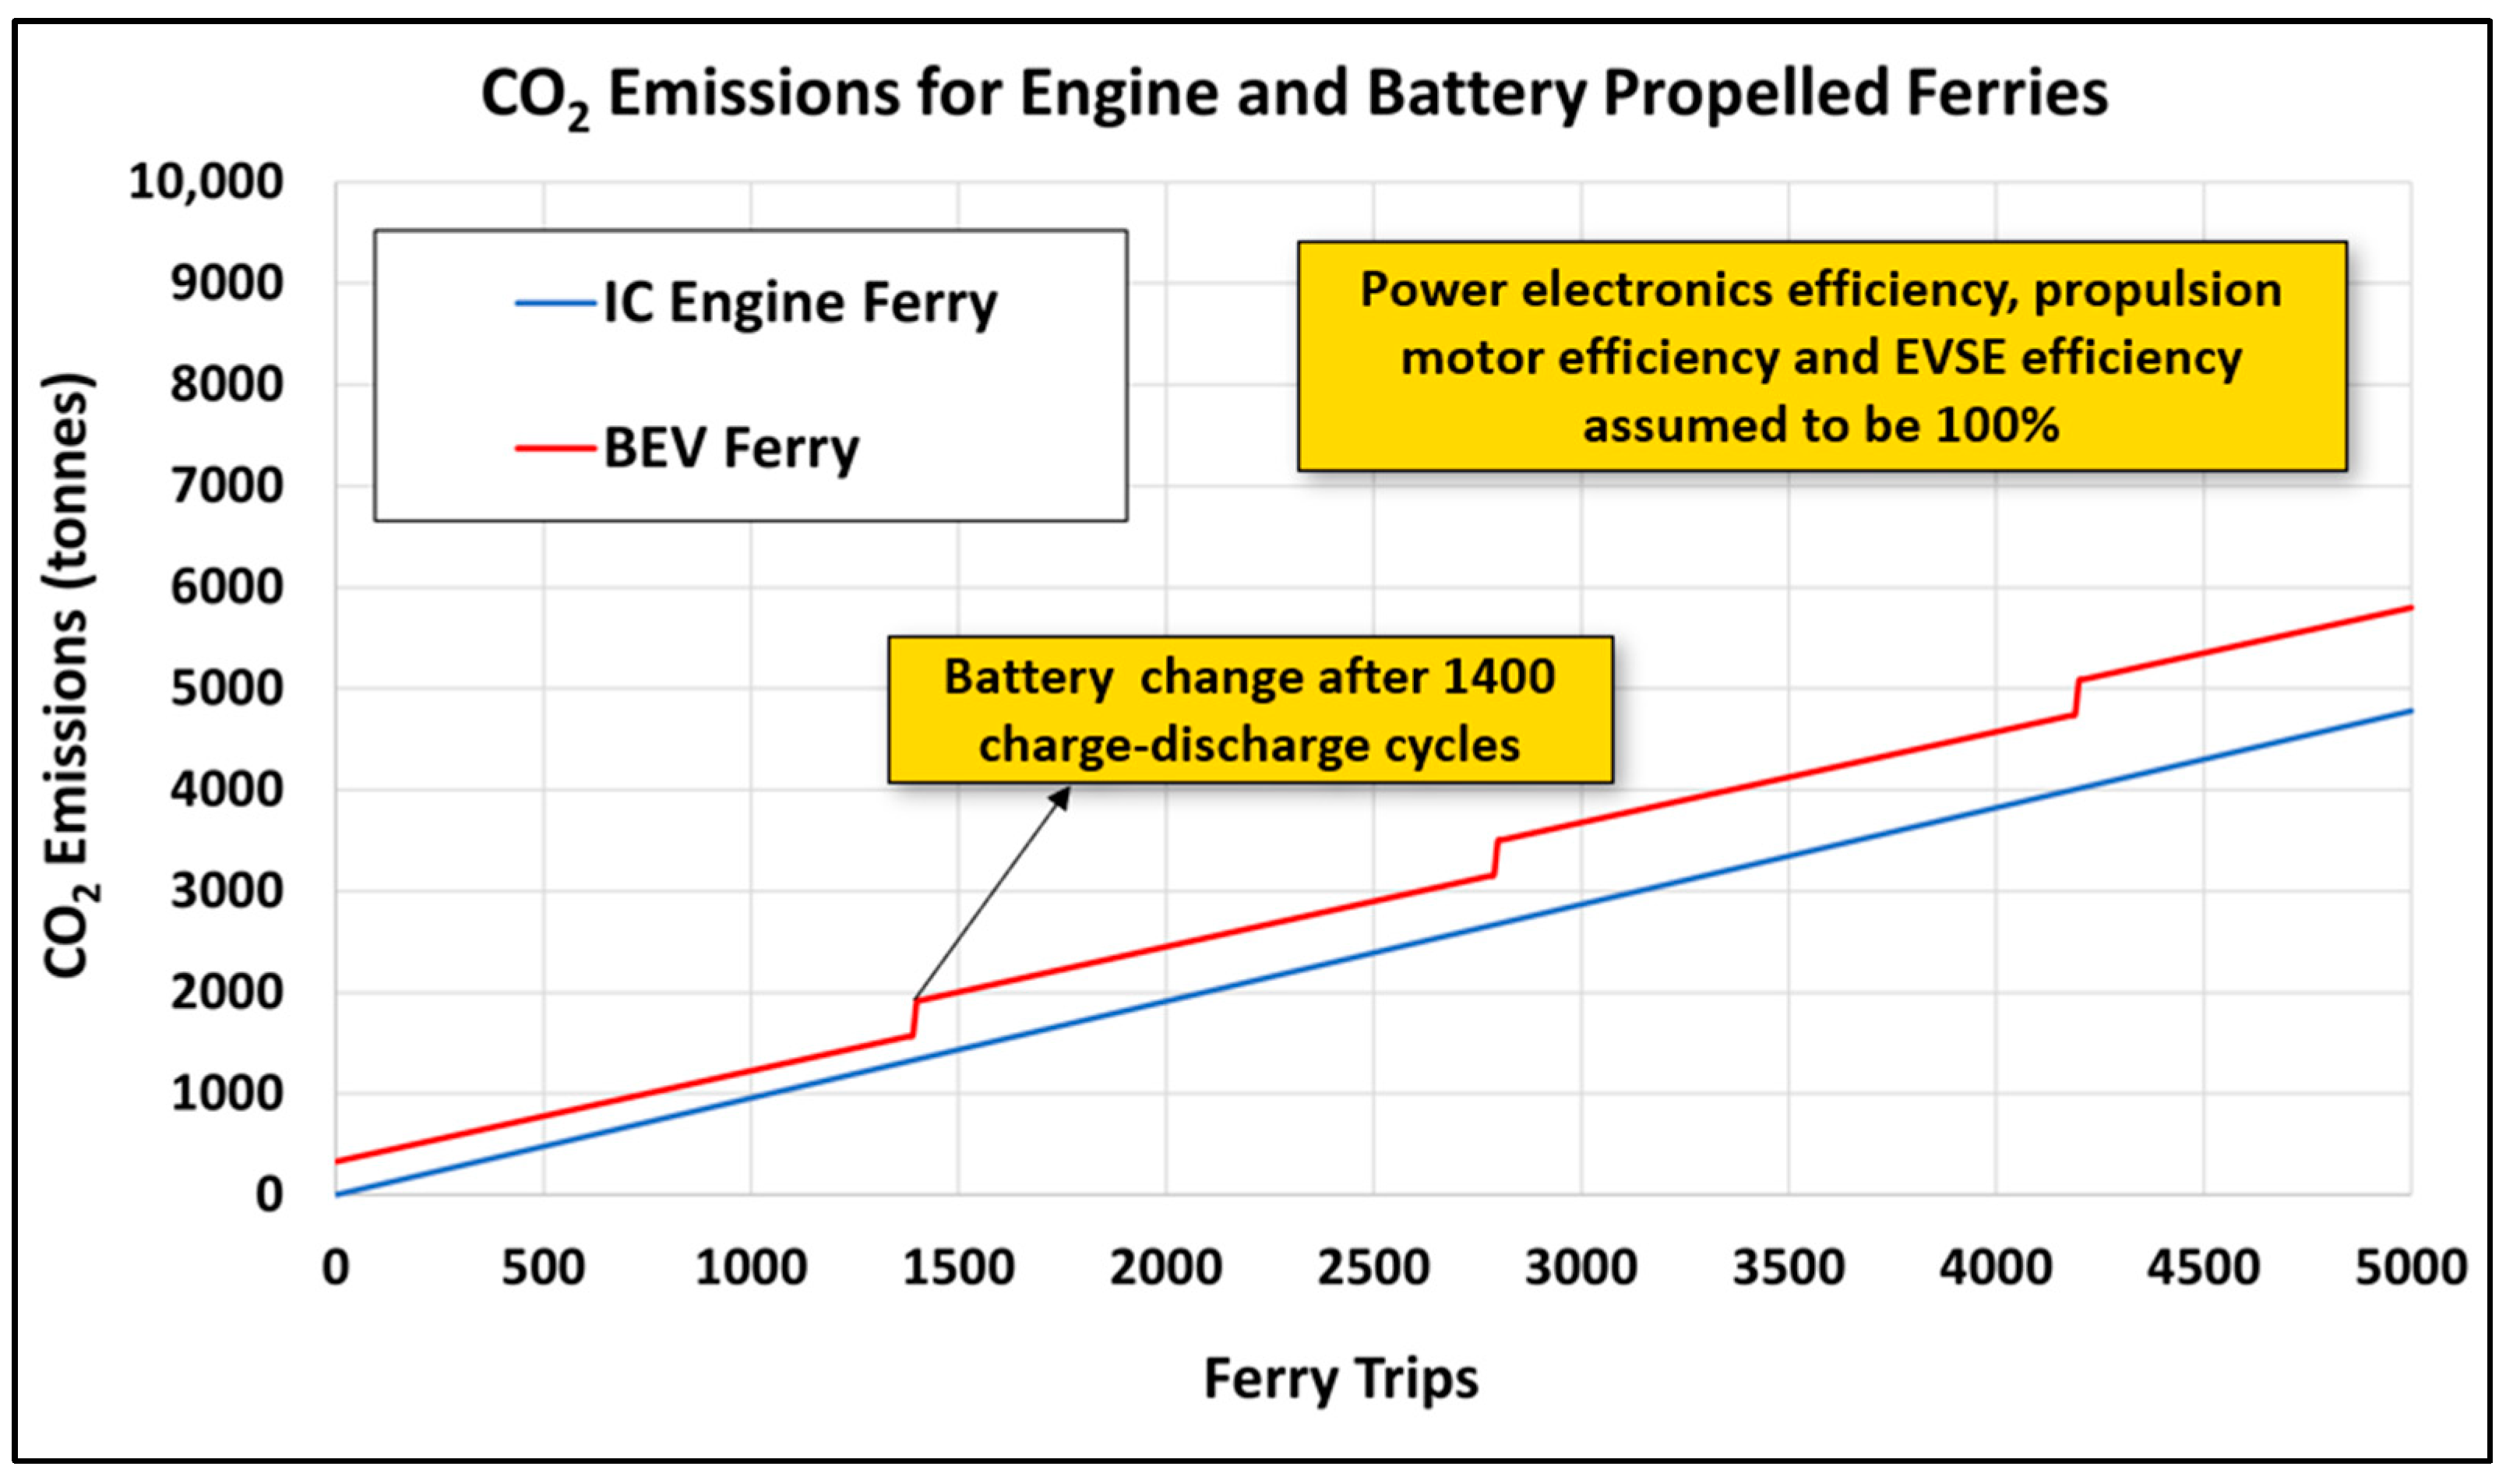
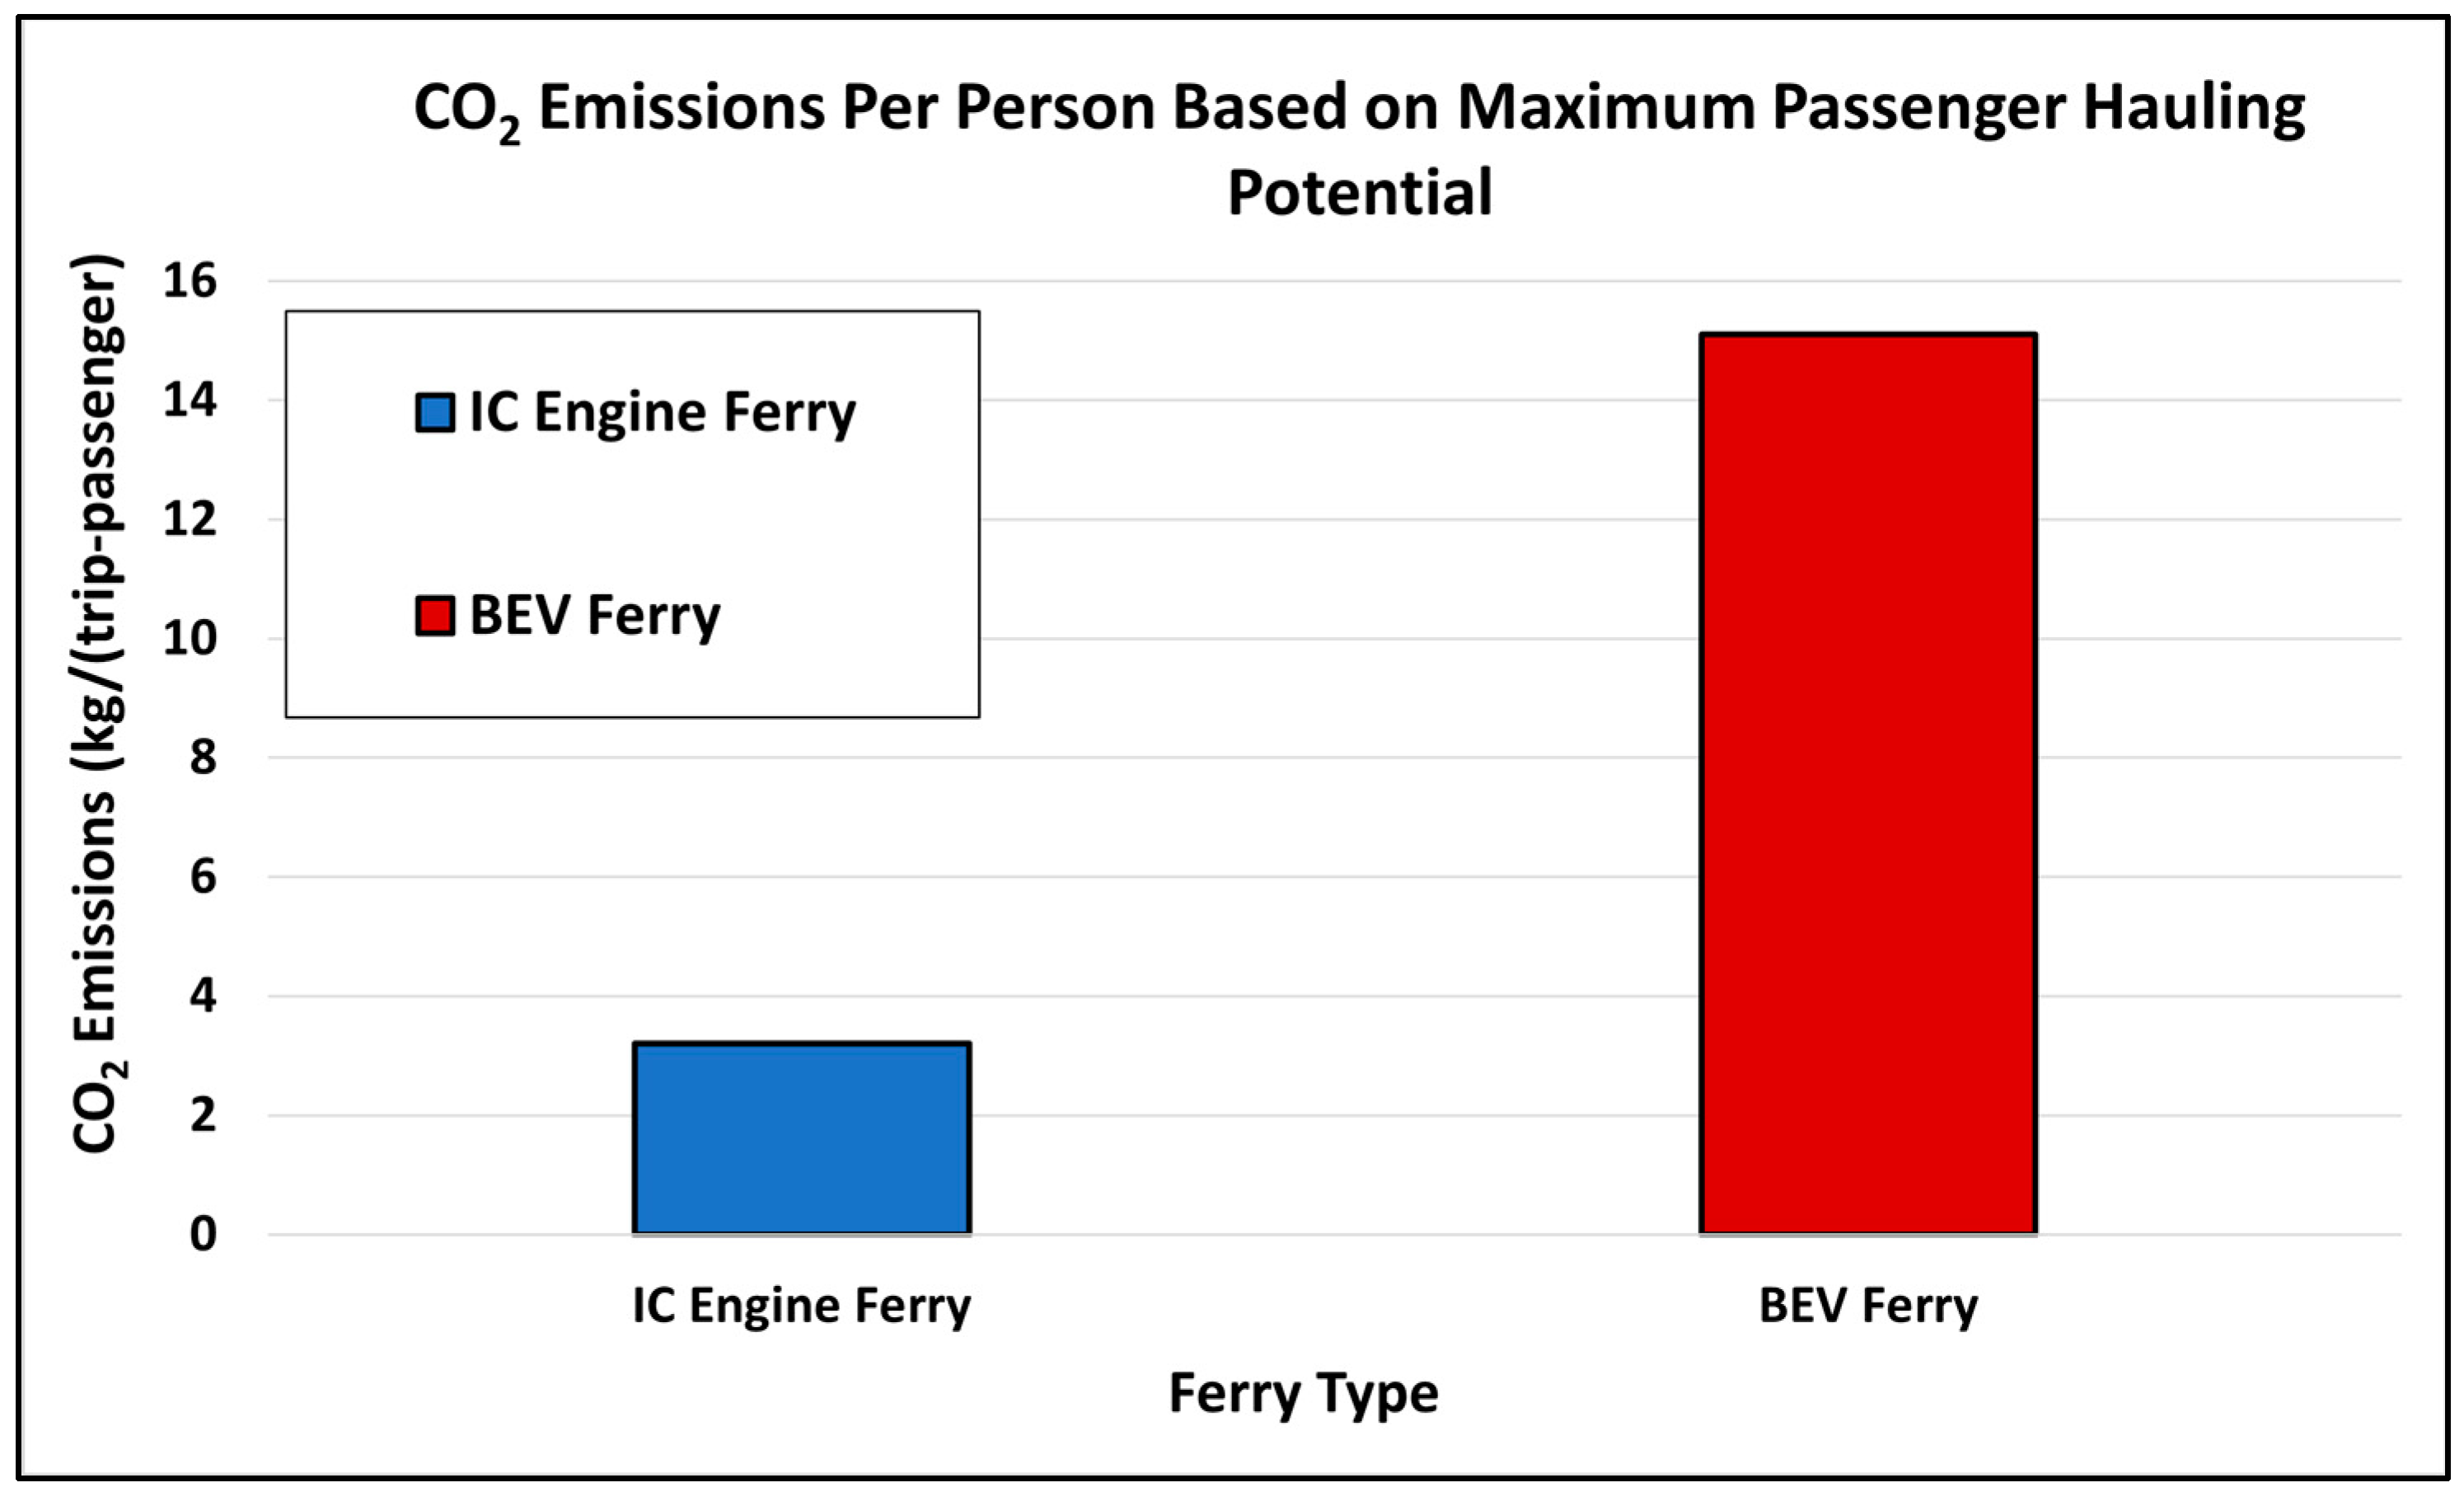
4.2.1. Carbon Dioxide (CO2) Emissions

The major reason behind the push for electrification is the reduction in GHG emissions. As shown in Figure 1, for a country like Norway that generates a majority of its electricity from renewable sources of energy, electrification is a viable means of reducing carbon emissions. However, in a country like the United States, where a majority of the electricity is generated using fossil fuels, a comprehensive analysis is necessary to derive concrete conclusions.
To compare emissions for the IC engine ferry and the fully electric ferry, the emissions at the source for each of the configurations need to be considered. The following factors have been taken into account:
  • IC Engine Ferry
    Emissions from the combustion of fuel in the engine [13].
    Emissions from the extraction of the crude oil, the refining process, and the transportation of the finished product (well-to-tank emissions) [14].
  • Electric Ferry
    Emissions from the burning of fuel at the power plants (coal and natural gas power plants) using the energy mix in the geographical region that the ferry is operated [13].
    Emissions from extraction of the fuels used in the power plants (well-to-tank emissions) [14].
    Emissions in the extraction of the materials used in the manufacturing of the Lithium-ion battery [14,15].
    Emissions in the manufacturing of the Lithium-ion battery [14,15].
In both the ICE and BEV scenarios, CO2 emissions from the manufacture of the engines, motors, and inverters were intentionally not considered primarily because the carbon intensity of these components are all similar enough to cancel each other out.
A schematic of the emission considerations for the two configurations is shown in Figure 8.
Throughout the literature on life-cycle assessment (LCA) of Li-ion batteries, a wide range of CO2-equivalent kg/kWh values for batteries have been reported. Mining the raw materials and assembling a Li-ion battery is an energy intensive process, and the amount of CO2-eq emissions depends on the location where the battery is assembled. For this study, the 162 kg CO2-eq per kWh value used was an average of the numbers reported by a study by the Ford Motor Company [15] and those available in GREET 2020 [14].
The exact values used in the GHG emissions are provided in the table in Appendix B.
The total electricity required to fully charge the battery (2176 kWh) was calculated based on the battery size and the charging efficiency for a C-rate of 1C, which was provided by Spear Power Systems. The energy required to fully charge the battery was calculated using Equation (3).
B a t t e r y   C h a r g i n g   E n e r g y = T o t a l   B a t t e r y   C a p a c i t y   ×   D e p t h   o f   D i s c h a r g e E V S E   E f f .   ×   O n b o a r d   E f f .   ×   C h a r g i n g   E f f .
The EIA estimates the average electricity transmission losses across the United States at 5% [16]. Using the transmission efficiency and overall thermal efficiency of natural gas and coal power plants [17] and the distribution of electricity generation in Michigan shown in Table 1, the total CO2 emissions per ferry trip were calculated. The CO2 emissions per trip for both ferry configurations are stated below:
(1)
IC Engine Ferry—955 kg CO2 per ferry trip to and from Mackinac Island.
(2)
Fully Electric Ferry—1103 kg CO2 per ferry trip to and from Mackinac Island.
The estimated CO2 emissions for the two ferry configurations as a function of the number of ferry trips are shown in Figure 9. (The emissions in the manufacturing of Li-ion batteries are CO2-eq emissions, whereas emissions from all other sources used in the analysis are CO2 emissions.) When comparing the emissions for an IC engine ferry with a fully electric ferry running from Mackinaw City to Mackinac Island, the BEV ferry has higher emissions on a per trip basis. The reason for this is the mix of energy generation in Michigan, which includes carbon-based fuels, primarily natural gas and coal. The energy generation for the BEV takes place a long way away from the ferry, and by the time it is used to propel the ferry, it has undergone multiple losses, which compound the CO2 emissions. In the case of the IC engine ferry, the combustion occurs on the ferry itself and the energy is put to use for propulsion right away. Over 5000 ferry trips, which is approximately 3.5 seasons, the BEV configuration will have 48% higher CO2 emissions than the IC engine configuration.
There is an offset for the CO2 emissions of the BEV ferry at 0 ferry trips. This represents the emissions created during battery manufacturing. After every 1400 trips, there are vertical increases in the BEV ferry emissions to represent an end-of-life replacement of the Li-ion battery. In one season, a ferry makes approximately 1400 round trips to the island, which is what the battery has been designed for. In meetings with Spear Power Systems, the depth of discharge (usable capacity) was decided such that the battery would not require changing for an entire season. If the battery life is lower than a season, the ferry company will have to take the ferry out of commission for battery replacement. A longer lasting battery will increase battery weight, which will further reduce passenger capacity, and it would not be possible to make a 2-year-life battery due to the size and mass of the required battery. Hence, a 1-year-life battery was chosen. Emissions associated with battery removal and recycling/reuse were not included in this analysis.
Figure 10 shows the emissions for the two configurations but only considers the in-use operation of the ferry. In this scenario, the well-to-tank emissions and the emissions in battery manufacturing have not been included. The CO2 emissions only from the operation of the ferry for the two configurations are stated below:
(1)
IC Engine Ferry—811 kg CO2 per ferry trip to and from Mackinac Island.
(2)
Fully Electric Ferry—1057 kg CO2 per ferry trip to and from Mackinac Island.
It is interesting to note that even when excluding battery manufacturing, the BEV ferry shows higher CO2 emissions as compared to the IC engine ferry. The CO2 emissions from the energy used to propel the BEV ferry are 30% higher than those of the IC engine ferry for the same number of trips. The reason for this is that the majority of the fuel consumed in the ICE vessel (90%) is consumed under cruising conditions when the engine is operating quite efficiently (~41%), which results in a net carbon production rate lower than is possible when charging the BEV ferry in this region of the country.

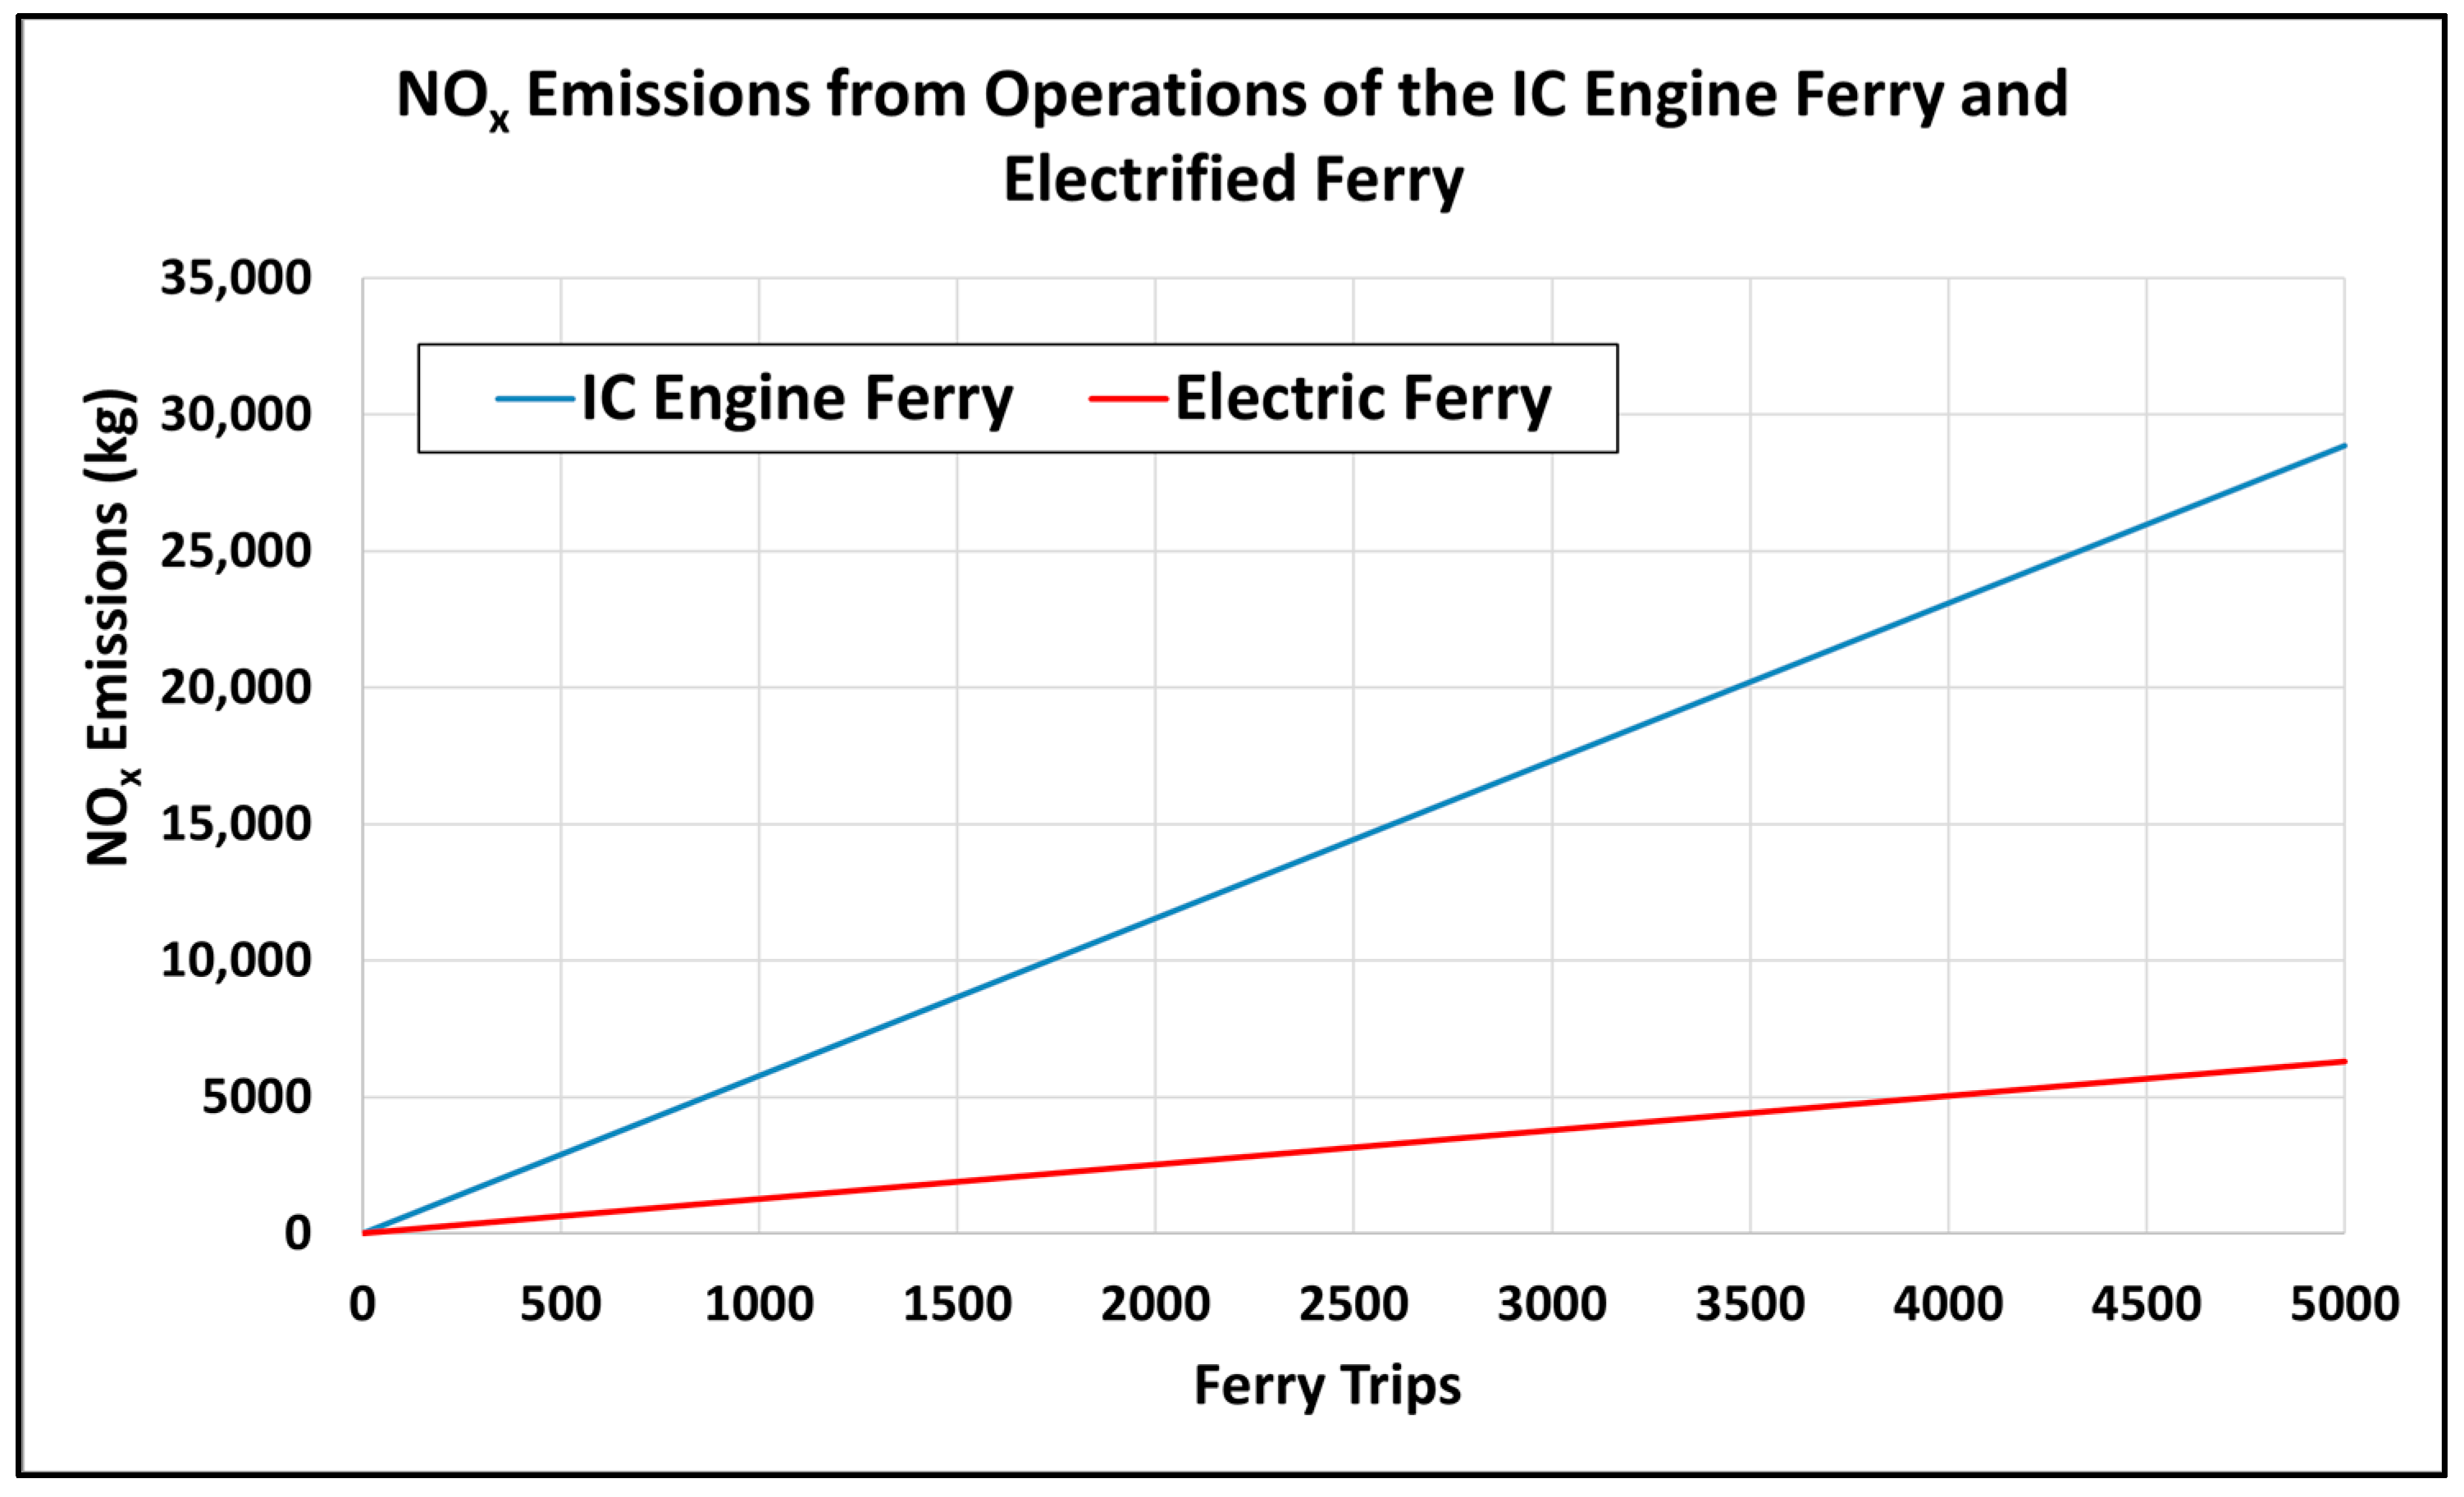
4.2.2. Nitrogen Oxides (NOx) and Sulphur Dioxide (SO2) Emissions

The method applied to calculate CO2 emissions was also used for calculating NOx and SO2 emissions. For the IC engine ferry, NOx and SO2 emissions were chosen based on Tier 4 standards for marine compression ignition engines [18,19]. Michigan power plant emission data for these two pollutants were available through the EIA [20]. The comparative results for NOx and SO2 emissions as a function of ferry trips have been shown in Figure 11 and Figure 12, respectively. (It should be noted that the emission levels for NOx and SO2 were taken based on the tier 4 regulation limits for CI marine engines. The actual emissions for the engines may not be as high, as manufacturers need to develop engines to emit less than the regulatory limits to provide some FOS to ensure all engines are operating below the limit.).
The NOx emissions for the BEV ferry are lower than the IC engine ferry by approximately 78%.
The SO2 emissions are higher for the BEV ferry, owing to ultra-low-sulfur diesel (ULSD) used in the IC engine ferry. The most recent regulations for marine diesel have sulfur limits at 15 ppm.

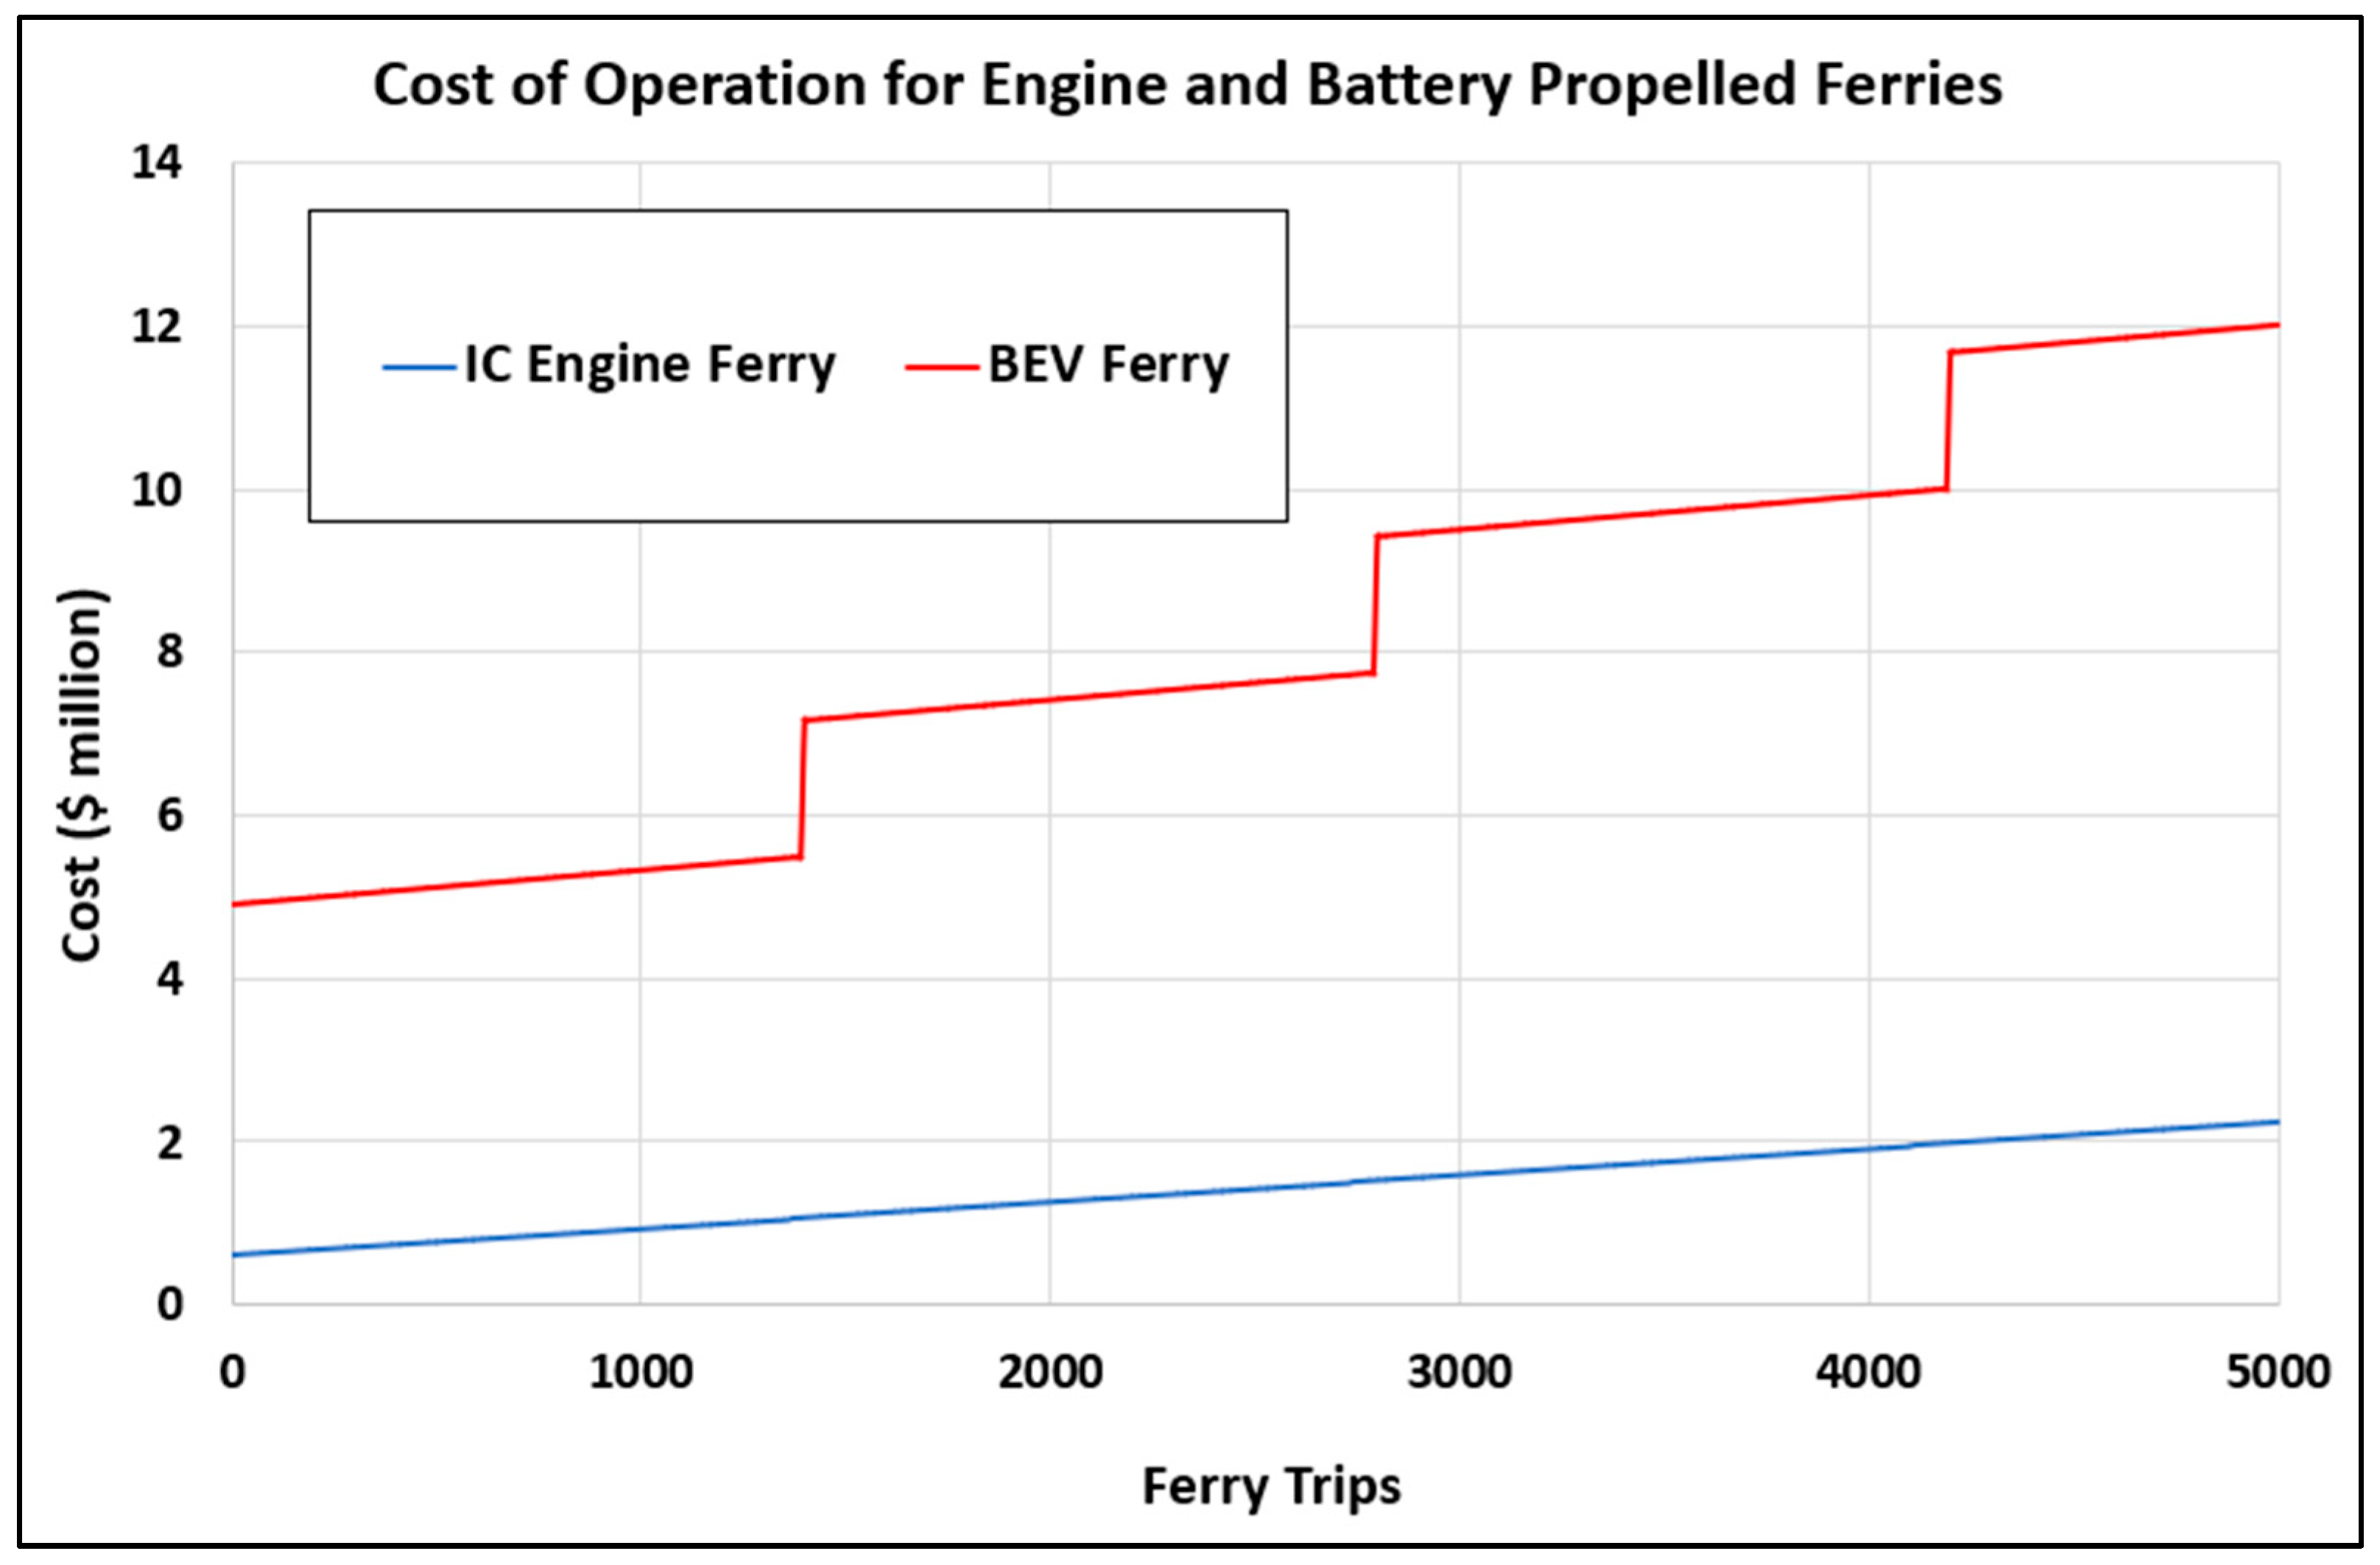
4.3. Economic Analysis

While conducting the economic analysis, the following costs were considered:
  • Initial capital—This includes the cost of engines for the IC engine ferry and cost of the battery, motors, power electronics, and charging infrastructure for the BEV ferry.
  • Running costs—Running costs include cost of fuel and electricity. For the IC engine ferry, it includes yearly engine maintenance and oil changes. For the BEV ferry, it includes regular battery changes.
Multiple sources were contacted to obtain reasonable estimates of all the components involved in getting the two configurations (upgrading to new engines vs. retrofitting to BEV) fully commissioned. The detailed costs are shown in Appendix C in Table A2 and Table A3. With the estimated battery size, the approximate cost of a battery for the fully electric Voyager is USD 1.66 million. The cost is this high as the battery is not an off-the-shelf part and will need to be specifically made for the Voyager.
The comparison in operating costs is shown in Figure 13. The cost of operation of the BEV ferry is significantly higher as compared to the IC engine ferry. Even though the cost of diesel used per trip (approx. USD 317) is higher than the cost of electricity per trip (approx. USD 237), the additional costs of the initial infrastructure, demand charges due to the high-power charging, and regular battery changes increase the overall operating costs of the electrified ferry significantly. The vertical step changes that are shown for the BEV ferry correspond to annual battery changes. The IC engine cost analysis does include annual maintenance (oil changes, fuel filters, air filters, oil filters, valve and injection system adjustments, etc.); however, these costs are in the thousands of dollars and are nearly undetectable with the y-axis resolution shown in Figure 13.
Figure 13 shows costs only. When accounting for potential revenue, it is important to include the effect of the change in passengers the ferry can carry. Although a battery is available with enough energy capacity, it will be heavy enough to cause significant changes in the vessel’s stability and passenger capacity because of the energy density of the Li-ion battery as compared to diesel. The APS LABS met with the United States Coast Guard (USCG). The USCG estimates that a detailed study will be required on the stability of the ferry, and experimental validation could be necessary to determine the exact allowable maximum passenger count of the BEV ferry. However, as this level of analytical and experimental study is far outside the scope of this project, the USCG agreed that for this feasibility study, an assumption that the passenger capacity (by weight) will decrease linearly with an increase in battery weight is appropriate.
Figure 14 shows the reduction in passenger capacity with increase in battery mass. The mass of an adult was taken as 84 kg (184.8 pounds), based on the report by the U.S Department of Health and Human Services [21]. The graph is made with the assumption that the ferry’s dead weight remains the same. The mass of components removed and added has been considered, the details of which can be found in Appendix C in Table A4.
The current maximum capacity of the Voyager is 330 passengers. As the battery mass increases, the passenger capacity decreases and goes to zero for a battery mass of approximately 30,000 kg. Based on the detailed conversations with Spear Power Systems, the mass of the battery required based on current technology will be close to 23,500 kg. This is with a battery gravimetric density of 0.101 kWh/kg, which is the number for Spear Power Systems’ current battery ‘Trident Versa’, and includes all auxiliary systems as well the hardware required to hold the battery in place. With the current technology, the maximum passenger capacity of the Voyager will be reduced to 73 passengers.
The reduction in maximum passenger capacity will affect the BEV vessels revenue generation. The ferry runs from April to October, with peak season lasting from May to August. From conversations with the ferry company, the authors were able to gauge that even during peak season, the ferries are only occasionally full to maximum capacity. The exact data for the number of travelers were not available to the APS LABS, so an estimate was made for the average travelers on weekdays and weekends for every month of the season based on the few days of data made available by ferry company. The data are shown in Table 3. The number of passengers in the fully electric ferry were adjusted based on battery mass and the reduction in maximum passenger capacity. Based on the numbers in Table 3 and the price of ferrying a passenger to and from the island, a highly simplified prediction of the profits for the two configurations was made for a period of five years. The profile comparison is shown in Figure 15 (IC engine economic analysis in Figure 15a and BEV economic analysis in Figure 15b). In 2022, the cost of a ticket to and from the island was USD 34 (discussions with the prominent Mackinac Island ferry company).
Over a 5-year period, the IC engine-powered ferry rebuilt with new engines will have a much higher profit potential than the BEV ferry. The BEV ferry has significantly higher initial and running costs, as shown in Figure 15b (annual battery replacement costs shown in Figure 13 are amortized throughout the year in Figure 15), but the revenue of the BEV ferry also suffers due to reduced passenger capacity. Based on the approximate travelers to the island shown in Table 3, the BEV ferry has a revenue 23.5% lower than the IC engine ferry. The combined effect of higher operating costs and lower revenue culminates in the BEV ferry being more economically challenging than its IC engine counterpart.
It should be noted that the availability of government grants for electrification projects has not been considered in the economic analysis. The reason for this is that money from grants is not always a given. However, if available, it will ease the financial burden of the capital investment required for the electrification of the ferry.

5. Discussion

The current analysis regarding the potential electrification of the Voyager, a ferry operating between Mackinaw City and Mackinac Island, points to the fact that full electrification is not the most sustainable solution based on the currently available technology. Retrofitting the ferry into a BEV may not be beneficial from an environmental nor from an economic standpoint. Furthermore, the increase in CO2 emissions per trip and reduction in maximum passenger capacity per trip will increase the CO2 emissions per passenger per trip by almost five times, as shown in Figure 16. There may be other carbon ramifications if the number of passengers going to the island is to be held constant. For example, additional ferry trips (either on BEV ferries or ICE ferries) will be required, thus leading to additional vessel maintenance and/or additional vessels needing to be manufactured, additional dock space needing to be constructed, etc.
While this work points out that retrofitting the Voyager into a BEV is not advantageous right now, that might not be the case in the future. Technological advancements in batteries and BEV infrastructure in general are likely to improve energy storage density, cost, and overall system efficiency. The Michigan electricity grid has been moving away from CO2 emissions, and likely will continue. However, this study does not account for improvements in engine efficiency or utilization of lower-carbon-intensity fuels. In fact, although the vessels operate the engines at high efficiency today, they do not operate at true minimum BSFC while cruising. Thus, with nothing more than some simple operational changes, the IC engine carbon intensity could be further reduced today. The ferry company that operates the Voyager repowers a vessel in their fleet every three years. The authors believe the analysis conducted for this study should be repeated every time a ferry is up for rebuilding, and electrification should be recommended when the environmental and economic numbers for a BEV ferry are better than those for an IC engine ferry.
As a thought experiment, the CO2 emissions for a similar comparison are shown in Figure 17 for a hypothetical case in which Mackinac Island exists in Norway (assuming that the 1% thermal power is from coal-fired power plants). The CO2 emissions for the BEV in this scenario are much lower than those for the IC engine ferry. The point of showing this is to bring light to the fact that turning to electrification for a reduction in GHG emissions requires a nuanced view, and a one-size-fits-all approach can be detrimental. What is beneficial in one scenario may not be a good solution in another one. A recent study [22] showed the suitability of 12 ferries in Norway for battery electric propulsion. A major factor in that is the renewable nature of Norway’s electric grid, as shown in Figure 1.
The Mackinac Island ferry covers a significant distance in one trip (25 km or 15.6 miles). The ferry also travels at a top speed of 26.8 mph, or 43.1 kmph. The losses incurred by a sea faring vessel increase exponentially with speed [23]. Because of these factors, the Mackinac Island ferry requires a lot of energy to complete one trip from the mainland to the island and back. This works against a BEV configuration, as a bigger battery is required because of the significantly lower energy density of a Lithium-ion battery as compared to diesel fuel. A bigger battery means more CO2 emissions in battery production. However, for a route where the distance is smaller and the ferry’s top speed is not as high, a BEV configuration could be more suited. This has been shown for a catamaran in Belgium [24] that traverses a distance of 350 m one way at a top speed of 18 kmph. The fully electric ferry produces only 25% CO2 emissions as compared to its diesel counterpart. It is, of course, helped by the fact that Belgium has a cleaner electric grid than the United States [25], with nuclear being the highest source of energy for electricity generation. But the short route and slower speed are key factors for making the electric catamaran viable.
Electrification is not the only path to lower emissions and more sustainable water-based transportation. Other methods such as using a supercapacitor [26] or fuel cells [27] as the main source of onboard energy in ferries have been successfully deployed. In future projects, these methods, along with a hybrid approach and alternative fuels (hydrogen, ammonia, natural gas, and alcohol-based fuels), should be taken into consideration as well to find the most sustainable solution for a particular scenario.

6. Conclusions

A feasibility analysis for electrification of the Mackinac Island Ferry was conducted with three major points in consideration:
  • Technological feasibility
  • Environmental impact
  • Economic analysis
  • Technological feasibility—It is possible to retrofit the current IC engine ferry into an electric ferry. The required components currently exist in the market. This assumes that the charging infrastructure required for the electrification of the ferry can be made available at the location.
  • Environmental impact
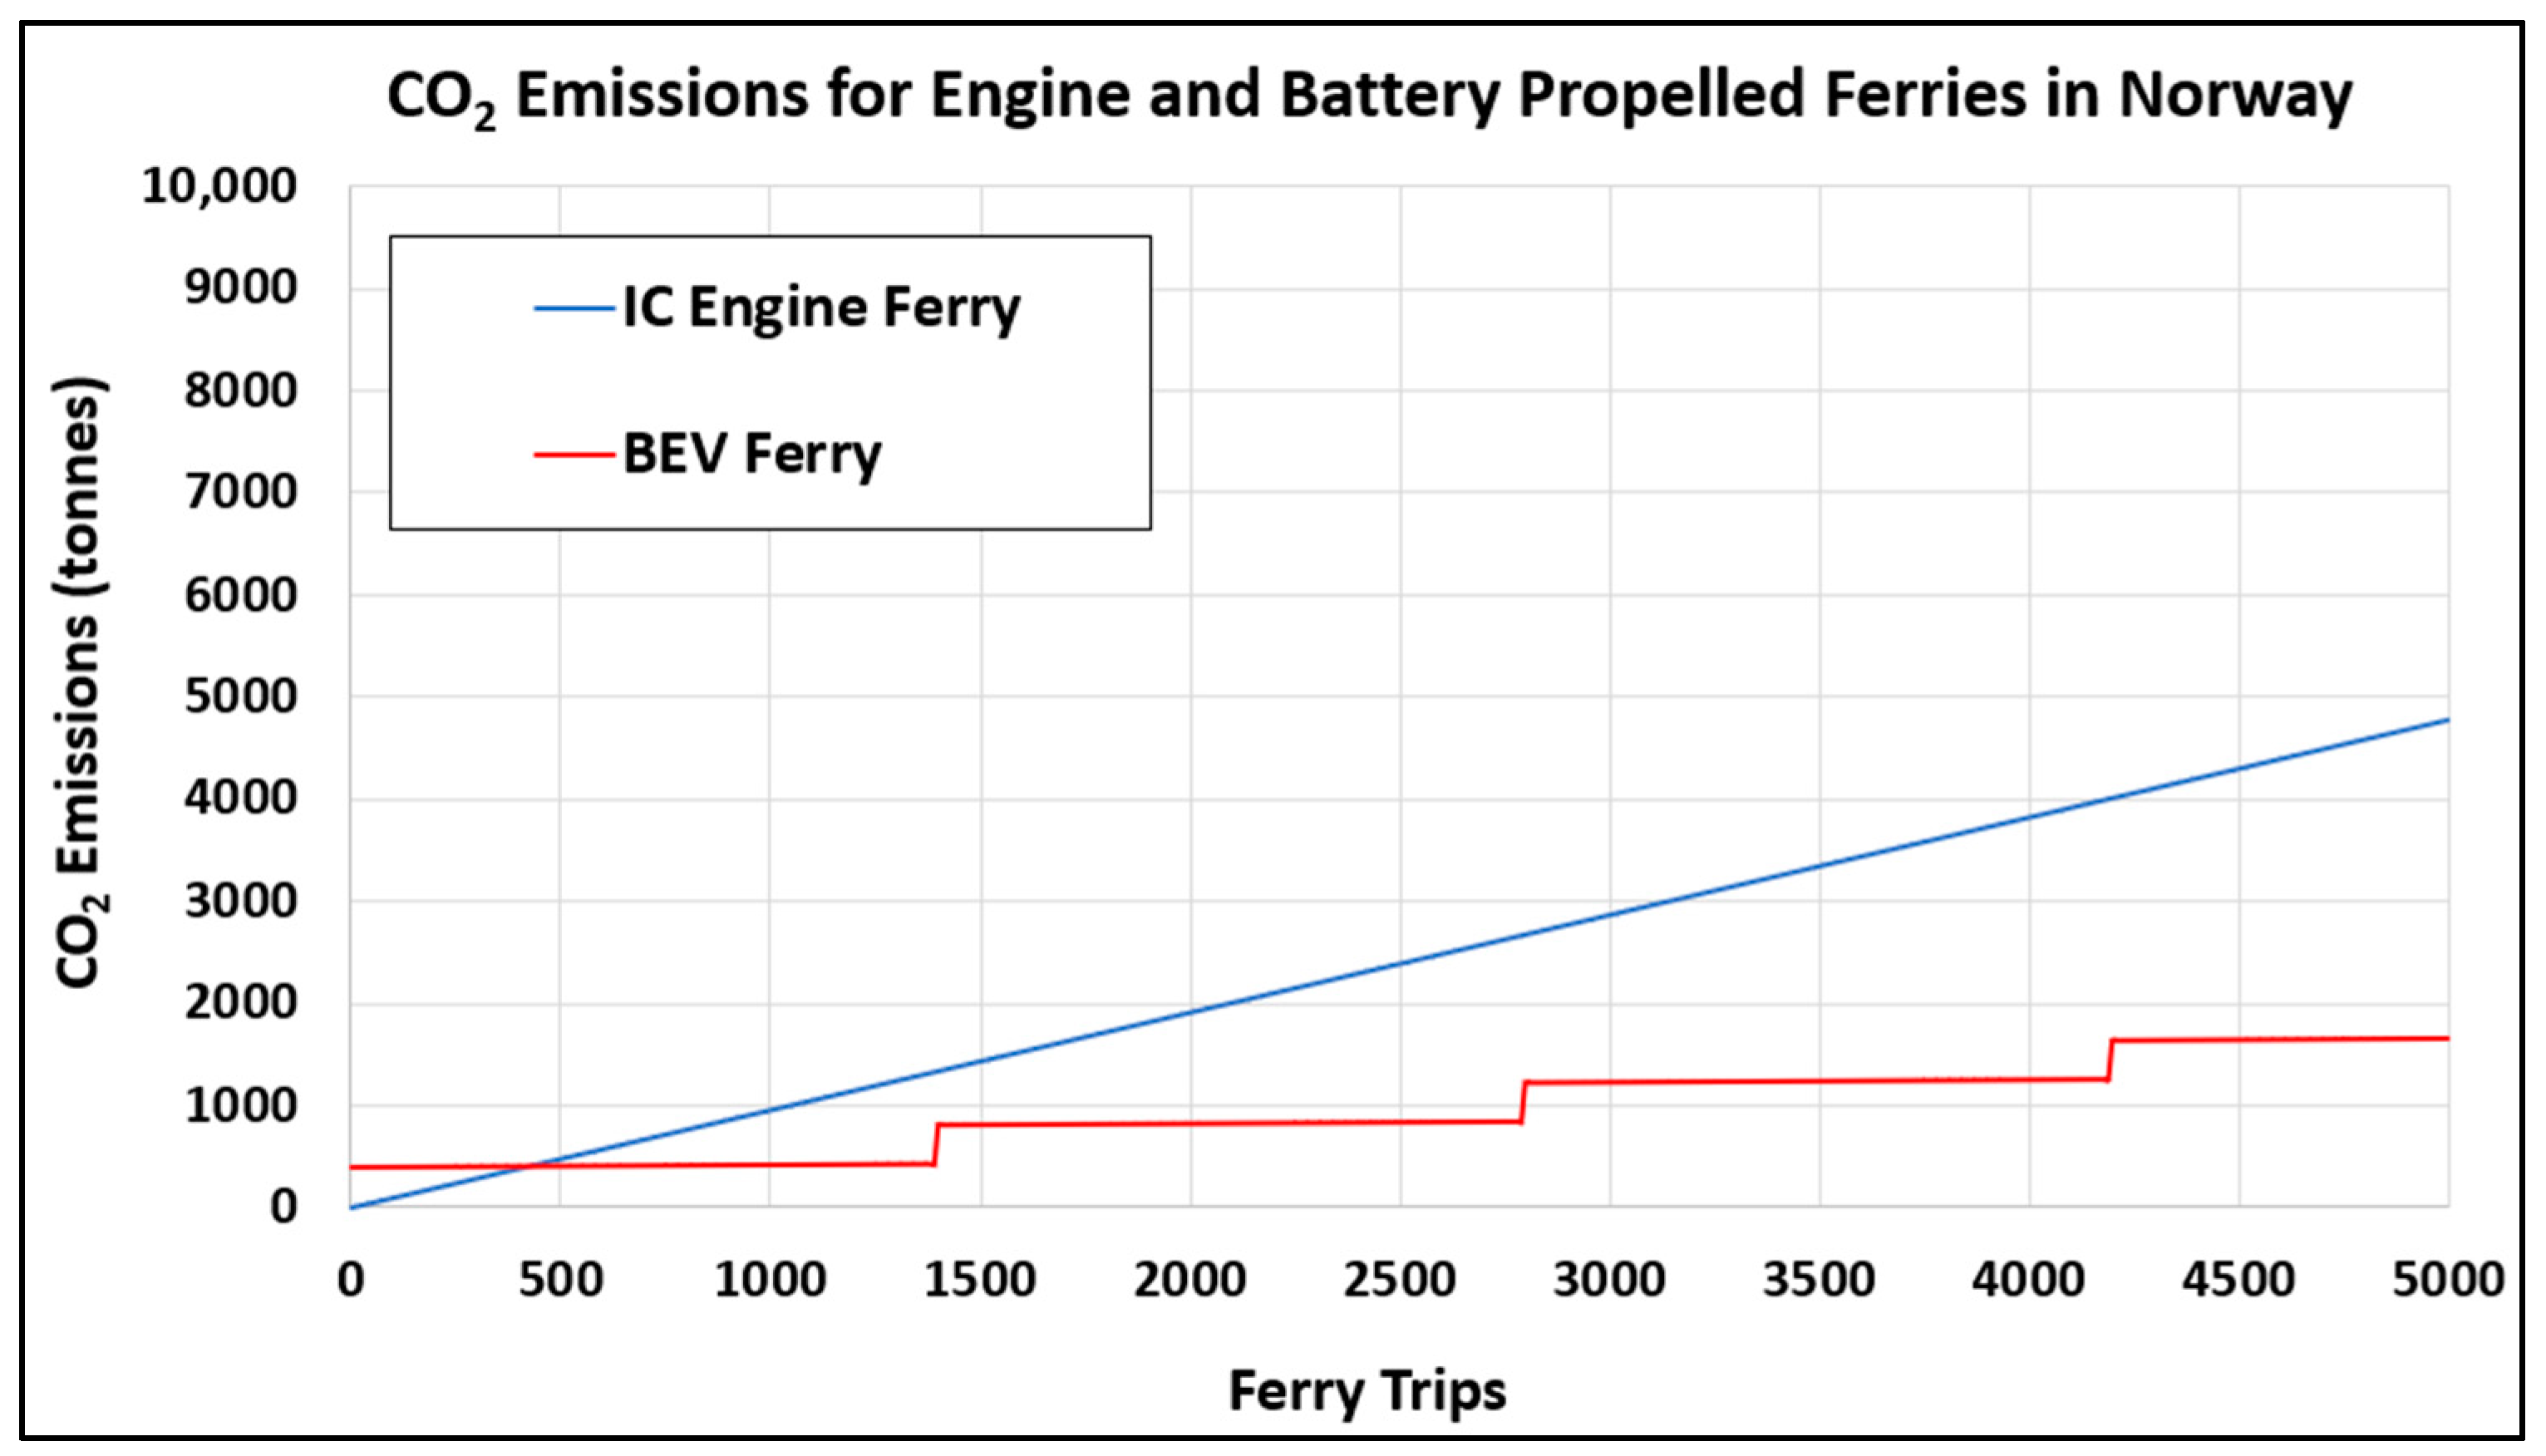
    Electrification will increase the CO2 emissions of the ferry, due to the mix of power generation in Michigan and the energy intensive Li-ion battery manufacturing process. Over 5000 ferry trips (3.5 seasons), the BEV ferry will have 48% higher CO2 emissions than the IC engine ferry.
    From a decarbonization perspective, full electrification of the ferry is not the most sustainable solution.
    There is an 80% reduction in NOx emissions with electrification but a significant rise in SO2 emissions.
    Recyclability/reusability of the spent Li-ion batteries were not within the scope of this project.
  • Economic analysis
    Based on a simplistic model and without the including the potential government grants, an electrified ferry is unlikely to be as profitable as an ICE-powered ferry due to increased costs of demand charge, regular changes to the Li-ion battery, initial infrastructure costs, and reduced passengers.
    The revenue from the BEV ferry will be 23.5% lower than that of the IC engine ferry.
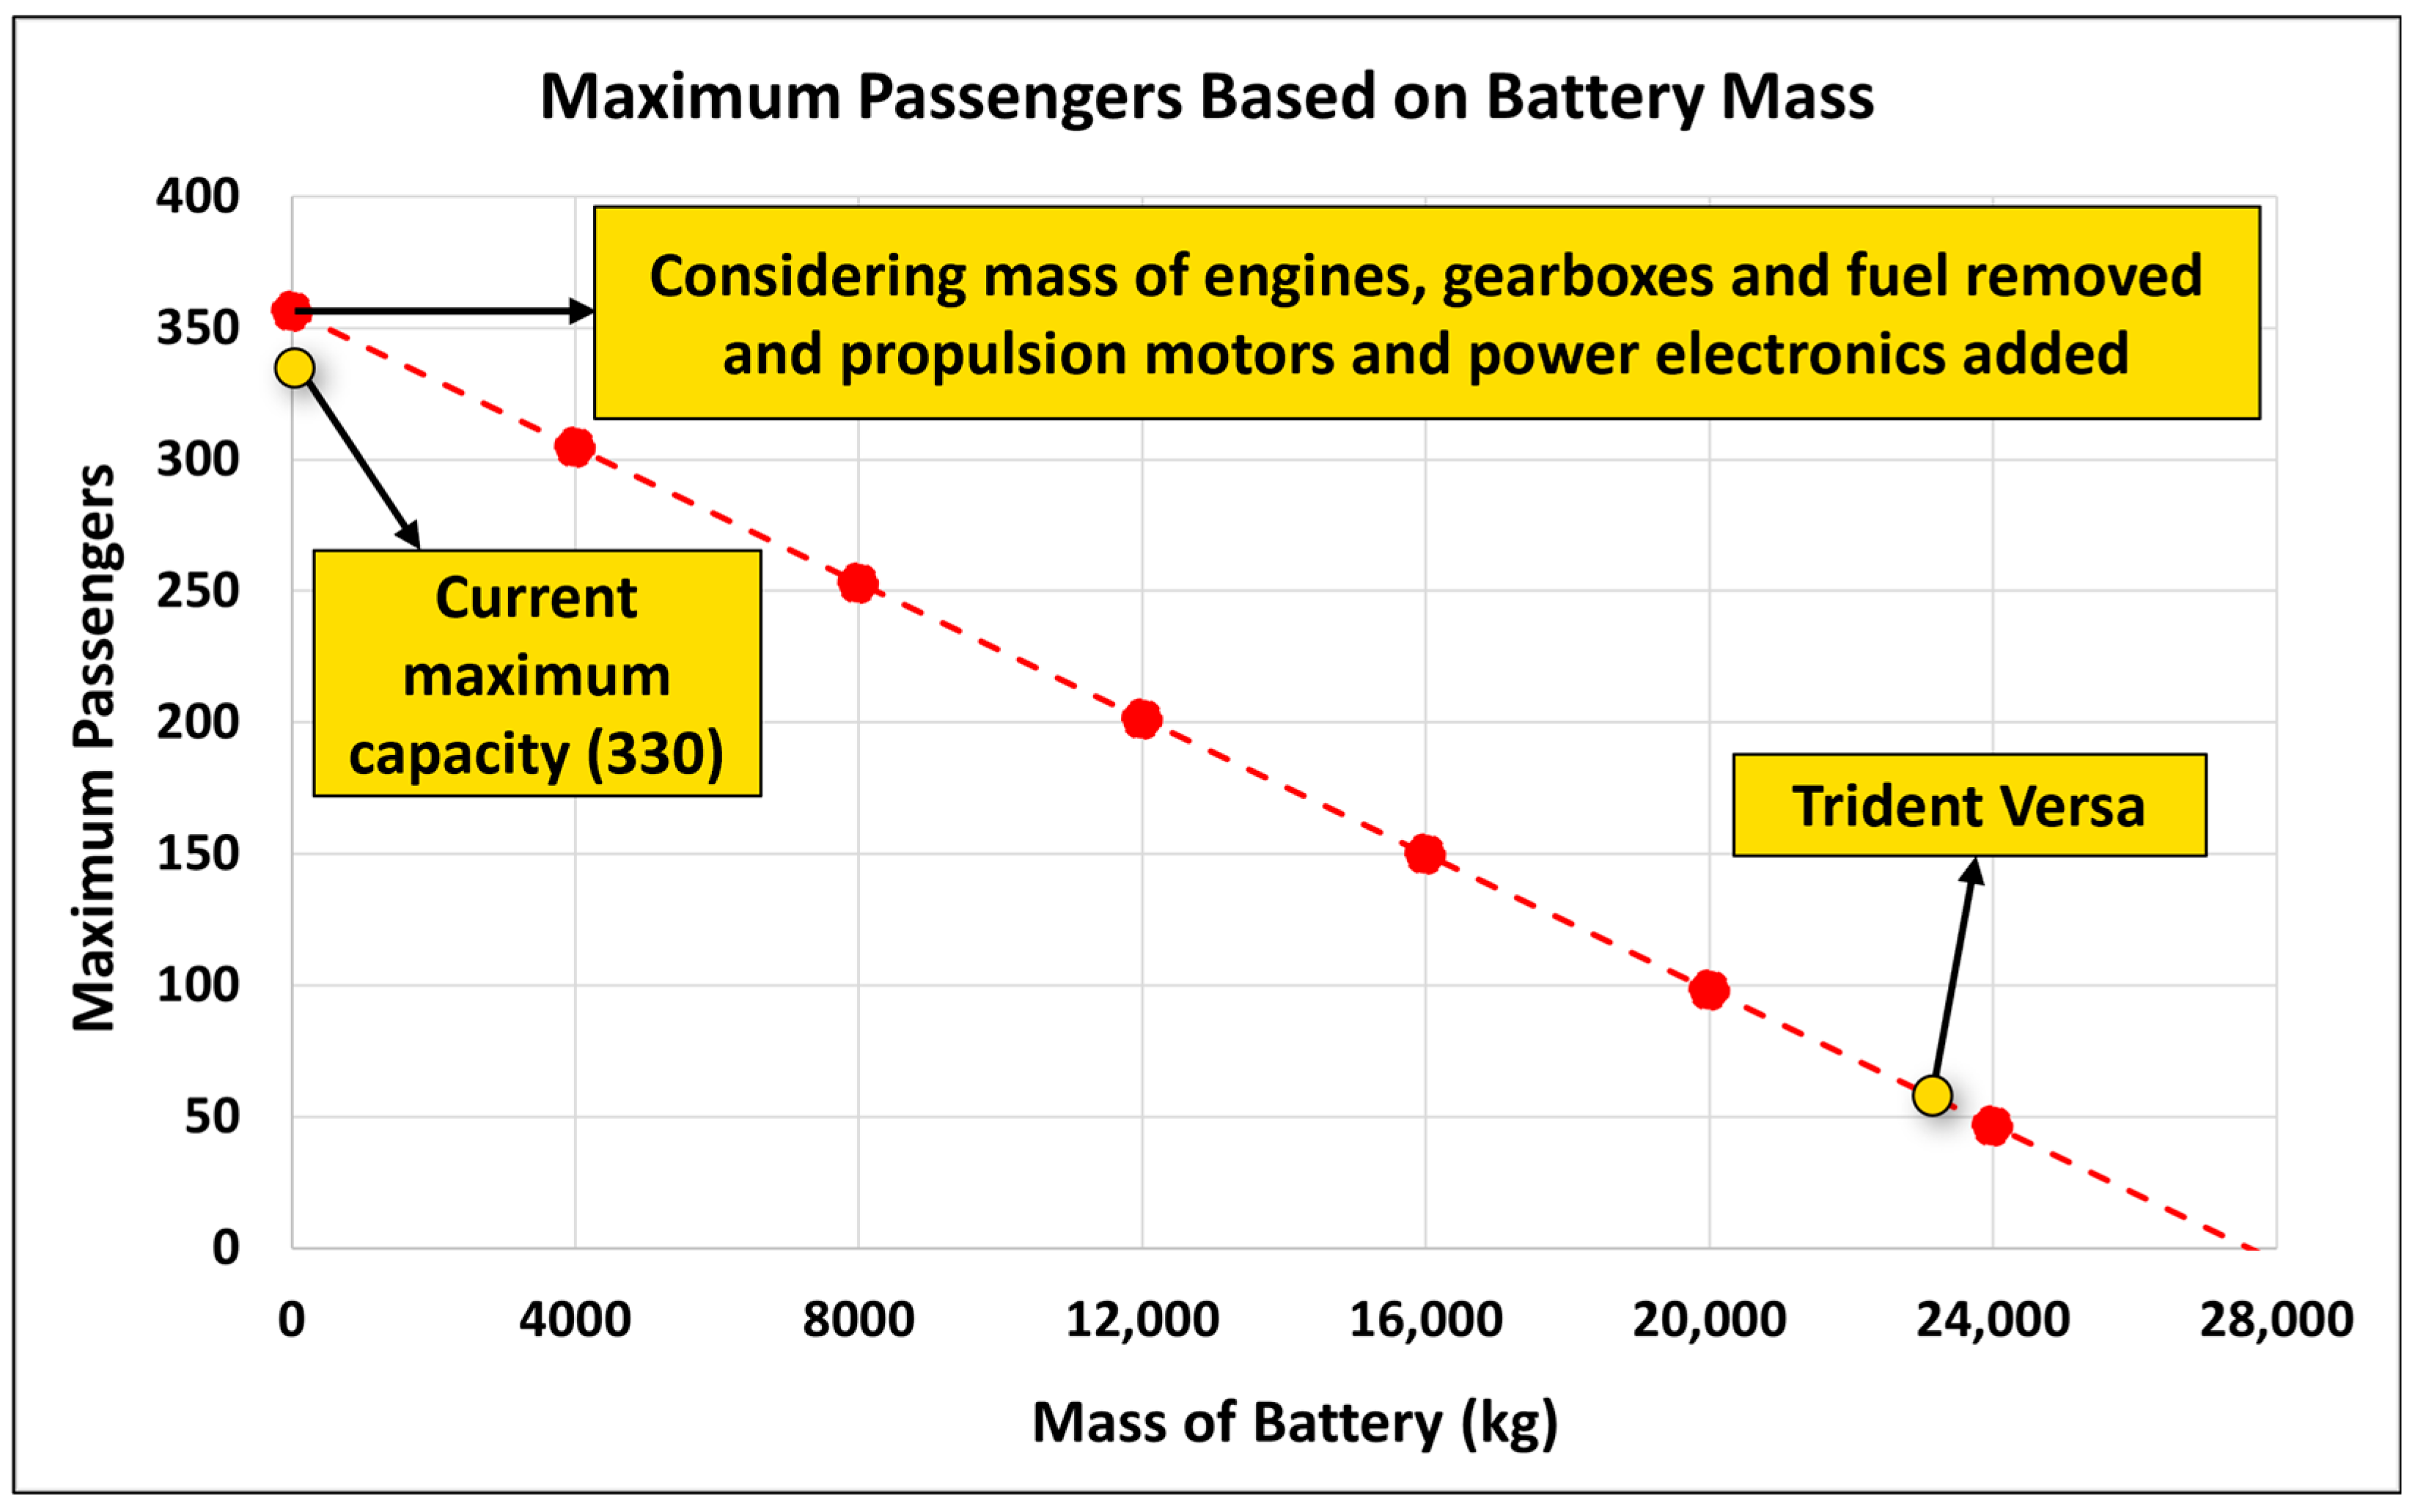
    Battery mass will have a significant impact on passenger count and, in turn, the overall revenue and profit.
Taking the complete picture into consideration, it would be better to replace the diesel engines of the Voyager with new and modern diesel engines instead of electrifying the ferry. However, this picture may change in a few years with improved battery technology and a cleaner Michigan electric grid.

7. Potential for Future Work

There are multiple pathways towards decarbonization. While electrification might not be the best solution in the particular scenario explored in this study, there is potential for future work regarding the Mackinac Island ferry.
  • The analysis conducted in this study should be repeated every few years. With technological advancements and decarbonization of the grid, there is a possibility of the scales tipping in favor of electrification in the future.
  • A similar analysis should be conducted for alternative configurations such as ultracapacitors, fuel cells, or a hybrid approach.
  • Alternative fuels such as hydrogen, natural gas, and low-carbon fuels should be considered for the IC engine configuration of the ferry for reducing CO2 emissions.

Author Contributions

Conceptualization: S.G. and J.W.; Methodology: S.G. and J.W.; Writing—original draft and preparation: S.G.; Writing—Review and editing: S.G. and J.W.; Project administration: J.W.; Funding acquisition: J.W. All authors have read and agreed to the published version of the manuscript.

Funding

This research was funded by the Michigan Economic Development Corporation (MEDC) through the Michigan Mobility Funding Platform’s test site grant program.

Data Availability Statement

For any additional data the reader may require, please contact the authors.

Acknowledgments

The authors feel it is important to note that this work would not have been possible without the generous and tremendous support of so many others. In particular, the authors wish to extend a sincere thank you to the Michigan Economic Development Corporation (MEDC) for their generous funding of the project. Chris Byrnes of the Mackinaw Economic Alliance (MEA) for his dedication, unwavering support of the project, and overall enthusiasm. Without the support of the captains, mechanics, and entire crew, the authors would not have been able to obtain critical pieces of information. Craig Jarosinski and Adam Blum from Interstate Power Systems for their valuable expertise and insight and for sharing resources available with them. Ingi Huswick and Chad Rogers from Spear Power Systems for their unique and critical expertise regarding maritime batteries and sharing battery technical details. Warrant Officer Scott Harroun of the US Coast Guard for his unique wisdom regarding changes in vessel mass. Travis White, Jamey Anderson, and other staff at Michigan Tech’s Great Lakes Research Center for their wise council and for Ana Dyreson for her leadership in the overall project for which this study was only one component.

Conflicts of Interest

The authors declare no conflict of interest.

Abbreviations

BEVBattery Electric Vehicle
BOMBill of Materials
BSFCBrake Specific Fuel Consumption
CO2Carbon Dioxide
DoDDepth of Discharge
EIAEnergy Information Administration
Eff.Efficiency
EVSEElectric Vehicle Supply Equipment
FOSFactor of Safety
IMOInternational Maritime Organization
MEAMackinac Economic Alliance
MEDCMichigan Economic Development Corporation
GHGGreenhouse Gas
GREETGreenhouse Gases, Regulated Emissions, and Energy use in Technologies
ICEInternal Combustion Engine
LCALife-cycle Assessment
LHVLower Heating Value
NGNatural Gas
NOxOxides of Nitrogen
SLDSingle-Line Diagram
SO2Sulfur Dioxide
USCGUnited States Coast Guard
ULSDUltra-Low-Sulfur Diesel
USAUnited States of America

Appendix A

The SLD for the fully electric Voyager is shown in Figure A1.
Figure A1. Single-line diagram for a fully electric Voyager (generated by Danfoss for Interstate Power Systems).
Sustainability 16 04297 g0a1

Appendix B

Table A1 shows the exact values used in the calculation of GHG emissions for the two ferry configurations.
Table A1. Values used in the calculation of GHG emissions for IC engine and BEV configurations of the Mackinac Island ferry.
ParameterValue
Li-ion battery manufacture emissions (kg CO2-eq/kWh) [14,15]162
NG power plant efficiency (%) [17]44
Coal-fired power plant efficiency (%) [17]32
CO2 emissions from the combustion of 1 kg diesel (kg) [13]2.9937
CO2 emissions from 1 kWh of electricity on the grid from combustion of NG (kg) [13]0.4090
CO2 emissions from 1 kWh of electricity on the grid from combustion of coal (kg) [13]1.0487
Well-to-pump emissions from 1 kWh energy on the grid from natural gas (kg) [13]0.0419
Well-to-pump emissions from 1 kWh energy on the grid from coal (kg) [13]0.0171
The CO2 emission values for 1 kWh of electricity on the grid for NG and coal power plants are very similar to the values reported by Burton et al. [28].

Appendix C

Table A2 and Table A3 show the costs used in the calculation of the initial and operational costs for the IC engine and BEV configurations of the Mackinac Island ferry.
Table A2. Costs used in the economic analysis of the IC engine ferry.
ParameterCost (USD)
Cost of new engines (two engines) (discussions with Interstate Power Systems)600,000
Cost of offroad diesel per gallon (purchased in bulk) (discussions with Interstate Power Systems)3.75
Yearly cost of engine maintenance for the IC engine ferry (discussions with Interstate Power Systems)10,000
Yearly cost of oil changes for the IC engine ferry (discussions with Interstate Power Systems)5000
Table A3. Costs used in the economic analysis of the fully electric ferry.
ParameterCost (USD)
Cost of a battery per kWh (discussions with Spear Power Systems)700
Commercial electricity cost in Mackinaw City and St. Ignace per kWh [29]0.1089
Demand charge in Mackinaw City and St. Ignace per kW16.4
Battery engineering cost (discussions with Spear Power Systems)100,000
Propulsion engineering cost (discussions with Principal Investigators from current and previous APS LABS projects)100,000
Control engineering cost (discussions with Principal Investigators from current and previous APS LABS projects)50,000
High voltage system engineering cost (discussions with Principal Investigators from current and previous APS LABS projects)50,000
Cost motors (for propulsion) (emails with ABB)200,000
Cost of motor (for the tail jet) (discussions with Principal Investigators from current and previous APS LABS projects)23,000
Cost of inverters and power electronics (discussions with Principal Investigators from current and previous APS LABS projects)200,000
Cost of shore power upgrades (discussions with Principal Investigators from current and previous APS LABS projects)1,530,000
Shipyard costs for retrofitting the ferry (discussions with Interstate Power Systems)1,000,000
Table A4. Mass of Mackinac Island ferry components.
ComponentMass (kg)
Battery mass (discussions with Spear Power Systems)23,553
Mass of propulsion motors (two motors) (discussions with Interstate Power Systems)5000
Mass of propulsion power electronics (discussions with Interstate Power Systems)2822
Mass of motor (tail jet) (discussions with Interstate Power Systems)190
Mass of power electronics for charging (discussions with Interstate Power Systems)1740
Mass of 16V92 [30]2200
Mass of 12V71 [31]1610
Mass of fuel [12]4163

Appendix D

In Section 3.1 (Battery Sizing), the parameters for battery sizing are detailed in Table 2. However, the authors could not find concrete values for the power electronics efficiency, propulsion motor efficiency, and EVSE efficiency for the hardware that would need to be used for electrifying the Voyager. The values were chosen based on previous and current projects being conducted at APS LABS.
An argument can be made that if the chosen efficiency values are lower than what is possible with today’s technology, the analysis might yield different results. To cover all bases, the CO2 emissions for the fully electric ferry were calculated with all three of the efficiencies in question assumed to be 100%. The results are shown in Figure A2.
Even with the assumption of zero losses, the BEV ferry still has higher CO2 emissions than the IC engine ferry, and the conclusions drawn do not change. This is due to the electricity generation mix in Michigan, losses at the power plants, transmission losses, charge and discharge efficiencies of the battery, and the emissions in battery manufacturing.
Figure A2. CO2 emissions for BEV and IC engine configurations of the Mackinac Island ferry assuming power electronics efficiency, propulsion motor efficiency, and EVSE efficiency to be 100%.
Sustainability 16 04297 g0a2

References

  1. Schnurr, R.E.J.; Walker, T.R. Marine transportation and energy use. Ref. Modul. Earth Syst. Environ. Sci. 2019, 1–9. [Google Scholar] [CrossRef]
  2. DNV GL. Maritime Forecast to 2050, Energy Transition Outlook 2019; DNV GL: Høvik, Norway, 2019. [Google Scholar]
  3. Yuan, Y.; Wang, J.; Yan, X.; Li, Q.; Long, T. A design and experimental investigation of a large-scale solar energy/diesel generator powered hybrid ship. Energy 2018, 165, 965–978. [Google Scholar] [CrossRef]
  4. Hansen, J.F.; Wendt, F. History and state of the art in commercial electric ship propulsion, integrated power systems, and future trends. Proc. IEEE 2015, 103, 2229–2242. [Google Scholar] [CrossRef]
  5. Dedes, E.K.; Hudson, D.A.; Turnock, S.R. Assessing the potential of hybrid energy technology to reduce exhaust emissions from global shipping. Energy Policy 2012, 40, 204–218. [Google Scholar] [CrossRef]
  6. Anwar, S.; Zia, M.Y.; Rashid, M.; Rubens, G.Z.; Enevoldsen, P. Towards ferry electrification in the maritime sector. Energies 2020, 13, 6506. [Google Scholar] [CrossRef]
  7. Statista. Available online: https://www.statista.com/statistics/264036/number-of-passenger-ships-in-the-world-merchant-fleet/ (accessed on 20 December 2022).
  8. Statista. Available online: https://www.statista.com/statistics/1025497/distribution-of-electricity-production-in-norway-by-source/ (accessed on 20 December 2022).
  9. Statista. Available online: https://www.statista.com/statistics/528603/distribution-electricity-net-generation-in-the-us-by-fuel-type/ (accessed on 20 December 2022).
  10. Energy Information Administration (EIA). Available online: https://www.eia.gov/state/?sid=MI#tabs-4 (accessed on 20 December 2022).
  11. Energy Information Administration (EIA). Available online: https://www.epa.gov/ghgemissions/inventory-us-greenhouse-gas-emissions-and-sinks-1990-2020 (accessed on 20 December 2022).
  12. Engineering Toolbox. Available online: https://www.engineeringtoolbox.com/fuels-higher-calorific-values-d_169.html (accessed on 20 December 2022).
  13. Energy Information Administration (EIA). Available online: https://www.eia.gov/environment/emissions/co2_vol_mass.php (accessed on 20 December 2022).
  14. GREET®, 2020. Life-Cycle Assessment Tool. Argonne National Lab: Chicago, IL, USA, 2020.
  15. Kim, H.C.; Wallington, T.J.; Arsenault, R.; Bae, C.; Ahn, S.; Lee, J. Cradle-to-gate emissions from a commercial electric vehicle Li-ion battery: A comparative analysis. Environ. Sci. Technol. 2016, 50, 7715–7722. [Google Scholar] [CrossRef] [PubMed]
  16. Energy Information Administration (EIA). Available online: https://www.eia.gov/tools/faqs/faq.php?id=105&t=3 (accessed on 20 December 2022).
  17. Energy Information Administration (EIA). Available online: https://www.eia.gov/electricity/annual/html/epa_08_01.html (accessed on 20 December 2022).
  18. Environmental Protection Agency (EPA). Available online: https://nepis.epa.gov/Exe/ZyPDF.cgi?Dockey=P100ZP4H.pdf (accessed on 20 December 2022).
  19. DieselNet. Available online: https://dieselnet.com/standards/us/marine.php (accessed on 20 December 2022).
  20. Energy Information Administration (EIA). Available online: https://www.eia.gov/electricity/state/michigan/ (accessed on 20 December 2022).
  21. US Department of Health and Human Services. Available online: https://www.cdc.gov/nchs/data/series/sr_03/sr03-046-508.pdf (accessed on 20 December 2022).
  22. Sundvor, I.; Thorne, R.J.; Danebergs, J.; Aarskog, F.; Weber, C. Estimating the replacement potential of Norwegian high-speed passenger vessels with zero-emission solutions. Transp. Res. Part D Transp. Environ. 2021, 99, 103019. [Google Scholar] [CrossRef]
  23. Stoke, E.A. Volume 4 Naval Architecture for Marine Engineers; Thomas Reed Publications: Boston, MA, USA, 1963. [Google Scholar]
  24. Otsason, R.; Tapaninen, U. Decarbonizing City Water Traffic: Case of Comparing Electric and Diesel-Powered Ferries. Sustainability 2023, 15, 16170. [Google Scholar] [CrossRef]
  25. Statista. Available online: https://www.statista.com/statistics/1234898/belgium-distribution-of-electricity-production-by-source/ (accessed on 20 December 2022).
  26. Trieste, S.; Hmam, S.; Olivier, J.C.; Bourguet, S.; Loron, L. Techno-economic optimization of a supercapacitor-based energy storage unit chain: Application on the first quick charge plug-in ferry. Appl. Energy 2015, 153, 3–14. [Google Scholar] [CrossRef]
  27. Cha, M.; Enshaei, H.; Nguyen, H.; Jayasinghe, S.G. Towards a future electric ferry using optimisation-based power management strategy in fuel cell and battery vehicle application—A review. Renew. Sustain. Energy Rev. 2023, 183, 113470. [Google Scholar] [CrossRef]
  28. Burton, T.; Powers, S.; Burns, C.; Conway, G.; Leach, F.; Senecal, K. A data-driven greenhouse gas emission rate analysis for vehicle comparisons. SAE Int. J. Electrified Veh. 2023, 12, 91–127. [Google Scholar] [CrossRef]
  29. Find Energy. Available online: https://findenergy.com/mi/mackinac-county-electricity/ (accessed on 20 December 2022).
  30. Wikipedia. Available online: https://en.wikipedia.org/wiki/Detroit_Diesel_Series_92 (accessed on 20 December 2022).
  31. Wikipedia. Available online: https://en.wikipedia.org/wiki/Detroit_Diesel_Series_71 (accessed on 20 December 2022).
Figure 1. Distribution of energy generation in Norway for the year 2021.
Sustainability 16 04297 g001
Figure 2. Distribution of energy generation in the United States for the year 2021.
Sustainability 16 04297 g002
Figure 3. Distribution of diesel consumption for non-road sources in the United States from 2010 to 2020.
Sustainability 16 04297 g003
Figure 4. Ferry route from Mackinaw City to Mackinac Island captured using the Strava application.
Sustainability 16 04297 g004
Figure 5. Speed vs. time data for Voyager and Liberty II ferries from Mackinaw City to Mackinac Island and back.
Sustainability 16 04297 g005
Figure 6. Engines used in the Liberty II.
Sustainability 16 04297 g006
Figure 7. Schematic of the battery sizing process.
Sustainability 16 04297 g007
Figure 8. Emission considerations for the IC engine and BEV configurations of the Mackinac Island ferry.
Sustainability 16 04297 g008
Figure 9. CO2 emissions for BEV and IC engine configurations of the Mackinac Island ferry.
Sustainability 16 04297 g009
Figure 10. CO2 emissions from ferry operation for BEV and IC engine configurations of the Mackinac Island ferry.
Sustainability 16 04297 g010
Figure 11. NOx emissions for BEV and IC engine configurations of the Mackinac Island ferry.
Sustainability 16 04297 g011
Figure 12. SO2 emissions for BEV and IC engine configurations of the Mackinac Island ferry.
Sustainability 16 04297 g012
Figure 13. Cost of operation for BEV and IC engine configurations of the Mackinac Island ferry.
Sustainability 16 04297 g013
Figure 14. Change in maximum passenger capacity of the Voyager with increase in battery mass.
Sustainability 16 04297 g014
Figure 15. (a) Revenue, cost, and profit for the IC engine configuration over 5 years. (b) Revenue, cost, and profit for the BEV configuration over 5 years.
Sustainability 16 04297 g015
Figure 16. CO2 emissions per passenger per trip for maximum passenger capacity for the Mackinac Island ferry.
Sustainability 16 04297 g016
Figure 17. CO2 emissions for BEV and IC engine configurations of the Mackinac Island ferry if the ferry were operating in Norway.
Sustainability 16 04297 g017
Table 1. Distribution of electricity generation in Michigan in June 2022 [10].
TypeElectricity Generation (GWh)Percentage
Natural gas352335.6%
Coal298430.1%
Nuclear229623.2%
Renewable110411.1%
Table 2. Parameters used for sizing the battery for a fully electric ferry.
ParameterValue
Engine BSFC (g/kWh)205
Fuel lower heating value MJ/kg [12]42.6
Battery discharge efficiency (%) (discussions with Spear Power Systems)96.9
Power electronics efficiency (%) (no sources were found for these parameters for this application specifically; values have been chosen based on other current projects being conducted at APS LABS)95
Propulsion motor efficiency (%) (discussions with Spear Power Systems)90
Electric vehicle supply equipment (EVSE) efficiency95
Usable capacity/depth of discharge (%)80
Factor of Safety1.2
Table 3. Estimated average passengers on the IC engine ferry and BEV ferry.
IC Engine FerryElectric Ferry
Average Weekday PassengersAverage Weekend PassengersAverage Weekday PassengersAverage Weekend Passengers
35503550
701007073
951507373
951507373
951507373
701007073
35503550
Disclaimer/Publisher’s Note: The statements, opinions and data contained in all publications are solely those of the individual author(s) and contributor(s) and not of MDPI and/or the editor(s). MDPI and/or the editor(s) disclaim responsibility for any injury to people or property resulting from any ideas, methods, instructions or products referred to in the content.

