Article

Delineating Priority Areas for Preservation and Restoration across Production–Living–Ecological Spaces in Ganzi, China

1
College of Ecology and Environment, Chengdu University of Technology, Chengdu 610059, China
2
Comprehensive Law Enforcement Brigade for Ecological and Environmental Protection, Ganzi 626000, China
*
Author to whom correspondence should be addressed.
Sustainability 2024, 16(11), 4327; https://doi.org/10.3390/su16114327
Submission received: 9 April 2024 / Revised: 11 May 2024 / Accepted: 16 May 2024 / Published: 21 May 2024

Abstract

:
Delineating conservation priority areas for both preservation and restoration is essential for developing adaptive ecosystem management strategies across production–living–ecological spaces (PLES). This study developed a coherent framework with four steps: (1) mapping spatial distributions of biodiversity and ecosystem services, (2) ranking the relative importance of ecosystems across spaces, (3) delineating priority areas for preservation and restoration according to the human footprint and priority ranks, and (4) contrasting with current conservation networks and overlapping with PLES. This framework was applied in Ganzi, China, to delineate the preservation priority areas (PPAs) of 8714.2 km2 and 11,308.1 km2, and restoration priority areas (RPAs) of 36,817.7 km2 and 63,578.4 km2 under the target to conserve 30% and 50% of territories, respectively. The priority areas, including PPAs and RPAs, achieve higher conservation capacity than the current Ecological Conservation Redline (ECR) in terms of biodiversity conservation or ecosystem service delivery. Roughly 67% of PPAs, 40% of RPAs, and a total of 75% of large patches with high priority are covered by ECR, indicating the necessity to adjust boundary and conduct restoration for ECR. As for PLES, the conservation priority areas encompass proportionally more ecological space (67–76%) than ECR (63.5%) or Ganzi (61.4%), implying the lower potential conflict between local residents’ production and conservation, and meanwhile, new opportunities and challenges in sustainable development in human-dominated spaces. The coherent framework to delineate PPAs and RPAs is flexible in terms of threshold in human impact or ecological degradation and can be improved by considering the complex relationships between indicators of biodiversity and ecosystem services. This study highlights the importance of incorporating ecosystem features, land uses, and human activities in developing different strategies according to different conservation purposes in the context of sustainable development.

1. Introduction

Ecosystem degradation caused by anthropogenic disturbance and climate change has seriously hindered the sustainable development of coupled human and natural systems [1,2]. Previous studies argued that ecosystem-based adaptative conservation, including preservation and restoration, can contribute to achieving sustainable goals [3,4,5]. Early in 2010, the “Strategic Plan for Biodiversity 2011–2020” proposed clear goals (Aichi Goal 11) to protect areas of special importance in biodiversity and ecosystem services [6]. The area-based conservation includes national parks, nature reserves, and other types of protected areas [7]. However, increasing evidence suggests that even with a highly favorable socio-economic environment and conservation efforts, biodiversity within some protected areas continues to decline [7,8]. Therefore, the recent United Nations Decade for Ecosystem Restoration (2021–2030) calls for curbing ecosystem decline, repairing damaged ecosystems, and protecting those still intact [9]. Institutions such as the International Union for Conservation of Nature (IUCN) and Wildlife Conservation Society (WCS) have also set ambitious goals to conserve at least 30% of the Earth’s land surface by 2030 [10,11]. The above proposals will encourage more diverse and multi-targeted ecological preservation and restoration projects at multi-scales [7,12].
Research has demonstrated that biodiversity is fundamental to the provision of most ecosystem services, which, in turn, rely on biodiversity [13,14]. Consequently, the conservation of biodiversity and ecosystem services is crucial for attaining the most effective conservation outcomes [15]. Typically, conservation efforts prioritize the preservation of biodiversity [16,17,18,19]. Studies have shown that hotspots of biodiversity and those of ecosystem services are not always spatially congruent [20,21]. Therefore, areas for protecting biodiversity, determined by the relative irreplaceability/vulnerability of species, habitats, and ecosystems, as well as the ease of management and intervention [16,22], may be questionable in maximizing the maintenance of ecosystem services, which have been increasingly counted in delimiting protected areas [20,23,24]. In addition, most current delineation of conservation priority areas focuses on preservation priority areas (PPAs), while the concerns about restoration priority areas (RPAs) have just begun to increase in recent years [9,15,25,26,27,28]. A feasible solution to the above problems is to simultaneously identify priority areas for approaches of both preservation and restoration based on the situations of both biodiversity and ecosystem services [15,29,30].
Previous ecological conservation mainly focused on natural ecosystems and their elements, while in reality, ecological conservation across territorial space, including land used by humans, is essential for achieving sustainable development [7,31,32]. Territorial space is composed of ecosystems (mountains, rivers, forests, fields, lakes, grasslands, deserts, oceans), human beings (cities, villages, roads, mines), and their interactions, and thus has the composite spaces of production, living, and ecology with corresponding functions [32,33,34,35]. Fu (2021) proposed three evolutionary stages, including coordinated arrangement, systematic governance, and human–nature harmony, with increasing integrations between humans and nature. For human–nature harmony, in addition to natural ecosystems, human-dominated ecosystems (cities, farmlands, and industrial and mining areas) should be incorporated in regional conservation planning, with an emphasis on ecological restoration, which has evolved from natural to social sciences in definition [32,34,36]. Integrating conservation priority areas with PLES will help decision-makers develop regional-specific plans to ensure the effectiveness of conservation actions [31,32].
In this paper, we developed a coherent framework to make spatially explicit delineation of priority areas for both preservation and restoration in PLES, based on the relative importance of biodiversity and ecosystem services and the level of human pressure. To contrast the delineation of preservation and restoration under different conservation target scenarios and current ECR, we apply this framework for ecological preservation and restoration planning in Ganzi Prefecture (hereafter Ganzi), southwest China.

2. Materials and Methods

2.1. Overview of the Study Area

Ganzi is located in the west of Sichuan Province and in the transition zone from the southeast edge of the Qinghai Tibet Plateau to the Sichuan Basin. The region includes 18 counties, with a total area of 149,700 km2. The study area is a typical high-altitude ecological fragile area with an average elevation of 3500 m and an elevational range of 6400 m. As the core area of the ecological barrier of the Qinghai Tibet Plateau and one of the 35 biodiversity hotspots worldwide, this area has played an important role in water resource supply, biodiversity preservation, carbon sequestration, and soil and water conservation [37,38]. In recent years, with the impacts of climate change, urban expansion, and tourism development, some ecosystems in the region have been severely disrupted. Localized regions have witnessed a rise in soil erosion, and our previous field studies have revealed that woodland, grassland, and wetland ecosystems have suffered degradation. The urgency of carrying out ecological conservation work is high, providing a good research platform for identifying priority areas of preservation and restoration [39] (Figure 1).

2.2. Coherent Framework for Delineation of Conservation Priority Areas

This coherent framework to delineate priority areas for preservation and restoration mainly includes 4 steps (Figure 2):

2.2.1. Selection of Ecosystem Indicators

Biodiversity and ecosystem services are the objects of preservation and restoration, and mapping their spatial distribution characteristics is an important prerequisite for ecological conservation [9,40]. Biodiversity includes genetic diversity, species diversity, and ecosystem diversity, each of which has its own quantitative methods. Ecosystem services are the benefits that humans receive from the ecosystem, including supply, regulation, support, and culture. At geographic scales, the selection of indicators should fully consider the dominant ecological functions and data availability of the studied area and make full use of multi-source data. In this study, we selected five indicators that have been extensively used in ecosystem assessments and practices in Southwest China: species diversity, carbon sequestration, water conservation, soil retention, and sandstorm prevention [27,37].

2.2.2. Ranking the Relative Importance of Ecosystems across Spaces

The ranking of each spatial unit is based on the evaluation score integrating measures of species diversity, carbon sequestration, water conservation, soil retention, and sandstorm prevention. There are currently several publicly available decision support systems for spatial conservation planning. This study adopts Zonation [41], which is addressed in Section 2.5.

2.2.3. Delineating Priority Areas for Preservation and Restoration According to the Human Footprint and Priority Ranks

The conservation target, the proportion of conserved areas to the total area, can be set with reference to global/regional conservation objectives [7,9,42] and the local situation in the study area. For each spatial unit, the higher the evaluation score in biodiversity and ecosystem services, the more likely it is to be selected as the priority area for ecological conservation. The major ecological strategies (preservation or restoration) for each spatial unit within the priority area can be determined by the intensity of human interference (e.g., human footprint). The spatial units experiencing no or low human interference are delineated into preservation priority areas and those with intensive human activities into restoration priority areas [9].

2.2.4. Contrasting with Current Ecological Conservation Redline (ECR) and Overlapping with Production–Living–Ecological Spaces (PLES)

By contrasting the conservation priority areas delineated through this method with those identified by the existing Ecological Conservation Redline (ECR), we can gain valuable insights that will inform potential refinements to the ECR boundaries. Previous studies have focused on conservation within ecological spaces, while in reality, there are also many ecologically important land units within production and living spaces that need to be protected or restored. In order to approach harmony between humans and nature, conservation can no longer be limited to ecological space, and the spaces for production and living also need to be considered [31,32,34]. In this study, we have drawn upon the recent publication [35] and utilized land use data to recreate the production–living–ecological spaces (PLES) dataset for Ganzi.

2.3. Assessing the Importance of Biodiversity Conservation

In this study, to enhance the representativeness of different taxonomic groups, we used the current range data of species in the IUCN Red List (data from seven out of the nine categories were included). These data were employed to obtain a raster map showing the number of species potentially present in each cell. We selected amphibians (42 species), mammals (165 species), and birds (392 species) since their distribution data are sufficient for spatial assessment of biodiversity conservation importance [43]. Compared with birds, the numbers of species in amphibians and mammals are evidently lower; thus, directly adding species numbers from each taxonomic group for each spatial unit would underestimate the contribution of amphibians and mammals to regional species diversity. Therefore, we normalized the species richness of each group to between [0, 1] and then summed them up to characterize the importance of biodiversity conservation [44].

2.4. Assessing the Importance of Ecosystem Services

2.4.1. Carbon Sequestration

The carbon sequestration capacity of terrestrial ecosystems has a strong climate mitigation potential [45]. We quantified the carbon sequestration capacity of the study area in terms of potential carbon stocks, taking into account the uncertainties of multi-step, regionally based carbon stock assessments [46]. This study uses a potential carbon stock dataset containing above-ground biomass, below-ground biomass, and soil organic matter, which was developed for global terrestrial ecosystems with a higher degree of accuracy [47].

2.4.2. Water Conservation

Freshwater supply is an important factor for sustaining human development and, thus, a key ecosystem service in the study area. In this study, water yield was used to quantify the water conservation capacity of the study area, and water yield was calculated using the “Water yield” module of the InVEST model as follows:
Y X   = ( 1 A E T X P X ) × P X
where Y X denotes the annual water production of grid cell x; A E T X denotes the annual actual evapotranspiration of grid cell x; and P X denotes the annual precipitation of grid cell x.

2.4.3. Soil Retention

Soil retention is one of the fundamental ecosystem services, which represents the difference between potential and actual soil erosion. In this study, the generalized soil loss equation (RUSLE) was applied to quantify the soil retention capacity (SR) in the study area as follows:
S R   =   S C P     S C r   =   R   ×   K   ×   L S   ×   ( 1     C )
where SCp and SCr are potential and actual soil erosion (t·hm−2), respectively; R is the rainfall erosivity factor (MJ·mm/hm2·a); K represents the soil erodibility factor (t·hm2·a/MJ hm2·mm); LS is the slope length and steepness coefficients (dimensionless); C is the vegetation cover factor (dimensionless); and R, K, C and LS parameters have been shown in the equation of calculation in a previous study [48].

2.4.4. Sandstorm Prevention

Sandstorm prevention is one of the important ecosystem services in the Tibetan Plateau region. In this study, we applied the USDA’s Modified Wind Erosion Equation (RWEQ), which is a relatively simple model that has been widely used to assess sandstorm prevention at a large scale [49]. The model calculation is as follows:
S P = S L P S L r
Q m a x p = 109.8 × W F × E F × S C F × K
S p = 105.7 W F × E F × S C F × K 0.3711
S L p = 2 z S 2 p Q m a x p e z / s p 2
Q m a x r = 109.8 × W F × E F × S C F × K × C
S r = 105.7 W F × E F × S C F × K × C 0.3711
S L r = 2 z S 2 Q m a x r e z / s r 2
where S L P  and S L r represent potential and actual wind erosion (kg·m−2), respectively; Q m a x p and Q m a x r are maximum transport capacities (kg·m−1); S r  and S p are critical site lengths (m); Z is the distance from the upwind edge of the site (m); W F is the weather factor (kg·m−1); and E F , S C F , K , and C are the erodible soil fraction, the soil crust factor, the surface roughness factor, and the combined cropping factor (dimensionless), respectively.

2.5. Spatial Ranking of Ecological Conservation Priority

In this study, the ecological spatial prioritization of each grid was calculated using the Zonation model, which can utilize information from multiple input features to generate a prioritization of the entire study area. Zonation produces prioritization orders for all units in the entire study area [50,51]. It iteratively ranks grid cells based on the value of their different characterization factors and, at each step, removes the units that result in the least marginal loss of overall value. In this process, called the Zonation meta-algorithm, the units removed first receive the lowest rankings, and the units removed last receive the highest rankings. Zonation allows us to seamlessly combine Eigenfactor data at a uniform spatial resolution, while the quantitative features of the prioritized maps generated can be exported in the form of a performance curve to be evaluated [41].
We normalized the values of biodiversity conservation and each ecosystem service to between 0 and 1 using the Max–Min method. The same weight was assigned to the five indicators, and the “Additional Benefit Function (ABF)” unit removal rule was chosen in Zonation. Finally, Zonation calculates the ecological priority ranks of Ganzi. Based on the Global Biodiversity Framework’s ambitious goal of ensuring the conservation of 30% of the Earth’s land surface by 2030 and the call to protect 50% of the terrestrial biosphere by 2050 [42,52], we selected areas in the top 30% and top 50% of the ecological spatial priority for ecological conservation priority.

2.6. Delineating Priority Areas for Preservation and Restoration

Within the conservation priority areas (top 30% or 50%) determined in the previous process, whether a habitat receives comprehensive preservation or systematic restoration depends on the pressure of human disturbance. The human footprint (HFP) represents the accumulated human pressure on the environment and thus is highly suitable for large-scale analyses due to its global completeness and high resolution. We used a 2020-updated human footprint dataset [53], which utilizes eight variables representing human pressures (built environments, population density, nighttime light, croplands, pasture lands, roadways, railways, and navigable waterways) to generate human footprint scores ranging from 0 to 50. Each cell has a value that represents the recent impact of human activities on the ecosystems, with larger values indicating a greater negative impact. Based on previous research and experiences [54,55,56], we applied two categories of HFP, “no or low disturbance” (HFP ≤ 4) and “moderate or high disturbance” (HFP > 4).
We applied these two categories of HFP to spatially overlay the conservation priority areas and defined the areas with no or low disturbance as PPAs and the areas with moderate or high disturbance as RPAs.

2.7. Comparing Conservation Capability under Different Scenarios and with Ecological Conservation Redline (ECR)

To test whether the conservation priority areas obtained by this approach have evident advantages in protecting biodiversity and ecosystem services, we calculated the proportion of species diversity, soil retention, carbon sequestration, water conservation, and sandstorm prevention in the priority areas for preservation and restoration. The ECR policy formulated in China identifies areas characterized by high biodiversity, vital ecological functions, or significant ecological sensitivity, which collectively form the vector range of the ECR. It is anticipated that the implementation of the ECR system will involve ongoing refinement of the ECR’s scope. By comparing the outcomes of various scenarios with the existing conservation capabilities of the ECR in biodiversity and ecosystem services, we can gain insights that will be instrumental in further refining the ECR’s extent.

2.8. Overlapping Conservation Priorities with the Production–Living–Ecological Spaces (PLES)

The priority areas for preservation and restoration under different scenarios were overlayed with the PLES, and the areas in need of preservation and restoration in each space were delineated, respectively. On this basis, it is feasible to propose targeted preservation and restoration measures; for instance, preservation and restoration measures for farmland are quite different from those for mining areas, although they are both in production space.

2.9. Data Sources

The data used in this study mainly include species diversity, meteorology, soil properties, land use type, DEM, and NDVI. The above data were preprocessed in ArcGIS 10.2, including the outlier elimination, uniform projection, interpolating, and uniform resolution to 1 km × 1 km raster image size. The data sources and detailed information are shown in Table 1.

3. Results

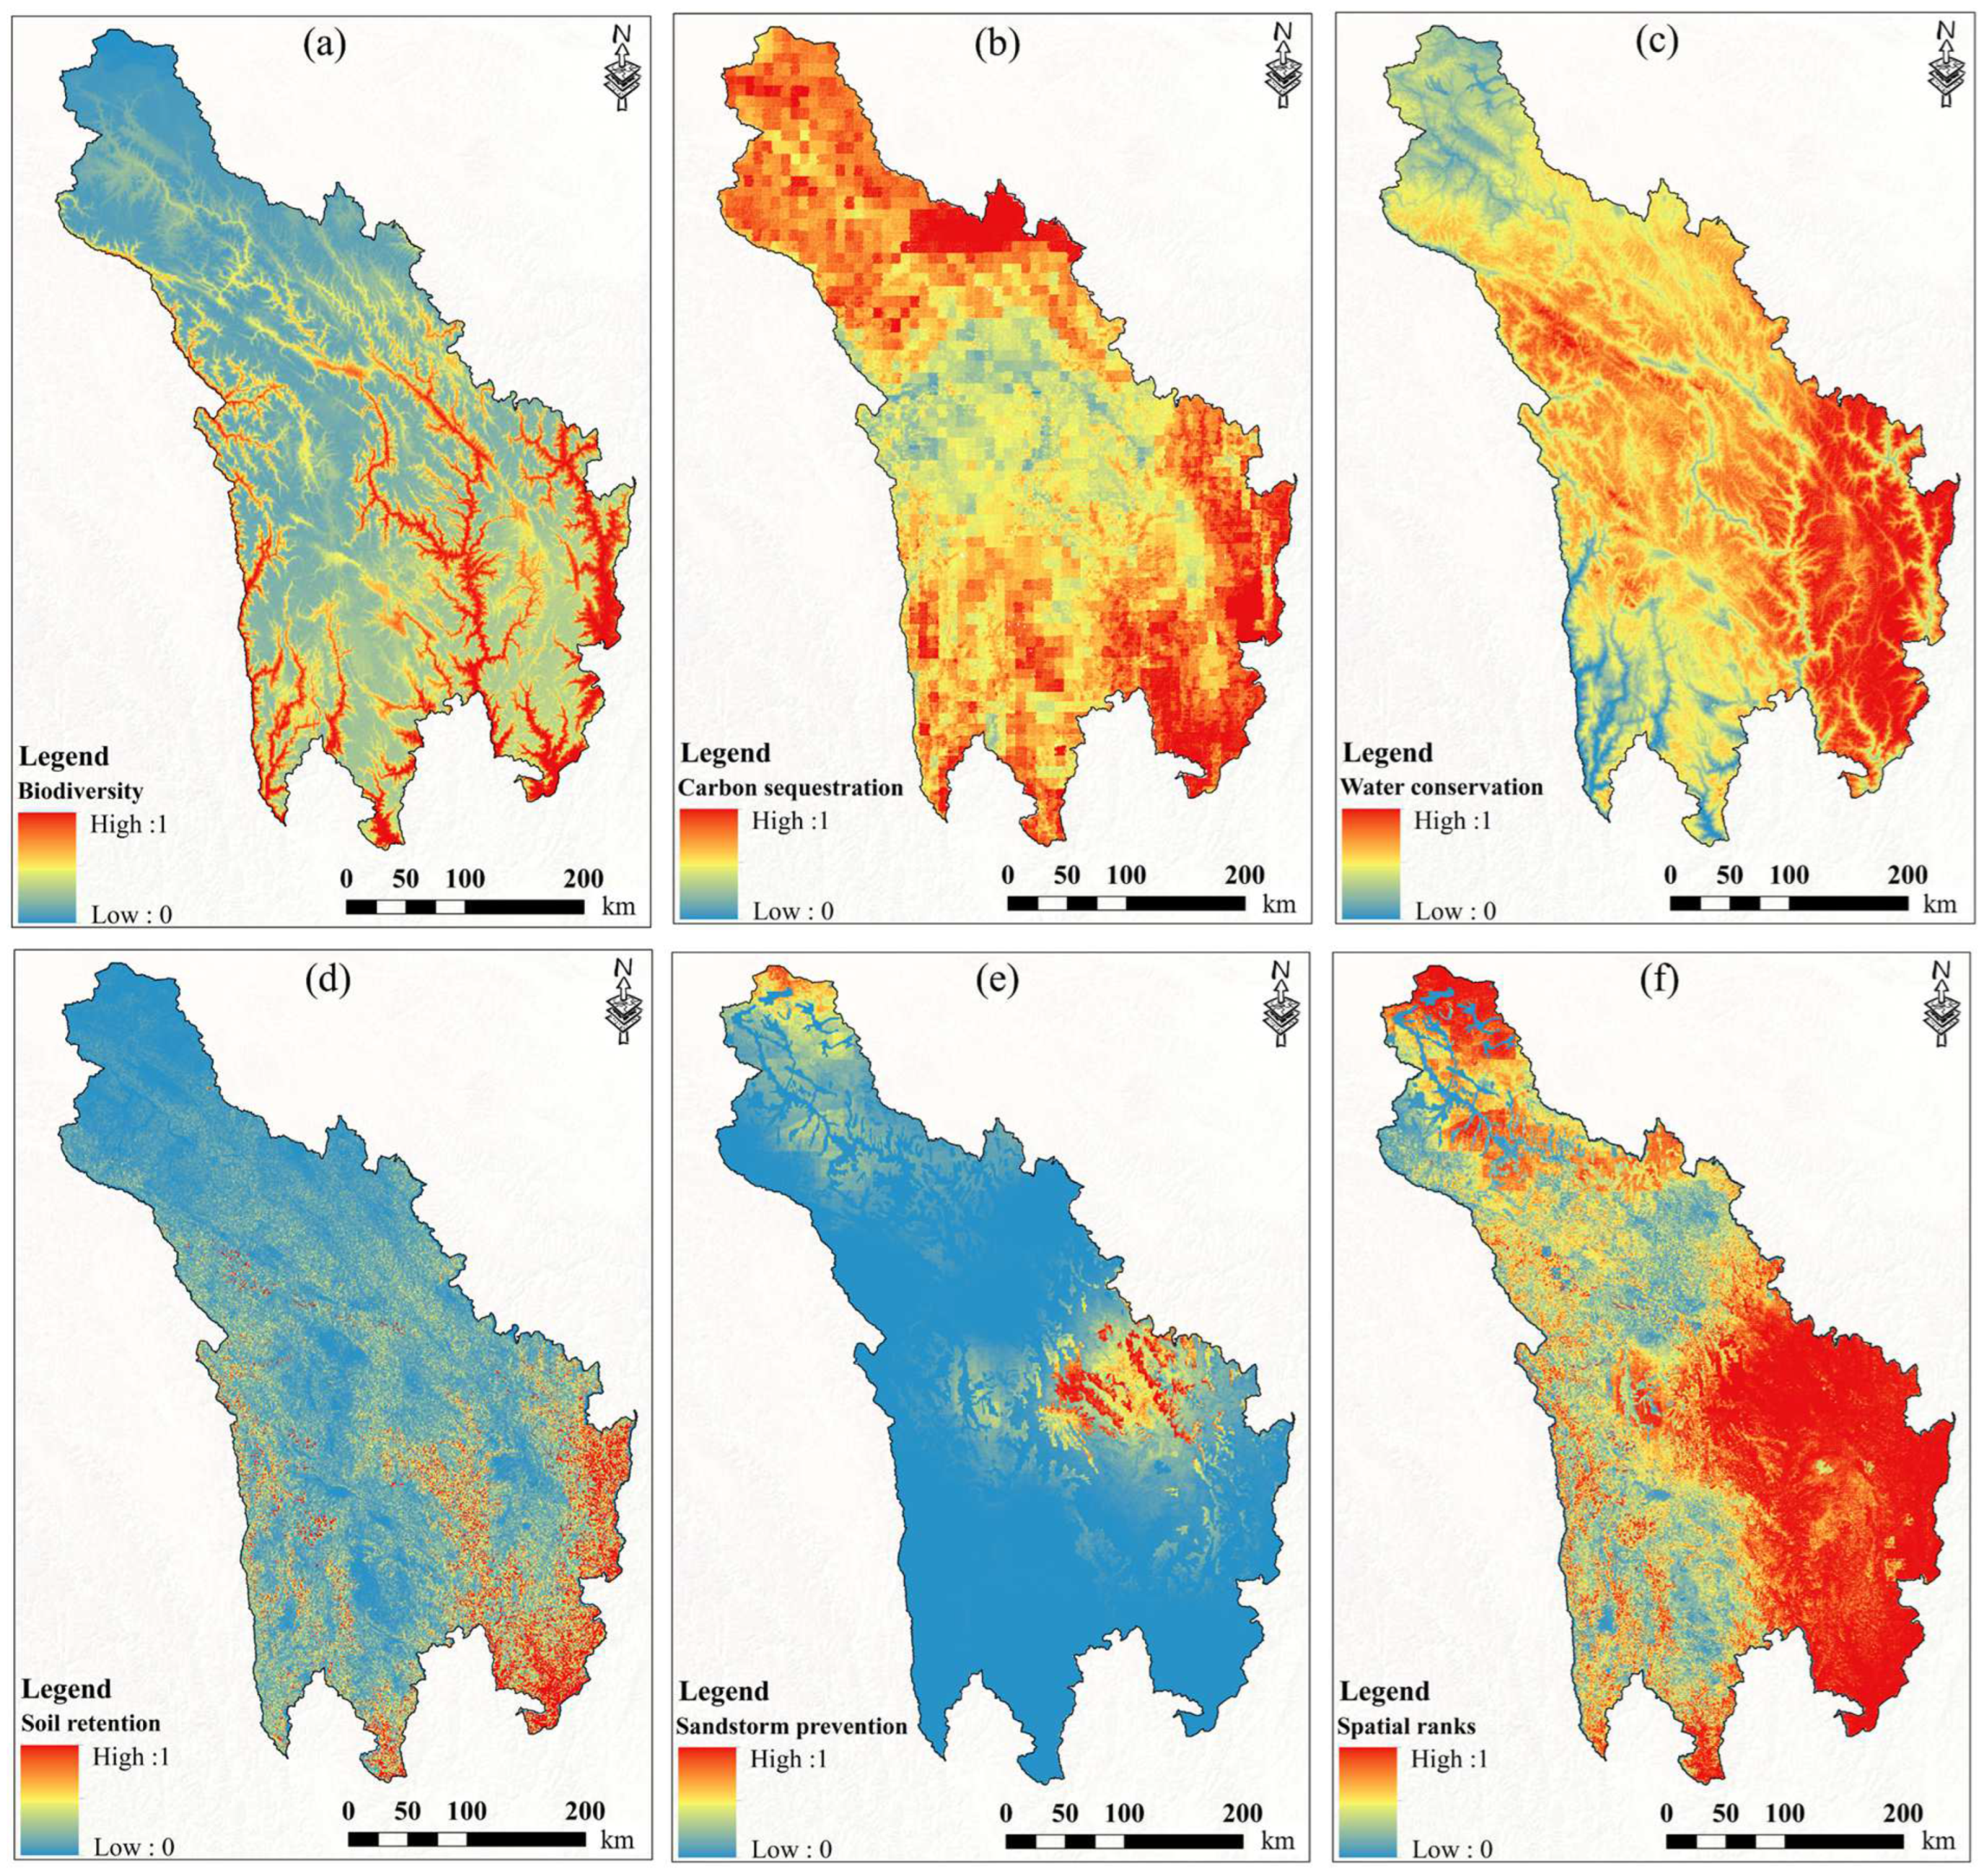
3.1. Spatial Distributions of Species Diversity and Ecosystem Services

There are high mismatches among species diversity, soil retention, carbon sequestration, water conservation, and sandstorm prevention (Figure 3a–e). The areas with high species diversity, determined by species richness of birds, mammals, and amphibians, are concentrated in the low-altitude valleys in the south. The ability of ecosystem carbon sequestration, including above- and below-ground biomass and soil organic matter, is high in the southeastern mountain forests and northern plateau grasslands. The areas with a high ability for both water conservation and soil retention are mainly located in the eastern mountains, which are covered by evergreen forests. The areas with high sand prevention are in the central and northern regions with expansive plateau grasslands.

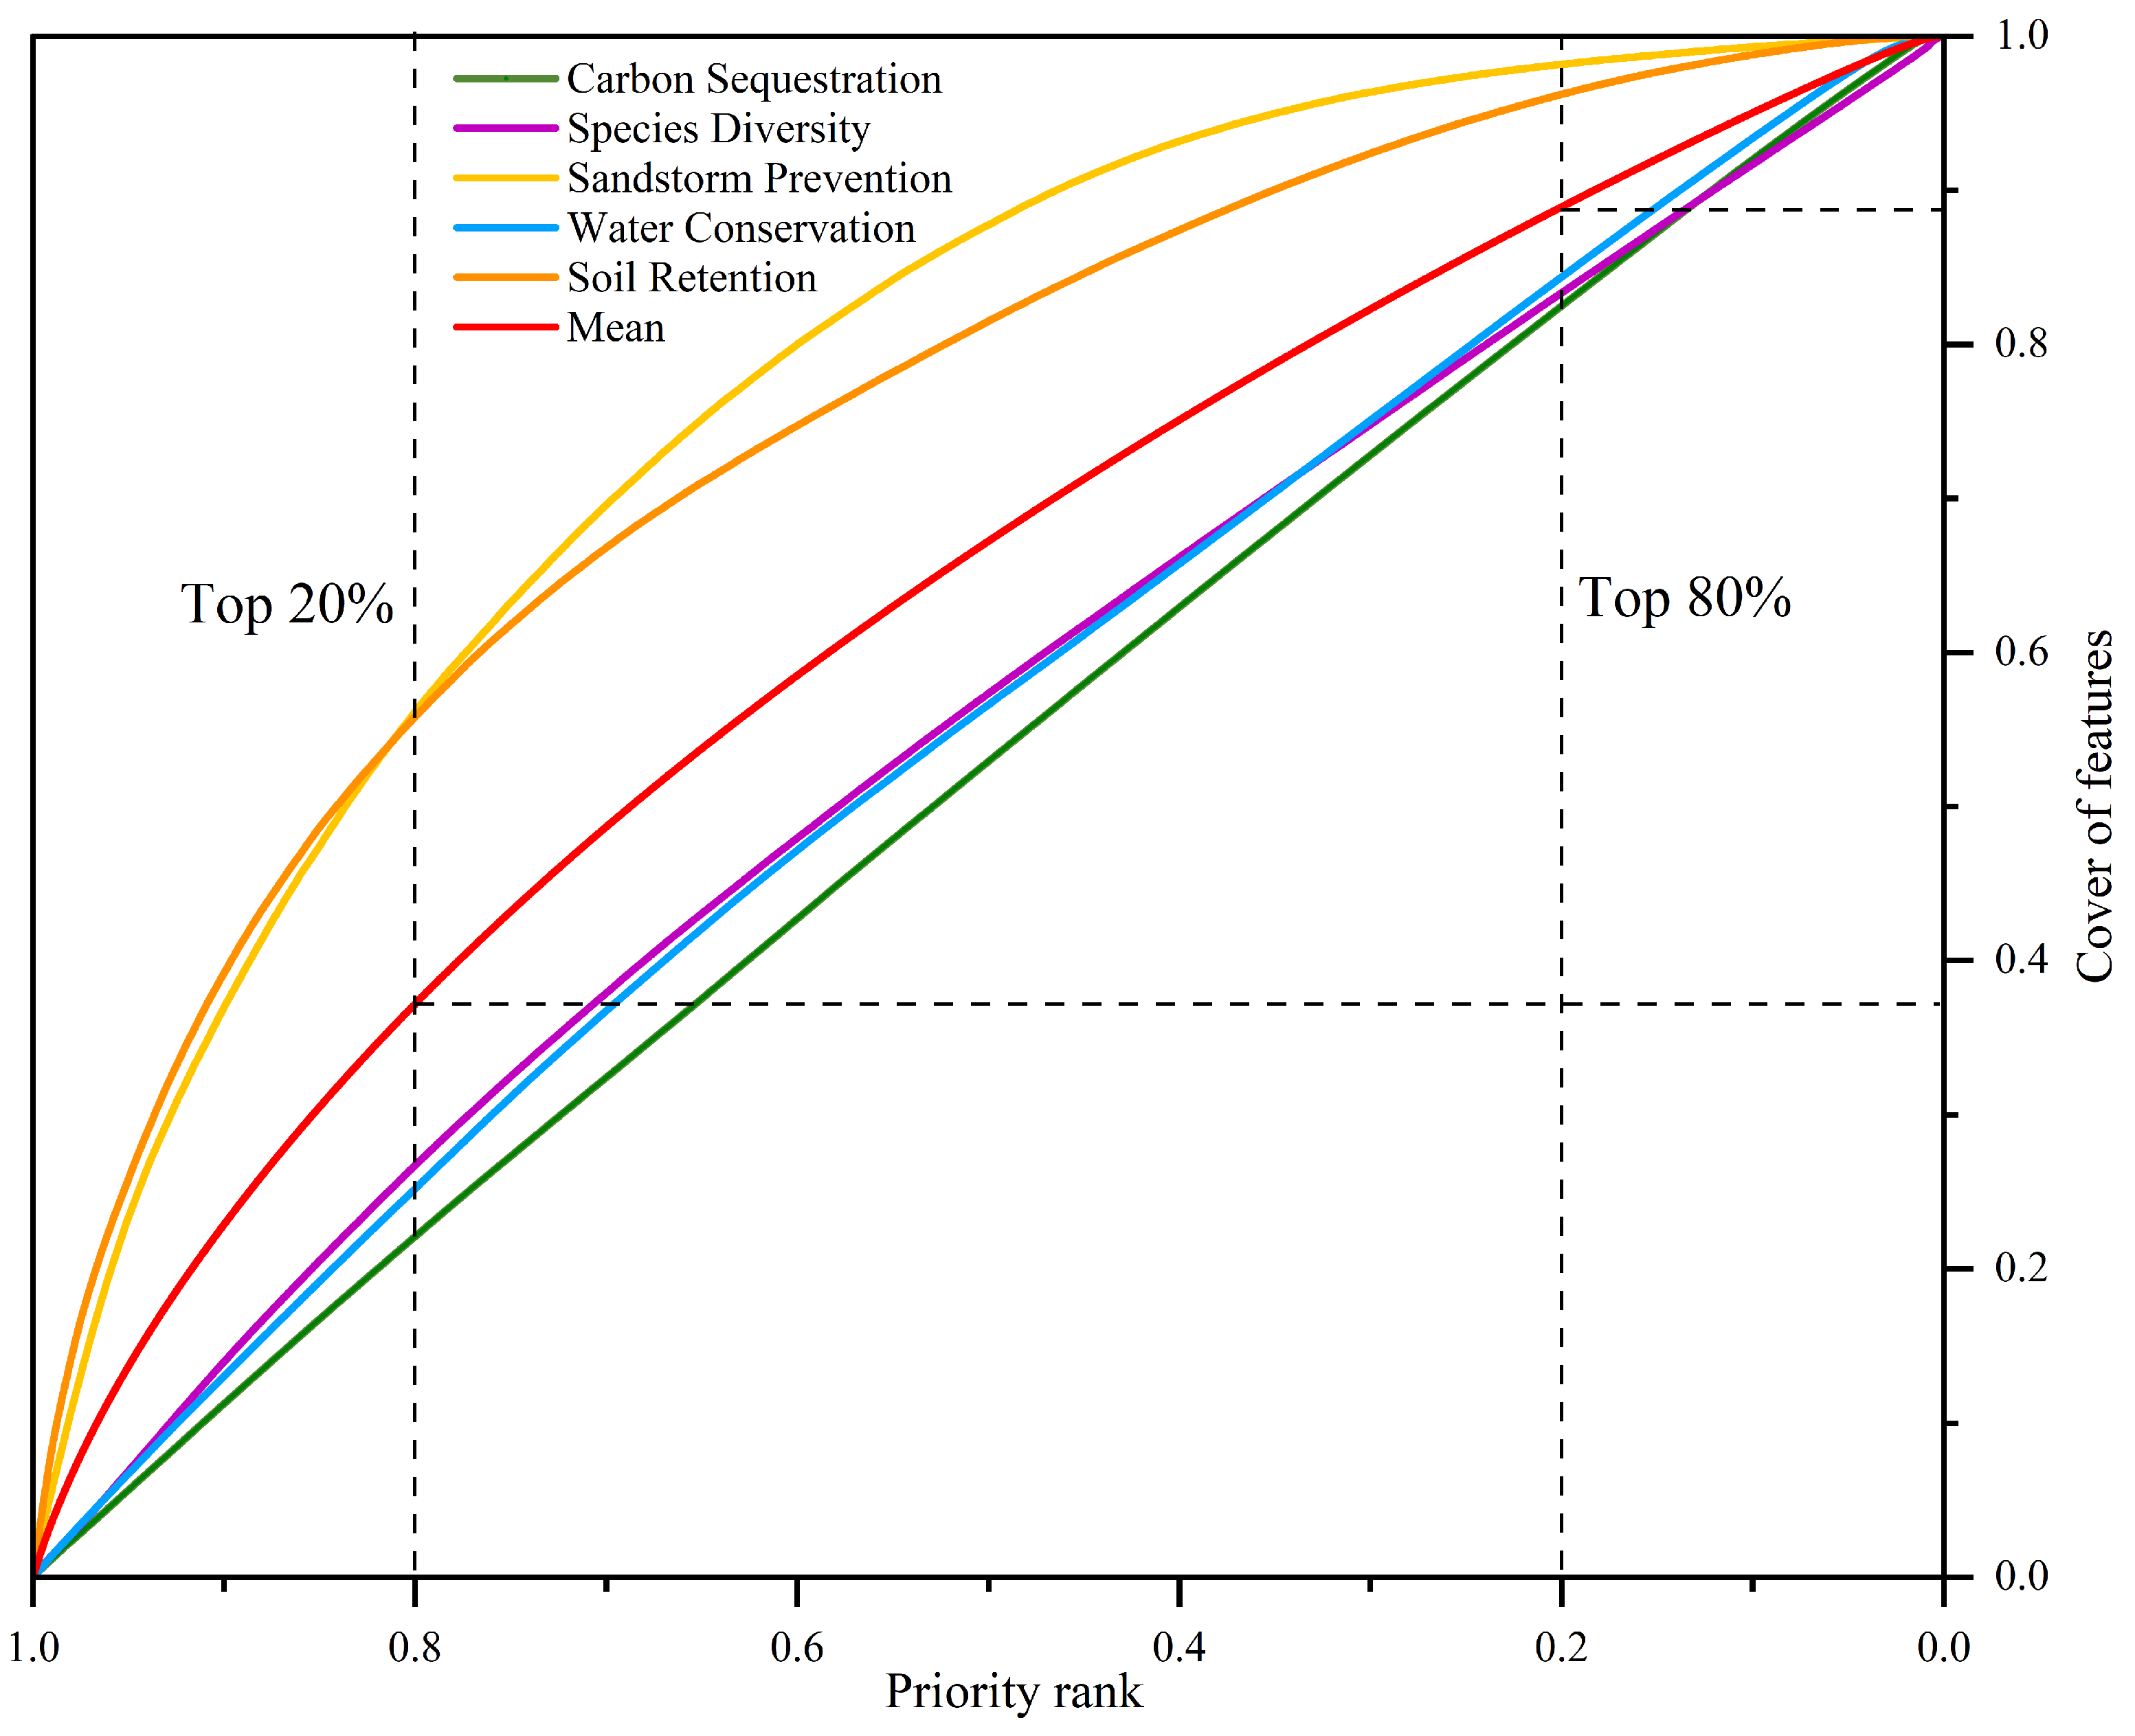
3.2. Spatial Ranking in Ecological Conservation Priority

Based on the spatial distributions of indicators for biodiversity and ecosystem services, the spatial ranking value of each grid produced by the Zonation model is high in the northern, east-central, and southeastern regions of Ganzi (Figure 3f). This map of priority rank can be paired with the performance curves, which quantify the increases in feature coverage with the increment of areas added from high to low priority (Figure 4). The overall increase rates in coverage with the proportion of conserved area differ among biodiversity and ecosystem services, higher for sandstorm prevention capacity and soil retention capacity and lower for species diversity, water conservation, and carbon sequestration capacity. The initial rate of increase in coverage reflects the capacity of high-ranking areas to conserve disproportionate high ecological priority units.

3.3. Priority Areas of Preservation and Restoration under Different Scenarios

In the total study area, the area distribution of different human footprint levels is basically normal; the area at the medium level (HFP 4–8) is the largest (49.6%, Table 2). Under the conservation target of 30%, the area of 45,531.9 km2 with the highest ecological importance is determined as the conservation priority, which is further delineated as the preservation priority areas (PPAs, 8714.2 km2, 19.1%) and the restoration priority areas (RPAs, 36,817.7 km2, 80.9%) according to human footprint level (HFP ≤ 4 or HFP > 4). PPAs and RPAs account for 5.7% and 24.3% of the total area of Ganzi and jointly account for 44.5% of the ECR area, which cover most of PPAs (5782.5 km2, 66.4%), while only 39.3% of RPAs (14,463.9 km2). Under the conservation target of 50%, half of Ganz (74,886.6 km2) with the highest ecological importance is determined as the conservation priority (PPAs, 11,308.1 km2, 15.1% vs. RPAs, 63,578.4 km2, 84.9%). PPAs and RPAs account for 7.5% and 42.3% of the total area of Ganzi and jointly account for 45.4% of the ECR area, which covers 68.0% of PPAs (7686.0 km2) and 41.1% of RPAs (26,349.9 km2) (Table 3; Figure 5). Compared with PPAs, there are more large continuous patches (>10 km2) within RPAs, and more of them are included in the ECR (Table 3).

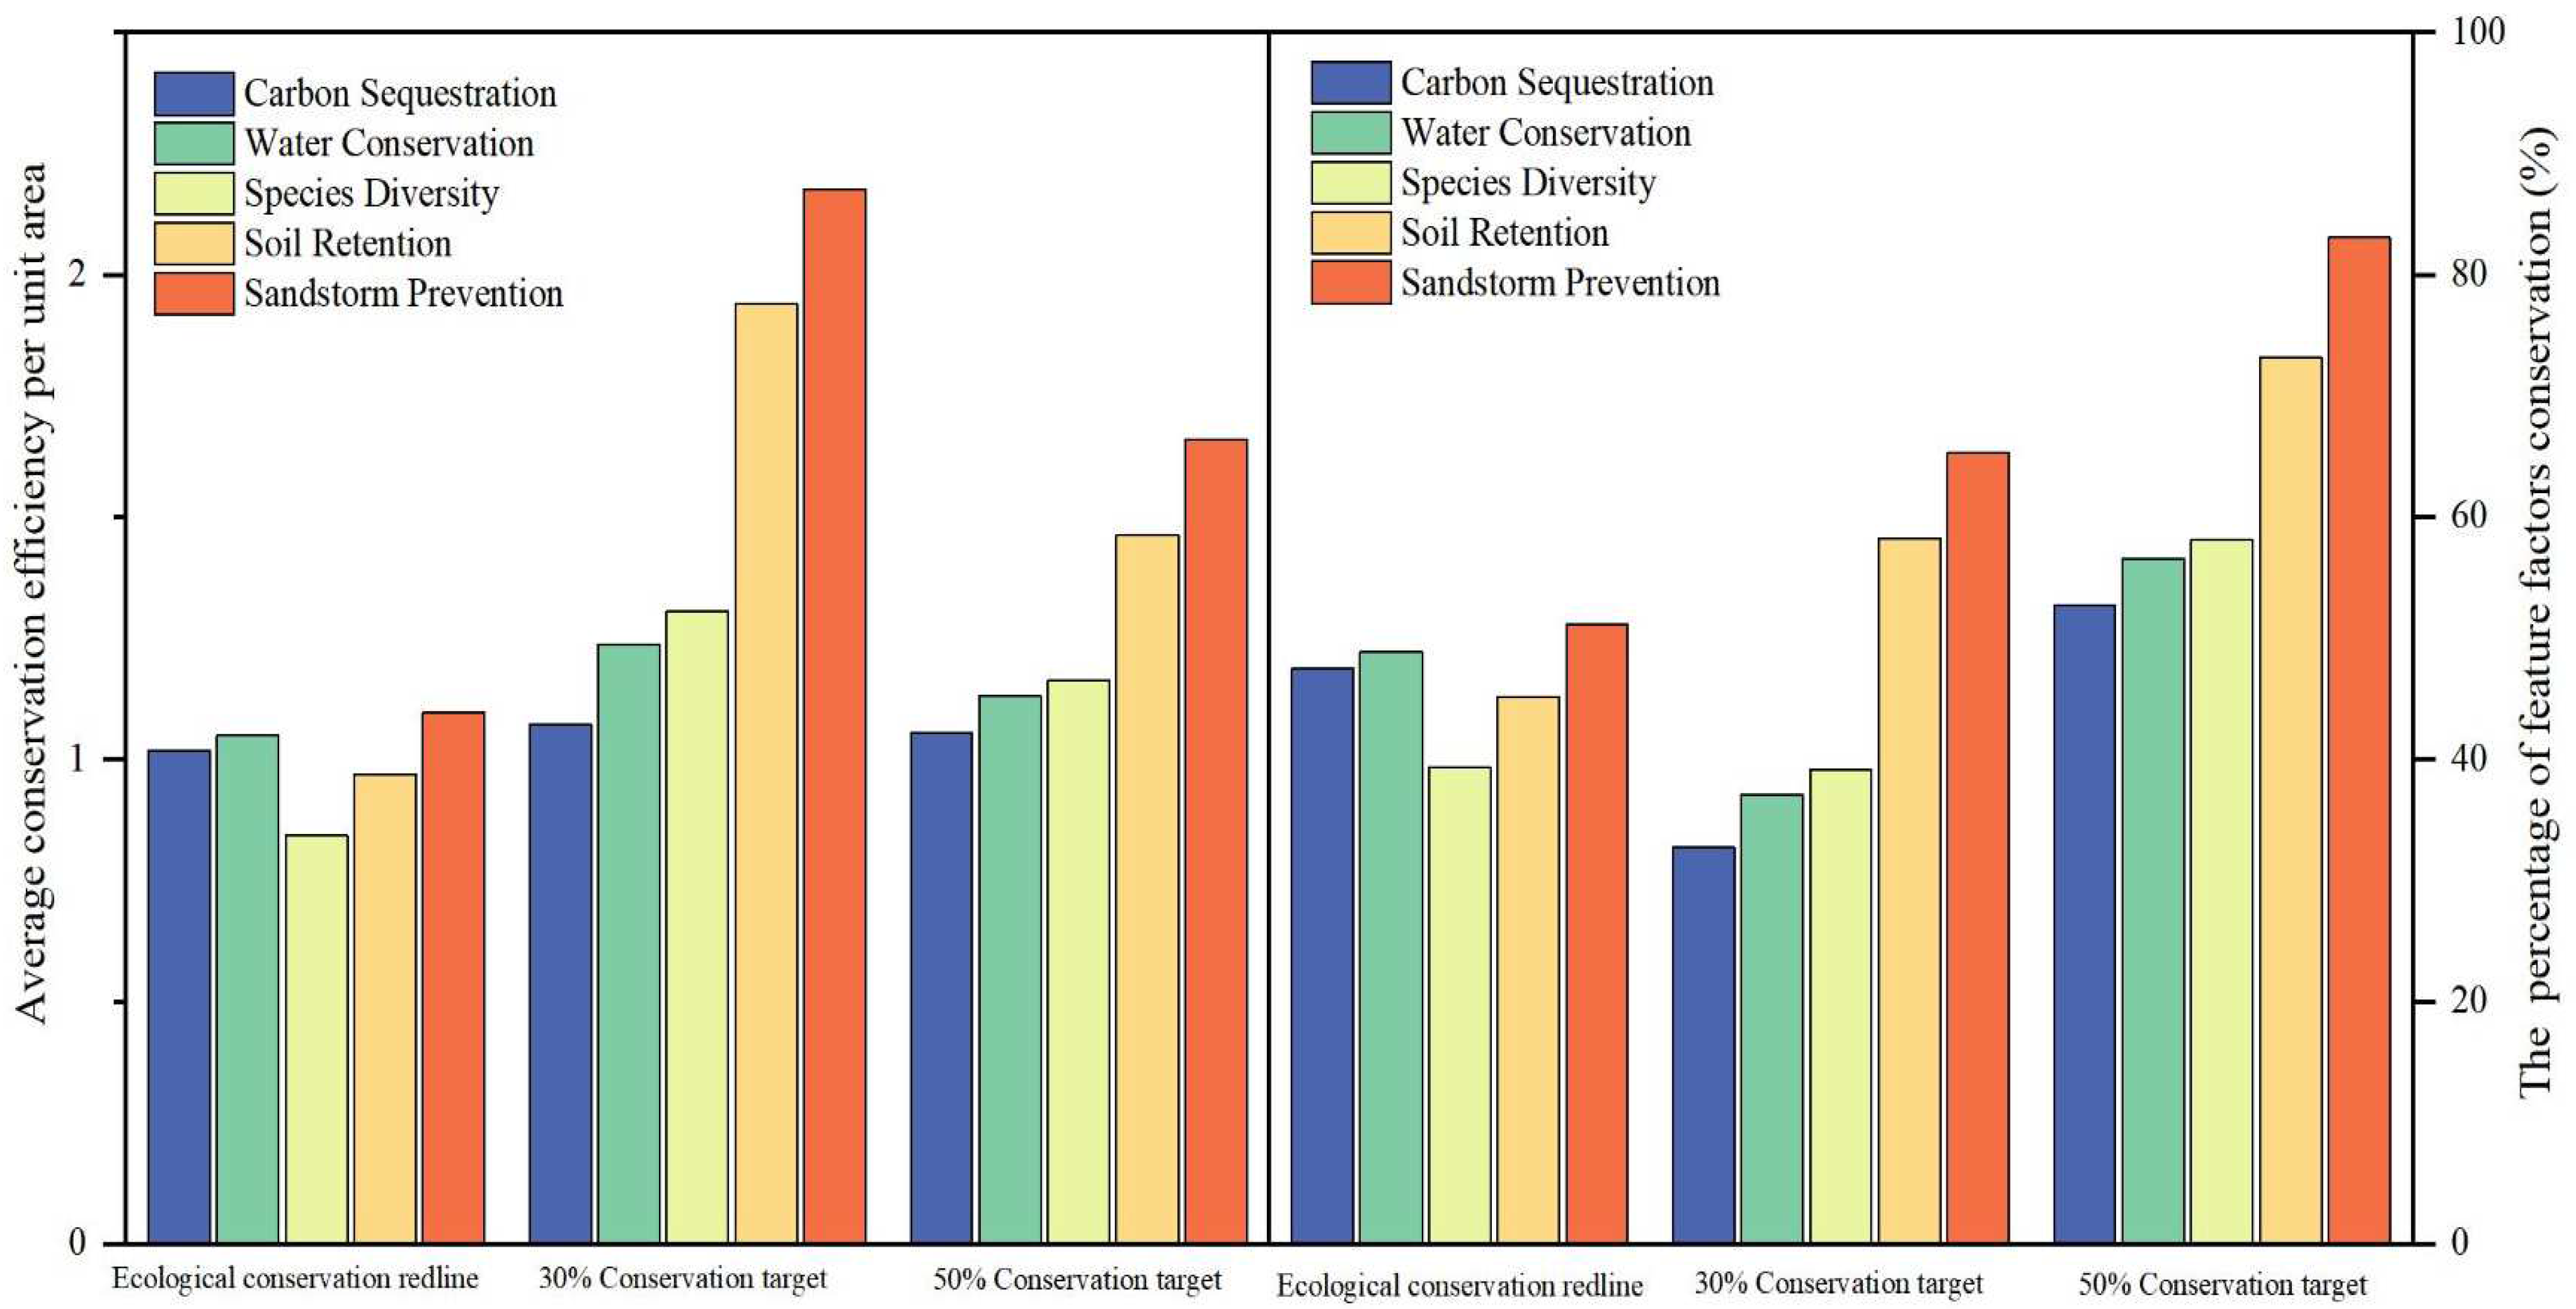
3.4. The Capability of Conservation Priority

The ECR area of 69,761.6 km2 accounts for 46.6% of the total area of the Ganzi Prefecture. The conserved percentage of species diversity (39.3%) and soil conservation (45.2%) is lower than the proportion of redline area, in contrast with those of carbon storage (47.4%), water conservation (48.9%), and sandstorm prevention (51.1%). The average conservation capacity of targets 30% and 50% is higher than the ECR, and the conservation capacity of sandstorm prevention capacity is the highest, while the conservation capacity of carbon sequestration is the lowest. In contrast to 50%, the 30% conservation target has higher conservation capacity per unit area because the overall level of ecological importance of the selected areas is higher (Figure 4, Figure 5 and Figure 6).

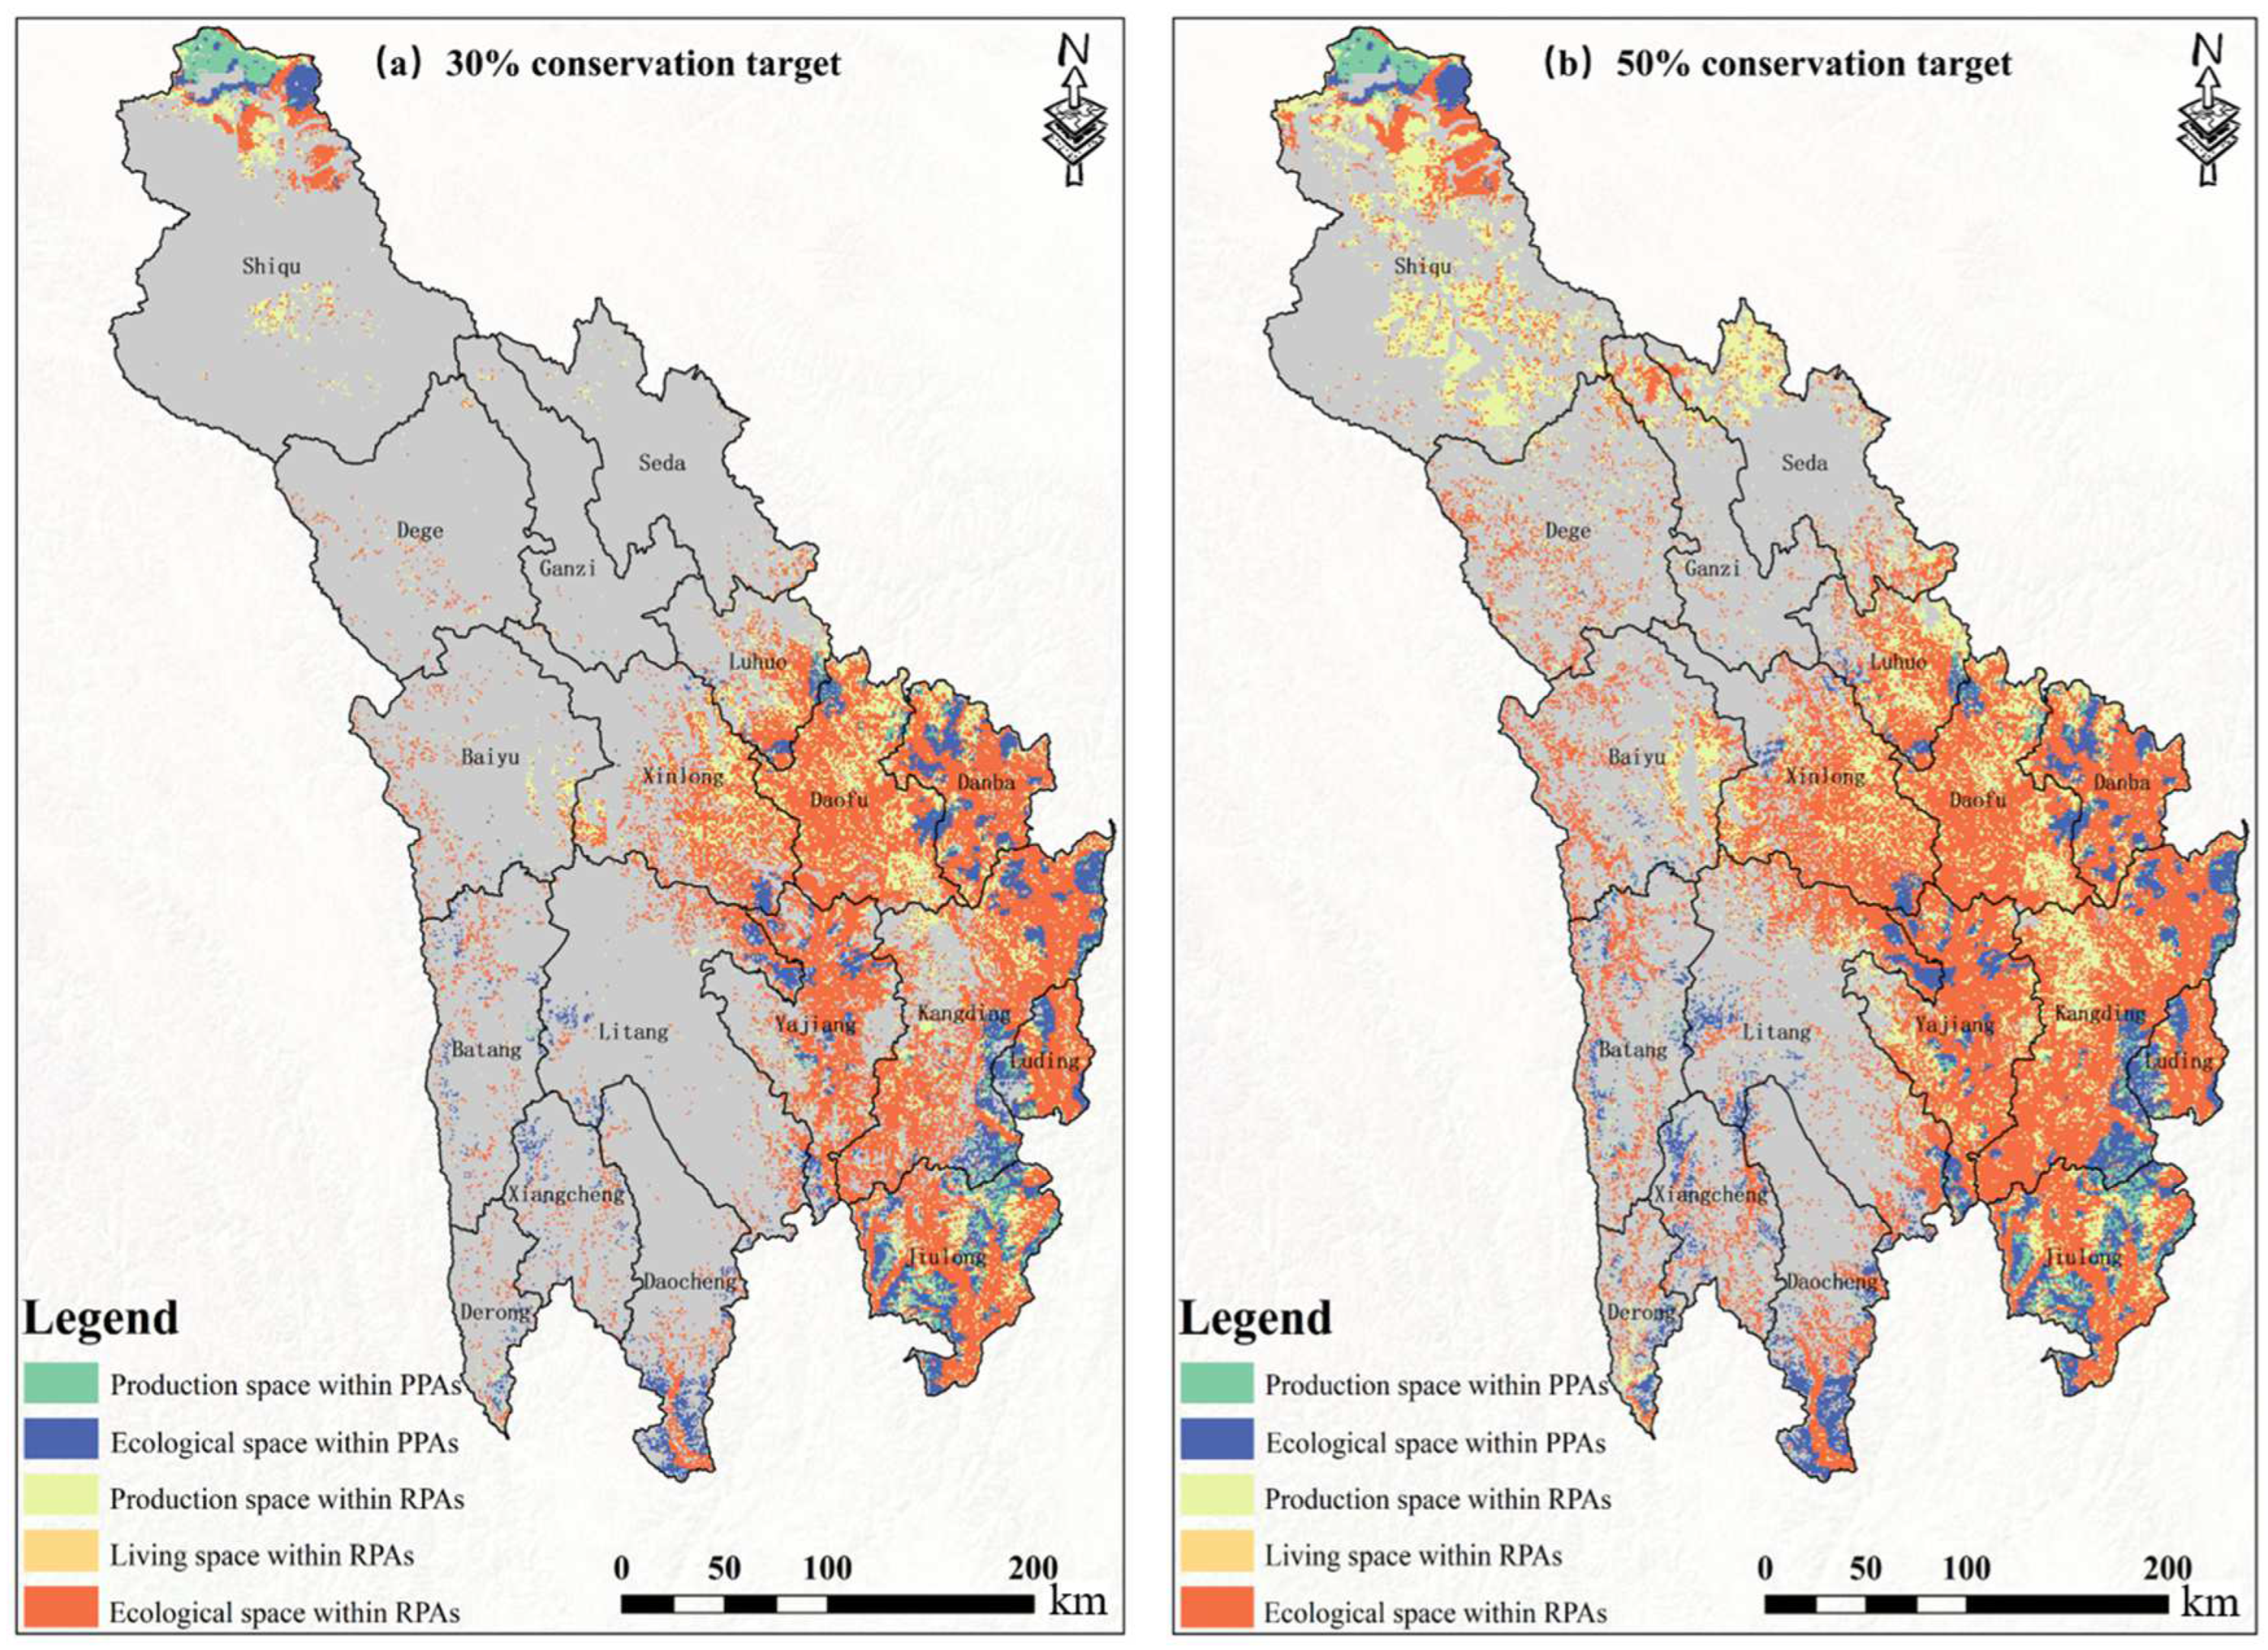
3.5. The Overlap of Conservation Priority Areas with PLES

The area of production, living, and ecological space in Ganzi is 57,468.3 km2, 219.9 km2, and 92,077.6 km2, accounting for 38.4%, 0.2%, and 61.4%, respectively. The ECR mainly consists of ecological space (44,310.3 km2, 48.1%) and production space (25,449.0 km2, 44.3%) (2.3 km2, 0.003%) (Table 4). In terms of the proportion of Ganzi, targets 30% and 50% cover more ecological space (37.2% and 56.0%) and living space (35.1% and 47.8%) than production space (19.5% and 40.5%), respectively. The majority of conservation priority areas are occupied by ecological space (75.2% and 68.8%) and production space (24.7% and 31.0%), and the proportion of living space is very low (0.2% and 0.1%). For PPAs, the proportions of each space under the targets 30% and 50% are similar, while for RPAs, 30% is targeted, which encompasses more ecological space (75.1% vs. 67.4%) and less production space (24.7% vs. 32.5%) than the 50% target (Table 5; Figure 7).

4. Discussion

4.1. The Importance of Distinguishing Priority Areas Separately for Preservation and Restoration

Restoration and preservation differ in terms of goals, approaches, ecological impacts, long-term sustainability, and ecosystem management applications [15,57,58,59]. Restoration aims to restore degraded, damaged, or destroyed ecosystems through active human intervention, with a focus on restoring ecosystem elements and dynamic processes [57], and may take considerable time and financial investment to conduct basic revegetation and remediation of pollutants [60]. Preservation, on the other hand, attempts to preserve intact habitats and the biodiversity and ecosystem services therein [13,59], and one of the main strategies is to establish protected areas [59,61]. For ecosystem management, the relative priority of preservation and restoration depends on their cost, benefit, and the different time lags inherent in the two actions [15,26,40]. In practice, preservation and restoration are often used as complementary tools for ecosystem management, and both are key components of conservation strategies aimed at optimizing biodiversity conservation or ecosystem service delivery [15,40]; there is an increasing interdisciplinary trend in the literature [58]. By overlaying the maps of comprehensive ecosystem importance, ECR, and human footprint, our approach integrates ecological, social, and economic factors simultaneously to determine preservation and restoration priority areas and provides a practical approach to guide ecological management at the regional scale [19,30].
Zonation [41] was used to rank all spatial units in the study area based on biodiversity and ecosystem services. This method has several advantages, including robustness to different ranges of values across input layers, excellent performance at 1 km resolutions, and an iterative process to rank all units through an iterative process during which the cumulative conservation value of the remaining units is calculated when one cell is excluded [30,41]. The final output of this procedure is an optimized map with units sorted according to relative priority values. Zonation allows us to obtain a synergistic and beneficial conservation plan in terms of cost and efficiency by considering the interaction of biodiversity and ecosystem services [41,62,63].
The application of different conservation targets provides insightful clues for adaptive conservation in the future [64]. According to the ecological importance of the study area in the world and China, this study adopted the target of 30% and the aggressive target of 50% (slightly higher than the ECR). Under both targets, the results show that less than half of the conservation priority areas are covered by the ECR. This is, of course, related to the technical differences between the current study and ECR, which takes the ecologically vulnerable areas into consideration. However, it is worth noting that only slightly more than 2/3 of PPAs are included in the ECR; meanwhile, the proportion of large patches (>10 km2) in the ECR is less than 70%. In addition, the results show that many ecologically important areas are facing high human stress. For instance, RPAs account for more than 80% of the total conservation priority areas under both targets, of which about 40% are within the ECR. It can be inferred that, except for preservation, ecological restoration is also an indispensable countermeasure for ecological conservation for ECR. All the results can provide important information for improving the rationale of ECR.
The use of human footprint level reflects the impact of humans in delineating priority areas for preservation and restoration, which facilitates the development of adaptive preservation and restoration strategies [53,65,66]. Human footprints aim to capture specific impacts of human activities on the natural environment and can be positioned within the spectrum of known environmental problems and control variables of planetary boundaries [65]. This indicates that human footprint level could be very useful for conservation, especially restoration. Although the human pressure index adopted in this paper is HFP, other indicators can also be used, such as the indices of ecological degradation [67]. Meanwhile, the priority areas for preservation and restoration can be further identified according to the levels of human stress and ecological degradation. This helps governors to formulate reasonable preservation and restoration strategies, avoiding “excessive restoration” to save social–economic resources and ensuring the long-term efficiency of conservation. Excessive restoration here refers to restoration efforts that go beyond the necessary or ethical boundaries, potentially leading to unnecessary costs and challenges. One can apply a much higher HFP value > 8 to conservation priorities in ecological space to produce conservative RPAs, which would be much smaller than that in the current study.

4.2. Implications for Systematic Conservation in Production–Living–Ecological Spaces (PLES)

Delineating the territorial space of ecosystems and their interactions into PLES is of great importance for systematic conservation and, thus, sustainable development of coupled human–nature systems [32,34,35,43]. Previous studies have shown that human-dominated ecosystems play important roles in biodiversity conservation and ecosystem services [31,38,56]. Production space refers to the land for agricultural, industrial, and commercial activities; living space refers to the land for urban and rural human settlement; and ecological space refers to the land for regulating, maintaining, and ensuring ecological security [32,34,35]. Identification of priority areas for preservation and restoration across PLES can help decision-makers develop space-specific plans to ensure the effectiveness of conservation efforts [32,33]. Therefore, recognizing that biodiversity and ecosystem services in production and living spaces are equally in need of conservation is important for achieving harmony between man and nature, which can only be achieved if we put humans back into the ecosystem, setting humans and nature as one entity, regarding mankind as part of nature. Therefore, overlaying the priority areas with the current production–living–ecological spaces can provide important clues for specific measures of preservation and restoration [32,34,35,37,68].
Our results show that the conservation priority areas with high ecological importance are not limited to ecological space but also in some production and living spaces. First, the proportion of production space reached 1/4 or more under either the targets 30% or 50%, especially within RPAs. The production space in Ganzi is mainly animal husbandry and agriculture, which are the major domains that will carry out preservation and restoration via sustainable development in the future [69,70]. Sustainable animal husbandry in alpine grasslands has environmental benefits such as improved nutrient cycling and increased biodiversity. Meanwhile, challenges such as increased workloads and financial constraints need to be addressed. Best practices include but are not limited to optimal stocking rates [67,71], integrated crop–livestock systems [72], and soil nutrient management [73]. Sustainable agriculture in mountain areas like Ganzi faces a shift from maintenance-oriented staple cereals to more intensive, diversified, and integrated forage crop–livestock systems. Combining traditional agricultural practices, such as highland barley with forestry and animal husbandry, can be adapted to promote sustainability [70]. This puts forward high requirements for adjusting development policies and strategies, rational and effective utilization of resources, strengthening supervision of arable land occupation, and ensuring regional food security. Secondly, compared with the ECR, the absolute area and relative proportion of production space under the 50% target scheme are lower, which, to a large extent, reduces the potential conflict between local residents’ production and ecological preservation or restoration. In addition, both targets of 30% and 50% identify more than 2000 km2 of living space in conservation priority areas, which provides an ideal space for the development of low ecological impact livestock and agriculture. Finally, although the absolute area is small, the living space with high ecological importance in Ganzi, including towns and villages, has a considerable proportion of RPAs. The ecological restoration under the premise of improving livability is worth studying.
In summary, there should be differences in the ways of preservation and restoration among PLES. The conservation objectives, ways, and concrete measures of the three types of space should be different [32]. The preservation and restoration of cultivated land in the production space should consider the conservation of ecosystem services and biodiversity on the basis of maintaining basic productivity. The ecological preservation and restoration of urban and town living spaces should meet the needs of current human activities and future development. The preservation and restoration of natural ecosystems is mainly aimed at the conservation of native vegetation, flora, fauna, and ecosystem services.

4.3. Application in Ecological Preservation and Restoration Planning

This study proposes a four-step coherent framework to delineate priority areas for both preservation and restoration while improvements can still be made for application.
Future work following this framework could consider complex relationships between biodiversity and ecosystem services. High levels of biodiversity are generally associated with high-quality and stable ecosystem services, indicating a synergistic relationship between biodiversity and ecosystem function [63]. Biodiversity loss is predicted to have significant impacts on ecosystem services as ecosystem services emerge from complex interactions between ecosystems, people, and technology [63,74]. In addition, there are also trade-offs and synergies between ecosystem services, and the relationship between biodiversity and ecosystem services varies across different spatial and temporal scales [63,74,75]. Integrating biodiversity, ecosystem function, and ecosystem service modeling can enhance policy development to meet sustainability goals [63]. For application, different weights can be assigned to each indicator of biodiversity and ecosystems according to the main ecological function in the study area so as to achieve the ecological conservation objectives in different regions [76].
The multifunctionality of the landscape may be used as the basis for delineating ecological preservation and priority areas in the future. Multifunctional landscapes involve diversified land use and complex landscape structures, catering to various stakeholder interests and providing a diverse set of goods and services [77,78]. Landscape multifunctionality contributes to sustainable development by improving regional human well-being but faces challenges such as vague concepts, rough measurement methods, and a lack of practical application [77,79,80,81]. Achieving landscape multifunctionality and sustainability requires deep system changes, collaboration between stakeholders, and the transition toward more sustainable land management practices [78]. Linking the concept of multifunctionality with the ecosystem services approach offers a promising avenue for producing scientific evidence to inform landscape planning, including ecological preservation and restoration [75,79,82].
A multi-phase evaluation should be carried out, and the spatial priority of the interested area should be reclassified accordingly; thus, the preservation and restoration priority areas should be dynamically adjusted. Regular assessment can find the problems existing in the ecosystem in a timely manner, supplement and update the existing conservation systems to ensure the accuracy and effectiveness of practices, and promote the development of the regional ecosystem towards upgrading or maintaining biodiversity and ecosystem services [83].

5. Conclusions

Human–nature harmony can only be achieved if we put people back into the ecosystem, unite people with nature, and treat people as part of nature. The production–living–ecological spaces (PLES) of the territory and the conservation priority areas for both preservation and restoration provide a crucial platform for developing adaptive ecosystem management strategies. This study developed a coherent framework to delineate priority areas for preservation and restoration across PLES with four steps: (1) mapping spatial distributions of biodiversity and ecosystem services, (2) ranking the relative importance of ecosystems across spaces, (3) delineating priority areas for preservation and restoration according to the human footprint and priority ranks, and (4) contrasting with current conservation networks and overlapping with PLES.
The framework was implemented in Ganzi, China, and the findings reveal that the areas of high biodiversity and ecosystem service hotspots do not overlap spatially. The regions with high conservation importance are predominantly located in Shiqu County, as well as in eight counties in Southeastern Ganzi (Xinlong, Luhuo, Daofu, Danba, Kangding, Yangjiang, Luding, and Jiulong).
Aiming to conserve 30% of the land area of Ganzi, this study delineated PPAs covering 8714.2 km2 and RPAs covering 36,817.7 km2. Additionally, under the objective of conserving 50% of the land area, PPAs were delineated to encompass 11,308.1 km2, and RPAs to cover 63,578.4 km2. The delineation of PPAs and RPAs offers valuable reference information for developing ecological conservation strategies in Ganzi. Within PPAs, it is recommended to minimize engineering interventions to leverage the natural recovery capabilities of ecosystems. Conversely, in RPAs, tailored auxiliary measures should be implemented according to local conditions to aid in the restoration of degraded ecosystems.
Upon comparing the priority areas under 30% or 50% conservation targets established in this study with the existing Ecological Conservation Redline (ECR) delineated under current policy, it is evident that the areas identified in this research can serve as a foundation for refining the existing ECR. By integrating the delineation outcomes of this study with the PLES of Ganzi, it was observed that numerous ecologically significant areas persist within human-dominated production and living spaces. This finding underscores the importance of implementing urban eco-environmental conservation measures and highlights the necessity of developing sustainable agriculture and animal husbandry practices as integral components of ecosystem conservation.
Despite its contributions, this research is not without its constraints. The socio-economic challenges in Ganzi present significant obstacles to conservation efforts. The precision of the delineation and the practical application of this study could be enhanced with the availability of detailed data at local scales. Furthermore, the choice of characterization factors and the allocation of their weights should be adaptable to the specific conditions and objectives of the study area. In this work, we treated all characterization factors equally and assigned them equal weights, primarily because each aspect of biodiversity and ecosystem services in Ganzi is deemed to be of roughly equal significance. However, it is important to note that altering the selection of characterization factors and their weight distribution can lead to different outcomes. This flexibility in adjusting characterization factors and their weights could be particularly useful when there is a need to balance and negotiate among various ecosystem services. Future studies should explore the applicability of the proposed framework in diverse regions with varied ecosystems to establish a more universally applicable approach.

Author Contributions

Conceptualization, S.C. and X.D.; methodology, S.C. and X.D.; software, L.W.; validation, Q.C. and X.D.; formal analysis, S.C. and X.D.; investigation, K.Z., X.Z., X.D. and S.C.; resources, L.W.; data curation, L.W.; writing—original draft preparation, Z.H. and X.D.; writing—review and editing, S.C., K.Z. and X.D.; visualization, Z.H.; supervision, L.W. All authors have read and agreed to the published version of the manuscript.

Funding

This research was funded by the 2022 Baiyu County township teritorial space planning project [AH2022-0307] and Baiyu County teritorial space ecological restoration planning [AH2023-0193].

Institutional Review Board Statement

Not applicable.

Informed Consent Statement

Not applicable.

Data Availability Statement

The raw data supporting the conclusions of this article will be made available by the authors upon request.

Conflicts of Interest

Author Zengjing Huangwas employed by the company Comprehensive Law Enforcement Brigade for Ecological and Environmental Protection. The remaining authors declare that the research was conducted in the absence of any commercial or financial relationships that could be construed as a potential conflict of interest.

References

  1. Liu, J.; Dietz, T.; Carpenter, S.R.; Alberti, M.; Folke, C.; Moran, E.; Pell, A.N.; Deadman, P.; Kratz, T.; Lubchenco, J.; et al. Complexity of Coupled Human and Natural Systems. Science 2007, 317, 1513–1516. Available online: https://www.jstor.org/stable/20037795 (accessed on 10 August 2023). [CrossRef] [PubMed]
  2. Tian, Y.; Jiang, G.; Zhou, D.; Li, G. Systematically Addressing the Heterogeneity in the Response of Ecosystem Services to Agricultural Modernization, Industrialization and Urbanization in the Qinghai-Tibetan Plateau from 2000 to 2018. J. Clean. Prod. 2021, 285, 125323. [Google Scholar] [CrossRef]
  3. Munang, R.; Thiaw, I.; Alverson, K.; Mumba, M.; Liu, J.; Rivington, M. Climate Change and Ecosystem-Based Adaptation: A New Pragmatic Approach to Buffering Climate Change Impacts. Curr. Opin. Environ. Sustain. 2013, 5, 67–71. [Google Scholar] [CrossRef]
  4. Naeem, S.; Chazdon, R.; Duffy, J.E.; Prager, C.; Worm, B. Biodiversity and Human Well-Being: An Essential Link for Sustainable Development. Proc. R. Soc. B Biol. Sci. 2016, 283, 20162091. [Google Scholar] [CrossRef] [PubMed]
  5. Cook-Patton, S.C.; Drever, C.R.; Griscom, B.W.; Hamrick, K.; Hardman, H.; Kroeger, T.; Pacheco, P.; Raghav, S.; Stevenson, M.; Webb, C.; et al. Protect, Manage and Then Restore Lands for Climate Mitigation. Nat. Clim. Chang. 2021, 11, 1027–1034. [Google Scholar] [CrossRef]
  6. Strategic Plan for Biodiversity 2011–2020, Including Aichi Biodiversity Targets. Available online: https://www.cbd.int/sp (accessed on 10 August 2023).
  7. Maxwell, S.L.; Cazalis, V.; Dudley, N.; Hoffmann, M.; Rodrigues, A.S.L.; Stolton, S.; Visconti, P.; Woodley, S.; Kingston, N.; Lewis, E.; et al. Area-Based Conservation in the Twenty-First Century. Nature 2020, 586, 217–227. [Google Scholar] [CrossRef]
  8. Gatiso, T.T.; Kulik, L.; Bachmann, M.; Bonn, A.; Bösch, L.; Eirdosh, D.; Freytag, A.; Hanisch, S.; Heurich, M.; Sop, T.; et al. Effectiveness of Protected Areas Influenced by Socio-Economic Context. Nat. Sustain. 2022, 5, 861–868. [Google Scholar] [CrossRef]
  9. Strassburg, B.B.N.; Iribarrem, A.; Beyer, H.L.; Cordeiro, C.L.; Crouzeilles, R.; Jakovac, C.C.; Braga Junqueira, A.; Lacerda, E.; Latawiec, A.E.; Balmford, A.; et al. Global Priority Areas for Ecosystem Restoration. Nature 2020, 586, 724–729. [Google Scholar] [CrossRef]
  10. Bongaarts, J. IPBES, 2019. Summary for Policymakers of the Global Assessment Report on Biodiversity and Ecosystem Services of the Intergovernmental Science-Policy Platform on Biodiversity and Ecosystem Services. Popul. Dev. Rev. 2019, 45, 680–681. [Google Scholar] [CrossRef]
  11. UNEP. Kunming-Montreal Global Biodiversity Framework. Available online: http://www.unep.org/resources/kunming-montreal-global-biodiversity-framework (accessed on 10 August 2023).
  12. Dinerstein, E.; Vynne, C.; Sala, E.; Joshi, A.R.; Fernando, S.; Lovejoy, T.E.; Mayorga, J.; Olson, D.; Asner, G.P.; Baillie, J.E.M.; et al. A Global Deal for Nature: Guiding Principles, Milestones, and Targets. Sci. Adv. 2019, 5, eaaw2869. [Google Scholar] [CrossRef]
  13. Bai, Y.; Zhuang, C.; Ouyang, Z.; Zheng, H.; Jiang, B. Spatial Characteristics between Biodiversity and Ecosystem Services in a Human-Dominated Watershed. Ecol. Complex. 2011, 8, 177–183. [Google Scholar] [CrossRef]
  14. Cardinale, B.J.; Duffy, J.E.; Gonzalez, A.; Hooper, D.U.; Perrings, C.; Venail, P.; Narwani, A.; Mace, G.M.; Tilman, D.; Wardle, D.A.; et al. Biodiversity Loss and Its Impact on Humanity. Nature 2012, 486, 59–67. [Google Scholar] [CrossRef] [PubMed]
  15. Possingham, H.P.; Bode, M.; Klein, C.J. Optimal Conservation Outcomes Require Both Restoration and Protection. PLoS Biol. 2015, 13, e1002052. [Google Scholar] [CrossRef]
  16. Brooks, T.M.; Mittermeier, R.A.; da Fonseca, G.A.B.; Gerlach, J.; Hoffmann, M.; Lamoreux, J.F.; Mittermeier, C.G.; Pilgrim, J.D.; Rodrigues, A.S.L. Global Biodiversity Conservation Priorities. Science 2006, 313, 58–61. [Google Scholar] [CrossRef] [PubMed]
  17. Pollock, L.J.; Thuiller, W.; Jetz, W. Large Conservation Gains Possible for Global Biodiversity Facets. Nature 2017, 546, 141–144. [Google Scholar] [CrossRef] [PubMed]
  18. Belote, R.T.; Barnett, K.; Dietz, M.S.; Burkle, L.; Jenkins, C.N.; Dreiss, L.; Aycrigg, J.L.; Aplet, G.H. Options for Prioritizing Sites for Biodiversity Conservation with Implications for “30 by 30”. Biol. Conserv. 2021, 264, 109378. [Google Scholar] [CrossRef]
  19. Castillo-Mandujano, J.; Smith-Ramírez, C. The Need for Holistic Approach in the Identification of Priority Areas to Restore: A Review. Restor. Ecol. 2022, 30, e13637. [Google Scholar] [CrossRef]
  20. Jung, M.; Arnell, A.; de Lamo, X.; García-Rangel, S.; Lewis, M.; Mark, J.; Merow, C.; Miles, L.; Ondo, I.; Pironon, S.; et al. Areas of Global Importance for Conserving Terrestrial Biodiversity, Carbon and Water. Nat. Ecol. Evol. 2021, 5, 1499–1509. [Google Scholar] [CrossRef] [PubMed]
  21. Mitchell, M.G.E.; Schuster, R.; Jacob, A.L.; Hanna, D.E.L.; Dallaire, C.O.; Raudsepp-Hearne, C.; Bennett, E.M.; Lehner, B.; Chan, K.M.A. Identifying Key Ecosystem Service Providing Areas to Inform National-Scale Conservation Planning. Environ. Res. Lett. 2021, 16, 014038. [Google Scholar] [CrossRef]
  22. Wilson, K.A.; Underwood, E.C.; Morrison, S.A.; Klausmeyer, K.R.; Murdoch, W.W.; Reyers, B.; Wardell-Johnson, G.; Marquet, P.A.; Rundel, P.W.; McBride, M.F.; et al. Conserving Biodiversity Efficiently: What to Do, Where, and When. PLoS Biol. 2007, 5, e223. [Google Scholar] [CrossRef]
  23. Balvanera, P.; Daily, G.C.; Ehrlich, P.R.; Ricketts, T.H.; Bailey, S.-A.; Kark, S.; Kremen, C.; Pereira, H. Conserving Biodiversity and Ecosystem Services. Science 2001, 291, 2047. [Google Scholar] [CrossRef]
  24. Egoh, B.; Reyers, B.; Rouget, M.; Richardson, D.M.; Le Maitre, D.C.; van Jaarsveld, A.S. Mapping Ecosystem Services for Planning and Management. Agric. Ecosyst. Environ. 2008, 127, 135–140. [Google Scholar] [CrossRef]
  25. Hiers, J.K.; Jackson, S.T.; Hobbs, R.J.; Bernhardt, E.S.; Valentine, L.E. The Precision Problem in Conservation and Restoration. Trends Ecol. Evol. 2016, 31, 820–830. [Google Scholar] [CrossRef] [PubMed]
  26. Strassburg, B.B.N.; Beyer, H.L.; Crouzeilles, R.; Iribarrem, A.; Barros, F.; de Siqueira, M.F.; Sánchez-Tapia, A.; Balmford, A.; Sansevero, J.B.B.; Brancalion, P.H.S.; et al. Strategic Approaches to Restoring Ecosystems Can Triple Conservation Gains and Halve Costs. Nat. Ecol. Evol. 2019, 3, 62–70. [Google Scholar] [CrossRef]
  27. Gao, C.; Pan, H.; Wang, M.; Zhang, T.; He, Y.; Cheng, J.; Yao, C. Identifying Priority Areas for Ecological Conservation and Restoration Based on Circuit Theory and Dynamic Weighted Complex Network: A Case Study of the Sichuan Basin. Ecol. Indic. 2023, 155, 111064. [Google Scholar] [CrossRef]
  28. Lortie, C.J. A Comment on the Protect–Manage–Then-Restore Workflow. Restor. Ecol. 2023, 31, e13666. [Google Scholar] [CrossRef]
  29. Turner, W.R.; Brandon, K.; Brooks, T.M.; Costanza, R.; da Fonseca, G.A.B.; Portela, R. Global Conservation of Biodiversity and Ecosystem Services. BioScience 2007, 57, 868–873. [Google Scholar] [CrossRef]
  30. Srivathsa, A.; Vasudev, D.; Nair, T.; Chakrabarti, S.; Chanchani, P.; DeFries, R.; Deomurari, A.; Dutta, S.; Ghose, D.; Goswami, V.R.; et al. Prioritizing India’s Landscapes for Biodiversity, Ecosystem Services and Human Well-Being. Nat. Sustain. 2023, 6, 568–577. [Google Scholar] [CrossRef]
  31. Morrison, S.A. A Framework for Conservation in a Human-Dominated World. Conserv. Biol. 2015, 29, 960–964. [Google Scholar] [CrossRef] [PubMed]
  32. Fu, B.; Liu, Y.; Meadows, M.E. Ecological Restoration for Sustainable Development in China. Natl. Sci. Rev. 2023, 10, nwad033. [Google Scholar] [CrossRef]
  33. Fu, X.; Wang, X.; Zhou, J.; Ma, J. Optimizing the Production-Living-Ecological Space for Reducing the Ecosystem Services Deficit. Land 2021, 10, 1001. [Google Scholar] [CrossRef]
  34. Fu, B. Several Key Points in Territorial Ecological Restoration. Bull. Chin. Acad. Sci. 2021, 36, 64–69. [Google Scholar] [CrossRef]
  35. Fu, J.; Bu, Z.; Jiang, D.; Lin, G.; Li, X. Sustainable Land Use Diagnosis Based on the Perspective of Production–Living–Ecological Spaces in China. Land Use Policy 2022, 122, 106386. [Google Scholar] [CrossRef]
  36. Martin, D.M. Ecological Restoration Should Be Redefined for the Twenty-First Century. Restor. Ecol. 2017, 25, 668–673. [Google Scholar] [CrossRef] [PubMed]
  37. Lin, Z.; Wu, T.; Xiao, Y.; Rao, E.; Shi, X.; Ouyang, Z. Protecting Biodiversity to Support Ecosystem Services: An Analysis of Trade-Offs and Synergies in Southwestern China. J. Appl. Ecol. 2022, 59, 2440–2451. [Google Scholar] [CrossRef]
  38. Wang, X.; Yang, C.; Qiao, H.; Hu, J. More than Two-Fifths of the Protected Land in a Global Biodiversity Hotspot in Southwest China Is under Intense Human Pressure. Sci. Total. Environ. 2024, 906, 167283. [Google Scholar] [CrossRef] [PubMed]
  39. Hu, J.; Zhou, Q.; Cao, Q.; Hu, J. Effects of Ecological Restoration Measures on Vegetation and Soil Properties in Semi-Humid Sandy Land on the Southeast Qinghai-Tibetan Plateau, China. Glob. Ecol. Conserv. 2022, 33, e02000. [Google Scholar] [CrossRef]
  40. Jurjonas, M.; May, C.A.; Cardinale, B.; Kyriakakis, S.; Pearsall, D.R.; Doran, P.J. The Perceived Ecological and Human Well-Being Benefits of Ecosystem Restoration. People Nat. 2024, 6, 4–19. [Google Scholar] [CrossRef]
  41. Moilanen, A.; Lehtinen, P.; Kohonen, I.; Jalkanen, J.; Virtanen, E.A.; Kujala, H. Novel Methods for Spatial Prioritization with Applications in Conservation, Land Use Planning and Ecological Impact Avoidance. Methods Ecol. Evol. 2022, 13, 1062–1072. [Google Scholar] [CrossRef]
  42. Dinerstein, E.; Olson, D.; Joshi, A.; Vynne, C.; Burgess, N.D.; Wikramanayake, E.; Hahn, N.; Palminteri, S.; Hedao, P.; Noss, R.; et al. An Ecoregion-Based Approach to Protecting Half the Terrestrial Realm. BioScience 2017, 67, 534–545. [Google Scholar] [CrossRef]
  43. Peng, J.; Tian, L.; Zhang, Z.; Zhao, Y.; Green, S.M.; Quine, T.A.; Liu, H.; Meersmans, J. Distinguishing the Impacts of Land Use and Climate Change on Ecosystem Services in a Karst Landscape in China. Ecosyst. Serv. 2020, 46, 101199. [Google Scholar] [CrossRef]
  44. Wang, M.; Li, Z.; Chen, S.; Xiang, B.; Siqin, G. An Index for Comprehensive Assessment of Species Diversity at Regional Scales. J. Xiamen Univ. (Nat. Sci.) 2010, 49, 738–742. [Google Scholar]
  45. Lewis, S.L.; Wheeler, C.E.; Mitchard, E.T.A.; Koch, A. Restoring Natural Forests Is the Best Way to Remove Atmospheric Carbon. Nature 2019, 568, 25–28. [Google Scholar] [CrossRef] [PubMed]
  46. Schwalm, C.R.; Glendon, S.; Duffy, P.B. RCP8.5 Tracks Cumulative CO2 Emissions. Proc. Natl. Acad. Sci. USA 2020, 117, 19656–19657. [Google Scholar] [CrossRef] [PubMed]
  47. Walker, W.S.; Gorelik, S.R.; Cook-Patton, S.C.; Baccini, A.; Farina, M.K.; Solvik, K.K.; Ellis, P.W.; Sanderman, J.; Houghton, R.A.; Leavitt, S.M.; et al. The Global Potential for Increased Storage of Carbon on Land. Proc. Natl. Acad. Sci. USA 2022, 119, e2111312119. [Google Scholar] [CrossRef] [PubMed]
  48. Chen, X.; Chen, S.; He, Z.; Xue, D.; Fang, G.; Pan, K.; Fang, K. Developing a system for comprehensive regional Eco-environmental quality assessment in mountainous areas—A case study of Western Sichuan, China. Front. Environ. Sci. 2022, 10, 879662. [Google Scholar] [CrossRef]
  49. Li, R.; Zheng, H.; O’Connor, P.; Xu, H.; Li, Y.; Lu, F.; Robinson, B.E.; Ouyang, Z.; Hai, Y.; Daily, G.C. Time and Space Catch up with Restoration Programs That Ignore Ecosystem Service Trade-Offs. Sci. Adv. 2021, 7, eabf8650. [Google Scholar] [CrossRef] [PubMed]
  50. Moilanen, A.; Losos, E.J.B.; Flather, A.E.C.H. Reserve Selection Using Nonlinear Species Distribution Models. Am. Nat. 2005, 165, 695–706. [Google Scholar] [CrossRef] [PubMed]
  51. Moilanen, A. Planning Impact Avoidance and Biodiversity Offsetting Using Software for Spatial Conservation Prioritisation. Wildl. Res. 2012, 40, 153–162. [Google Scholar] [CrossRef]
  52. Watson, J.E.M.; Venter, O. A Global Plan for Nature Conservation. Nature 2017, 550, 48–49. [Google Scholar] [CrossRef]
  53. Mu, H.; Li, X.; Wen, Y.; Huang, J.; Du, P.; Su, W.; Miao, S.; Geng, M. A Global Record of Annual Terrestrial Human Footprint Dataset from 2000 to 2018. Sci. Data 2022, 9, 176. [Google Scholar] [CrossRef] [PubMed]
  54. Pryce, B.; Iachetti, P.; Wilhere, G.; Crawford, R.; Goering, M.; Lewis, J.; Kittel, G.; Heiner, M.; Warner, N.; Farone, S.; et al. Okanagan Ecoregional Assessment; Okanagan Ecoregional Assessment, Volume 1—Report; Nature Conservancy of Canada: Victoria, BC, Canada, 2006. [Google Scholar]
  55. Jones, K.R.; Venter, O.; Fuller, R.A.; Allan, J.R.; Maxwell, S.L.; Negret, P.J.; Watson, J.E.M. One-Third of Global Protected Land Is under Intense Human Pressure. Science 2018, 360, 788–791. [Google Scholar] [CrossRef] [PubMed]
  56. O’Bryan, C.J.; Allan, J.R.; Holden, M.; Sanderson, C.; Venter, O.; Di Marco, M.; McDonald-Madden, E.; Watson, J.E.M. Intense Human Pressure Is Widespread across Terrestrial Vertebrate Ranges. Glob. Ecol. Conserv. 2020, 21, e00882. [Google Scholar] [CrossRef]
  57. Palmer, M.A.; Ruhl, J. Aligning Restoration Science and the Law to Sustain Ecological Infrastructure for the Future. Front. Ecol. Environ. 2015, 13, 512–519. [Google Scholar] [CrossRef] [PubMed]
  58. McMahen, K.; van Bommel, J.K. Towards an Integrated Perspective of Biological Conservation and Ecological Restoration. Restor. Ecol. 2020, 28, 494–497. [Google Scholar] [CrossRef]
  59. Mori, A.S.; Isbell, F. Untangling the Threads of Conservation: A Closer Look at Restoration and Preservation. J. Appl. Ecol. 2024, 61, 215–222. [Google Scholar] [CrossRef]
  60. Reid, J.L. Restoration Ecology’s Silver Jubilee: Big Time Questions for Restoration Ecology. Restor. Ecol. 2018, 26, 1029–1031. [Google Scholar] [CrossRef]
  61. Isbell, F. Protecting and Restoring Biodiversity and Ecosystem Services. In The Ecological and Societal Consequences of Biodiversity Loss; John Wiley & Sons, Ltd.: Hoboken, NJ, USA, 2022; pp. 325–346. ISBN 978-1-119-90291-1. [Google Scholar]
  62. Watson, K.B.; Galford, G.L.; Sonter, L.J.; Ricketts, T.H. Conserving Ecosystem Services and Biodiversity: Measuring the Tradeoffs Involved in Splitting Conservation Budgets. Ecosyst. Serv. 2020, 42, 101063. [Google Scholar] [CrossRef]
  63. Weiskopf, S.R.; Myers, B.J.E.; Arce-Plata, M.I.; Blanchard, J.L.; Ferrier, S.; Fulton, E.A.; Harfoot, M.; Isbell, F.; Johnson, J.A.; Mori, A.S.; et al. A Conceptual Framework to Integrate Biodiversity, Ecosystem Function, and Ecosystem Service Models. BioScience 2022, 72, 1062–1073. [Google Scholar] [CrossRef]
  64. Frietsch, M.; Loos, J.; Löhr, K.; Sieber, S.; Fischer, J. Future-Proofing Ecosystem Restoration through Enhancing Adaptive Capacity. Commun. Biol. 2023, 6, 377. [Google Scholar] [CrossRef]
  65. Laurent, A.; Owsianiak, M. Potentials and Limitations of Footprints for Gauging Environmental Sustainability. Curr. Opin. Environ. Sustain. 2017, 25, 20–27. [Google Scholar] [CrossRef]
  66. Huang, Z.; Qian, L.; Cao, W. Developing a Novel Approach Integrating Ecosystem Services and Biodiversity for Identifying Priority Ecological Reserves. Resour. Conserv. Recycl. 2022, 179, 106128. [Google Scholar] [CrossRef]
  67. Zhu, Q.; Chen, H.; Peng, C.; Liu, J.; Piao, S.; He, J.-S.; Wang, S.; Zhao, X.; Zhang, J.; Fang, X.; et al. An Early Warning Signal for Grassland Degradation on the Qinghai-Tibetan Plateau. Nat. Commun. 2023, 14, 6406. [Google Scholar] [CrossRef] [PubMed]
  68. Wade, M.R.; Gurr, G.M.; Wratten, S.D. Ecological Restoration of Farmland: Progress and Prospects. Philos. Trans. R. Soc. B Biol. Sci. 2007, 363, 831–847. [Google Scholar] [CrossRef] [PubMed]
  69. Newton, A.C.; Evans, P.M.; Watson, S.C.L.; Ridding, L.E.; Brand, S.; McCracken, M.; Gosal, A.S.; Bullock, J.M. Ecological Restoration of Agricultural Land Can Improve Its Contribution to Economic Development. PLoS ONE 2021, 16, e0247850. [Google Scholar] [CrossRef] [PubMed]
  70. Wei, H.; Lu, C. Farmland Change and Its Implications in the Three River Region of Tibet during Recent 20 Years. PLoS ONE 2022, 17, e0265939. [Google Scholar] [CrossRef] [PubMed]
  71. Badgery, W.; Kemp, D.; Zhang, Y.; Wang, Z.; Han, G.; Hou, F.; Liu, N.; Michalk, D.; Behrendt, K. Optimising Grazing for Livestock Production and Environmental Benefits in Chinese Grasslands. Rangel. J. 2020, 42, 347–358. [Google Scholar] [CrossRef]
  72. Zhao, X.; Zhao, L.; Li, Q.; Chen, H.; Zhou, H.; Xu, S.; Dong, Q.; Wu, G.; He, Y. Using Balance of Seasonal Herbage Supply and Demand to Inform Sustainable Grassland Management on the Qinghai–Tibetan Plateau. Front. Agric. Sci. Eng. 2018, 5, 1. [Google Scholar] [CrossRef]
  73. Li, Y.; Allan Degen, A.; Sun, T.; Wang, W.; Bai, Y.; Zhang, T.; Long, R.; Shang, Z. Three Years of Cultivating or Fencing Lands Have Different Impacts on Soil Nutrients and Properties of a Subalpine Meadow in the Tibetan Plateau. Catena 2020, 186, 104306. [Google Scholar] [CrossRef]
  74. Mitchell, M.G.E.; Qiu, J.; Cardinale, B.J.; Chan, K.M.A.; Eigenbrod, F.; Felipe-Lucia, M.R.; Jacob, A.L.; Jones, M.S.; Sonter, L.J. Key Questions for Understanding Drivers of Biodiversity-Ecosystem Service Relationships across Spatial Scales. Landsc. Ecol. 2024, 39, 36. [Google Scholar] [CrossRef]
  75. Ricketts, T.H.; Watson, K.B.; Koh, I.; Ellis, A.M.; Nicholson, C.C.; Posner, S.; Richardson, L.L.; Sonter, L.J. Disaggregating the Evidence Linking Biodiversity and Ecosystem Services. Nat. Commun. 2016, 7, 13106. [Google Scholar] [CrossRef] [PubMed]
  76. Seppelt, R.; Lautenbach, S.; Volk, M. Identifying Trade-Offs between Ecosystem Services, Land Use, and Biodiversity: A Plea for Combining Scenario Analysis and Optimization on Different Spatial Scales. Curr. Opin. Environ. Sustain. 2013, 5, 458–463. [Google Scholar] [CrossRef]
  77. Hölting, L.; Beckmann, M.; Volk, M.; Cord, A.F. Multifunctionality Assessments—More than Assessing Multiple Ecosystem Functions and Services? A Quantitative Literature Review. Ecol. Indic. 2019, 103, 226–235. [Google Scholar] [CrossRef]
  78. Fors, H.; Berlin, A.; Gottlieb, U.; Kågström, M.; Weldon, J.; Zhang, J. Interdisciplinary Insights into Navigating the Maze of Landscape Multifunctionality. People Nat. 2024. [CrossRef]
  79. Mastrangelo, M.E.; Weyland, F.; Villarino, S.H.; Barral, M.P.; Nahuelhual, L.; Laterra, P. Concepts and Methods for Landscape Multifunctionality and a Unifying Framework Based on Ecosystem Services. Landsc. Ecol. 2014, 29, 345–358. [Google Scholar] [CrossRef]
  80. Freeman, O.E.; Duguma, L.A.; Minang, P.A. Operationalizing the Integrated Landscape Approach in Practice. Ecol. Soc. 2015, 20, 24. Available online: https://www.jstor.org/stable/26269763 (accessed on 10 August 2023). [CrossRef]
  81. Stürck, J.; Verburg, P.H. Multifunctionality at What Scale? A Landscape Multifunctionality Assessment for the European Union under Conditions of Land Use Change. Landsc. Ecol. 2017, 32, 481–500. [Google Scholar] [CrossRef]
  82. Ji, Z.; Liu, C.; Xu, Y.; Sun, M.; Wei, H.; Sun, D.; Li, Y.; Zhang, P.; Sun, Q. Quantitative Identification and the Evolution Characteristics of Production—Living—Ecological Space in the Mountainous Area: From the Perspective of Multifunctional Land. J. Geogr. Sci. 2023, 33, 779–800. [Google Scholar] [CrossRef]
  83. Vihervaara, P.; Mononen, L.; Auvinen, A.-P.; Virkkala, R.; Lü, Y.; Pippuri, I.; Packalen, P.; Valbuena, R.; Valkama, J. How to Integrate Remotely Sensed Data and Biodiversity for Ecosystem Assessments at Landscape Scale. Landsc. Ecol. 2015, 30, 501–516. [Google Scholar] [CrossRef]
Figure 1. Location, topography (DEM), and land use types of the study area.
Sustainability 16 04327 g001
Figure 2. The coherent framework for delineating priority areas for preservation and restoration.
Sustainability 16 04327 g002
Figure 3. Spatial distribution in ecological importance of (a) species diversity, (b) carbon sequestration capacity, (c) water conservation, (d) soil retention capacity, (e) sandstorm prevention capacity, and (f) ecological conservation priority rank.
Sustainability 16 04327 g003
Figure 4. Performance curves.
Sustainability 16 04327 g004
Figure 5. Preservation priority areas (PPAs) and restoration priority areas (RPAs) under the conservation target of (a) 30% and (b) 50%.
Sustainability 16 04327 g005
Figure 6. Total conservation of species diversity and ecosystem services under the current Ecological Conservation Redline (ECR), the 30% conservation target and the 50% conservation target.
Sustainability 16 04327 g006
Figure 7. Spatial distribution of the production–living–ecological spaces (PLES) within PPAs and RPAs under the target of (a) 30% and (b) 50%.
Sustainability 16 04327 g007
Table 1. Data sources used in the present study.
DataSourcesResolution
DEMgeospatial data cloud (www.gscloud.cn, accessed on 3 June 2023)30 m
land use/coverWorldCover (www.esa-worldcover.org, accessed on 3 June 2023)10 m
Vegetation coverageInstitute of Remote Sensing and Digital Earth, Chinese Academy of Sciences (www.ecosystem.csdb.cn, accessed on 4 June 2023)250 m
Annual rainfall erosivity, precipitation, and evapotranspirationChinese Ecosystem Research Network (www.nesdc.org.cn, accessed on 4 June 2023)250 m
Ecological Conservation Redline dataGanzi Bureau of Natural Resources and PlanningNA
Production–living–ecological spaceSpatial-temporal distribution of global production–living–ecological space during the period 2000–2020 (https://doi.org/10.1038/s41597-023-02497-1, accessed on 3 June 2023)1 km
Soil datasetSecond National Soil Survey of China (www.soili.nfo.cn, accessed on 3 June 2023)1 km
Wind speedGlobal Surface of Daily Meteorological Data produced by the National Center for Environmental Information (NOAA)NA
Species richness data (mammals and amphibians)International Union for Conservation of Nature (www.iucnredlist.org/resources/spatial-data-download, accessed on 3 June 2023)NA
Bird richness dataShifts in bird ranges and conservation priorities in China under climate change (https://doi.org/10/gsrsn6, accessed on 4 June 2023)500 m
Snow depthNational Tibetan Plateau/Third Pole Environment Data Center0.25°
NA means not applicable.
Table 2. The basic statistics of conservation priority areas and their human footprint level (HFP) under targets of 30% and 50%.
Conservation
Approaches
Human
Footprint
Level
Target 30%Target 50%Ganzi
Area
(km2)
Proportion
(%)
Area
(km2)
Proportion
(%)
Area
(km2)
Proportion
(%)
Preservation(0, 1]80.20.2126.70.2146.30.1
Priority(1, 2]468.81.0614.00.8782.20.5
Areas(2, 4]8165.217.910,567.414.117,314.011.6
(PPAs)Subtotal8714.219.111,308.115.118,242.512.2
Restoration(4, 8]22,572.949.637,892.750.674,286.849.6
Priority(8, 16]11,766.925.821,928.229.349,482.733.0
Areas(16, 50]2477.85.43751.15.07753.85.2
(RPAs)Subtotal36,817.780.963,57284.9131,523.387.8
Total45,531.8100.063,572.0100.0149,765.8100.0
Table 3. The basic statistics of conservation priority areas and their overlap with the Ecological Conservation Redline (ECR) under targets of 30% and 50%.
IndicatorsTarget 30%Target 50%
PPAsRPAsTotalPPAsRPAsTotal
Proportion of Ganzi (%)5.724.330.07.542.350.0
Area (km2)8714.236,817.745,531.911,308.163,578.474,886.6
Number of large patches108200308143395538
Area within ECR (km2)5782.514,463.920,246.47686.026,349.934,035.9
Proportion of area in ECR (%)66.439.344.568.041.445.4
Number of large patches in ECR6216923189302391
Proportion of large patches in ECR (%)57.484.575.062.276.572.7
Table 4. The basic statistics of production–living–ecological spaces (PLES) and their overlaps with the Ecological Conservation Redline (ECR).
CategoriesGanziThe Ecological Conservation RedlineThe Proportion of ECR to Ganzi (%)
Area (km2)Proportion (%)Area (km2)Proportion (%)
Production space57,468.338.425,449.036.544.3
Living space219.90.22.30.01.0
Ecological space92,077.661.444,310.363.548.1
Total149,765.8100.069,761.6100.046.6
Table 5. The basic statistics of the overlap between production–living–ecological spaces and the preservation priority areas (PPAs) or restoration priority areas (RPAs).
CategoriesIndicatorsTarget 30%Target 50%
PPAsRPAsTotalPPAsRPAsTotal
Area in conservation
priority areas (km2)
Production space2127.19090.811,217.92610.420,637.123,247.5
Living space0.077.177.10.0105.1105.1
Ecological space6587.127,649.834,236.98697.742,836.151,533.8
Proportion in conservation
priority areas (%)
Production space24.424.724.623.132.531.0
Living space0.00.20.20.00.20.1
Ecological space75.675.175.276.967.468.8
Proportion in Ganzi
PLES (%)
Production space3.715.819.54.535.940.5
Living space0.035.135.10.047.847.8
Ecological space7.230.037.29.446.556.0
Disclaimer/Publisher’s Note: The statements, opinions and data contained in all publications are solely those of the individual author(s) and contributor(s) and not of MDPI and/or the editor(s). MDPI and/or the editor(s) disclaim responsibility for any injury to people or property resulting from any ideas, methods, instructions or products referred to in the content.

