
A Systematic Review for Indoor and Outdoor Air Pollution Monitoring Systems Based on Internet of Things


Abstract
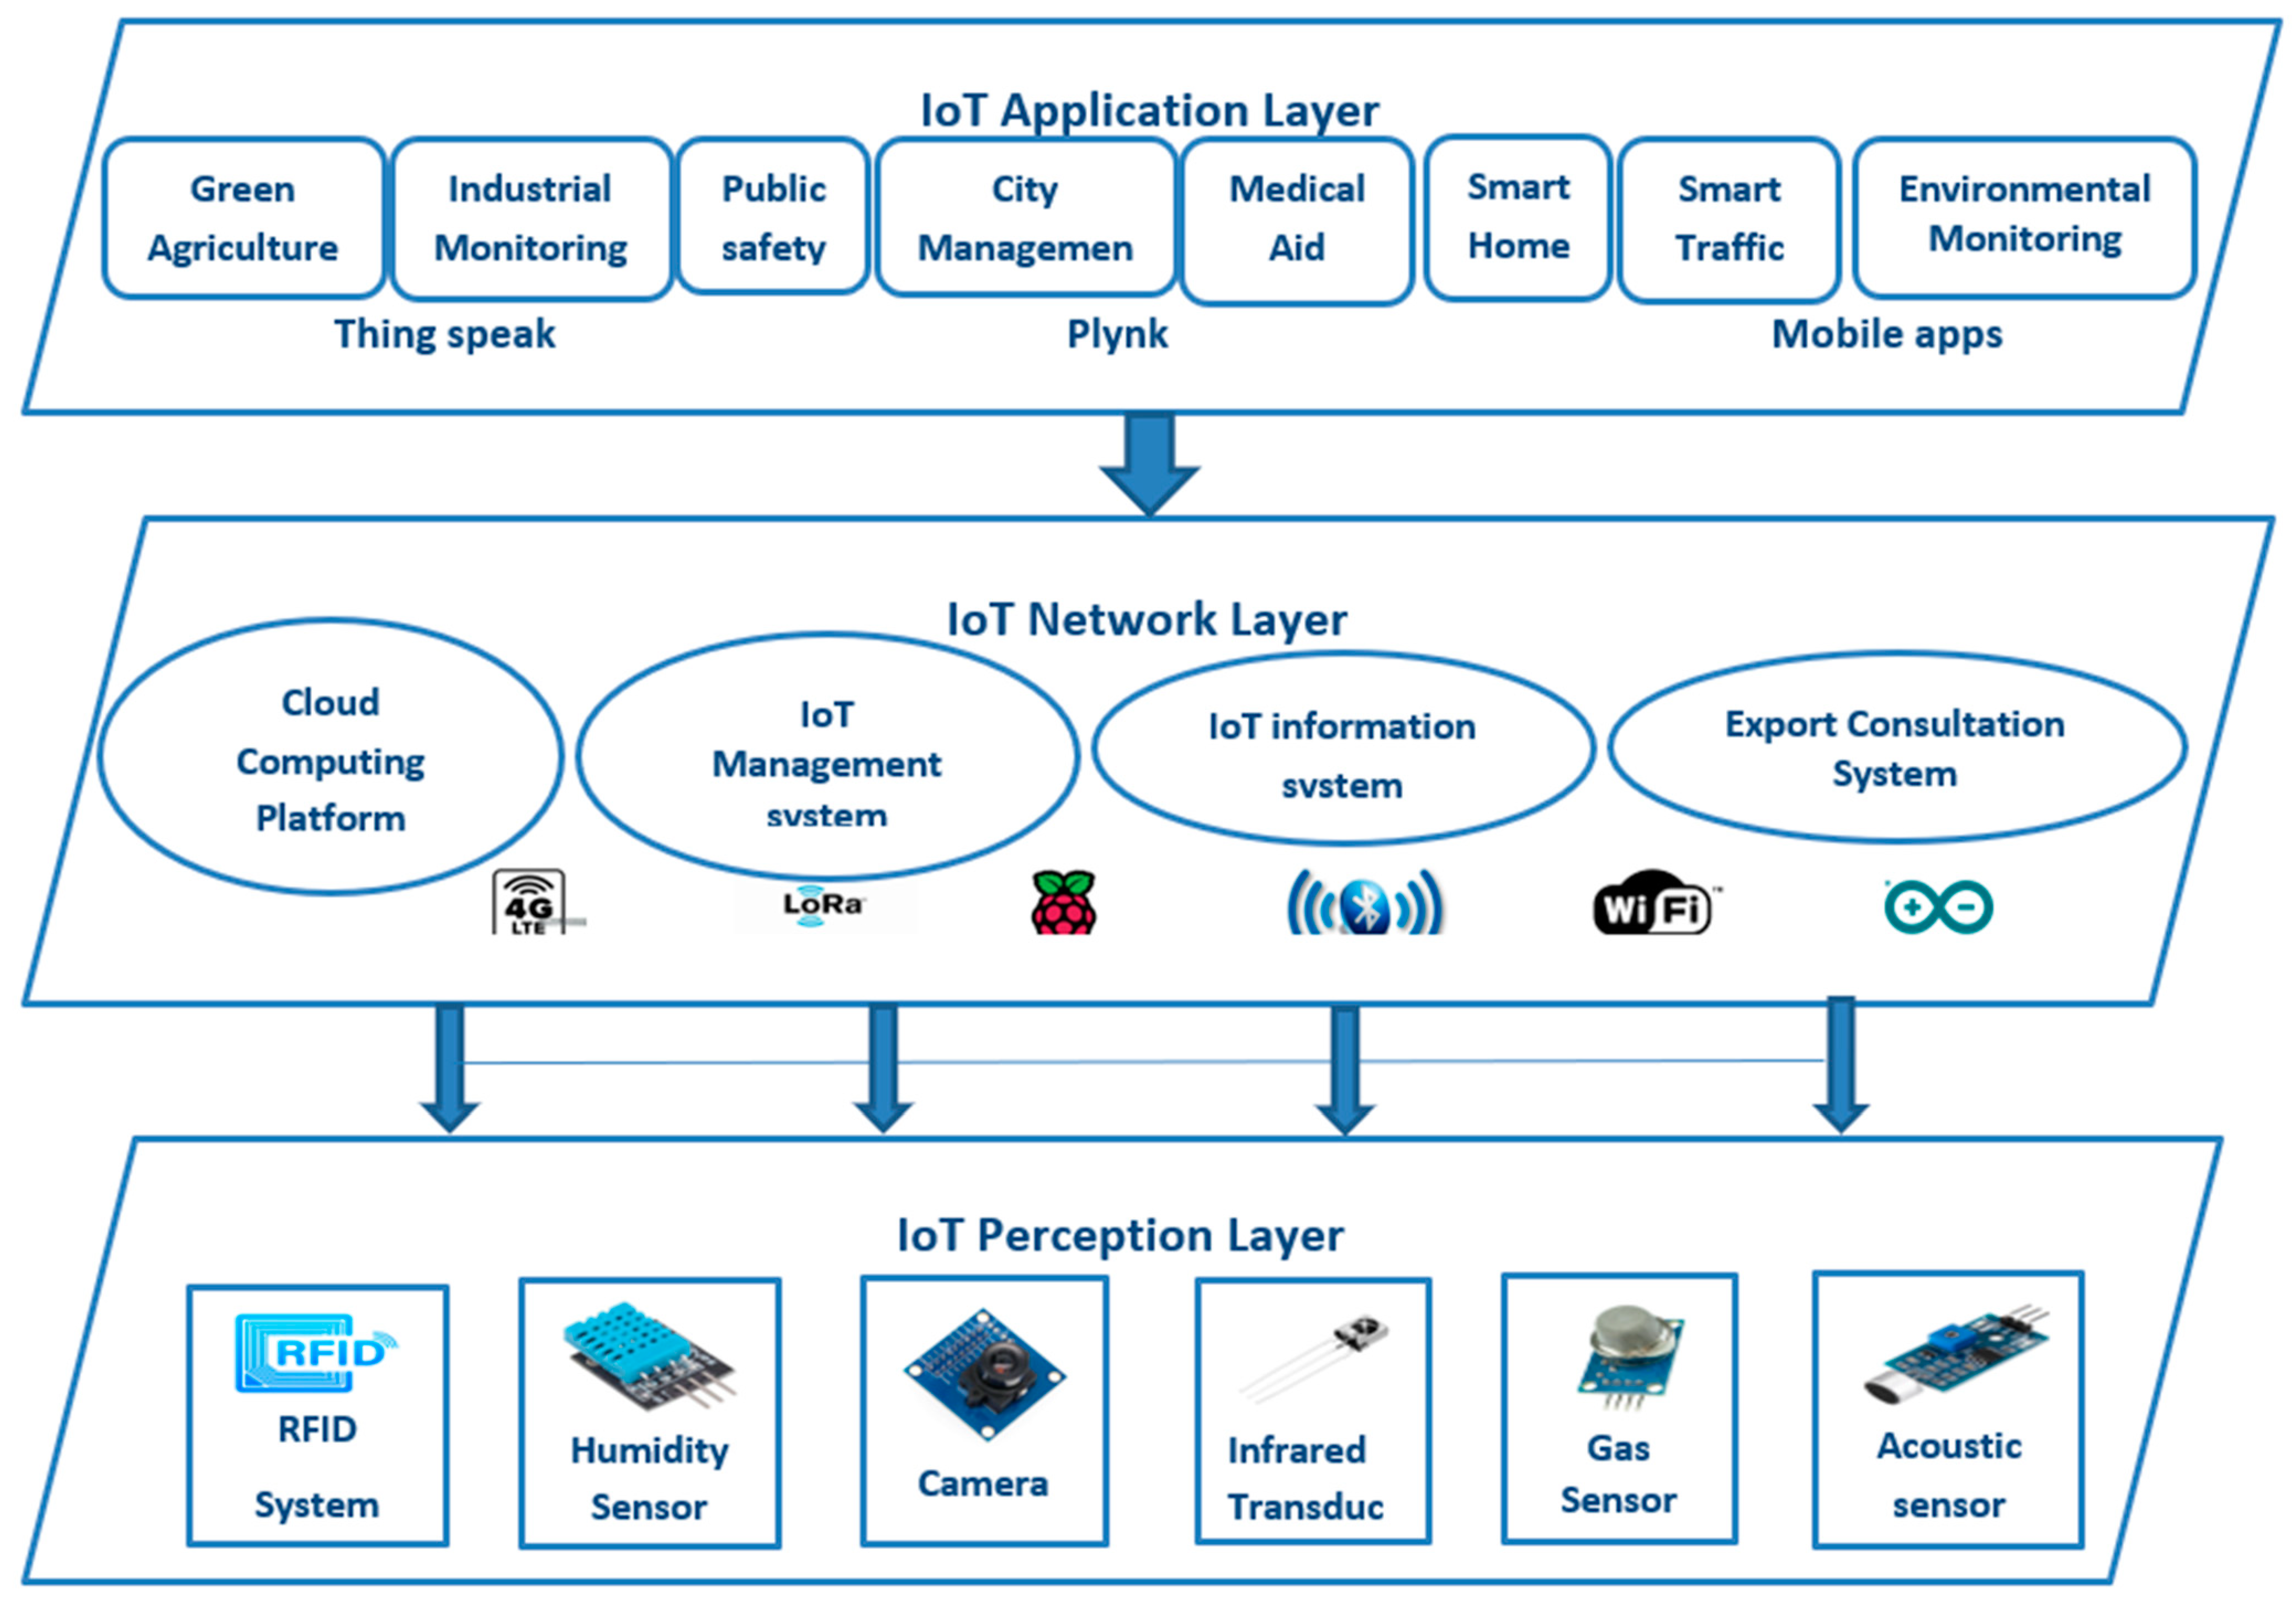
:1. Introduction
2. Methodology
2.1. Research Questions
2.2. Search Process
2.3. Inclusion and Exclusion Criteria
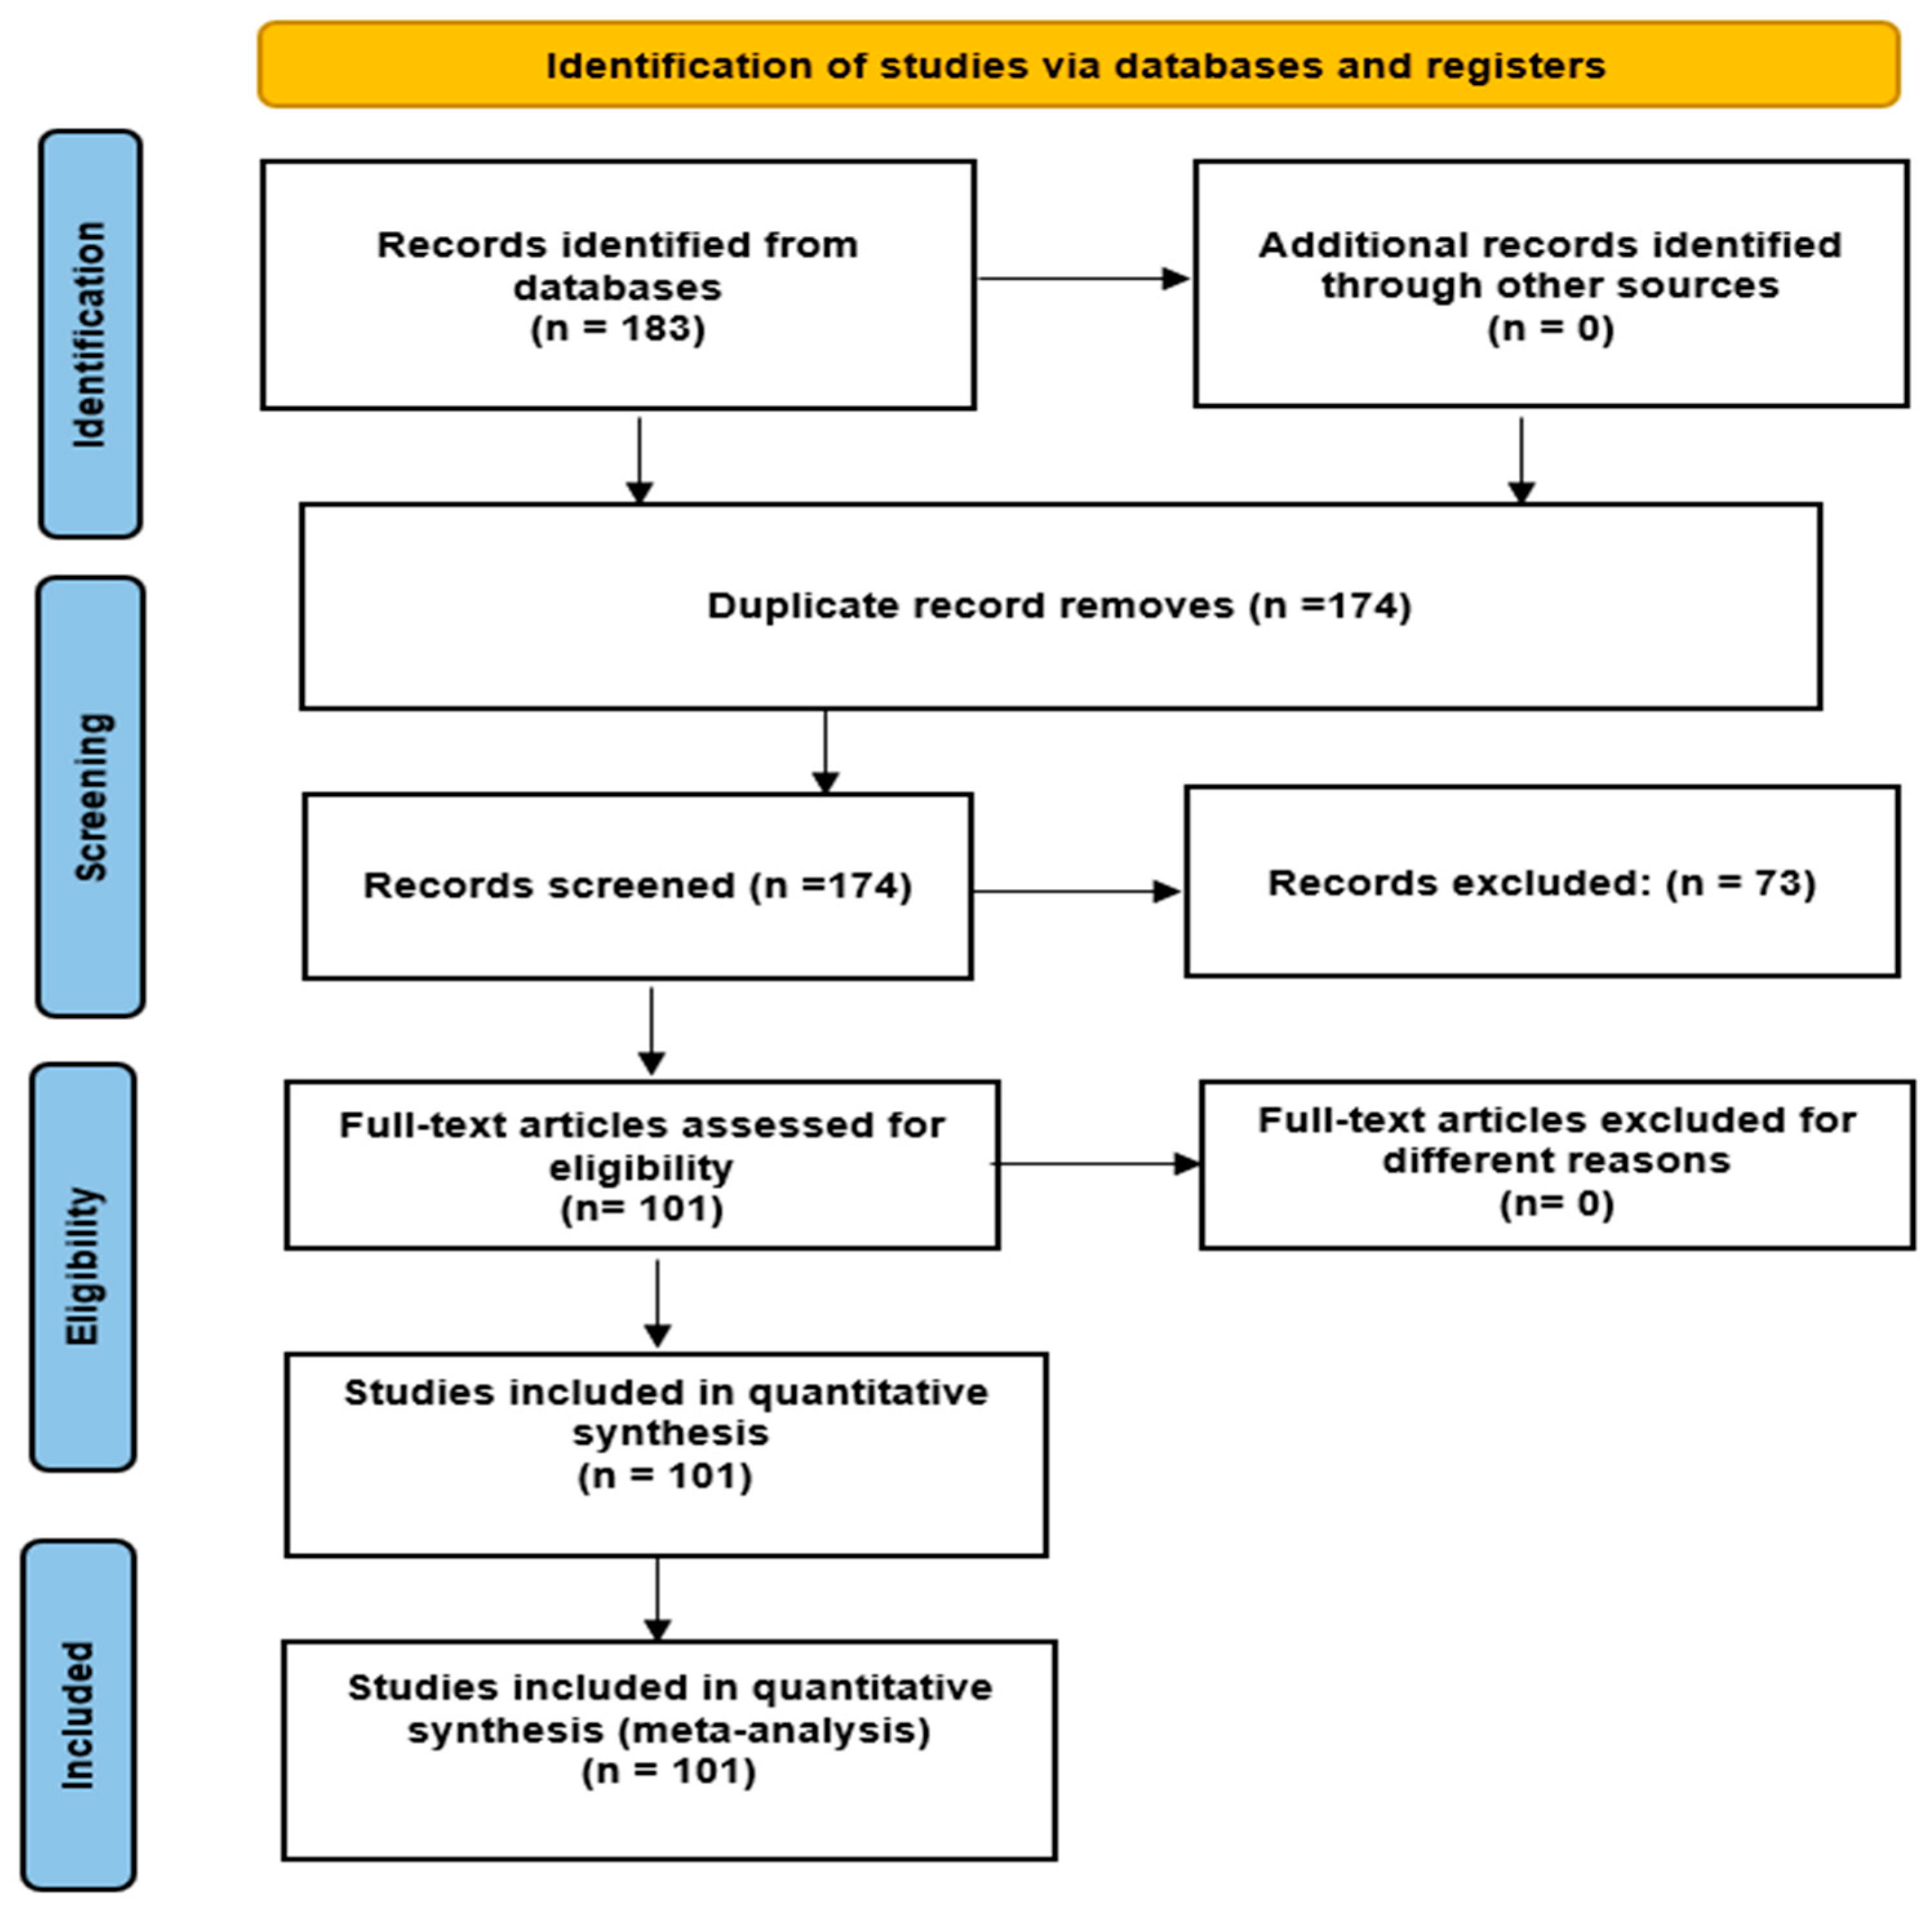
2.4. Study Selection
2.5. Data Extraction and Synthesis
2.6. Risk of Bias
3. Results
3.1. Answer to RQ1
3.2. Answer to RQ2
3.3. Answer to RQ3
3.4. Answer to RQ4
3.5. Answer to RQ5
3.6. Answer to RQ6
3.7. Answer to RQ7
4. Conclusions
Author Contributions
Funding
Data Availability Statement
Conflicts of Interest
References
- Al Mamun, A.; Yuce, M.R. Sensors and Systems for Wearable Environmental Monitoring Toward IoT-Enabled Applications: A Review. IEEE Sens. J. 2019, 19, 7771–7788. [Google Scholar] [CrossRef]
- Manisalidis, I.; Stavropoulou, E.; Stavropoulos, A.; Bezirtzoglou, E. Environmental and Health Impacts of Air Pollution: A Review. Front. Public Health 2020, 8, 505570. [Google Scholar] [CrossRef] [PubMed]
- Pozzer, A.; Anenberg, S.C.; Dey, S.; Haines, A.; Lelieveld, J.; Chowdhury, S. Mortality Attributable to Ambient Air Pollution: A Review of Global Estimates. GeoHealth 2023, 7, e2022GH000711. [Google Scholar] [CrossRef] [PubMed]
- Andrade, A.; D’oliveira, A.; De Souza, L.C.; Bastos, A.C.R.d.F.; Dominski, F.H.; Stabile, L.; Buonanno, G. Effects of Air Pollution on the Health of Older Adults during Physical Activities: Mapping Review. Int. J. Environ. Res. Public Health 2023, 20, 3506. [Google Scholar] [CrossRef] [PubMed]
- Sharma, A.; Mishra, B.; Sutaria, R.; Zele, R. Design and Development of Low-cost Wireless Sensor Device for Air Quality Networks. In Proceedings of the IEEE Region 10 Annual International Conference, Proceedings/TENCON, Kochi, India, 17–20 October 2019. [Google Scholar] [CrossRef]
- Hao, G.; Zuo, L.; Xiong, P.; Chen, L.; Liang, X.; Jing, C. Associations of PM2.5 and road traffic noise with mental health: Evidence from UK Biobank. Environ. Res. 2022, 207, 112221. [Google Scholar] [CrossRef] [PubMed]
- González, L.G.; Linares, C.; Díaz, J.; Egea, A.; Calle-Martínez, A.; Luna, M.; Navas, M.; Ascaso-Sánchez, M.; Ruiz-Páez, R.; Asensio, C.; et al. Short-term impact of noise, other air pollutants and meteorological factors on emergency hospital mental health admissions in the Madrid region. Environ. Res. 2023, 224, 115505. [Google Scholar] [CrossRef] [PubMed]
- Donta, P.K.; Sedlak, B.; Pujol, V.C.; Dustdar, S. Governance and sustainability of distributed continuum systems: A big data approach. J. Big Data 2023, 10, 53. [Google Scholar] [CrossRef]
- Marques, G.; Pitarma, R.; Garcia, N.M.; Pombo, N. Internet of Things Architectures, Technologies, Applications, Challenges, and Future Directions for Enhanced Living Environments and Healthcare Systems: A Review. Electronics 2019, 8, 1081. [Google Scholar] [CrossRef]
- Barot, V.; Kapadia, V. Air Quality Monitoring Systems using IoT: A Review. In Proceedings of the 2020 International Conference on Computational Performance Evaluation, ComPE 2020, Shillong, India, 2–4 July 2020. [Google Scholar] [CrossRef]
- Firdhous, M.F.M.; Sudantha, B.H.; Karunaratne, P.M. IoT enabled proactive indoor air quality monitoring system for sustainable health management. In Proceedings of the 2017 2nd International Conference on Computing and Communications Technologies, ICCCT 2017, Chennai, India, 23–24 February 2017. [Google Scholar] [CrossRef]
- Misbah; Astutik, R.P.; Eliyani; Winarno, H.A.; Muklish, A.; Andesta, D. Communication System on Wireless Sensor Networks using Raspberry Pi and Arduino for Monitoring Gas of Air Pollution. In Proceedings of the 2018 International Seminar on Intelligent Technology and Its Application, ISITIA 2018, Bali, Indonesia, 30–31 August 2018. [Google Scholar] [CrossRef]
- Maurya, S.; Sharma, S.; Yadav, P. Internet of Things based Air Pollution Penetrating System using GSM and GPRS. In Proceedings of the 2018 International Conference on Advanced Computation and Telecommunication, ICACAT 2018, Bhopal, India, 28–29 December 2018. [Google Scholar] [CrossRef]
- Aamer, H.; Mumtaz, R.; Anwar, H.; Poslad, S. A Very Low Cost, Open, Wireless, Internet of Things (IoT) Air Quality Monitoring Platform. In Proceedings of the 2018 15th International Conference on Smart Cities: Improving Quality of Life Using ICT and IoT, HONET-ICT 2018, Islamabad, Pakistan, 8–10 October 2018. [Google Scholar] [CrossRef]
- Saha, A.K.; Sircar, S.; Chatterjee, P.; Dutta, S.; Mitra, A.; Chatterjee, A.; Chattopadhyay, S.P.; Saha, H.N. A raspberry Pi controlled cloud based air and sound pollution monitoring system with temperature and humidity sensing. In Proceedings of the 2018 IEEE 8th Annual Computing and Communication Workshop and Conference, CCWC 2018, Las Vegas, NV, USA, 8–10 January 2018; pp. 607–611. [Google Scholar] [CrossRef]
- Alam, S.S.; Islam, A.J.; Hasan, M.M.; Rafid, M.N.M.; Chakma, N.; Imtiaz, M.N. Design and Development of a Low-Cost IoT based Environmental Pollution Monitoring System. In Proceedings of the 2018 4th International Conference on Electrical Engineering and Information & Communication Technology (iCEEiCT), Dhaka, Bangladesh, 13–15 September 2018; pp. 652–656. [Google Scholar] [CrossRef]
- Russell, L.; Goubran, R.; Kwamena, F. Posture Detection Using Sounds and Temperature: LMS-Based Approach to Enable Sensory Substitution. IEEE Trans. Instrum. Meas. 2018, 67, 1543–1554. [Google Scholar] [CrossRef]
- Barcelo-Ordinas, J.M.; Garcia-Vidal, J.; Doudou, M.; Rodrigo-Munoz, S.; Cerezo-Llavero, A. Calibrating low-cost air quality sensors using multiple arrays of sensors. In Proceedings of the IEEE Wireless Communications and Networking Conference, WCNC, Barcelona, Spain, 15–18 April 2018; pp. 1–6. [Google Scholar] [CrossRef]
- Krishnan, K.R.; Chinh, H.D.; Panda, S.K.; Wai, T.K. Flexible Indoor Environmental Quality Monitoring for Interoperable Subsystems in Buildings. In Proceedings of the 2018 IEEE International Conference on Environment and Electrical Engineering and 2018 IEEE Industrial and Commercial Power Systems Europe, EEEIC/I and CPS Europe 2018, Palermo, Italy, 12–15 June 2018. [Google Scholar] [CrossRef]
- Islam, M.S. An Intelligent System on Environment Quality Remote Monitoring and Cloud Data Logging Using Internet of Things (IoT). In Proceedings of the International Conference on Computer, Communication, Chemical, Material and Electronic Engineering, IC4ME2 2018, Rajshahi, Bangladesh, 8–9 February 2018. [Google Scholar] [CrossRef]
- Mitra, D.; Saha, A. IoT-based air pollution detection, monitoring and controlling system. J. Discret. Math. Sci. Cryptogr. 2022, 25, 2173–2182. [Google Scholar] [CrossRef]
- Muladi, M.; Sendari, S.; Widiyaningtyas, T. Real Time Indoor Air Quality Monitoring Using Internet of Things at University. In Proceedings of the 2018 2nd Borneo International Conference on Applied Mathematics and Engineering, BICAME 2018, Balikpapan, Indonesia, 10–11 December 2018; pp. 169–173. [Google Scholar] [CrossRef]
- Alexandrova, E.; Ahmadinia, A. Real-Time Intelligent Air Quality Evaluation on a Resource-Constrained Embedded Platform. In Proceedings of the 2018 IEEE 4th International Conference on Big Data Security on Cloud (BigDataSecurity), IEEE International Conference on High Performance and Smart Computing, (HPSC) and IEEE International Conference on Intelligent Data and Security (IDS), IEEE, Omaha, NE, USA, 3–5 May 2018; pp. 165–170. [Google Scholar] [CrossRef]
- Tian, B.; Hou, K.M.; Diao, X.; Shi, H.; Zhou, H.; Wang, W. Environment-Adaptive Calibration System for Outdoor Low-Cost Electrochemical Gas Sensors. IEEE Access 2019, 7, 62592–62605. [Google Scholar] [CrossRef]
- Hapsari, A.A.; Hajamydeen, A.I.; Vresdian, D.J.; Manfaluthy, M.; Prameswono, L.; Yusuf, E. Real Time Indoor Air Quality Monitoring System Based on IoT using MQTT and Wireless Sensor Network. In Proceedings of the ICETAS 2019—2019 6th IEEE International Conference on Engineering, Technologies and Applied Sciences, Kuala Lumpur, Malaysia, 20–21 December 2019. [Google Scholar] [CrossRef]
- Boppana, L.; Lalasa, K.; Vandana, S.; Kodali, R.K. Mongoose OS based Air Quality Monitoring System. In Proceedings of the TENCON 2019—2019 IEEE Region 10 Conference (TENCON), Kochi, India, 17–20 October 2019; pp. 1247–1252. [Google Scholar] [CrossRef]
- Sajjan, V.; Sharma, P. Research on an iot based air pollution monitoring system. Int. J. Innov. Technol. Explor. Eng. 2019, 8, 553–558. [Google Scholar] [CrossRef]
- Gupta, H.; Bhardwaj, D.; Agrawal, H.; Tikkiwal, V.A.; Kumar, A. An IoT Based Air Pollution Monitoring System for Smart Cities. In Proceedings of the 1st IEEE International Conference on Sustainable Energy Technologies and Systems, ICSETS 2019, Bhubaneswar, India, 26 February–1 March 2019; pp. 173–177. [Google Scholar] [CrossRef]
- Zhao, L.; Wu, W.; Li, S. Design and Implementation of an IoT-Based Indoor Air Quality Detector With Multiple Communication Interfaces. IEEE Internet Things J. 2019, 6, 9621–9632. [Google Scholar] [CrossRef]
- Kodali, R.K.; Rajanarayanan, S.C. IoT based Indoor Air Quality Monitoring System. In Proceedings of the 2019 International Conference on Wireless Communications Signal Processing and Networking (WiSPNET), Chennai, India, 21–23 March 2019; pp. 1–5. [Google Scholar] [CrossRef]
- Pradityo, F.; Surantha, N. Indoor air quality monitoring and controlling system based on IoT and fuzzy logic. In Proceedings of the 2019 7th International Conference on Information and Communication Technology, ICoICT 2019, Lisbon, Portugal, 29–30 August 2019. [Google Scholar] [CrossRef]
- Rodrigues, M.J.; Postolache, O.; Cercas, F. Indoor Air Quality Monitoring System to Prevent the Triggering of Respiratory Distress. In Proceedings of the 2019 International Conference on Sensing and Instrumentation in IoT Era, ISSI 2019, Lisbon, Portugal, 29–30 August 2019. [Google Scholar] [CrossRef]
- Parise, A.; Manso-Callejo, M.A.; Cao, H.; Mendonca, M.; Kohli, H.; Wachowicz, M. Indoor Occupancy Prediction using an IoT Platform. In Proceedings of the 2019 6th International Conference on Internet of Things: Systems, Management and Security, IOTSMS 2019, Granada, Spain, 22–25 October 2019. [Google Scholar] [CrossRef]
- Dhingra, S.; Madda, R.B.; Gandomi, A.H.; Patan, R.; Daneshmand, M. Internet of Things Mobile–Air Pollution Monitoring System (IoT-Mobair). IEEE Internet Things J. 2019, 6, 5577–5584. [Google Scholar] [CrossRef]
- Kumar, A.; Kumari, M.; Gupta, H. Design and Analysis of IoT based Air Quality Monitoring System. In Proceedings of the 2020 International Conference on Power Electronics and IoT Applications in Renewable Energy and its Control, PARC 2020, Mathura, India, 28–29 February 2020. [Google Scholar] [CrossRef]
- Meli, M.; Gatt, E.; Casha, O.; Grech, I.; Micallef, J. A novel low power and low cost IoT wireless sensor node for air quality monitoring. In Proceedings of the ICECS 2020—27th IEEE International Conference on Electronics, Circuits and Systems, Proceedings, Glasgow, UK, 23–25 November 2020. [Google Scholar] [CrossRef]
- Esfahani, S.; Rollins, P.; Specht, J.P.; Cole, M.; Gardner, J.W. Smart City Battery Operated IoT Based Indoor Air Quality Monitoring System. In Proceedings of the IEEE Sensors, Rotterdam, The Netherlands, 25–28 October 2020. [Google Scholar] [CrossRef]
- Prabha, S.; Raghav, R.S.; Moulya, C.; Preethi, K.G.; Sankaran, K.S. Analysis and Monitoring Air Quality System using Raspberry PI. In Proceedings of the 2020 IEEE International Conference on Communication and Signal Processing, ICCSP 2020, Chennai, India, 28–30 July 2020. [Google Scholar] [CrossRef]
- Zhang, D.; Woo, S.S. Real Time Localized Air Quality Monitoring and Prediction Through Mobile and Fixed IoT Sensing Network. IEEE Access 2020, 8, 89584–89594. [Google Scholar] [CrossRef]
- Saude, N.; Vardhini, P.A.H. IoT based Smart Baby Cradle System using Raspberry Pi B+. In Proceedings of the 2020 International Conference on Smart Innovations in Design, Environment, Management, Planning and Computing, ICSIDEMPC 2020, Aurangabad, India, 30–31 October 2020; pp. 273–278. [Google Scholar] [CrossRef]
- Hussain, M.; Ghazanfar, F.; Aleem, S.; Hai, M.; Karim, A.; Hussain, K. Design of Low Cost, Energy Efficient, IoT Enabled, Air Quality Monitoring System with Cloud Based Data Logging, Analytics and AI. In Proceedings of the 2020 International Conference on Emerging Trends in Smart Technologies, ICETST 2020, Karachi, Pakistan, 26–27 March 2020. [Google Scholar] [CrossRef]
- Kaur, S.; Bawa, S.; Sharma, S. IoT Enabled Low-Cost Indoor Air Quality Monitoring System with Botanical Solutions. In Proceedings of the ICRITO 2020—IEEE 8th International Conference on Reliability, Infocom Technologies and Optimization (Trends and Future Directions), Noida, India, 4–5 June 2020. [Google Scholar] [CrossRef]
- Shah, S.K.; Tariq, Z.; Lee, J.; Lee, Y. Real-Time Machine Learning for Air Quality and Environmental Noise Detection. In Proceedings of the Proceedings—2020 IEEE International Conference on Big Data, Big Data 2020, Atlanta, GA, USA, 10–13 December 2020; pp. 3506–3515. [Google Scholar] [CrossRef]
- Folea, S.C.; Mois, G.D. Lessons Learned From the Development of Wireless Environmental Sensors. IEEE Trans. Instrum. Meas. 2020, 69, 3470–3480. [Google Scholar] [CrossRef]
- Ha, Q.P.; Metia, S.; Phung, M.D. Sensing Data Fusion for Enhanced Indoor Air Quality Monitoring. IEEE Sens. J. 2020, 20, 4430–4441. [Google Scholar] [CrossRef]
- Ali, S.; Glass, T.; Parr, B.; Potgieter, J.; Alam, F. Low Cost Sensor With IoT LoRaWAN Connectivity and Machine Learning-Based Calibration for Air Pollution Monitoring. IEEE Trans. Instrum. Meas. 2021, 70, 5500511. [Google Scholar] [CrossRef]
- Od, S.; Hsu, H.C.; Wei, J.B. Improve the Indoor Air Quality Based on Internet of Things. In Proceedings of the 3rd IEEE Eurasia Conference on Biomedical Engineering, Healthcare and Sustainability, ECBIOS 2021, Tainan, Taiwan, 28–30 May 2021; pp. 105–108. [Google Scholar] [CrossRef]
- Yun, J.; Woo, J. IoT-Enabled Particulate Matter Monitoring and Forecasting Method Based on Cluster Analysis. IEEE Internet Things J. 2021, 8, 7380–7393. [Google Scholar] [CrossRef]
- Kalia, P.; Alam Ansari, M. IOT based air quality and particulate matter concentration monitoring system. Mater. Today Proc. 2020, 32, 468–475. [Google Scholar] [CrossRef]
- Manikandan, P.; Reddy, B.N.K.; Bhanu, M.V.; Ramesh, G.; Reddy, V.P. IoT Based Air Quality Monitoring System with Email Notification. In Proceedings of the 6th International Conference on Communication and Electronics Systems, ICCES 2021, Coimbatre, India, 8–10 July 2021; pp. 616–620. [Google Scholar] [CrossRef]
- Janeera, D.A.; Poovizhi, H.; Haseena, S.S.S.; Nivetha, S. Smart Embedded Framework using Arduino and IoT for Real-Time Noise and Air Pollution Monitoring and Alert system. In Proceedings of the International Conference on Artificial Intelligence and Smart Systems, ICAIS 2021, Coimbatore, India, 25–27 March 2021; pp. 1416–1420. [Google Scholar] [CrossRef]
- Nowshin, N.; Hasan, M.S. Microcontroller Based Environmental Pollution Monitoring System though IoT Implementation. In Proceedings of the International Conference on Robotics, Electrical and Signal Processing Techniques, Dhaka, Bangladesh, 5–7 January 2021; pp. 493–498. [Google Scholar] [CrossRef]
- Waworundeng, J.; Adrian, P.S. Air Quality Monitoring and Detection System in Vehicle Cabin Based on Internet of Things. In Proceedings of the 3rd International Conference on Cybernetics and Intelligent Systems, ICORIS 2021, Makasar, Indonesia, 25–26 October 2021. [Google Scholar] [CrossRef]
- Murshiduzzaman; Kadir, J.; Ismarrubie, Z.; Yussof, H.; Hasan, W.Z.W. Development of IoT Based Dust Density and Solar Panel Efficiency Monitoring System. In Proceedings of the International Conference on Electrical, Computer, and Energy Technologies, ICECET 2021, Cape Town, South Africa, 9–10 December 2021. [Google Scholar] [CrossRef]
- Nandanwar, H.; Chauhan, A. IOT based Smart Environment Monitoring Systems: A Key to Smart and Clean Urban Living Spaces. In Proceedings of the 2021 Asian Conference on Innovation in Technology, ASIANCON 2021, Pune, India, 27–29 August 2021. [Google Scholar] [CrossRef]
- Godase, M.; Bhanarkar, M.K. WSN Node for Air Pollution Monitoring. In Proceedings of the 2021 6th International Conference for Convergence in Technology, I2CT 2021, Maharashtra, India, 2–4 April 2021. [Google Scholar] [CrossRef]
- Nikolov, N.; Nakov, O.; Gotseva, D. Design and Implementation of a Temperature, Humidity and Air Quality IoT Monitoring Telemetry System. In Proceedings of the 2022 30th National Conference with International Participation, TELECOM 2022—Proceedings, Sofia, Bulgaria, 27–28 October 2022. [Google Scholar] [CrossRef]
- Manglani, T.; Srivastava, A.; Kumar, A.; Sharma, R. IoT based Air and Sound Pollution Monitoring System for Smart Environment. In Proceedings of the International Conference on Electronics and Renewable Systems, ICEARS 2022, Tuticorin, India, 16–18 March 2022; pp. 604–607. [Google Scholar] [CrossRef]
- Alekhya, K.; Sravya, P.D.; Naik, N.C.; Lakshminarayana, B.J. Ambient Air Quality Monitoring System. In Proceedings of the 2023 International Conference for Advancement in Technology, ICONAT 2023, Goa, India, 24–26 January 2023. [Google Scholar] [CrossRef]
- Datta, A.; Islam, M.M.; Hassan, M.S.; Aka, K.B.; Ahamed, I.; Ahmed, A. IoT Based Air Quality and Noise Pollution Monitoring System. In Proceedings of the International Conference on Robotics, Electrical and Signal Processing Techniques, Dhaka, Bangladesh, 7–8 January 2023; pp. 202–206. [Google Scholar] [CrossRef]
- Das, A.; Sarma, M.P.; Sarma, K.K.; Mastorakis, N. Design of an IoT based Real Time Environment Monitoring System using Legacy Sensors. MATEC Web Conf. 2018, 210, 03008. [Google Scholar] [CrossRef]
- Azmi, N.; Sudin, S.; Kamarudin, L.M.; Zakaria, A.; Visvanathan, R.; Cheik, G.C.; Zakaria, S.M.M.S.; Alfarhan, K.A.; Ahmad, R.B. Design and Development of Multi-Transceiver Lorafi Board consisting LoRa and ESP8266-Wifi Communication Module. IOP Conf. Ser. Mater. Sci. Eng. 2018, 318, 012051. [Google Scholar] [CrossRef]
- Benammar, M.; Abdaoui, A.; Ahmad, S.H.; Touati, F.; Kadri, A. A Modular IoT Platform for Real-Time Indoor Air Quality Monitoring. Sensors 2018, 18, 581. [Google Scholar] [CrossRef] [PubMed]
- Coleman, J.R.; Meggers, F. Sensing of Indoor Air Quality-Characterization of Spatial and Temporal Pollutant Evolution Through Distributed Sensing. Front. Built Environ. 2018, 4, 28. [Google Scholar] [CrossRef]
- Moiş, G.D.; Sanislav, T.; Folea, S.C.; Zeadally, S. Performance Evaluation of Energy-Autonomous Sensors Using Power-Harvesting Beacons for Environmental Monitoring in Internet of Things (IoT). Sensors 2018, 18, 1709. [Google Scholar] [CrossRef] [PubMed]
- Marques, G.; Roque Ferreira, C.; Pitarma, R. A System Based on the Internet of Things for Real-Time Particle Monitoring in Buildings. Int. J. Environ. Res. Public Health 2018, 15, 821. [Google Scholar] [CrossRef] [PubMed]
- Gugliermetti, L.; Garcia, D.A. A cheap and third-age-friendly home device for monitoring indoor air quality. Int. J. Environ. Sci. Technol. 2018, 15, 185–198. [Google Scholar] [CrossRef]
- Taştan, M.; Gökozan, H. Real-Time Monitoring of Indoor Air Quality with Internet of Things-Based E-Nose. Appl. Sci. 2019, 9, 3435. [Google Scholar] [CrossRef]
- Rawal, R. Air Quality Monitoring System. Int. J. Comput. Sci. Eng. 2019, 9, 1–9. [Google Scholar] [CrossRef]
- Malche, T.; Maheshwary, P.; Kumar, R. Environmental Monitoring System for Smart City Based on Secure Internet of Things (IoT) Architecture. Wirel. Pers. Commun. 2019, 107, 2143–2172. [Google Scholar] [CrossRef]
- Bonilla, J.T.G.; Bonilla, H.G.; Betancourtt, V.M.R.; Zamora, A.C.; Ortega, J.A.R.; Ortiz, L.G.; Morales, M.E.S.; Alonso, O.B.; Bonilla, A.G. Carbone Monoxide (CO) Detection Device Based on the Nickel Antimonate Oxide and a DC Electronic Circuit. Appl. Sci. 2019, 9, 3799. [Google Scholar] [CrossRef]
- Chiesa, G.; Cesari, S.; Garcia, M.; Issa, M.; Li, S. Multisensor IoT Platform for Optimising IAQ Levels in Buildings through a Smart Ventilation System. Sustainability 2019, 11, 5777. [Google Scholar] [CrossRef]
- Marques, G.; Pitarma, R. An Internet of Things-Based Environmental Quality Management System to Supervise the Indoor Laboratory Conditions. Appl. Sci. 2019, 9, 438. [Google Scholar] [CrossRef]
- Marques, G.; Pitarma, R. A Cost-Effective Air Quality Supervision Solution for Enhanced Living Environments through the Internet of Things. Electronics 2019, 8, 170. [Google Scholar] [CrossRef]
- Sun, S.; Zheng, X.; Villalba-Díez, J.; Ordieres-Meré, J. Indoor air-quality data-monitoring system: Long-term monitoring benefits. Sensors 2019, 19, 4157. [Google Scholar] [CrossRef] [PubMed]
- Toma, C.; Alexandru, A.; Popa, M.; Zamfiroiu, A. IoT solution for smart cities’ pollution monitoring and the security challenges. Sensors 2019, 19, 3401. [Google Scholar] [CrossRef] [PubMed]
- Suriano, D.; Cassano, G.; Penza, M. Design and Development of a Flexible, Plug-and-Play, Cost-Effective Tool for on-Field Evaluation of Gas Sensors. J. Sens. 2020, 2020, 8812025. [Google Scholar] [CrossRef]
- Marques, G.; Miranda, N.; Bhoi, A.K.; Garcia-Zapirain, B.; Hamrioui, S.; Díez, I.d.l.T. Internet of Things and Enhanced Living Environments: Measuring and Mapping Air Quality Using Cyber-physical Systems and Mobile Computing Technologies. Sensors 2020, 20, 720. [Google Scholar] [CrossRef]
- Chandra, I.; Hidayat, D.S.; Iskandar, A.R. Monitoring IoT-based PM2.5 and CO2 concentrations under a policy of ‘working from home’ in telkom university, Bandung. AIP Conf. Proc. 2021, 2320, 050031. [Google Scholar] [CrossRef]
- Marzouk, M.; Atef, M. Assessment of Indoor Air Quality in Academic Buildings Using IoT and Deep Learning. Sustainability 2022, 14, 7015. [Google Scholar] [CrossRef]
- Alvear-Puertas, V.E.; Burbano-Prado, Y.A.; Rosero-Montalvo, P.D.; Tözün, P.; Marcillo, F.; Hernandez, W. Smart and Portable Air-Quality Monitoring IoT Low-Cost Devices in Ibarra City, Ecuador. Sensors 2022, 22, 7015. [Google Scholar] [CrossRef] [PubMed]
- Chong, J.L.; Chew, K.W.; Peter, A.P.; Ting, H.Y.; Show, P.L. Internet of Things (IoT)-Based Environmental Monitoring and Control System for Home-Based Mushroom Cultivation. Biosensors 2023, 13, 98. [Google Scholar] [CrossRef] [PubMed]
- Aswatha, S.; Deepika, R.; DharuPiraba, M.; Dhaneesh, V.P.; Madheswari, K.; Saraswathi, S.; Lokeswari, Y.V.; Nagarajan, K.K. Smart air pollution monitoring system. Glob. Nest J. 2023, 25, 125–129. [Google Scholar] [CrossRef]
- Okokpujie, K.; Noma-Osaghae, E.; Odusami, M.; John, S.; Modupe, O.; Oluwatosin, O. A Smart Air Pollution Monitoring System. Artic. Int. J. Civ. Eng. Technol. 2018, 9, 799–809. [Google Scholar]
- Shah, H.N.; Khan, Z.; Merchant, A.A.; Moghal, M.; Shaikh, A.; Rane, P. IOT Based Air Pollution Monitoring System. Int. J. Sci. Eng. Res. 2018, 9, 62–66. [Google Scholar]
- Ewetumo, T.; Oke, A.O.; Ehiabhili, J.C. Development of a Dust Measurement System. Asian J. Appl. Sci. 2018, 6, 343–347. [Google Scholar] [CrossRef]
- Zakaria, N.A.; Zainal, Z.; Harum, N.; Chen, L.; Saleh, N.; Azni, F. Wireless Internet of Things-Based Air Quality Device for Smart Pollution Monitoring. Int. J. Adv. Comput. Sci. Appl. 2018, 9, 65–69. [Google Scholar] [CrossRef]
- Ibaseta, D.; Molleda, J.; Díez, F.; Granda, J.C. An IoT platform for indoor air quality monitoring using the web of things. WIT Trans. Ecol. Environ. 2019, 236, 45–56. [Google Scholar] [CrossRef]
- Ibaseta, D.; Molleda, J.; Díez, F.; Granda, J.C. Indoor Air Quality Monitoring Sensor for the Web of Things. Proceedings 2018, 2, 1466. [Google Scholar] [CrossRef]
- Idrees, Z.; Zou, Z.; Zheng, L. Edge Computing Based IoT Architecture for Low Cost Air Pollution Monitoring Systems: A Comprehensive System Analysis, Design Considerations & Development. Sensors 2018, 18, 3021. [Google Scholar] [CrossRef]
- Barcelo-Ordinas, J.M.; Ferrer-Cid, P.; Garcia-Vidal, J.; Ripoll, A.; Viana, M. Distributed Multi-Scale Calibration of Low-Cost Ozone Sensors in Wireless Sensor Networks. Sensors 2019, 19, 2503. [Google Scholar] [CrossRef] [PubMed]
- Choodarathnakara, A.; Punitha, S.; Shwetha, B.D.; Sinchana, G.S. Real Time Iot-Based Air and Noise Pollution Monitoring System. June 2022. Available online: https://www.researchgate.net/publication/361505721 (accessed on 5 March 2023).
- Marques, G.; Ferreira, C.R.; Pitarma, R. Indoor Air Quality Assessment Using a CO2 Monitoring System Based on Internet of Things. J. Med. Syst. 2019, 43, 67. [Google Scholar] [CrossRef] [PubMed]
- Prathiba, M.; Bhushan, V.P.; Andhra, P. An IoT based low cost air pollution monitoring system. Int. Res. J. Eng. Technol. 2020, 7, 857–860. [Google Scholar]
- Hsu, W.-L.; Chen, W.-T.; Kuo, H.-H.; Shiau, Y.-C.; Chern, T.-Y.; Lai, S.-C.; Fan, W.-H. Establishment of Smart Living Environment Control System. Sens. Mater. 2020, 32, 183–195. [Google Scholar] [CrossRef]
- Bazurto, J.; Zamora, W.; Larrea, J.; Munoz, D.; Alvia, D. System for monitoring air quality in urban environments applyng low-cost solutions. In Proceedings of the Iberian Conference on Information Systems and Technologies, CISTI, Seville, Spain, 24–27 June 2020. [Google Scholar] [CrossRef]
- Mahetaliya, S.; Makwana, D.; Pujara, A.; Hanumante, S. IoT based Air Quality Index Monitoring using ESP32. Int. Res. J. Eng. Technol. 2021, 8, 5186–5191. [Google Scholar]
- Sung, W.-T.; Hsiao, S.-J. Building an indoor air quality monitoring system based on the architecture of the Internet of Things. EURASIP J. Wirel. Commun. Netw. 2021, 2021, 153. [Google Scholar] [CrossRef]
- Tayeb, M.S.; Benallal, M.A.; Benabadji, M.S.; Houari, A. IoT monitoring system for air quality assessment and collecting data. Indones. J. Electr. Eng. Comput. Sci. 2022, 28, 1592–1600. [Google Scholar] [CrossRef]
- Dilusha, Y.A.U.; Priyanka, T.; Zahir, M.; Yogamalar, T.; Wijethunga, N. IoT-based Air Pollution Monitoring System for Surrounding Environments in Private Education Institute using MQ135 and MQ7 Sensors. In Proceedings of the International Conference On Business Innovation (ICOBI), Homagama, Sri Lanka, 24 November 2023; pp. 438–444. [Google Scholar]
- Velicka, J.; Pies, M.; Hajovsky, R. Wireless Measurement of Carbon Dioxide by use of IQRF Technology. IFAC-PapersOnLine 2018, 51, 78–83. [Google Scholar] [CrossRef]
- Karami, M.; McMorrow, G.V.; Wang, L. Continuous monitoring of indoor environmental quality using an Arduino-based data acquisition system. J. Build. Eng. 2018, 19, 412–419. [Google Scholar] [CrossRef]
- Jeon, Y.; Cho, C.; Seo, J.; Kwon, K.; Park, H.; Oh, S.; Chung, I.-J. IoT-based occupancy detection system in indoor residential environments. J. Affect. Disord. 2018, 132, 181–204. [Google Scholar] [CrossRef]
- Martin-Garin, A.; Millan-Garcia, J.A.; Bairi, A.; Milian-Medel, J.; Sala-Lizarraga, J.M. Environmental monitoring system based on an Open Source Platform and the Internet of Things for a building energy retrofit. Autom. Constr. 2018, 87, 201–214. [Google Scholar] [CrossRef]
- Sai, K.B.K.; Mukherjee, S.; Parveen, H. Sultana Low Cost IoT Based Air Quality Monitoring Setup Using Arduino and MQ Series Sensors with Dataset Analysis. Procedia Comput. Sci. 2019, 165, 322–327. [Google Scholar] [CrossRef]
- Rahman, M.; Rahman, A.; Hong, H.-J.; Pan, L.-W.; Uddin, Y.S.; Venkatasubramanian, N.; Hsu, C.-H. An adaptive IoT platform on budgeted 3G data plans. J. Syst. Arch. 2018, 97, 65–76. [Google Scholar] [CrossRef]
- Parkinson, T.; Parkinson, A.; de Dear, R. Continuous IEQ monitoring system: Context and development. J. Affect. Disord. 2018, 149, 15–25. [Google Scholar] [CrossRef]
- Kumar, R.; Kumar, P.; Kumar, Y. Time Series Data Prediction using IoT and Machine Learning Technique. Procedia Comput. Sci. 2020, 167, 373–381. [Google Scholar] [CrossRef]
- Kaivonen, S.; Ngai, E.C.-H. Real-time air pollution monitoring with sensors on city bus. Digit. Commun. Netw. 2020, 6, 23–30. [Google Scholar] [CrossRef]
- Wall, D.; McCullagh, P.; Cleland, I.; Bond, R. Development of an Internet of Things solution to monitor and analyse indoor air quality. Internet Things 2021, 14, 100392. [Google Scholar] [CrossRef]
- Gäbel, P.; Koller, C.; Hertig, E. Development of Air Quality Boxes Based on Low-Cost Sensor Technology for Ambient Air Quality Monitoring. Sensors 2022, 22, 3830. [Google Scholar] [CrossRef]


| Inclusion Criteria (IC) | Exclusion Criteria (EC) | ||
|---|---|---|---|
| IC1 | Publications beyond 2018 | EC1 | Duplicates |
| IC2 | Inclusion of pollution parameters related to indoor and outdoor air quality levels | EC2 | Missing focus on air quality |
| IC3 | Inclusion of clear details about the used sensors | EC3 | Missing details about the used sensors used |
| IC4 | Items based on Internet of Things techniques | EC4 | Missing clear design methodology |
| IC5 | Clearly showing the system design methodology | EC5 | Secondary studies |
| Database | 2018 | 2019 | 2020 | 2021 | 2022 | 2023 | No |
|---|---|---|---|---|---|---|---|
| IEEE Xplore | [12,13,14,15,16,17,18,19,20,21,22,23] | [5,24,25,26,27,28,29,30,31,32,33,34] | [35,36,37,38,39,40,41,42,43,44,45] | [46,47,48,49,50,51,52,53,54,55,56] | [57,58] | [41,59,60] | 49 |
| Web of Science (WoS) | [61,62,63,64,65,66,67] | [68,69,70,71,72,73,74,75,76] | [77,78] | [79] | [80,81] | [82,83] | 23 |
| Google scholar | [84,85,86,87,88,89,90] | [91,92,93] | [94,95,96] | [97,98] | [89,99,100] | 18 | |
| Science Direct | [101,102,103,104] | [105,106,107] | [26,108,109] | [110] | 11 |
| Sensor Name | Measured Parameters | Measuring Nominal Range | References |
|---|---|---|---|
| MQ135 | NH3, NOx, C2H5OH, C6H6, CO2, smoke | NH3: 10–300 ppm; C6H6: 10–1000 ppm; C2H5OH: 10–300 ppm | [12,15,21,22,23,25,30,31,32,34,42,43,47,49,50,51,52,53,55,56,58,59,60,61,69,76,80,83,84,85,87,90,92,94,95,96,97,100,105,106,108] |
| MQ7 | CO | 20–2000 ppm | [12,14,21,22,30,34,49,50,52,53,55,56,59,69,70,80,81,90,94,98,100,105] |
| MQ2 | SnO2 | 300–10,000 ppm | [27,28,34,35,50,56,59,63,70,94] |
| MQ4 | CH4 | 200–10,000 ppm | [12,21,32,50,55,63] |
| MQ5 | LPG, NG, town gas | 200–10,000 ppm | [42,50,81] |
| MQ6 | LPG, C4H10, C3H8,C2H5OH, smoke | 200–10,000 ppm | [12,20,50,59,85,90] |
| MQ9 | CO, fuel gas | 10–1000 ppm | [12,33,38,41,50,76,83,90] |
| MQ8 | H2, LPG, CO, O3 | 50 ppb O3 1~200 ppm | [43,50,64,70] |
| MQ-131 | O3 | 10–1000 ppm | [26,43,50,70,96] |
| MQ136 | O3 | −200–650 ppm | [43,70] |
| MH-Z14 | CO2 | 0–5000 ppm | [39,68,78,98] |
| OX-B431 | O3, NO2 | 20–50 ppm | [5,18,24,77] |
| MiCS-2714 | NO2, H2 | H2: 1–1000 ppm, NO2: 0.05–10 ppm | [64,87] |
| 4-NO2-20 | NO2 | 0–20 ppm | [63] |
| DGS-NO2 968-043 | NO2 | 0–5 ppm | [111] |
| DGS-CO 968-034 | CO | 1000 ppm | [111] |
| NiSb2O6 oxide | CO | 0.1–500 ppm | [71] |
| SEN0219 | CO2 | 0–5000 ppm | [79] |
| MG812 | CO2 | 350–10,000 ppm | [16] |
| MG 811 | CO2 | 0–10,000 ppm | [22,55,70,72] |
| S80053 | CO2 | 0–20,000 ppm | [29] |
| MH-Z16 | CO2 | 400–10,000 ppm | [88,89] |
| INE20-CO2P | CO2 | 0–5000 ppm | [63] |
| TDS5008 | CO2 | ND | [77] |
| Telaire T6713 | CO2 | 0–5000 ppm | [64] |
| MICS-4514 | CO, NO2 | CO: 1–1000 ppm; NO2: 50–5000 ppb | [68,111] |
| Alpha sensors (NO2B43F) | NO2 | NO2: −200–−650 ppm | [5,18,24,46,77] |
| Alpha sensors (CO-B4) | CO | CO: 420–650 ppm | [46] |
| 4-CO-500 | CO | 0–500 ppm | [63] |
| 4co-S Carbon Monoxide Elec Sensor | CO | 0–500 ppm | [41] |
| (MICS 2614 metal-oxide) | O3 | ND | [91] |
| DGS-O3 968042 | O3 | 0–5 ppm | [111] |
| MiCS2610-11 | O3 | <100 ppm | [90] |
| SP-61 | O3 | 0–250 ppm | [77] |
| OX-A431 | O3 | 0–18 ppm | [63] |
| ME2-O2 | O2 | 0~25% v/v | [22] |
| CO2Meter K-30 | CO2 | 0–5000 ppm | [102] |
| IRC-A1 | CO2 | 0–5000 ppm | [77] |
| MH-Z19 | CO2 | 0–2000 ppm; 0–5000 ppm | [93,99] |
| CDM7160 | CO2 | 300–5000 ppm | [101] |
| GSNT11 | NO2 | 0–200 ppm | [90] |
| NE4-NO2 | NO2 | 0–30 ppm | [41] |
| SO2-AF | SO2 | 0–50 ppm | [90] |
| 4-SO2-20 | SO2 | 0–20 ppm | [63] |
| 4-CL2-50 | Cl2 | 0–50 ppm | [63] |
| KG-HO2 | HCHO | 0–7 mg/m3 | [75] |
| KG-TV2 | TVOC | 0–3 mg/m3 | [75] |
| KG-C62 | C6H6 | 0–320 mg/m3 | [75] |
| KG-C22 | CO2 | 0–0.5% | [75] |
| KG-C12 | CO | 0–500 ppm | [75] |
| KG-N22 | NO2 | 0–20 ppm | [75] |
| KG-O3 | O3 | 0–20 ppm | [75] |
| CJMCU-30 | TVOC/eCO2 | ND | [99] |
| CJMCU-6814 | CO, VOC, NH3 NOx | CO: −1000 ppm; NO2: 0.05–10 ppm | [99] |
| SCD30CO2 | CO2, RH and T | 400–10,000 ppm | [37,49,81] |
| SGP30 | TVOC, CO | 0–1000 ppm | [33,36] |
| CCS811 | TVOC, eCO2 | CO2: 400–8192 ppm; VOC: 0–1187 ppm | [37,65] |
| GP2Y1010AU0F Optical Sensor | PM2.5, PM10 | 0–600 μg/m3 | [16,30,31,42,46,50,53,56,57,60,68,80,86,90,95,97,98,102,106] |
| PMS 5003 | PM2.5 | 0–500 μg/m3 | [29,43,49,66] |
| DSM501A | PM2.5 | ≤8000 pcs/283 mL | [25,26,38,55,90] |
| PMS7003 and Plantower | PM2.5 | 0–500 μg/m3 | [5,48] |
| SPS30 sensor | PM2.5 | 1, 2.5, 4 and 10 µg/m3 | [36,37,111] |
| SDS021 sensor | PM2.5, PM10 | 0.3–10 μm | [28] |
| KG-PM2 | PM2.5, PM10 | 0–1000 μg/m3 | [75] |
| SEN0177 | PM2.5 | 0~500 μg/m3 | [79,103] |
| SM-PWM-01C | PM2.5 | 1–999 µg/m3 | [19] |
| PMS1003 | PM2.5, PM10 | 0~500 g/m3 | [39] |
| PMS3003 | PM2.5 | 0.3~1.0; 1.0~2.5; 2.5~10 (mm) | [35] |
| PPD42NS | PM2.5 | 0.1 mg/m3 | [62] |
| DHT22 | T, RH | T = −40–80 °C; RH = 0–100% | [14,24,39,41,47,53,64,70,87,95,99,104,108] |
| DHT11 | T, RH | T = 0–50 °C; RH = 20–90% | [5,15,23,25,28,40,50,55,56,60,61,62,80,83,90,92,97,105,106] |
| SHT21 | T, RH | T = −40–125 °C; RH = 0–80% | [65,104] |
| BME280 | T, RH, P | T = 0–60 °C; RH = 0–100%; P = 300~1100 hPa | [36,39,49,63,65,101] |
| SHT30 | T, RH | T = −55–125 °C; RH =0–100% | [29] |
| SHT31 | T, RH | T = −40–125 °C; RH = 0–100% | [19] |
| SHT25 | T, RH | T = −40–125 °C; RH = 0–100% | [88] |
| HMP60 | T, RH | T = −40–60 °C; RH = 0–100% | [102] |
| MCP9802 | T | T = −55–125 °C | [101] |
| KG-TN2 | T, RH, illumination, N | T = −40–80 °C; RH = 0–99.0%; I = 0–2000 Lux; N = 0–120 dB | [75] |
| BMP180 | P, T | P = 300–1100 hPa; T = −40–85 °C | [17,38,64,80] |
| LM35 | T | T = −55–150 °C | [16,20,85] |
| DS18B20 | T | T = −55 –125 °C | [17] |
| BMP280 | P, T | P = 300–1100 hPa; T = −40–85 °C | [33,76] |
| SY-H5220 | T, RH | T = 0–60 °C; RH = 30–90% | [85] |
| HDC1080 | T, RH | T = −40–125 °C; RH = 0–100% | [33] |
| BME680 | RH, VOC, T, P | T = −40–85 °C; RH = 0–100%; P = 300–1100 hPa; VOC = 0.5–15 ppm | [37,44,72,73,99,110] |
| MiCS-5524 | CO, CH CH2OH, VOC | CO: 1–1000 ppm, NH3:1–500 ppm, CH2OH: 10–500 ppm | [64] |
| WSP2110 | Air quality, CO, NH3, NO2 | C2H5OH: 10–500 ppm, H2: 1–1000 ppm, NH3: 1–500 ppm, CH4: >1000 ppm, C3H8: >1000 ppm, C4H10: >1000 ppm | [63] |
| TGS2602 | Air quality (VOC, NH3, H2S) | CH2OH: 1~30 ppm | [67] |
| TGS2603 | (C3H9N, CH4) | CH2OH: 1–10 ppm | [67] |
| TGS2612 | CH4, LPG, C3H8, C4H10 | 1–25% LEL of each gas | [67] |
| TGS2620 | CH3CH2OH | 50–5000 ppm | [67] |
| TGS-2610 | CH3CH2OH, CH4, C3H8, C4H10 | 500–10,000 ppm | [62] |
| MICS-6814 | C6H5CH, CH4, C6H6, CH3CH2OH | 1~50 ppm | [74] |
| SAMBA | Air and radiant T, RH, air speed, light levels, sound, P, CO2, TVOC | 102 µg/m3 | [107] |
| Waspmote | CO, CO2, O2, O3, NO, NO2, SO2, NH3, CH4, H2S, PM0.1, PM2.5, PM10, T, RH, P | ND | [45,109] |
| Microcontrollers | References |
|---|---|
| Arduino Uno | [12,20,22,23,31,34,35,38,42,43,47,51,52,55,61,69,72,79,81,84,85,91,92,98,102,103,105,107,108] |
| Arduino Nano | [12,56,81,106] |
| Arduino mega2560 | [45,86,111] |
| Arduino Yun | [18] |
| Arduino mega | [39] |
| ESP8266 | [12,14,21,22,23,25,27,34,35,46,49,50,52,53,54,55,59,60,61,62,66,71,73,74,76,82,85,90,93,95,96,104] |
| ESP32 | [26,30,32,37,39,40,50,68,71,77,78,80,88,89,97,99,100,110,111] |
| Raspberry Pi | [5,12,31,38,55,65,83,101] |
| Raspberry Pi2 | [63,87] |
| Raspberry Pi3 | [15,24,28,32,33,39,44,48,70,72,75,76,106] |
| Raspberry Pi4 | [57,82] |
| ATmega328P | [40,59,69,90] |
| M0 | [48] |
| AVR | [13,41] |
| Wemos D1Mini | [53,66] |
| ARM7 | [94] |
| STM32F103C8T6 | [29] |
| Atmel AVR | [13] |
| ATSAMD21G18 | [36] |
| Waspmote, meshlium | [45,109] |
| ATmega328 | [16,62] |
| Pycom Gpy | [88,111] |
| PIC16F877A | [21] |
| Interfaces | References |
|---|---|
| Web services, webpage, IoT cloud, and API | [5,12,13,14,16,18,20,22,24,25,26,27,28,29,30,31,35,36,38,39,41,43,45,46,48,49,50,51,52,53,54,56,57,59,61,62,63,64,66,67,68,69,70,72,73,74,76,77,79,80,81,82,84,85,87,88,89,90,91,93,95,96,97,98,101,102,103,104,105,107,110] |
| Mobile app | [12,13,14,16,18,21,23,24,25,27,29,30,32,34,39,40,42,44,47,53,60,62,64,68,72,73,74,78,82,83,93,95,96,99,103] |
| LCD, LED, OLED displays | [20,21,35,41,44,50,51,55,59,60,84,86,104,108] |
| Serial monitor IDE | [47,49,92] |
| Communication Technologies | References |
|---|---|
| Wi-Fi model, shield, or ESP series | [12,14,19,21,22,23,24,27,29,30,31,32,33,34,35,37,38,40,43,44,45,46,49,50,51,52,53,54,55,56,59,60,61,62,64,65,66,68,69,70,72,73,74,76,77,78,80,82,84,85,90,91,93,94,95,96,97,98,100,103,104,105,109,110] |
| LoRa WAN | [29,36,46,48,62] |
| ZigBee and Xbee RF | [5,13,18,23,24,63,90,102,107] |
| (BLE) | [65] |
| 3/4G modem and GPS/GPRS/GSM | [15,20,24,39,41,45,79,81,91,106,109] |
| Ethernet and USB or serial port | [16,45,47,57,92] |
| Environment | References |
|---|---|
| Indoor | [17,19,22,23,25,29,30,31,32,33,34,37,40,42,45,47,53,57,63,64,66,67,68,69,73,74,75,80,82,87,88,89,93,95,98,101,102,104,107,110] |
| Outdoor | [5,14,16,18,21,24,28,38,46,48,50,54,55,71,76,79,81,84,86,91,109,111] |
| Indoor and outdoor or the environment is not mentioned | [12,13,15,16,18,20,26,27,35,36,41,43,44,49,50,51,52,56,58,59,60,61,62,65,70,72,77,78,83,85,90,92,94,96,97,99,100,103,105,106,108] |
Disclaimer/Publisher’s Note: The statements, opinions and data contained in all publications are solely those of the individual author(s) and contributor(s) and not of MDPI and/or the editor(s). MDPI and/or the editor(s) disclaim responsibility for any injury to people or property resulting from any ideas, methods, instructions or products referred to in the content. |
© 2024 by the authors. Licensee MDPI, Basel, Switzerland. This article is an open access article distributed under the terms and conditions of the Creative Commons Attribution (CC BY) license (https://creativecommons.org/licenses/by/4.0/).
Share and Cite
Alsamrai, O.; Redel-Macias, M.D.; Pinzi, S.; Dorado, M.P. A Systematic Review for Indoor and Outdoor Air Pollution Monitoring Systems Based on Internet of Things. Sustainability 2024, 16, 4353. https://doi.org/10.3390/su16114353
Alsamrai O, Redel-Macias MD, Pinzi S, Dorado MP. A Systematic Review for Indoor and Outdoor Air Pollution Monitoring Systems Based on Internet of Things. Sustainability. 2024; 16(11):4353. https://doi.org/10.3390/su16114353
Chicago/Turabian StyleAlsamrai, Osama, Maria Dolores Redel-Macias, Sara Pinzi, and M. P. Dorado. 2024. "A Systematic Review for Indoor and Outdoor Air Pollution Monitoring Systems Based on Internet of Things" Sustainability 16, no. 11: 4353. https://doi.org/10.3390/su16114353