Article

Exploring the Impact of Urban Road Network Characteristics on City Fringe Tourist Areas: A Case Study of Xi’an, China

School of Civil Engineering, Xi’an University of Architecture ang Technology, Xi’an 710055, China
*
Author to whom correspondence should be addressed.
Sustainability 2024, 16(11), 4359; https://doi.org/10.3390/su16114359
Submission received: 30 March 2024 / Revised: 17 May 2024 / Accepted: 18 May 2024 / Published: 22 May 2024
(This article belongs to the Collection Tourism Research and Regional Sciences)

Abstract

:
With the process of urban expansion, the urban road infrastructure gradually develops and improves, and the urban fringe tourism area gradually receives the attention of tourists, meaning there may be a mismatch between the demand and the early transportation planning for the urban fringe tourism area. In order to explore the relationship between urban road network structure characteristics and urban fringe tourist areas, this study chose Kunming Lake in Xi’an City as the research object and obtained the consumer development characteristics of urban fringe tourist areas through a comparison of POI data. We explored the traffic development trend in urban fringe tourist areas based on a spatial syntactic model by quantifying the road network structure characteristics using the indexes related to depth, integration, and choice. The results of the study show that the consumer development level of the urban fringe tourism area is poor compared with that of the built-up scenic area, and tourists tend to travel in the scenic area but do not live in this neighborhood. The average normalized depth values in the axial and segmental maps were 0.52 and 0.42, respectively, indicating that expressways and ring roads can improve the accessibility of urban fringe tourist areas. The expansion of motorized transportation activities gradually increases the importance of urban fringe tourist areas. There is a significant correlation between the road network density and route selection, although the correlation between the two gradually decreases as the measured radius increases. The conclusions drawn from this study provide methodological references and research paradigms for the development of city fringe tourist areas and urban transportation planning.

1. Introduction

In the past few years, the global tourism industry has been developing rapidly, and tourism revenue accounts for about 6% of the global GDP [1]. China’s tourism has also developed rapidly in the past few years, with tourist arrivals and tourism revenues showing steady increases year after year. Although the development of tourism has been affected by the COVID-19 pandemic in an unstable manner, it is predicted that as the impact of the COVID-19 pandemic diminishes and the related restrictive policies are weakened, the tourism industry will be restored to 70% of the peak tourism level [2], meaning the tourism industry will still have a huge market and clear prospects in the future. Tourism not only promotes economic development but also has impacts on social stability and environmental sustainability [3].
Scenic tourism areas will drive the development of regional economies [4], and the development of tourist attractions has high potential to enhance the economic efficiency of remote and underdeveloped areas [5]. In the course of the development of the tourism industry, it has been found that suburban tourism and rural tourism have gradually become popular leisure methods for urban residents [6]. Particularly in the context of the COVID-19 pandemic, the restrictions on travel changed people’s recreational behaviors, making the countryside and suburbs more attractive options while maintaining social distancing [7]. In the post-pandemic era, tourism patterns have gradually become de-centralized, and suburban and rural scenic areas have become significantly more important to the road network [8]. Changes in the travel choices of urban residents provide market opportunities for the development of suburban and rural tourism [9].
Urban fringe areas, which are variously called exurbs or urban–rural continuum, peri-urban, semirural, or semi-urban areas in different studies, refer to the transition zones between urban and rural areas [10]. City fringe tourist areas in close proximity to cities tend to be more economically viable than rural areas [11]. Urban fringe areas have unique potential and characteristics for tourism development that need to be analyzed separately [12].
The formation of urban fringe areas is closely linked to the process of urban expansion [13]. Urban expansion has become an international phenomenon due to the increasing population [14]. The expansion of the road network is a characterizing indicator of urban expansion, and the road network tends to increase in size with the process of urban expansion [15], while roads play a crucial role in the development of tourism [16]. With the process of urban expansion, the construction of new urban areas increasing and the corresponding road facilities are also improving, meaning road networks often gradually extend to the outside to improve the scenic spots that existed at a distance from the built-up areas of the city in the early days gradually connect with the city and the urban fringe tourist areas gradually become easier to reach [17]. At the same time, as the motorized travel process continues to accelerate, long-distance travel has become more convenient. As the rates of motorization and urbanization continue to increase, the road infrastructure becomes more complete, facilitating the diversification of tourist choices. The construction of tourist highways has a mutual promotion effect on the economic development and construction of facilities in the surrounding areas [18].
According to the rule of urban expansion, new urban areas will eventually develop into built-up urban areas [19], and scenic areas on the edge of a city will gradually develop into scenic areas within the city, creating new urban areas and scenic areas on the edge of the city. Transportation facilities are a key factor in determining tourists’ travel patterns to scenic areas on the outskirts of cities. There are certain differences in the development trends of tourism in urban edge scenic areas in different countries, although the relevant laws are basically applicable, such as the impact of the distance attenuation effect on urban edge scenic areas [20]. Transportation facilities are a key factor in determining tourists’ travel patterns to scenic areas on the outskirts of cities. Tourists tend to prefer areas with convenient transportation options, as well as famous scenic spots and historical sites [21]. Some urban fringe tourist areas were formerly underdeveloped, meaning the surrounding roads mainly had to bear the transit traffic. With the gradual popularity of urban fringe tourist areas, the peripheral roads will have to bear the tourist traffic again. Motorized traffic often has a negative impact on the local area [22], with the double traffic pressure of transit traffic and tourist traffic, meaning the road facilities planned in the early days may not be able to meet the demands of future travelers, thereby causing traffic pressure and environmental pressure [23].
Analyzing the spatiotemporal dependencies between different regions in a road network and exploring changes in human activity patterns and travel demands have become popular research themes in recent years [24]. Studying the spatial distribution characteristics of tourist areas can effectively strengthen the coordination relationship between tourist areas and neighboring cities [25]. Changes in road network structures often lead to changes in human activity patterns [26]. In order to solve the problems faced during transportation planning, it is necessary to analyze the road network from a macroscopic point of view and explore the impacts of changes in the road network structure on human activity patterns and traffic in urban fringe tourist areas. More than 60% of human activities can be explained by topological relationships [27], and topological relationships can effectively respond to the trends of human activities in macro-analyses [28]. It is meaningful to establish a macro-analysis paradigm for urban fringe scenic areas from the perspective of road network structures to assess the relationship between urban spaces, road network structures, and scenic locations, which could promote the development of urban fringe scenic areas from the perspectives of urban planning and road network planning and the role of scenic areas as promoters of the regional economy, thereby promoting the rapid development of the new urban areas.
The theory of space syntax provides a new paradigm for the study of urban spaces and road network structures, which can be used to study the development patterns of urban road networks and the changes in human activities from a macroscopic point of view [29]. In the 1870s, Bill Hillier founded the theory and methodology of space syntax at the University of Cambridge [30], which explains the spatial patterns and socioeconomic activities at different scales, such as for buildings, neighborhoods, and towns, in the context of spatial creation activities. Patterson found that spatial syntactic modeling is an effective means of characterizing urban-scale motorized transportation networks [31]. Perera used space syntax to analyze the urban community of Badulla, and found that spatial features play a role in generating different types of social activities and influences the nature of these activities [32]. The advantage of space syntax is that it takes into account spatial uncertainty and analyzes the spatial properties of different locations [33]. Space syntax can be used to effectively describe the nature of urban spaces, road networks, and social activities. From the perspective of analytical principles, space syntax cannot be used to analyze a characteristic object; this needs to be abstracted into spatial relationships based on the characteristics of the research object, with the appropriate research scale being selected to apply the space syntax model for the analysis.
Space syntax research for tourist attractions is divided into the study of the internal space of a scenic area and the study of the relationship between the scenic area and the external road network. The internal space of the scenic area can be used to study the impact of traffic organization inside the scenic area on tourist flow. Khaled [34] conducted a space syntax visibility analysis of roads in historic districts and used an agent to model two different historic districts in the north of Lebanon to establish a research framework to find the critical factors affecting tourists’ wayfinding patterns. Jamhawi [35] investigated the effects of spatial configurations on tourist flow patterns and the impacts on cultural heritage sacred sites. The main focus in the study of the relationship between scenic spots and external road network connectivity is to study the distribution of popular scenic spots and the factors affecting them, as well as the impacts of the locations of the scenic spots and road facilities. Suvannadabha [36] compared the effects of spatial patterns using a statistical analysis of social media data and the results of a spatial syntactic analysis to determine the factors influencing the locations of popular tourist attractions and the popularity of those tourist attractions. Quin [37] used the space syntax approach to analyze the development process of tourism-driven rural economic and social structures and identified the changing patterns of indicators such as integration and choice in rural areas before tourism development, at the early stage of tourism-driven development, and at the late stage of tourism-driven development. Can [38] linked the space syntax approach with park use data from field surveys and used the three space syntax indicators of connectivity, integration, and choice measurement perspectives to analyze the characteristics of the road network around the park, establishing three multiple regression analyses to analyze the effects of space syntax data and park attributes on the number of park users.
Each urban fringe scenic area has special characteristics, and it is necessary to characterize each area through a variety of data. The space syntax approach is already a mature method, which can be used to obtain the corresponding road network characteristics for the characterized area and can be applied to the urban fringe scenic area to analyze it from a new perspective. Therefore, we chose a typical urban fringe scenic area for POI analysis to illustrate the special characteristics of its geographic environment and used this scenic area as the object of our space syntax research to explore the influence of the characteristics of the urban road network on the urban fringe tourist area. This paper provides methodological references and research paradigms for the development of urban fringe scenic areas from the perspective of road network planning, giving full play to the potential of urban fringe scenic areas for regional development.

2. Study Area Description

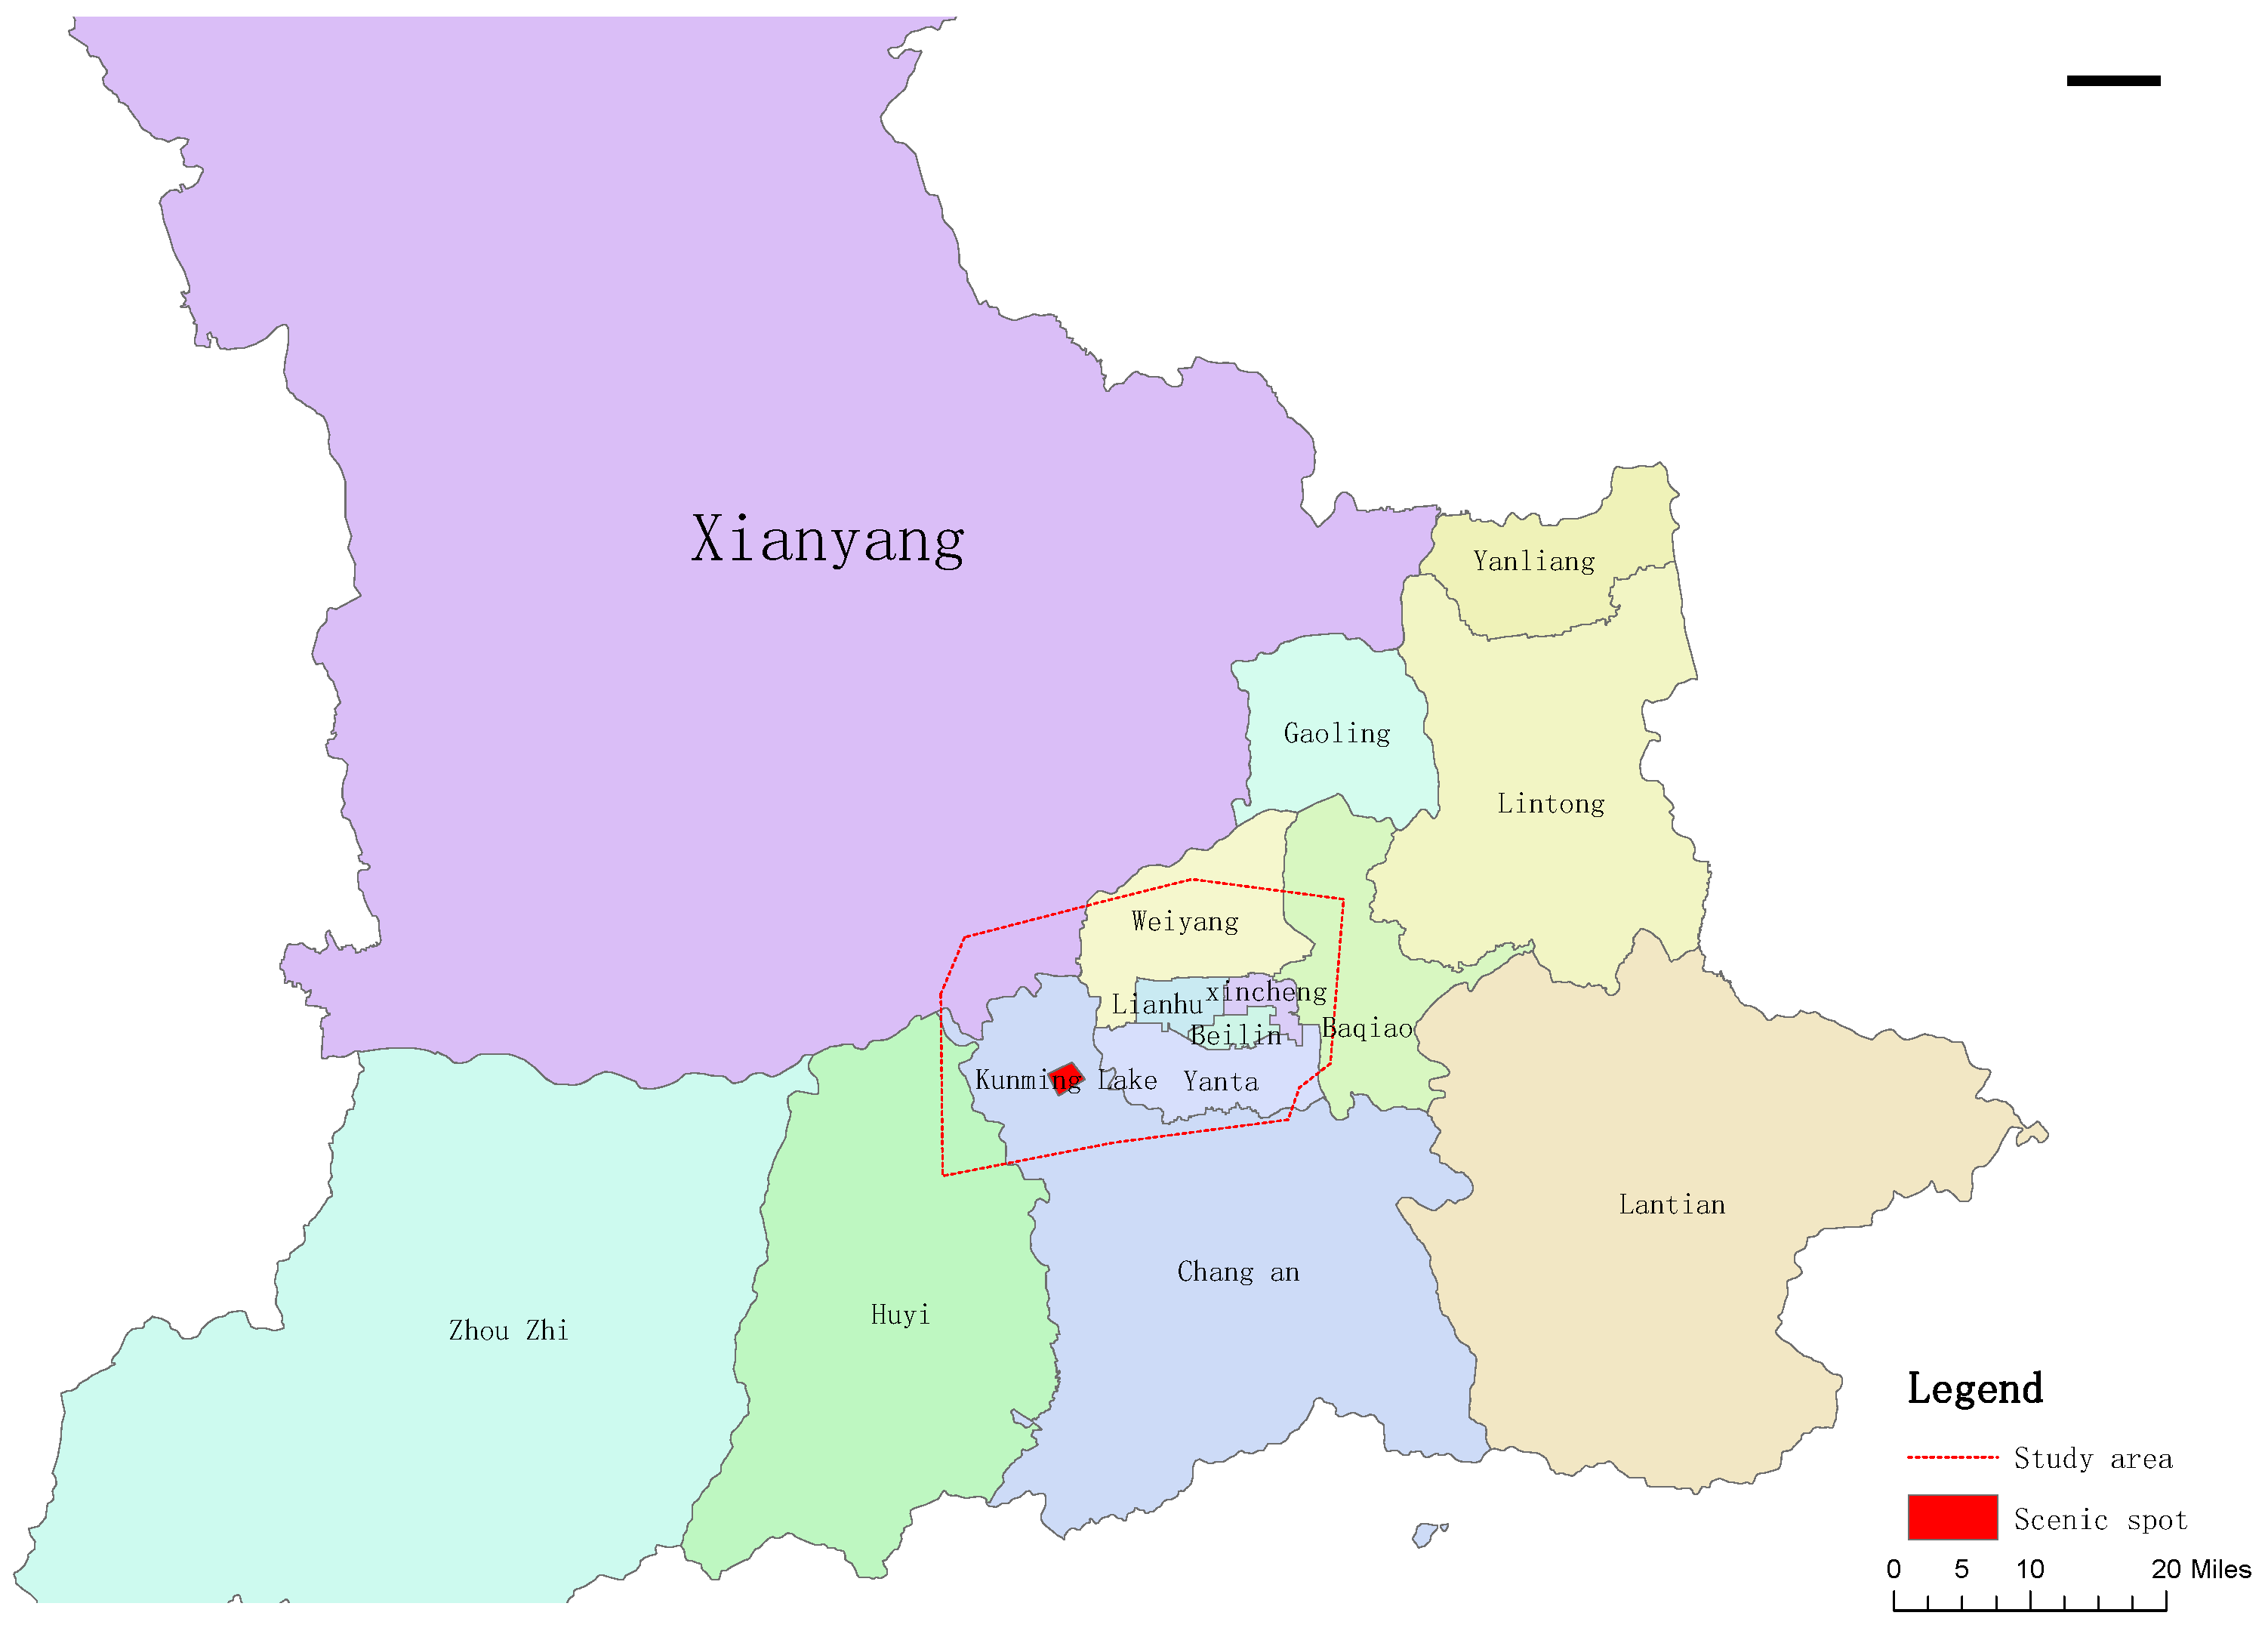
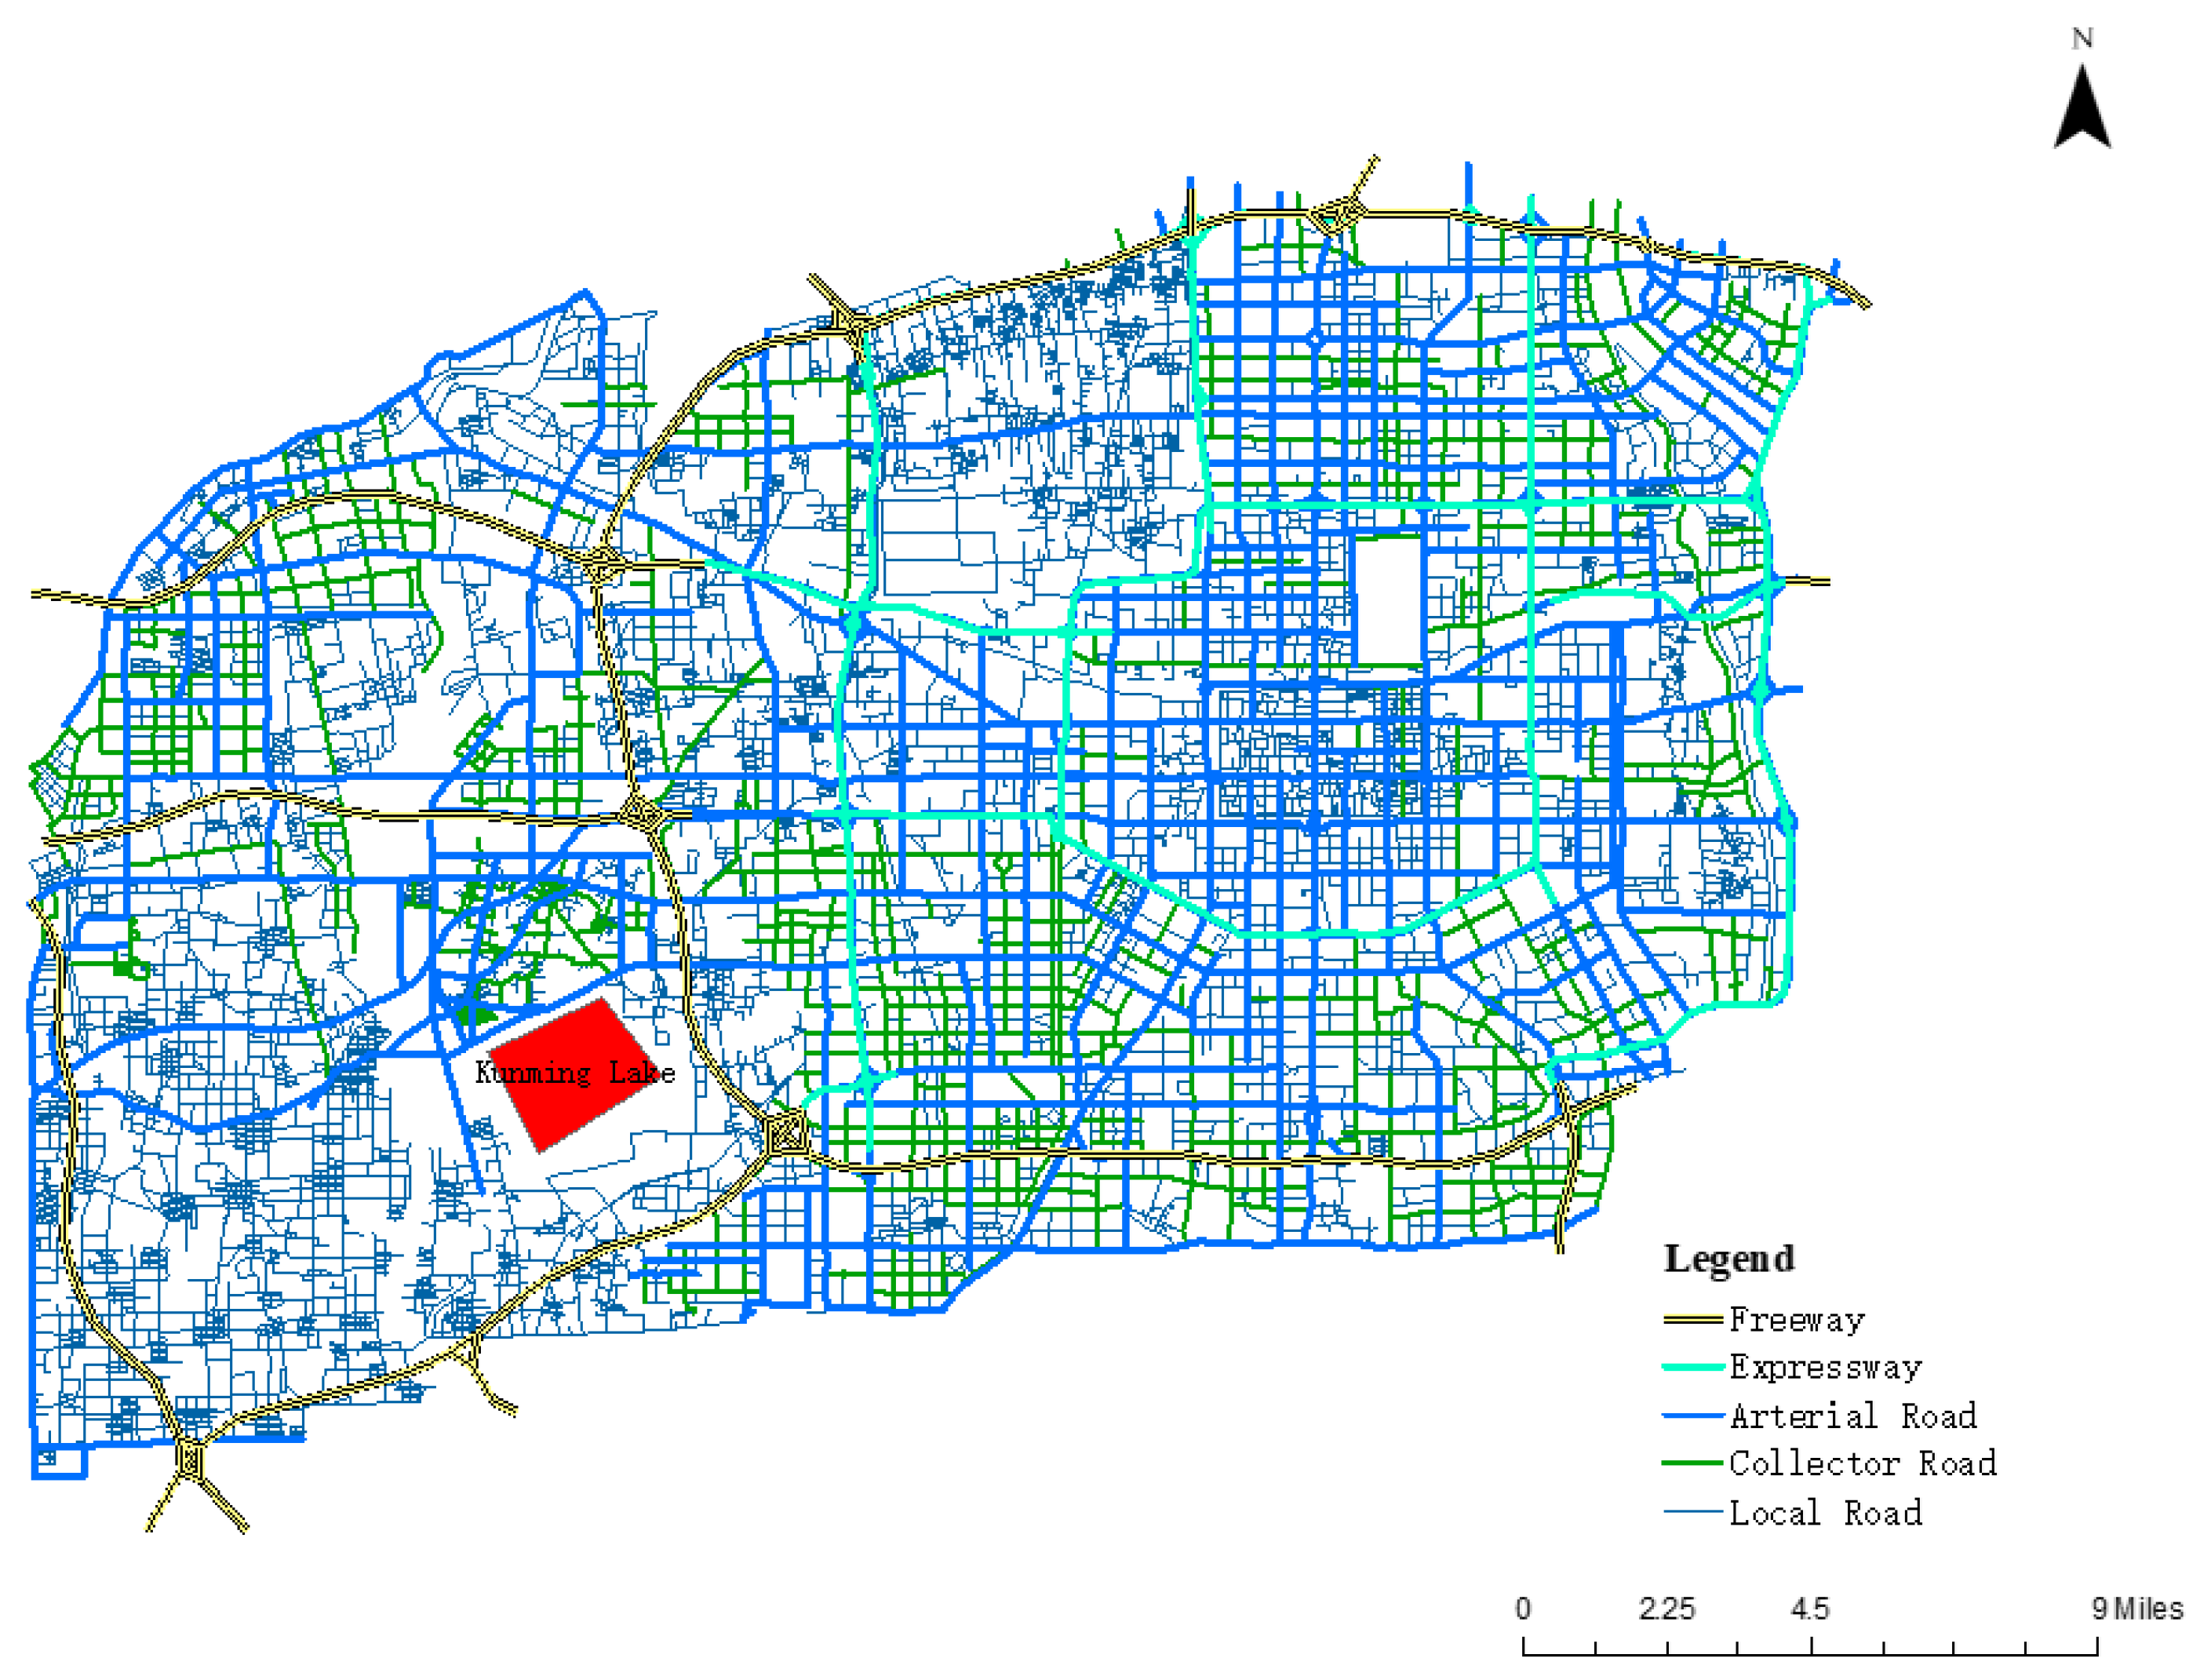
2.1. Overview of the Study Area

Xi’an includes thirteen districts, of which Weiyang, Gaoling, Yanliang, Changan, Huyi, and Zhouzhi are adjacent to Xianyang (Figure 1). In 2002, Xi’an City and Xianyang City began to propose the idea of integration, and new districts were gradually formed in the areas adjacent to the two cities. The continuous development of the new district has led to the improvement of road facilities and the construction and opening of the surrounding scenic spots.
China’s tourism development is more focused on historic monuments [39]. Kunming Lake, one of the largest artificial lakes in ancient China, is located on Yudou Road, Chang’an District, Xi’an City, Shaanxi Province, within the Xixian New Area. Built in the Han Dynasty to practice water warfare, Kunming Lake was gradually abandoned and dried up after the Han Dynasty, replaced by vast farmland. In the development of the Xixian New Area, the Kunming Lake Scenic Area was redeveloped. The first phase of the project was completed in 2017 and it has been continuously improved and developed since then. Considering Kunming Lake’s geographic location and development process, it belongs to the class of city fringe tourist areas studied in this paper, so it was taken as the research object.

2.2. Analysis of City Fringe Tourist Area Characteristics

The integration of consumer conditions is a response to the development of scenic areas [40], for which POIs are widely used to indicate the level of development of the consumer conditions [41]. POI data are easier to process compared to traditional land survey data, remote sensing data, and socioeconomic data, having a higher level of precision in land use analyses [42]. To illustrate the difference between the development of scenic areas in city fringe tourist areas and urban built-up areas and to highlight the characteristics of city fringe tourist areas, this paper focuses on the famous scenic area of the Dayan Pagoda in Xi’an for a POI data comparison. The POI data were obtained from the relevant amap platform (https://ditu.amap.com). To compare the current development level and development process, the POI data for the two years of 2018 and 2023 were selected for comparison and the POI distribution for the circular area within a radius of 3 km were plotted (Figure 2).
Figure 2a represents the location relationship between the two scenic spots. The area within the third ring road of Xi’an belongs to the built-up area of the city, the Dayan Pagoda belongs to the group of scenic spots in the built-up area of the city, and Kunming Lake belongs to the group of scenic spots in the new area of urban development. Figure 2b,c show the changes in POI data for the Kunming Lake Scenic Area from 2018 to 2023. The number of POIs in 2023 is obviously larger than that in 2018, indicating that the businesses around the scenic spot have been developed to a certain extent. Figure 2d,e show the changes in the scenic spot POI data for the Dayan Pagoda from 2018 to 2023, showing that the total number of businesses around the scenic spot is more stable. Figure 2c,e show the changes in the surrounding POI data for the Kunming Lake Scenic Area and Dayan Pagoda Scenic Area. The Dayan Pagoda, as a scenic area in the built-up area of the city, has a much larger number of surrounding POIs and a much larger level of development than the Kunming Lake Scenic Area. Compared to the distribution of POIs around the Dayan Pagoda Scenic Area, only the northern area of the Kunming Lake Scenic Area has a greater concentration of POIs, which shows the unevenness of the regional development, probably due to the fact that the entrance of the Kunming Lake Scenic Area is located in the northern part of the scenic area, which is more likely to attract the consumer conditions needed for development.
In order to compare the changes in POI data more accurately, the numbers of POIs in the surrounding area were compared and the POI data were divided into the consumer conditions broad category, consumer conditions mid-category, and consumer conditions sub-category. The relationship between the consumer conditions broad category and consumer conditions mid-category is shown in Table 1.
Due to the different levels of development and large differences between the two regions, the consumer conditions sub-category and consumer conditions mid-category were more difficult to compare and analyze, so we chose to compare the consumer conditions broad category in its entirety and the consumer conditions mid-category in part to explain the declining trend.
The POI types in Table 1 were synthesized and the development trend of the neighboring industries with a greater impact on tourists was selected for the analysis. Healthcare services and living services mainly target the needs of residents, while the business and residential, science, education and culture, and financial and insurance services and company enterprises were mainly considered regarding the relationships between land prices, house prices, economic development trends, and government development policies. These categories have little influence on tourists, so they were not specifically analyzed for their changing characteristics. The comparison results are shown in Table 2.
The difference in the development patterns of the two scenic areas can be obtained from Table 2. As a famous scenic spot in the built-up area of the city, the total number of POIs for the Dayan Pagoda is much larger than for Kunming Lake, which indicates that the attractiveness of this scenic spot at the edge of the city is much lower than that of the famous scenic spot in the built-up area of the city due to its late development, and the development of the neighboring businesses is lagging behind.
Accommodation services are mainly residential services for tourists. The Dayan Pagoda grew from having 1032 POIs in 2018 to 1567 in 2023, indicating an increase in the demand for tourism visitor residences in the vicinity. The number of POIs for Kunming Lake decreased from 13 in 2018 to 12 in 2023, meaning the demand for tourism visitor residences in the vicinity remains largely unchanged, indicating a lower demand for tourism visitor residences in the vicinity. Considering the geographic locations of the two areas, the consumer conditions around Kunming Lake are more homogeneous and less attractive, meaning tourists are more likely to choose not to stay in the vicinity after visiting the area, which is also a characteristic of the scenic area on the edge of the city.
The accessibility of transportation services affects tourists’ travel choices. The numbers of POIs for transportation service are shown in Table 3. Comparing the changes in transportation services, the number of bus stations in the Dayan Pagoda Scenic Area decreased from 213 to 86, while the number of metro stations increased from 32 to 50, creating a change in the structure of the public transportation network in the built-up area of the city. The area around the Dayan Pagoda Scenic Area is very congested during peak hours, and the addition of metro stations could reduce the impact of buses on the ground transportation network. In Kunming Lake, the construction of metro station has not been completed in the new area of the city and the number of bus stations has been reduced from 26 to 19, which indicates that the passenger flow is not large. The lag in the construction of public transportation services in the urban fringe scenic area has led to a decrease in tourists’ willingness to travel, and this decrease in tourists’ willingness to travel has affected the passenger flow, in turn leading to the lower priority for the development of public transportation services, meaning the main travel mode in the urban fringe scenic area is motor vehicles, which is not attractive to foreign tourists and has led to its slow development.
Shopping services reflect the short-term demands of tourists, who generally prefer to buy goods with local characteristics as souvenirs, which can reflect the prosperity of scenic spots. However, the impact of the epidemic and the rise of e-commerce have affected the overall consumer conditions of physical shopping services to a certain extent. Scenic spots in built-up areas have a large number of shopping services and are more affected, with the number of POIs dropping from 5771 to 2954, whereas scenic spots on the urban fringes of new urban areas are not yet fully developed and are not yet saturated with shopping services, so they are less affected, with the number of POIs increasing from 256 to 277.
Catering services also respond to the demands of tourists while traveling. Most tourists (especially foreign tourists) do not have the facilities to cook by themselves, so the number of restaurants potentially relates to the tourist attraction of the scenic area, meaning more tourists will bring about a greater supply of catering services. The numbers of catering services increased in both scenic areas, the number of scenic POIs in the built-up area was 4226, and the number of POIs in the scenic area at the edge of the city was 204. The difference in the numbers of POIs may have been due to two reasons. One is that scenic areas in built-up areas are more attractive. The other is that catering services in built-up areas address residents’ demands in addition to tourists’ demands, while the population density of new urban areas where urban fringe scenic areas are located will be lower than that of built-up areas.
In general, compared with the scenic areas in the built-up areas of the city, the industrial development potential around the city fringe tourist areas is larger, and their ability to withstand the impacts of various risks is better. Regarding the POI trend, the development of consumer conditions is slow, and this is an important driving force to promote the development of the surrounding area [43], indicating that the surrounding development power is insufficient. Urban public transportation is highly relevant to the travel demand of city fringe tourist areas, and the lack of development of urban public transportation will inhibit the tourism demand from the residents [44]. The reason for the lack of development momentum may be due to the limited development of urban public transportation in the region. At the same time, the existence of a certain scale of development of services in the region suggests that changes in the structure of the road network may have increased the attractiveness of the scenic area to tourists using motorized transportation to travel. Therefore, we used the space syntax approach to analyze the road network around the scenic area to explore the changes in the scenic area brought about by changes in the road network structure.

3. Methods

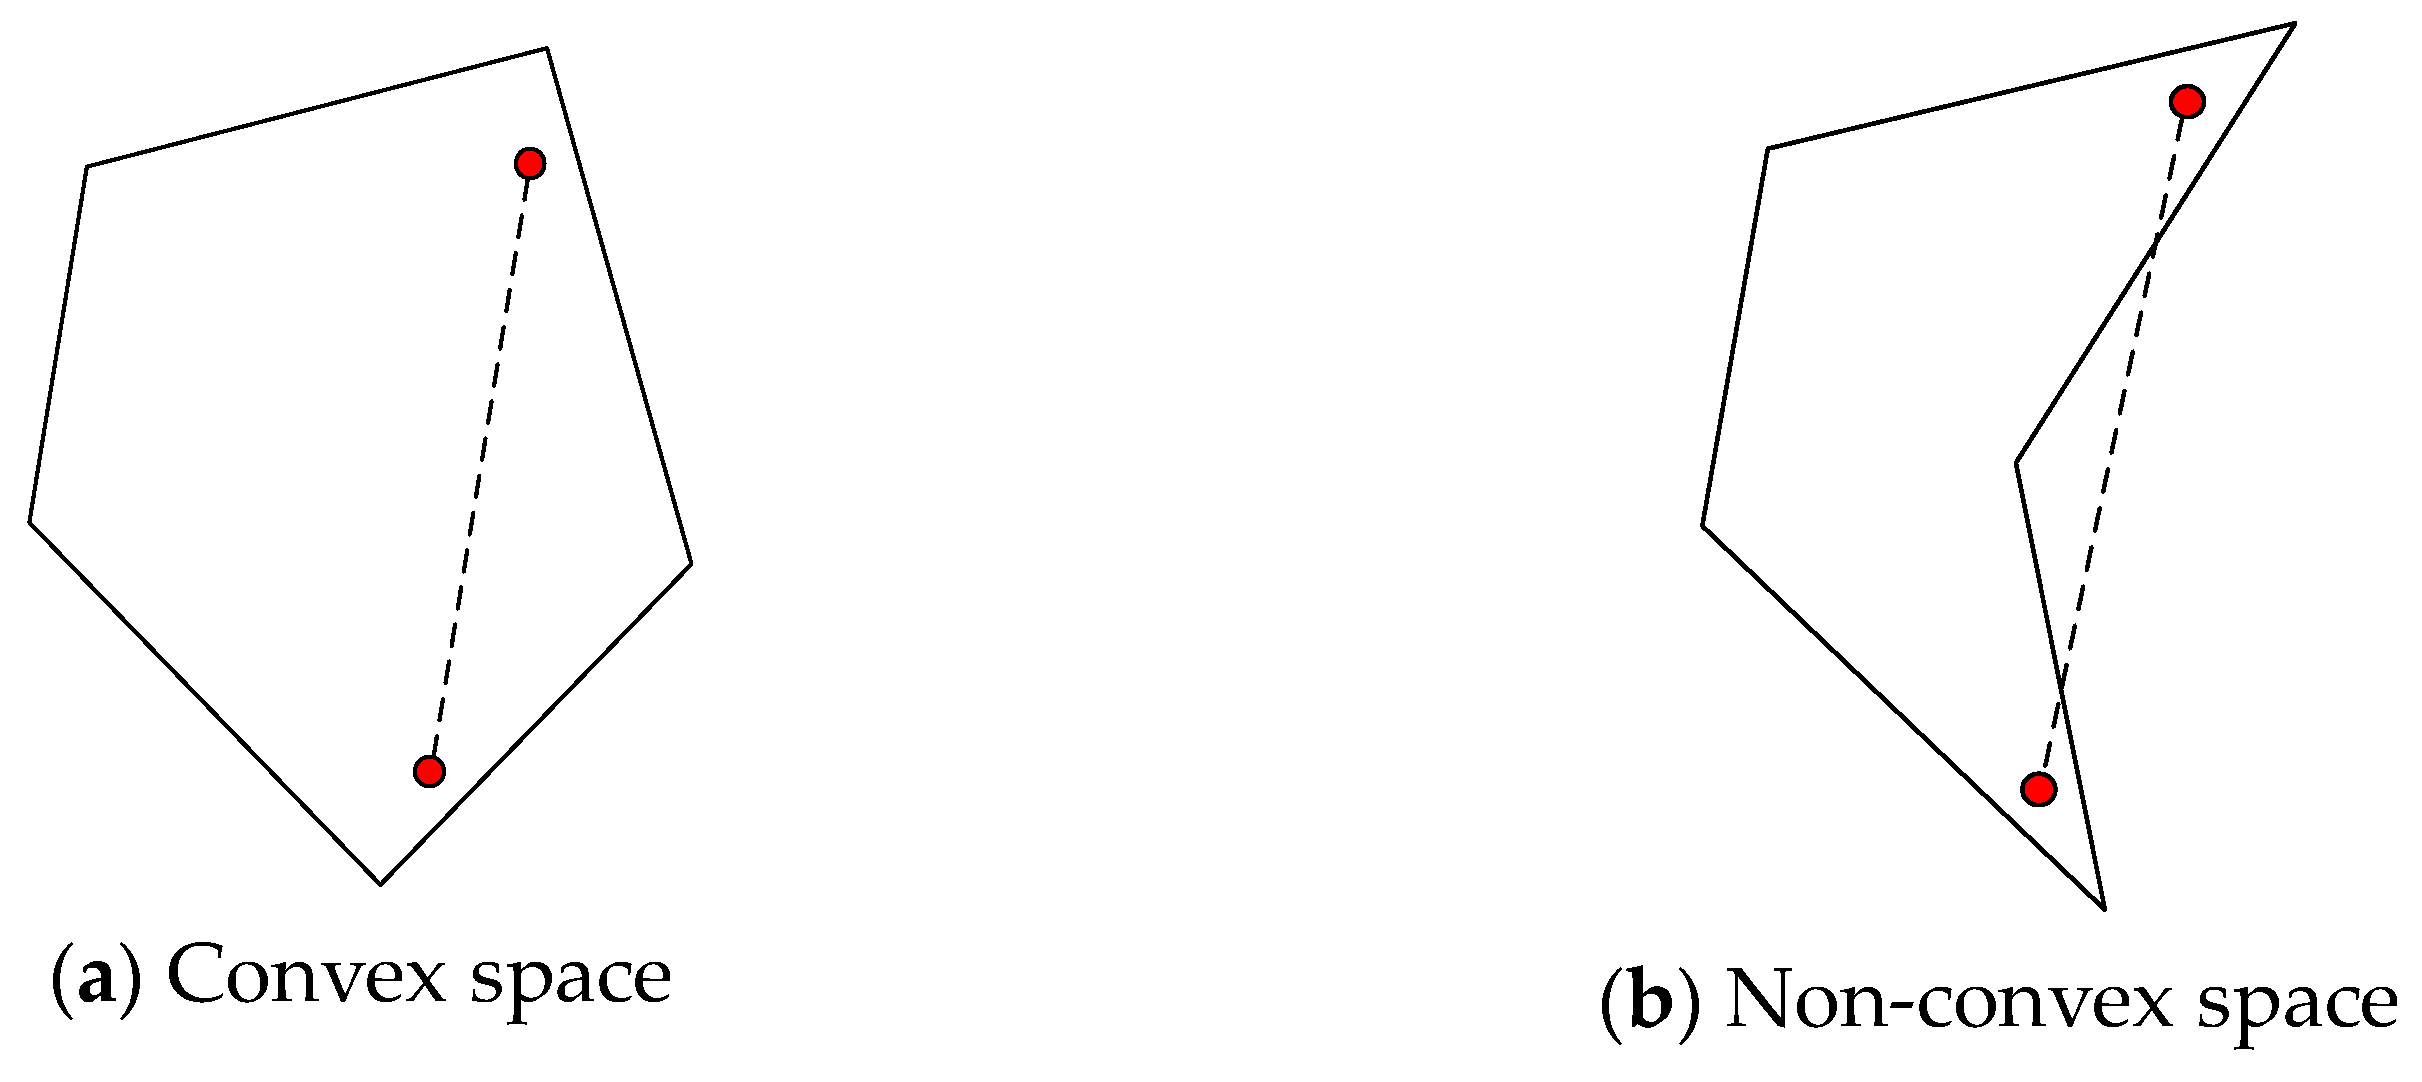
3.1. Space Syntax Model

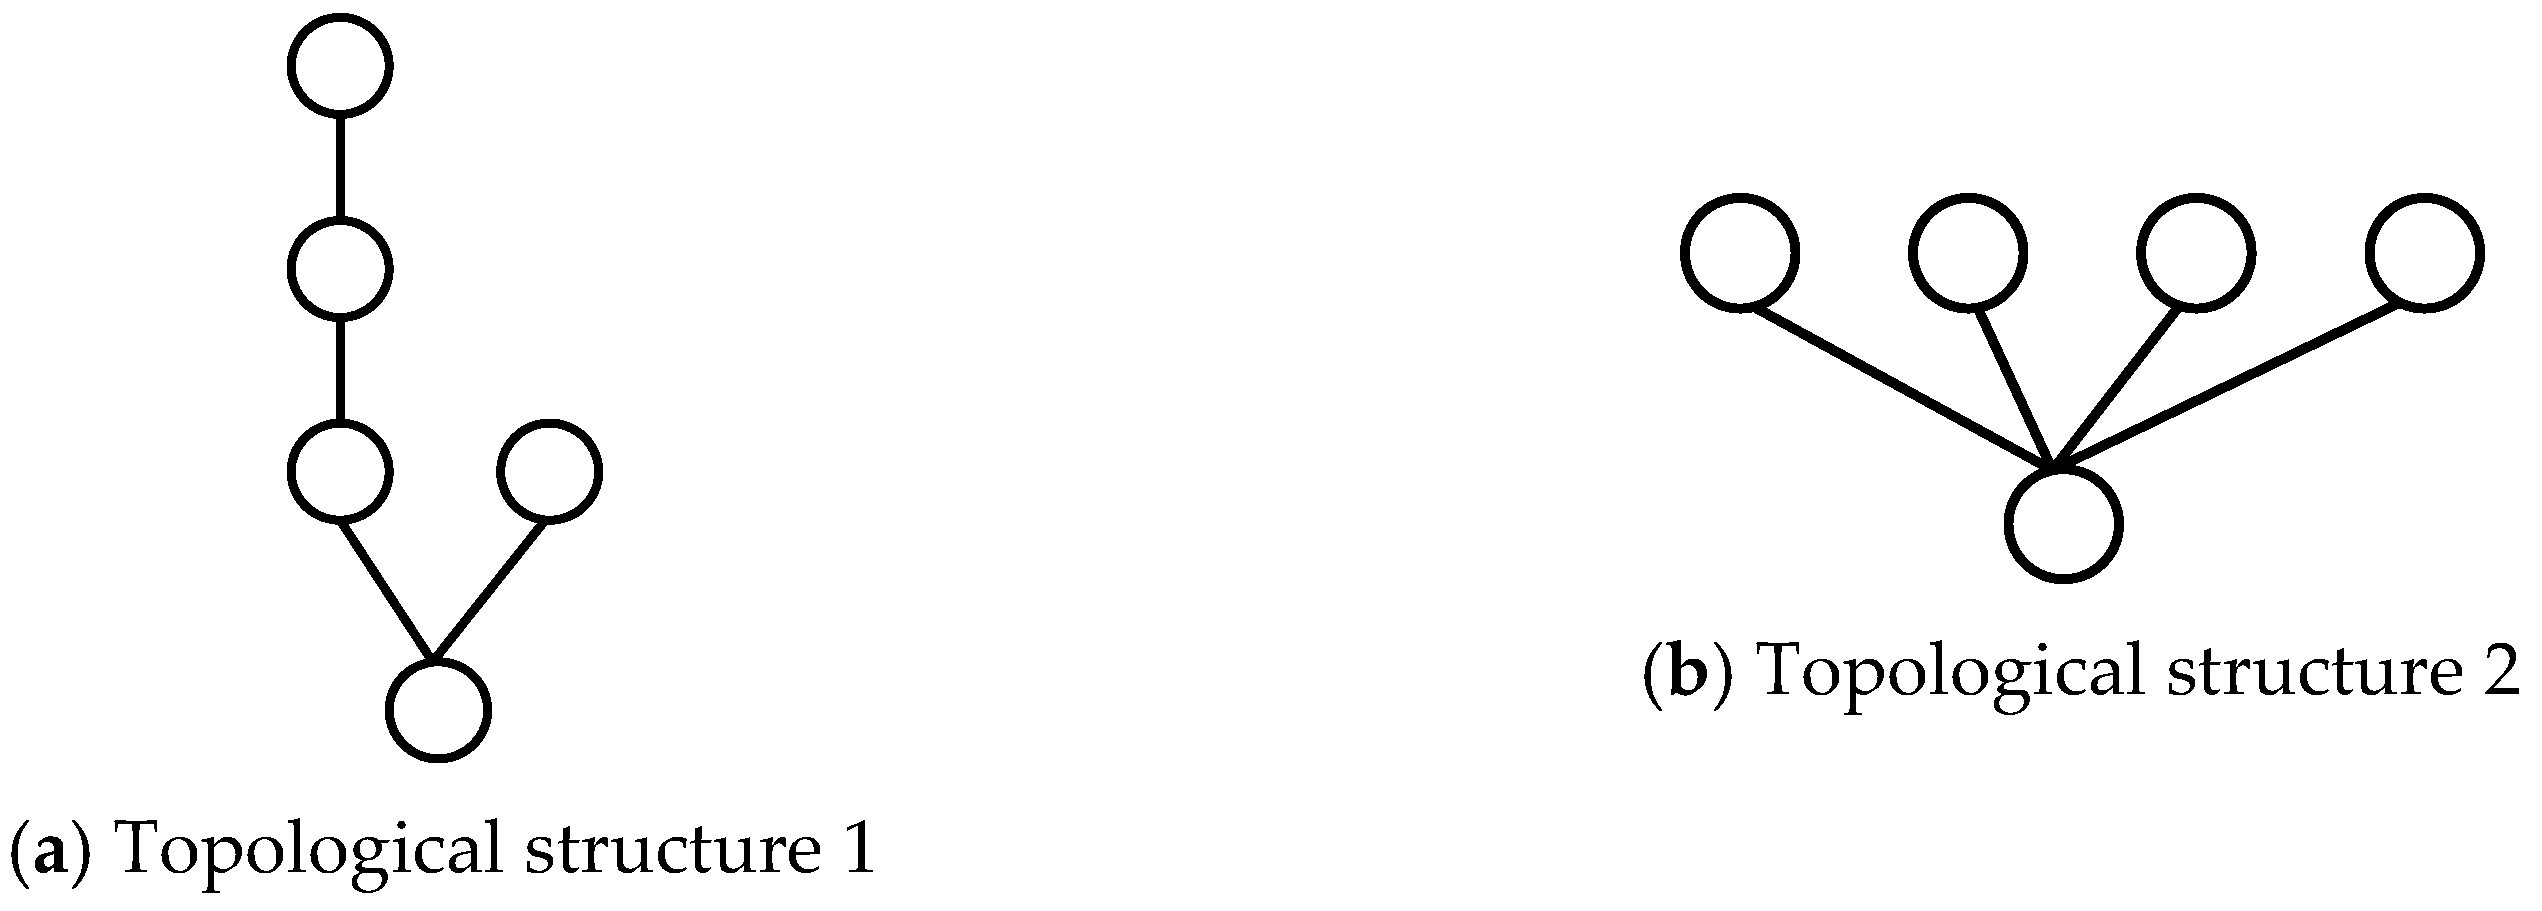
3.1.1. Model Comparison and Selection

The space syntax model mainly includes convex map, axial map, segment map, and visibility graph analysis, which deconstructs and analyzes the urban spatial structure from different perspectives.
The convex map and visibility graph analysis mainly analyze the urban spatial characteristics from the perspective of the convex space, which is a two-dimensional plane. If any two points inside a space can see each other it is a convex space (Figure 3a), otherwise it is a non-convex space (Figure 3b). The convex map mainly presents the connection relationship between different convex spaces, while the spatial syntactic model mainly assesses the connection relationships between different convex spaces and the visibility graph analysis considers the limitations of the field of view for convex spaces. All of them are used in analyses of building interiors [45] and small-scale neighborhoods [34], which require detailed maps of street spaces, making it too difficult to model the whole urban road network system.
Axial and line segment models are currently the more commonly used spatial syntactic models for macro-scale analyses of entire urban road network systems [46].
An axis is the line connecting a point in space as a whole to the point at the furthest visual distance. The axis model abstracts the spatial features of all significant sub-units within the space into a minimum number of directly connected line segments and calculates the values of the space syntax variables for each axis. The space syntax specifies that the axial map of a space as a whole should satisfy certain conditions, namely that all convex surfaces should be crossed by the axial model, the axial model axes should be the longest possible, and the number of axial model axes should be the smallest possible. From the principle of axial modeling, it can be seen that line-of-sight accessibility and path characteristics are the features that can be captured by the axial model, and the axial model method is suitable for the spatial characterization of urban streets, the characterization of road networks, and the design and layout of facilities in scenic spots [47]. The axial model is shown in Figure 4a.
The axial model was analyzed in terms of the number of network nodes as a radius without considering the actual length of the road, and a line segment modeling method was established on the basis of the axial model. The line segment model is shown in Figure 4b. As can be seen from the axial model division principle, a segment of the axial model may contain multiple road segments; compared with the axial model, the line segment model interrupts the intersection of some axes, turning the axial model into a model composed of numerous line segments (Line 1 was broken into line 3 and line 4, Line 2 was broken into line 5 and line 6). The line segment model uses the actual road distance, the minimum turning distance, the minimum angle distance, and other parameters to represent the distance reference value in the analysis, which is a more accurate scale for structural analyses, making up for the limitations of the axial model and making it more accurate for urban micro-scale calculations.
The line segment model has some advantages over the axial model, although the axial model has properties that cannot be ignored. In the axial model, all axes are not considered to be intersected, while in the line segment model all axes are considered to be intersected and divided into axials, which means that the axial model can represent intersections (interchanges) that are not intersected in the plane, while the line segment model is unable to represent such forms. Therefore, this paper analyzes the road network using both the axial model and the line segment model to compare the differences between planar disjointed (expressways, viaducts, freeways, etc.) and planar intersecting intersections.
In this paper, the axial model is improved and differentiated for the road network drawing based on the real planar intersection. Different line segments are connected at planar intersections, and no connection is made in areas where planes do not intersect, meaning that the results are closer to the real situation of the road network. In this study, we used ArcGIS to draw the road network, as ArcGIS can define whether intersections are intersecting or not when drawing, so as to carry out differentiated drawings.

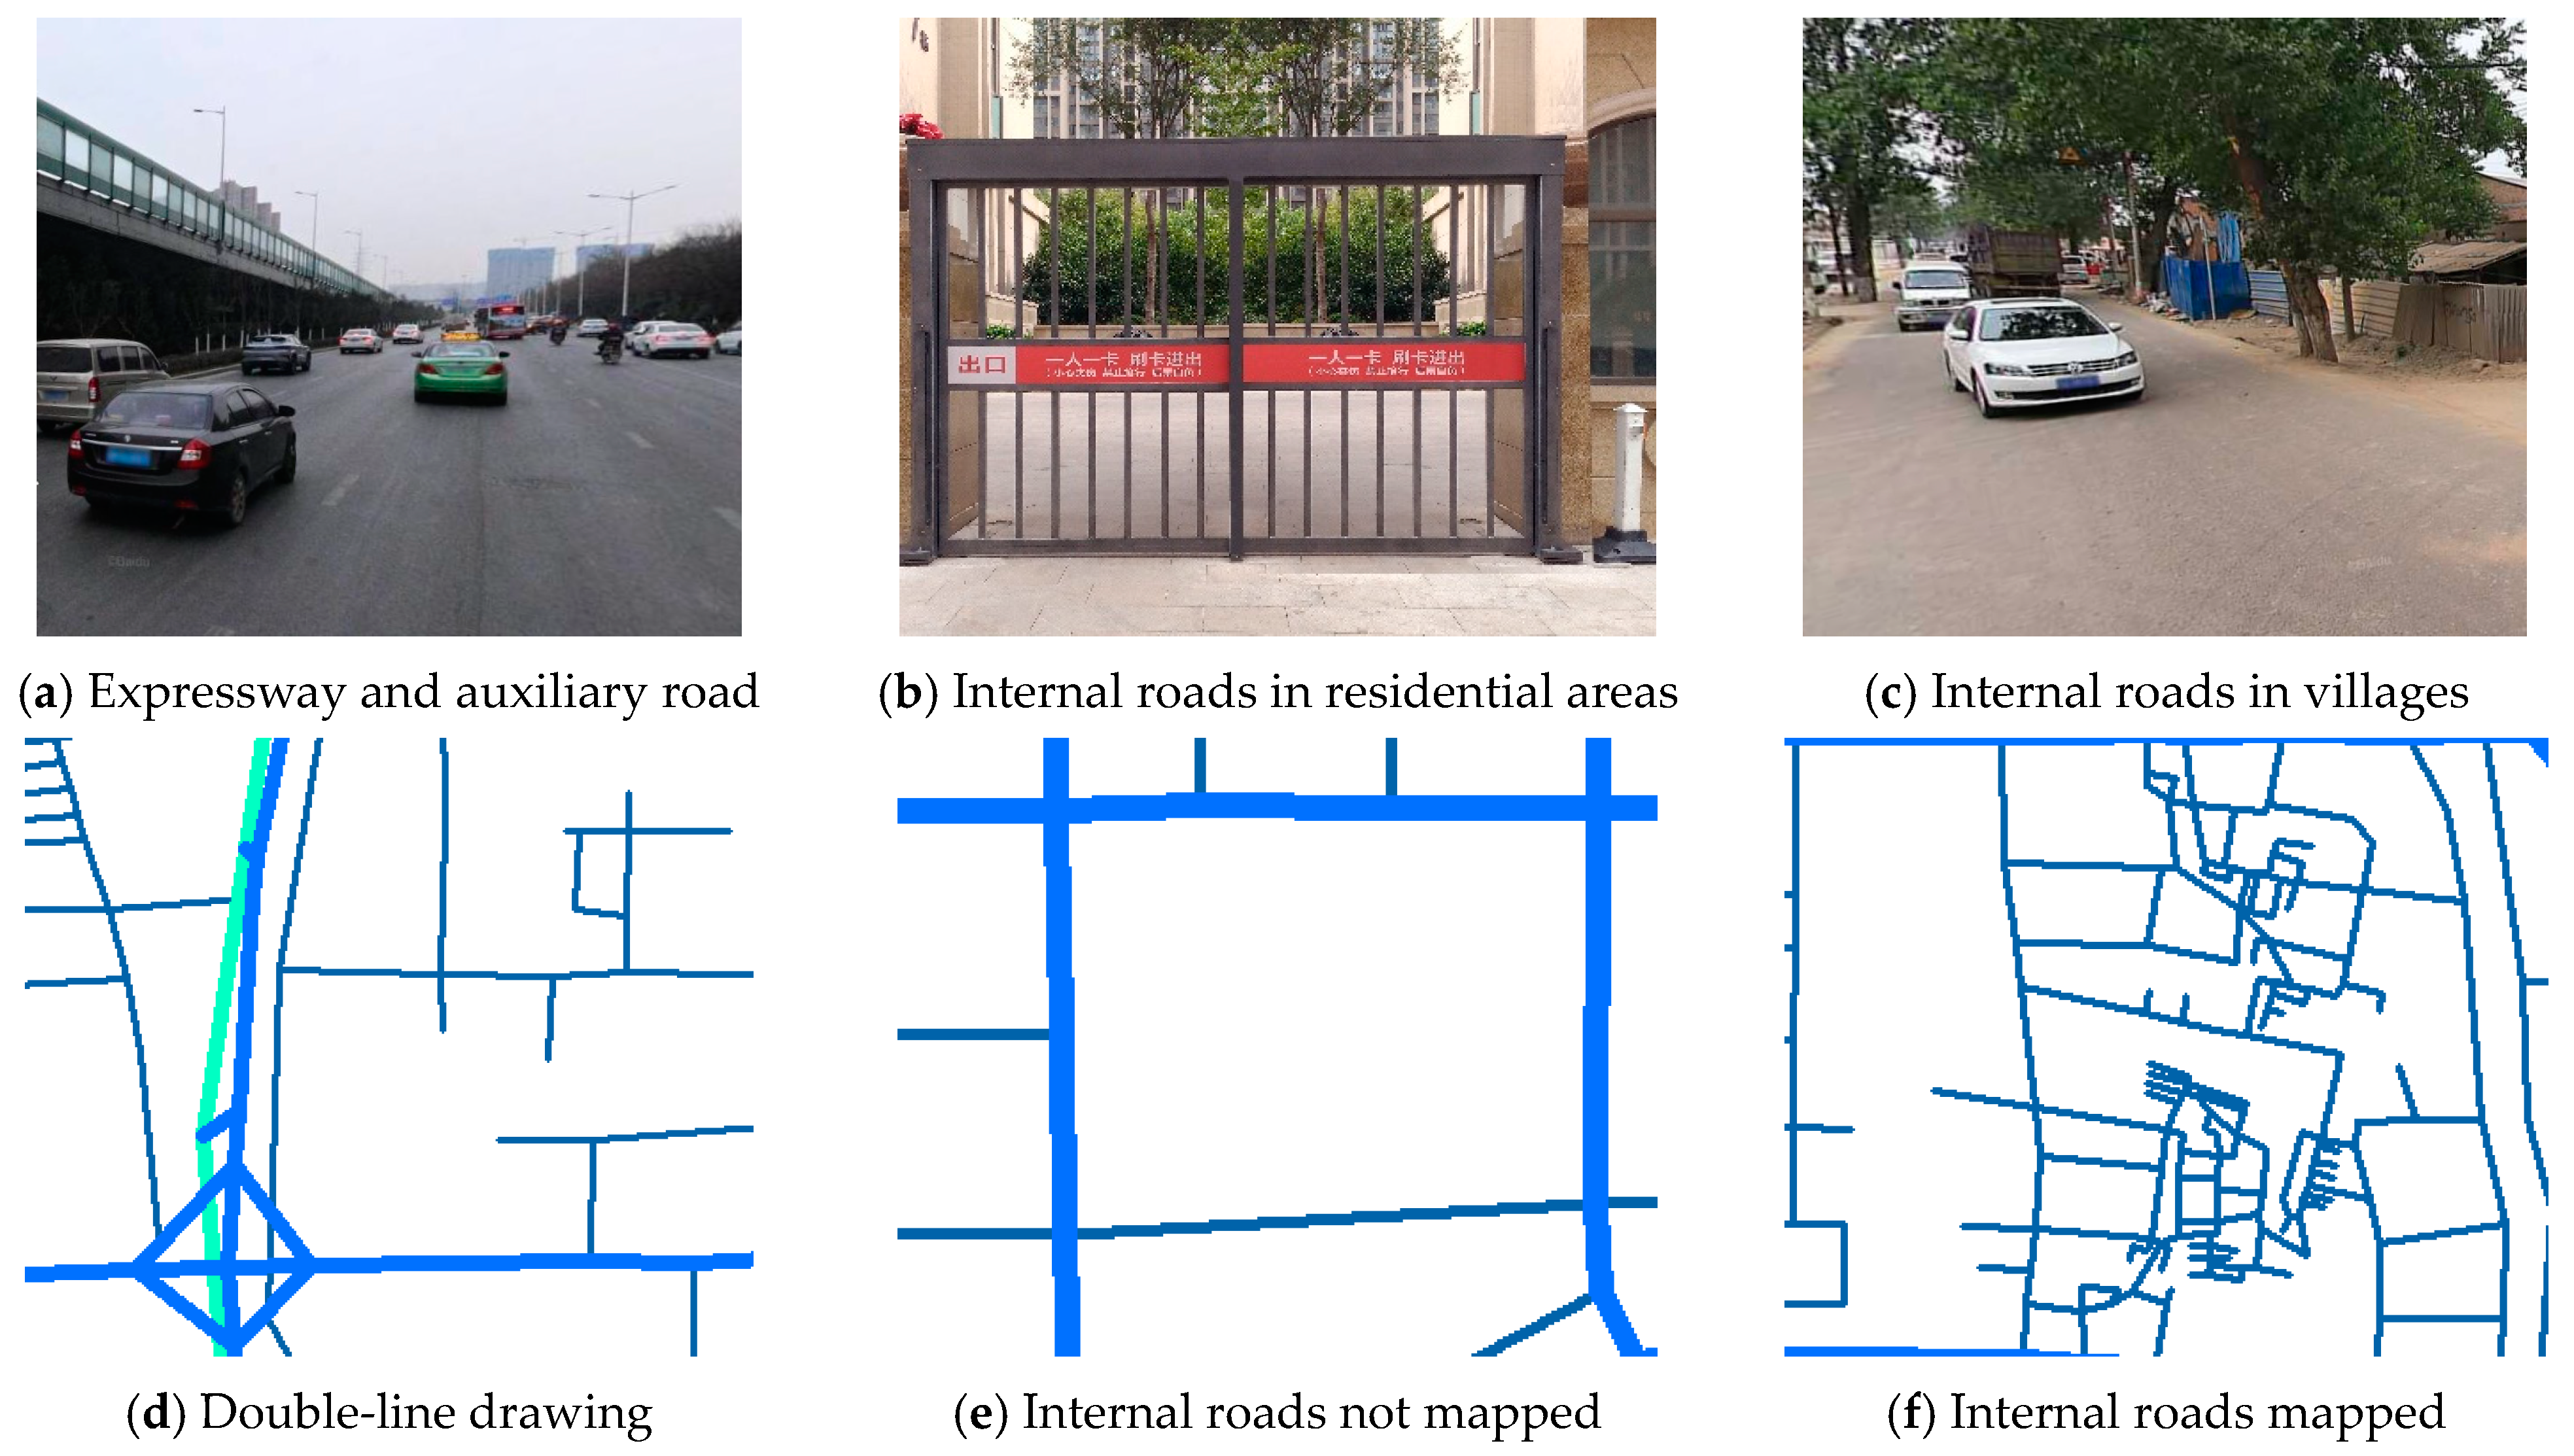
3.1.2. Model Building Principles

The Xixian New Area shows a development trend of gradually increasing the attractiveness of the scenic area at the edge of the city in the new area. in order to study the impact of the development of tourism in the new urban area on the activities of urban residents, this paper takes the road network of Xi’an City as an example and selects the Kunming Pond Scenic Area in the Xixian New Area of Xi’an City as the research object, choosing Xi’an City (the roads within the third ring road), Xianyang City (the area south of the Weihe River), and the connecting roads between the two places to form a road network in the study area. The road map of the study area was obtained using amap (https://ditu.amap.com). The road network was mapped using ArcGIS 10.2. The road network was mapped according to the below principles, taking into account the characteristics of the transportation system in the study area.
1. The road network is established in accordance with the physical connectivity.
In the study area, there are facilities such as viaducts, expressways, and highways that do not intersect with other roads in the plan, and there are no direct road connections between facilities. When drawing, the nodes are connected according to the actual connections, and if there is no intersection on the plane or no direct connection to the road, the nodes are not connected to ensure that the connection relationship of the road network is as consistent as possible with the actual situation.
2. The expressway system is depicted with two lanes.
There are auxiliary roads in the expressway system (Figure 5a), and there are differences in the connection relationships between expressways, auxiliary roads, and the surrounding urban roads, meaning the expressway needs to guarantee continuity while the auxiliary roads cross with the surrounding roads. When drawing the road network, we separated the main and auxiliary expressways by drawing double lines (Figure 5d), while the expressway and auxiliary roads were used to draw the connection relationship at the ramp.
3. The road network is mapped according to the actual vehicular traffic.
Some of the internal roads in small districts, scenic spots, and schools are gated (Figure 5b), meaning vehicles are not allowed to pass through them, so the internal roads were not mapped (Figure 5e). The internal village roads are accessible to vehicles (Figure 5c) and the internal roads were mapped as they are (Figure 5f).
The road network in the study area was obtained via manual mapping (Figure 6). The road network in the study area includes five different classes of roads—freeways, arterial roads, expressways, secondary roads, and local roads. After completing the road network mapping process in the ArcGIS platform, DepthmapX was selected as the space syntax analysis platform. After converting the layers of line segments in ArcGIS to DXF format, DepthmapX was imported to convert them into an axis model and line segment model. After calibrating and running the two models, the depth, integration, and choice results were analyzed.

3.2. The Indices of Space Syntax

Through the above space syntax model, the space is divided into spaces and spatial relationships based on the axial group composition. The space syntax indicators reflect the spatial structure characteristics, and the space syntax uses indicators such as depth, integration, and choice to describe the road network structure and different topological characteristics. In this study, we applied the space syntax indicators to reveal the characteristics of the road network structure.

3.2.1. Depth

The depth Di refers to the shortest distance of node i from all nodes, characterizing the proximity of spatial unit i to other units in the space, while the magnitude of the depth of a node indicates the proximity of that node to all other nodes. The larger the depth value, the more spatial transitions from node i in the spatial model and the lower the overcoming distance cost to reach other nodes. The depth value has two representations, namely the total depth value TDi and average depth value MDi, and the calculation equation is as follows:
T D i = j = 1 n d i j
M D i = j = 1 n d i j n 1
where n is the total number of spatial nodes and dij is the shortest distance between nodes i and j.
The total depth values are not comparable for two topologies with different numbers of nodes. The average depth value is calculated by removing the influence of the total depth value by the number of topology elements, which makes it easier to compare the values of different objects, so the depth in this paper refers to the mean depth.
The shortest distance can be the shortest distance in topological relationship or the actual shortest distance. The shortest distance in the axial map represents the shortest distance in the topological relationship, while the topological relationships between planar disjointed (expressways, viaducts, highways, etc.) and planar intersecting intersections are different, as a disjointed intersection is not a node. The improved axial map can represent the different relationships between the two. The shortest distance in the segment map represents the actual shortest distance, and according to the modeling principle planar disjointed intersections are also counted as a node, meaning the depth in the segment map was used as a comparison to reveal the differences between the two cases with or without expressways, viaducts, and highways.

3.2.2. Integration

The mean depth value solves the problem of having unequal numbers of nodes in different topological structures, although if the symmetry of the topological structure is different, this can also lead to the depth results changing (Figure 7). According to the formula in (2), the mean depth value of the topological structure 1 is 1.75, while the mean depth value of topological structure 2 is 1. The mean depth values are different for the same number of nodes.
The effect of symmetry is eliminated with the space syntax approach by using spatial remapping, and a symmetry evaluation of node i using the same number of symmetric structures was performed using RA (relativized asymmetry).
R A i = ( M D i 1 ) n / 2 1
While the topologies have differences in their numbers of nodes, there are also differences in the connection relations, and the effects caused by the differences in the connection relations need to be eliminated. The space syntax approach uses a diamond-shaped structure (Figure 8) for processing, as the diamond-shaped structure connection relationship is uniform and stable. The diamond-shaped structure can use any node as the center of the spatial remapping process to get the same topology, and it is assumed that the diamond-shaped structure of the RA value is only related to the number of nodes. The result after eliminating the connectivity relations is calculated using RRA (real relative asymmetry).
R A D i a m o n d = n { log 2 ( n + 2 3 ) 1 } + 1 ( n 1 ) ( n 2 ) 2
R R A i = R A i R A D i a m o n d = n { log 2 ( n + 2 3 ) 1 } + 1 ( n 1 ) ( n 2 ) 2
Integration is the inverse of RRA [46]. Integration describes the degree to which a route is integrated or segregated from a local or complete road network [48]. The degrees of aggregation and dispersion between a node and other nodes in the expression space reflect the attractiveness and regional importance of the node in the global context. The degree of integration is negatively correlated with the average depth value, whereby the smaller the average depth value, the higher the degree of integration, and the stronger the aggregation and accessibility.
I i = 1 R R A i = R A D i a m o n d R A i

3.2.3. Choice

Choice refers to the sum of the number of times a node in space occurs on the shortest path between two other nodes [49], reflecting the traffic attraction potential of the node. Roads with higher levels of choice have a higher likelihood of being passed through and are likely to generate more traffic.
C i = 1 ( n 1 ) ( n 2 ) j = k = 1 N n j , k ( i ) n j , k
where nj,k(i) is the number of times the shortest topological path between any node j to node k is passed by node I; nj,k denotes the sum of the number of shortest paths from node j to node k in the space.

4. Results Analysis

4.1. Depth Value Analysis

Currently, the Kunming Lake Scenic Area has only its northside entrance and exit open. In this study, the section of Keji Er Road on the north side of the Kunming Lake Scenic Area was taken as the center to calculate the depth values (Figure 9). The importance of the roads where the entrance–exit of the Kunming Lake Scenic Area is located in the overall road network was analyzed, then subsequently the characteristics of the roads in the Kunming Lake Scenic Area were analyzed. The depth values of the axial model and line segment model are shown in Figure 9 and Figure 10.
Figure 9 and Figure 10 show a clear difference; Figure 11 shows the reachability in terms of distance, while the axial model in Figure 12 considers the effect of the number of nodes and shows the ability of an urban expressway to scale for reachability. Typically, the reachability of an area should increase as the actual distance increases (as in Figure 12), and it can be seen in Figure 11 that the range of depth values for Kunming Lake extends along the expressway. To quantify the impact of the expressway on the scenic urban fringe, the depth value results were normalized and compared, and the results are shown in Figure 11.
From Figure 11, it can be observed that the normalized for the axial map depth are mostly greater than the normalized values for the segment map depth. The average normalized value of the axial map depth is 0.52, while the average normalized value of the segment map depth is 0.42. The comparative results indicate that the inclusion of facilities such as expressways and freeways can improve the accessibility to and potentially advance the attractiveness of city fringe tourist areas.

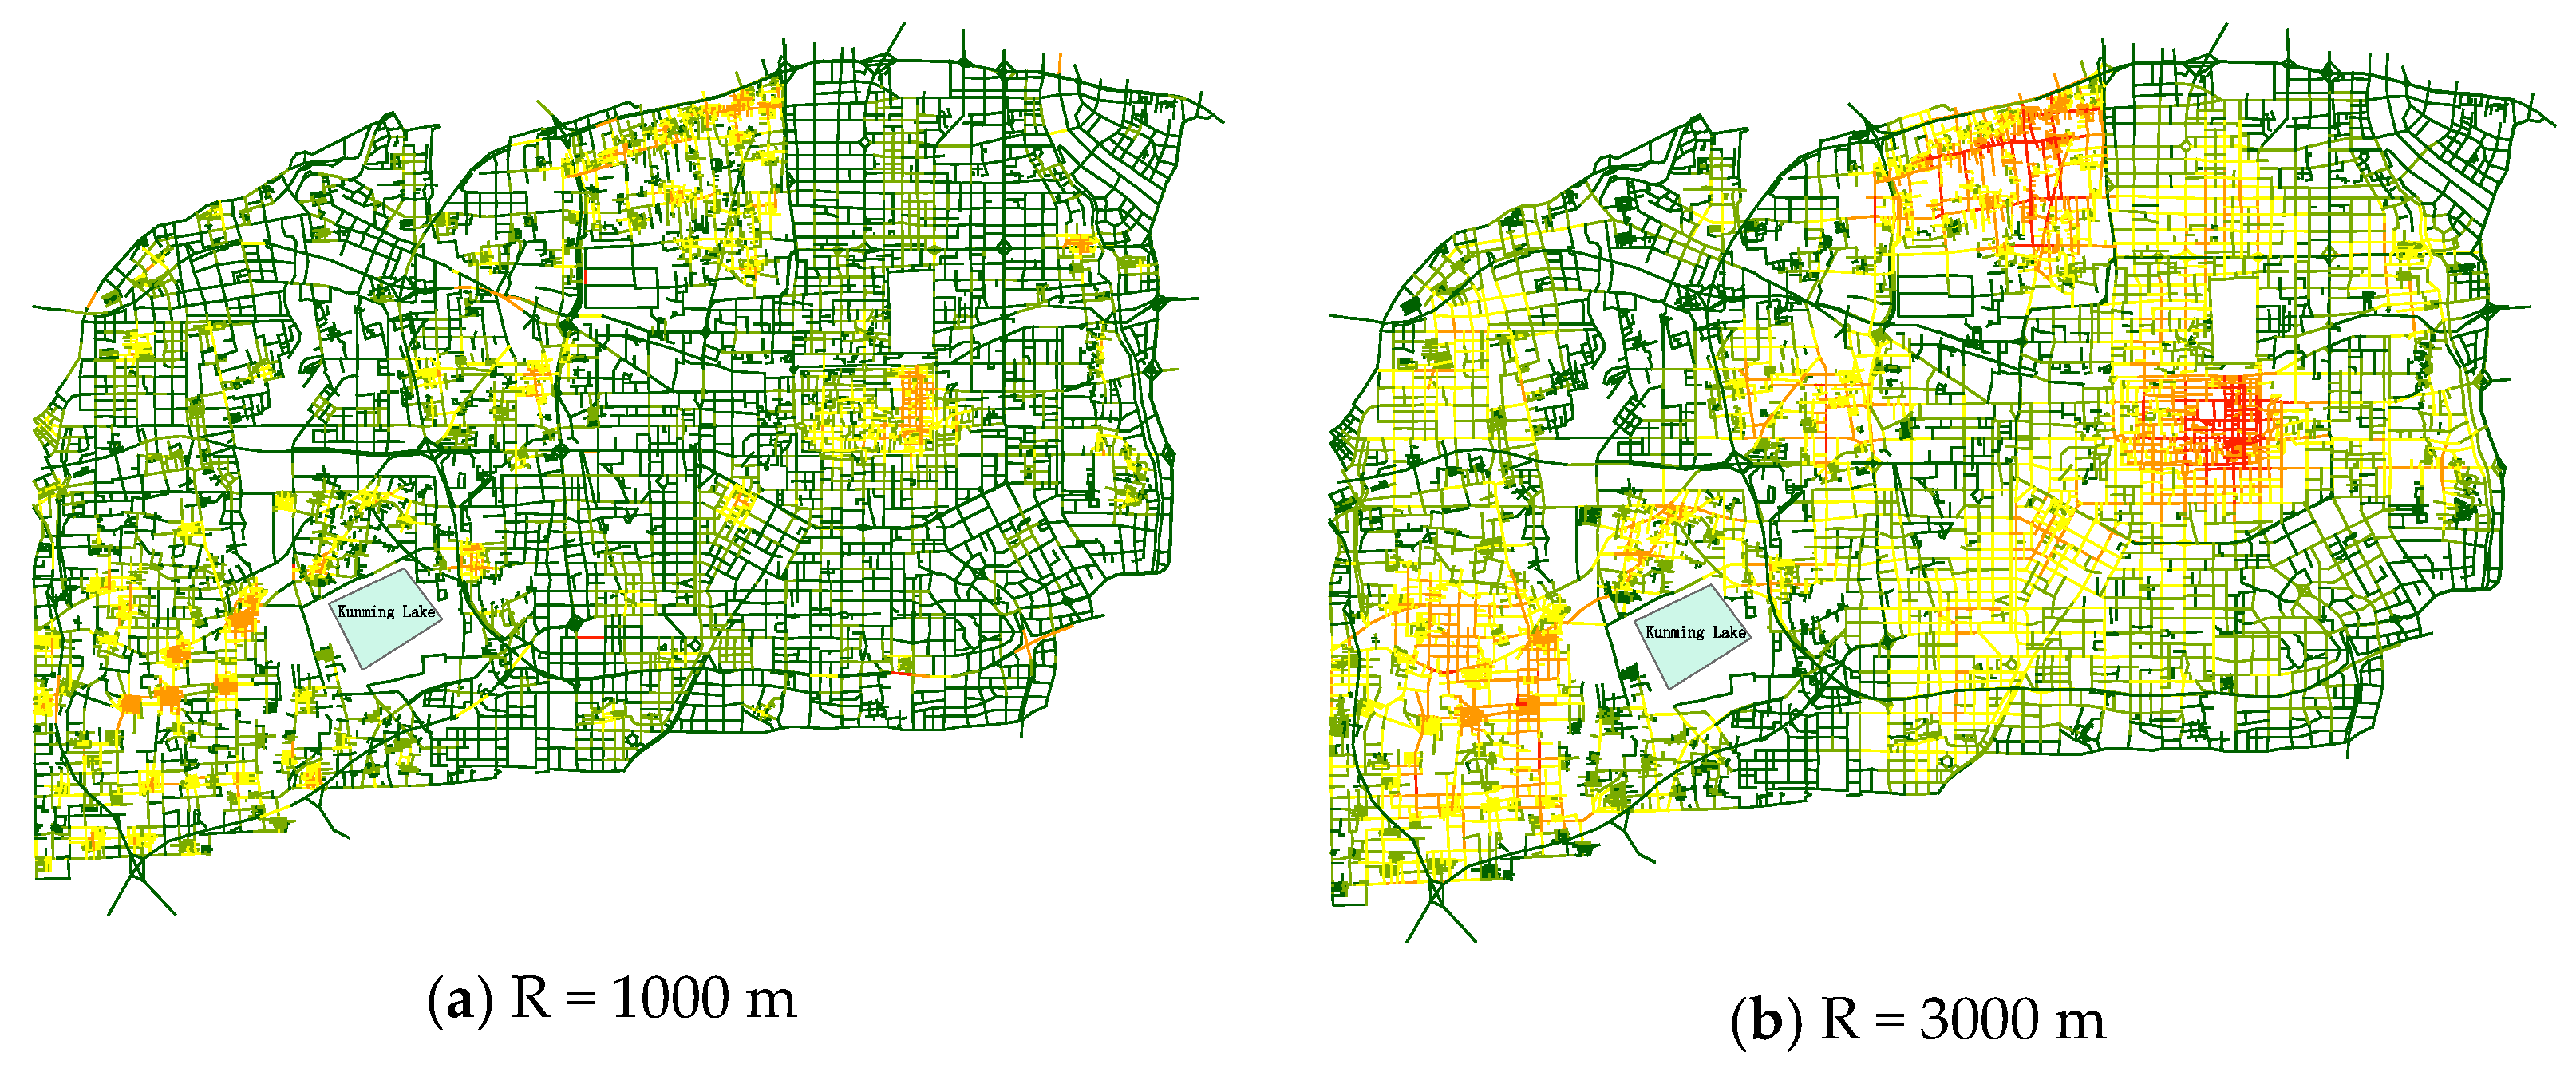
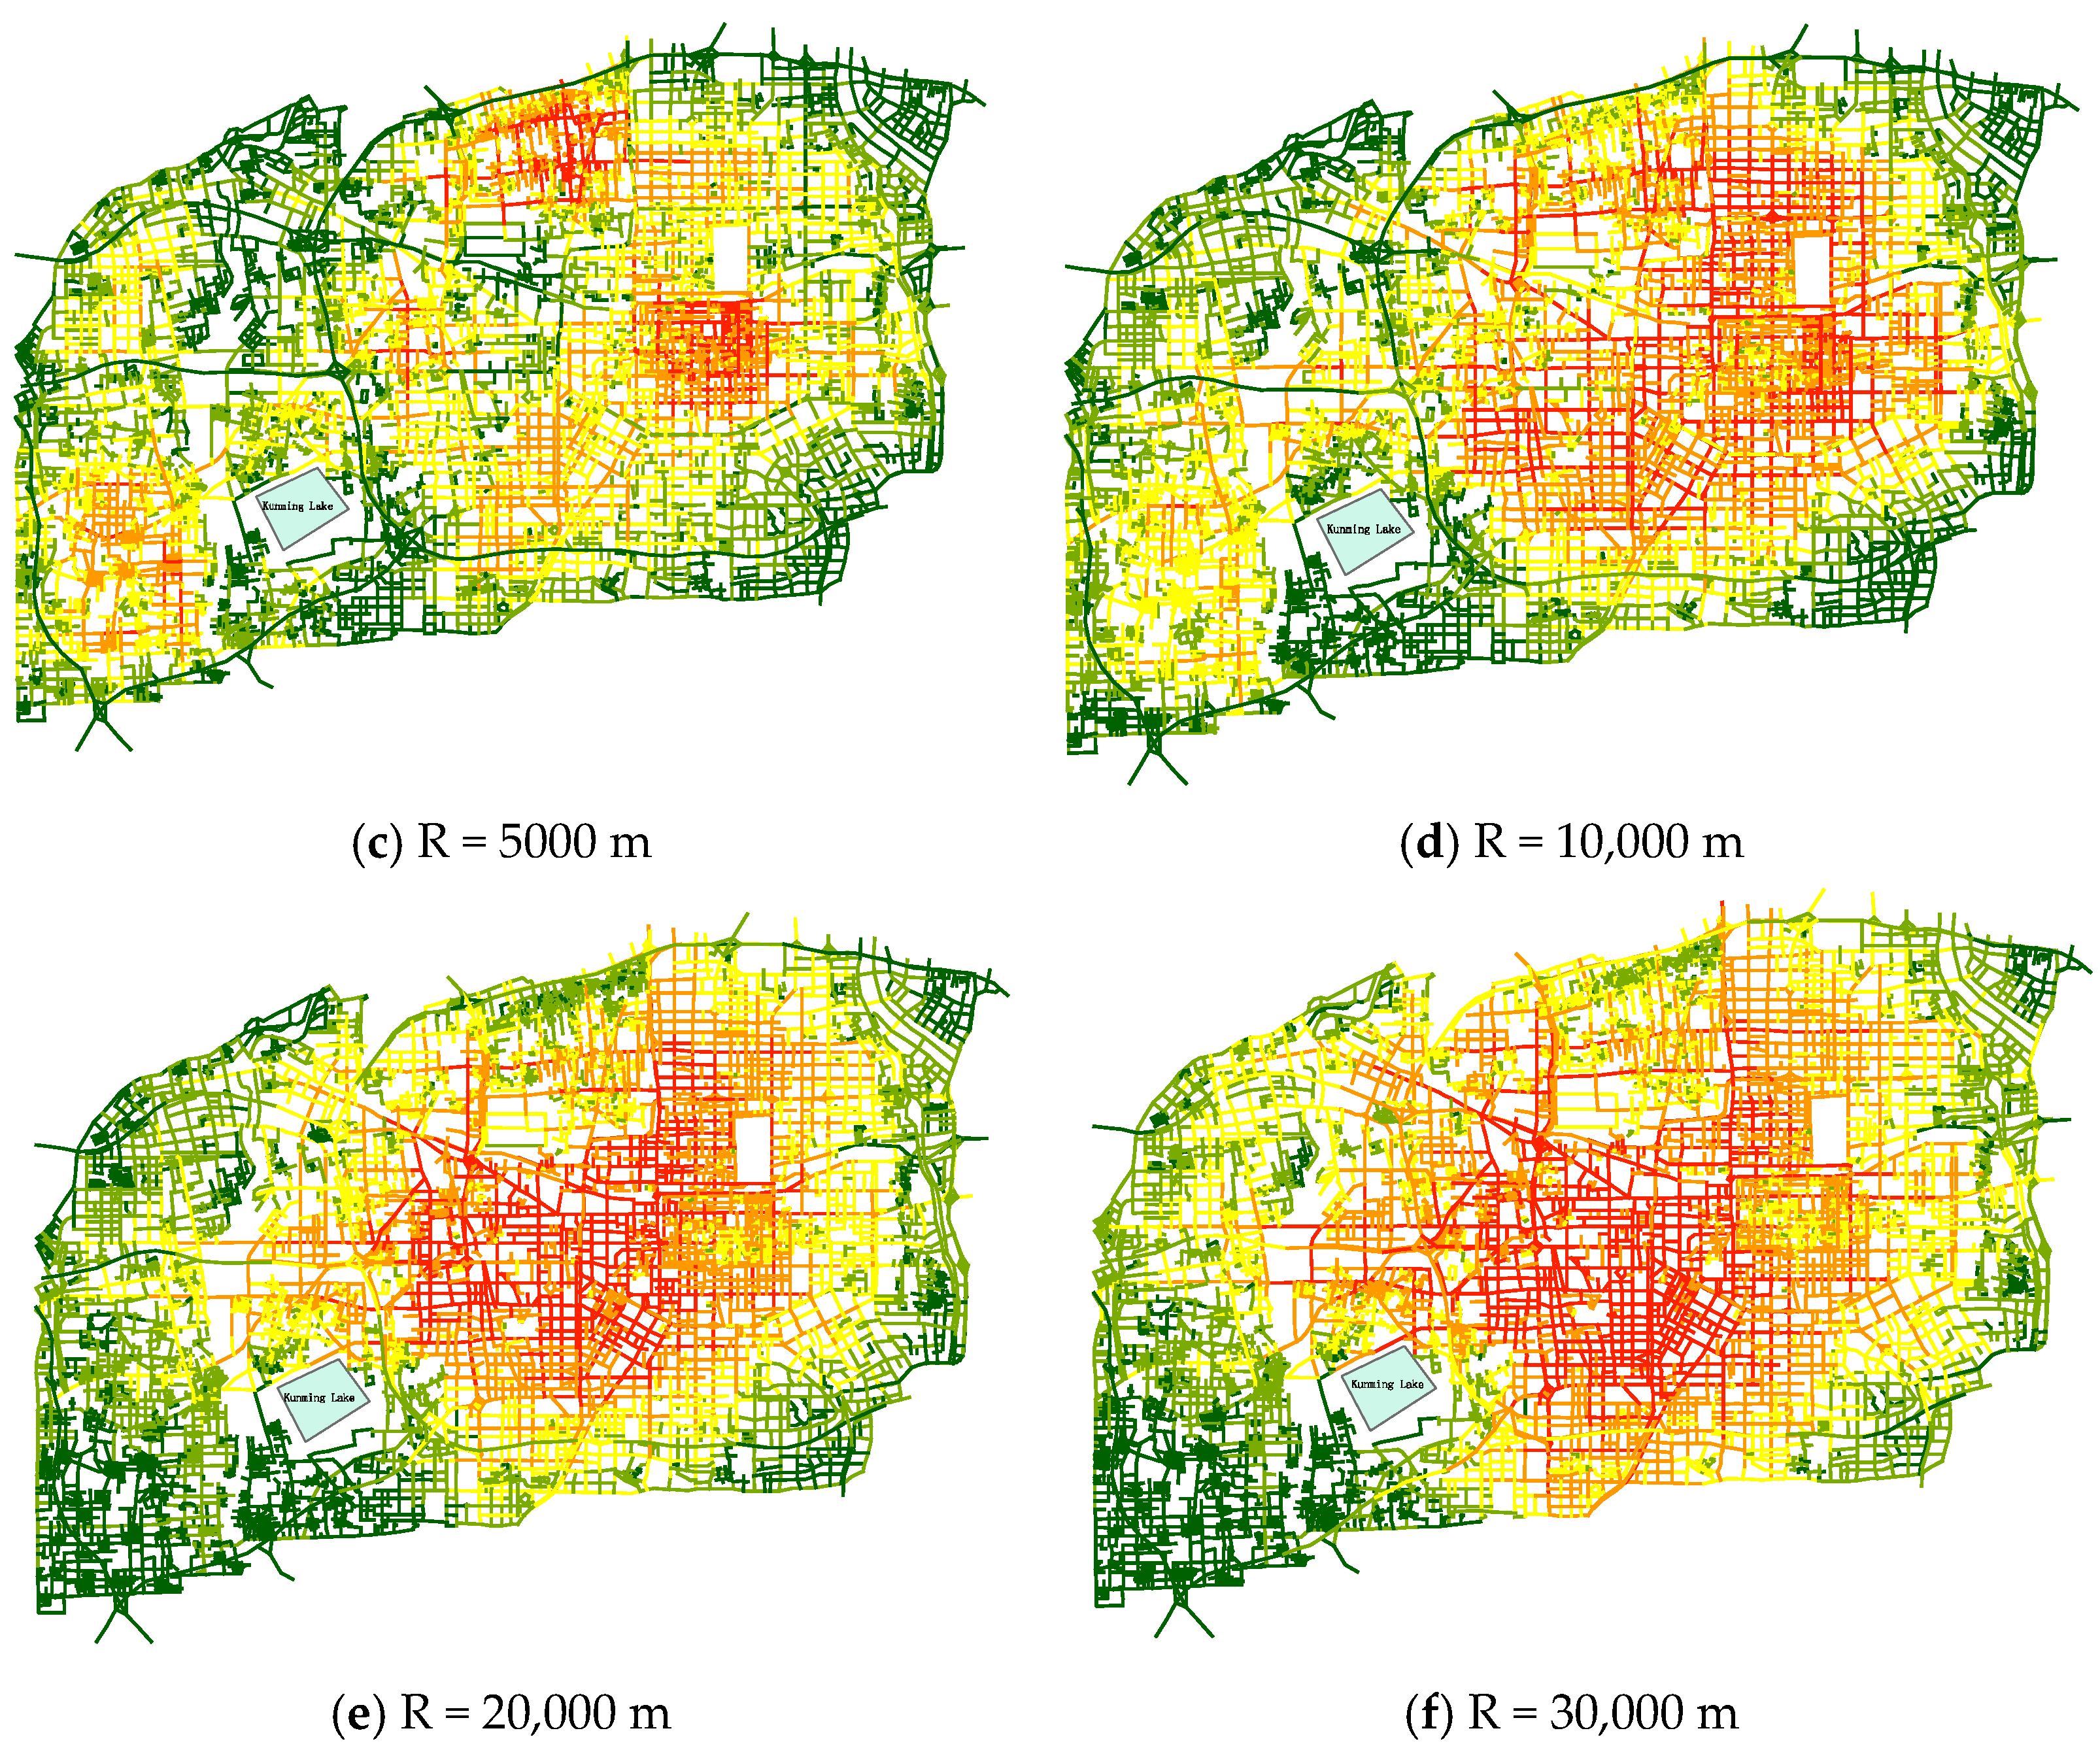
4.2. Integration Value Analysis

Integration reflects important areas that are globally or locally attractive. The accessibility of different network radii shows the attractiveness of the road to travelers at that activity distance, and a network analysis radius of less than 1000 m was used to indicate the attractiveness to slow-moving traffic in a previous study [25].
In this study, the main research object was motorized traffic, so six different radii of 1000 m (Figure 12a), 3000 m (Figure 12b), 5000 m (Figure 12c), 10,000 m (Figure 12d), 20,000 m (Figure 12e), and 30,000 m (Figure 12f) were selected (Figure 12), which represent the changes in human activities for different spatial constraints.
Figure 12. Distribution of depth values.
Sustainability 16 04359 g012aSustainability 16 04359 g012b
When R = 1000 m, the villages in the space and the dense areas of the road network in the city are more integrated and attractive, and the human activities are more inclined to the polycentric model centered on the city center and individual villages. During the change of R from 1000 m to 5000 m, some small centers are gradually integrated to become large centers, while the human activities are still in the polycentric model. The human activities gradually tend to be in the monocentric model when the R is enlarged from 10,000 m to 30,000 m, whereby the human activities gradually converge to a single-center model and the center of the road network gradually becomes an attractive and important area. As the radius of activity increases, the pattern of human activities gradually develops towards a single-center model with the city as the core.
In order to express the trend of change under different network radii more clearly, a descriptive statistical analysis of the integration values was carried out (Table 4), and the distributions of the integration values with different network half-price values were compared (Figure 13). Due to the different network half-price values, the size comparison of the data analysis results was not obvious enough, and in order to make the analysis results comparable, an analysis of the normalized values was added to the descriptive statistical analysis.
From Table 4, it can be seen that the mean and median in the original data gradually increase as R changes from 1000 m to 30,000 m, while the normalized values roughly conform to the trend of a gradual increase, suggesting that the overall attractiveness of the road network becomes larger via the process of increasing the range of human activities. From Figure 13, the distribution of the integration values shows a trend of smaller peaks and an overall shift to the right. At R = 1000 m, the values are concentrated in the range of 0–0.2, while at R = 30,000 m, the values show a normal distribution in the range of 0–1, indicating that with the increasing range of human activities, the points of high attractiveness in the road network gradually increase and are more evenly distributed.
For urban fringe tourist areas, the expansion of human activity ranges gradually increases the importance of these areas. Taking Kunming Lake as an example, during the changes, the integration of roads around the northern entrance of Kunming Lake continues to increase and the attractiveness of the urban fringe tourist area gradually grows.

4.3. Choice Value Analysis

During model construction and choice evaluation processes, it was found that the choice and node count graphs showed partly the same trend. The node count indicates the number of nodes in the range of the radius R, which reflects the road network density to a certain extent. In this study, we used the node count to indicate the size of the road network density. To explore the factors affecting route choices, the correlation between route choices and the node count was examined (Table 5).
From Table 5, it can be seen that the choice of routes is significantly correlated with the road network density, indicating that the road network density has an effect on the choice of routes, i.e., the road network density has a partial effect on the magnitude of the flow. However, the degrees of correlation are different for different measurement radii; the correlation is stronger when R is small, and the degree of correlation between the road network density and the degree of choice under the same measurement radius gradually decreases with the increase in R, indicating that the road network density has a gradual decreasing influence on the flow rate. When the R values of the route choice degree and road network density are different, the correlations between several data sets in the table are still shown, whereby the correlations are negative in the bottom left and right corners of the table, indicating that a change in road network density in a small area negatively affects the route choice in a large area and that a change in road density in a large area negatively affects the route choice in a small area. When planning a road network, one must take into consideration the impacts of such changes on the road trip potential. The choice analysis of the global road network is shown in Figure 14.
Comparing Figure 14 with the road network in Figure 6, it is evident that the road segments with higher degrees of route choice are mostly arterial roads. Arterial roads are well connected to expressways, urban collector roads, and local roads, allowing for a greater capacity to accommodate traffic flow. This characteristic aligns with the functional purpose of arterial roads.
Regarding the research objective, the road where the entrance–exit of Kunming Lake is located falls within the range of 9,287,661 to 18,432,252 for the degrees of route choice. This range indicates a certain potential for attracting tourists, suggesting that a well-developed road network can help more tourists choose an urban fringe tourist area.

5. Discussion

Tourism presents a strong spatial dependence, and the organizational planning of tourism areas involves a reorganization of the space around tourism [50]. Urban fringe scenic areas are different from built-up areas and rural scenic areas [37], and the new urban area where an urban fringe scenic area is located will also develop into a built-up area with multiple land use types in the future. For this special type of transitional scenic area, the multifaceted characteristics need to be explored in order to explore the development approach. Space is an important feature in modern tourism [51], and the transformation of areas near scenic spots will bring about certain spatial benefits [52]. Therefore, this paper deconstructs the spatial elements of an urban fringe scenic area, compares the POI differences between the built-up scenic area and the urban fringe scenic area, determines the level of development of the consumer conditions in the urban fringe scenic area, analyzes the characteristics of its peripheral road space with the help of space syntax, and analyzes the influence of the road space on the urban fringe scenic area, so as to explore the relationship of the characteristics of the city’s road network to the urban fringe tourist areas.
This paper explores the development of the consumer conditions around city fringe tourist areas in two scenic spots, the Kunming Lake Scenic Area and Dayan Pagoda, comparing them in terms of their accommodation services, transportation services, shopping services, and catering services. Accommodation services reflects the demand of tourists for long-duration travel, and the small number of accommodation services in the city fringe tourist areas with little change suggests that there is little demand for tourists to travel to the city fringe tourist areas for overnight stays. The number of transportation services in the city fringe tourist areas is even less, and there is no space for mass transit services such as subway stations, so the modes for tourists to travel to the scenic spots are limited, which may affect the number of tourists that are attracted to the city fringe tourist areas, meaning the scenic spots cannot effectively play the role of driving the economic development of the neighboring areas. Shopping services reflects the attractiveness of the scenic spots to tourists, and good perceptions of tourists regarding the scenic spots will make them more attractive. Tourists’ good perceptions of scenic spots will promote their shopping consumption, although from the data the shopping services are in a declining cycle in built-up areas, probably due to the impact of the epidemic, the rise of e-commerce, and other factors The shopping services in the city fringe tourist areas are not in the stage of saturated competition, so the number is steadily increasing. Catering services represent the rigid demands of tourists, and the numbers of catering services in city fringe tourist areas are much lower than in built-up areas but show greater improvement, indicating that the number of tourists going there has increased compared to 2018.
In general, the industrial development of the city fringe tourist areas is far behind the built-up areas, and the transportation services are the main factor affecting the development of the surrounding industries. The increased accessibility from the construction of public transportation routes will bring more tourists and business models to the city fringe tourist areas [53]. A lack of transportation services leads to a decrease in the willingness of tourists to travel and a reduction in passenger flow. This reduction in passenger flow leads to the backward development of the surrounding industries, and the backward development of the surrounding industries makes the scenic area less attractive. Scenic spots with low demand for travel will be in the lower priority group in the construction of transportation services, which forms a vicious circle.
In addition to using public transportation to travel to scenic spots, tourists can also drive to scenic spots. The development of public transportation services in the urban fringe scenic area is relatively backward, and it is more convenient for tourists to use motorized transportation to get to the scenic area. In this paper, we use space syntax to reveal the characteristics of the road network around the urban fringe scenic area and study the articulation relationship between the road network around the scenic area and the road networks of the two neighboring urban areas. City ring roads have a significant impact on business [54]. The depth values reveal the spatial accessibility, and from the depth values it can be seen that expressways, highways, and ring roads increase the accessibility and convenience of travelling to the scenic area. By comparing the Integration values under multiple measurement scales, we found that the pattern of human motorized transportation activities gradually goes through two different stages from multi-center, small-scale activities to single-center activities as the radius of activities increases, which is very similar to the urbanization process during the expansion of the city. The choice value reflects the traffic attraction potential of a node, and by analyzing the road network density and choice value, it was found that the choice value of a route is significantly correlated with the road network density. The correlation between the choice value and road network density gradually decreases as the road network density increases and the road network becomes more complex.
The conclusions obtained in this paper can provide a reference for the planning of urban tourism transportation services. In the future, if the goal is to develop an urban fringe tourism area, attention should be paid to its connections with the urban expressways and bypass highways, and various forms of motorized vehicles and rail transit should be considered to expand the range of activities available to the urban residents.
Based on the existing research, this paper analyzes the road network through the use of indicators to obtain the trend for the urban road network’s influence on human activities and urban fringe tourist areas, and the results obtained are on the macro side. In addition, this paper analyzes a single urban fringe tourist area, while the interactions between multiple urban fringe tourist areas existing in the region may produce different conclusions. In addition, there have been studies proving the impact of social media publicity on the existence of scenic spots [36]. While tourism development is not significantly related to the establishment of tourism websites [55], the effectiveness of promoting city fringe tourist areas through social media has been demonstrated [56]. This paper only subjectively defines the level of regional development from government policies and data, and insufficient consideration is given to the impacts of a variety of new media on the attractiveness of urban fringe tourism zones. In the future, it will be necessary to explore the quantitative impact of the relationship between media publicity and the attractiveness of urban fringe tourism zones. In addition, the natural landscapes surrounding the city fringe tourist areas can be beneficial to human health [57]. Considering the full utilization of the landscape, a slow-moving greenway has been established between the city fringe tourist areas and the city, and there have been studies on the willingness to travel by slow-moving transportation services from the perspectives of physiology, psychological loading [58], and fatigue [59], although the relationship between these factors and the willingness to travel by slow-moving transportation services when using a greenway to travel to the city fringe tourist areas has yet to be investigated.

Author Contributions

H.Z.: Methodology, writing—original draft, software. C.L.: Project administration, resources, writing—review and editing. J.F.: Software, conceptualization. K.Y.: Visualization, software. J.W.: Writing—review and editing, visualization. All authors have read and agreed to the published version of the manuscript.

Funding

This research received no external funding.

Institutional Review Board Statement

Not applicable.

Informed Consent Statement

Not applicable.

Data Availability Statement

Data available on request due to privacy and ethical restrictions.

Acknowledgments

The authors would like to thank the students from Xi’an University of Architecture and Technology, as well as Yichen Lu and Yutong Zhang for their contributions in the data survey and information collection phase. The authors would like to thank the anonymous reviewers for their constructive comments on this research.

Conflicts of Interest

The authors declare no conflicts of interest.

References

  1. WTCF. Report on World Tourism Economy Trends; WTCF: Beijing, China, 2019. [Google Scholar]
  2. WTCF. Report on World Tourism Economy Trends; WTCF: Beijing, China, 2022. [Google Scholar]
  3. World Tourism Organization and United Nations Development Programme. Tourism and the Sustainable Development Goals—Journey to 2030; UNWTO: Madrid, Spain, 2017.
  4. Antara, M.; Sumarniasih, M.S. Role of tourism in economy of Bali and Indonesia. J. Tour. Hosp. Manag. 2017, 5, 34–44. [Google Scholar] [CrossRef]
  5. Karakas, B. Marketing business tourism in suburban areas. Int. J. Hosp. Tour. 2012, 1, 6–18. [Google Scholar]
  6. Bihu, W. Analysis on the Features and Causes of Seasonality in Rural Tourism: A Case Study of Beijing Suburbs. Prog. Geogr. 2012, 31, 817–824. [Google Scholar]
  7. Bielska, A.; Borkowski, A.S.; Czarnecka, D.M.; Malina, J.K.; Piotrkowska, M. Evaluating the potential of suburban and rural areas for tourism and recreation, including individual short-term tourism under pandemic conditions. Sci. Rep. 2022, 12, 20369. [Google Scholar] [CrossRef] [PubMed]
  8. Du, J.; Zhang, Y. The “City-Suburb” Tourist Flow Network Structure Characteristics in the Guangdong-Hong Kong-Macao Greater Bay Area in the Post-Pandemic Era: Analysis Based on the Network Digital Footprint. Trop. Geogr. 2022, 11, 1931–1942. [Google Scholar]
  9. Zhang, Y.; Chen, Z.; Sun, H.; Zhang, S.; Liu, H. Study on the Utilization of Vacant Houses in Rural Exurbs under the Background of Rural Revitalization Strategy by Taking Shenjia Village in Hunan Province as an Example; IOP Conference Series: Earth and Environmental Science; IOP Publishing: Bristol, UK, 2019; Volume 371, No. 2. [Google Scholar]
  10. Weaver, D. The distinctive dynamics of exurban tourism. Int. J. Tour. Res. 2005, 7, 23–33. [Google Scholar] [CrossRef]
  11. Afonso, W. The equity of local sales tax distributions in urban, suburban, rural, and tourism rich counties in North Carolina. Public Financ. Rev. 2016, 44, 691–721. [Google Scholar] [CrossRef]
  12. Gon, M. Discussing Rural-Urban Tourism: A Review of the Literature; CABI: Wallingford, UK, 2017; pp. 3–19. [Google Scholar]
  13. Ionescu, I.; Crenicean, L. Present and Perspectives in Tourist Evolution of the Urban, Suburban and Metropolitan Areas; Petroleum-Gas University of Ploiesti Bulletin, Economic Sciences Series 61.3; Petroleum-Gas University of Ploiesti: Ploiești, Romania, 2009. [Google Scholar]
  14. Alkamali, N.; Alhadhrami, N.; Alalouch, C. Muscat City expansion and Accessibility to the historical core: Space syntax analysis. Energy Procedia 2017, 115, 480–486. [Google Scholar] [CrossRef]
  15. Wu, J.; Li, R.; Ding, R.; Li, T.; Sun, H. City expansion model based on population diffusion and road growth. Appl. Math. Model. 2017, 43, 1–14. [Google Scholar] [CrossRef]
  16. Denstadli, J.M.; Jacobsen, J.K.S. The long and winding roads: Perceived quality of scenic tourism routes. Tour. Manag. 2011, 32, 780–789. [Google Scholar] [CrossRef]
  17. Wu, B.; Cai, L.A. Spatial modeling: Suburban leisure in Shanghai. Ann. Tour. Res. 2006, 33, 179–198. [Google Scholar] [CrossRef]
  18. Bauman, Z. Globalization: The Human Consequences; Columbia University Press: New York, NY, USA, 1998. [Google Scholar]
  19. McManus, R.; Ethington, P.J. Suburbs in transition: New approaches to suburban history. Urban Hist. 2007, 34, 317–337. [Google Scholar] [CrossRef]
  20. Zou, T.; Huang, S.; Ding, P. Toward a community-driven development model of rural tourism: The Chinese Experience. Int. J. Tour. Res. 2014, 16, 261–271. [Google Scholar] [CrossRef]
  21. Liu, R.; Wong, T.-C. Rural tourism in globalizing Beijing: Reproduction of the mountainous suburbs into a new space of leisure consumption. Sustainability 2019, 11, 1719. [Google Scholar] [CrossRef]
  22. Mindell, J.S.; Anciaes, P.R.; Dhanani, A.; Stockton, J.; Jones, P.; Haklay, M.; Groce, N.; Scholes, S.; Vaughan, L. Using triangulation to assess a suite of tools to measure community severance. J. Transp. Geogr. 2017, 60, 119–129. [Google Scholar] [CrossRef]
  23. Salvati, L.; Morelli, V.G.; Rontos, K.; Sabbi, A. Latent exurban development: City expansion along the rural-to-urban gradient in growing and declining regions of southern Europe. Urban Geogr. 2013, 34, 376–394. [Google Scholar] [CrossRef]
  24. Xiao, G.; Chen, L.; Chen, X.; Jiang, C.; Ni, A.; Zhang, C.; Zong, F. A hybrid visualization model for knowledge mapping: Scientometrics, SAOM, and SAO. IEEE Trans. Intell. Transp. Syst. 2023, 25, 2208–2221. [Google Scholar] [CrossRef]
  25. Cheng, Y.; Zhu, K.; Zhou, Q.; El Archi, Y.; Kabil, M.; Remenyik, B.; Dávid, L.D. Tourism ecological efficiency and sustainable development in the Hanjiang River Basin: A super-efficiency slacks-based measure model study. Sustainability 2023, 15, 6159. [Google Scholar] [CrossRef]
  26. Van der Spek, S.C. Activity patterns in public space; a tool for assessing city centres. In Proceedings of the Walk 21, 11th Conference, The Hague, The Netherlands, 16–19 November 2010. [Google Scholar]
  27. Jiang, B. Ranking spaces for predicting human movement in an urban environment. Int. J. Geogr. Inf. Sci. 2009, 23, 823–837. [Google Scholar] [CrossRef]
  28. Lerman, Y.; Rofè, Y.; Omer, I. Using space syntax to model pedestrian movement in urban transportation planning. Geogr. Anal. 2014, 46, 392–410. [Google Scholar] [CrossRef]
  29. van Nes, A. Spatial configurations and walkability potentials. Measuring urban compactness with space syntax. Sustainability 2021, 13, 5785. [Google Scholar] [CrossRef]
  30. Hillier, B.; Hanson, J. The Social Logic of Space; Cambridge University Press: Cambridge, UK, 1989. [Google Scholar]
  31. Patterson, J.L. Traffic modelling in cities–Validation of space syntax at an urban scale. Indoor Built Environ. 2016, 25, 1163–1178. [Google Scholar] [CrossRef]
  32. Perera, M.K.S.; Coorey, S.B.A. Spatial Configuration and Neighbourhood Characteristics’ Impact on Activities in Informal Spaces: A Case Study of Badulupitiya Informal Settlements in Badulla; University of Moratuwa Sri Lanka: Moratuwa, Sri Lanka, 2022. [Google Scholar]
  33. Zheng, J.; Bai, X.; Wu, Z.; Zhang, S.; Zhang, T.; Wang, H. Research on the spatial behavior conflict in suburban village communities based on GPS tracking and cognitive mapping. J. Asian Archit. Build. Eng. 2022, 21, 2605–2620. [Google Scholar] [CrossRef]
  34. Khaled, S.H.; Elsamahy, E.M.; Felix, M. Developing an agent-based model of pedestrian wayfinding to conduct the best touristic path in historic districts. Archit. Plan. J. 2022, 28, 5. [Google Scholar] [CrossRef]
  35. Jamhawi, M.M.; Zidan, R.A.J.; Sherzad, M.F. Tourist Movement Patterns and the Effects of Spatial Configuration in a Cultural Heritage and Urban Destination: The Case of Madaba, Jordan. Sustainability 2023, 15, 1710. [Google Scholar] [CrossRef]
  36. Suvannadabha, P.; Busayarat, C.; Supnithi, T. The Analytical Tools for Tourism Development through Social Media Data and Spatial Morphological Analysis. Nakhara J. Environ. Des. Plan. 2022, 21, 223. [Google Scholar] [CrossRef]
  37. Qin, X.; Du, X.; Wang, Y.; Liu, L. Spatial Evolution Analysis and Spatial Optimization Strategy of Rural Tourism Based on Space syntax Model—A Case Study of Matao Village in Shandong Province, China. Land 2023, 12, 317. [Google Scholar] [CrossRef]
  38. Can Traunmüller, I.; Keller, I.I.; Şenol, F. Application of space syntax in neighbourhood park research: An investigation of multiple socio-spatial attributes of park use. Local Environ. 2023, 28, 529–546. [Google Scholar] [CrossRef]
  39. Sofield, T.H.; Li, F.M.S. Tourism development and cultural policies in China. Ann. Tour. Res. 1998, 25, 362–392. [Google Scholar] [CrossRef]
  40. Lu, Y. Transforming China’s Tourism Industry: The Impact of Industrial Integration on Quality, Performance, and Productivity. J. Knowl. Econ. 2024, 1–38. [Google Scholar] [CrossRef]
  41. Yang, L.; Jin, Q.; Fu, F. Research on Urban Street Network Structure Based on Spatial Syntax and POI Data. Sustainability 2024, 16, 1757. [Google Scholar] [CrossRef]
  42. Hu, C.; Liu, W.; Jia, Y.; Jin, Y. Characterization of territorial spatial agglomeration based on POI data: A case study of Ningbo City, China. Sustainability 2019, 11, 5083. [Google Scholar] [CrossRef]
  43. Wang, M.; Yang, Y.; Guo, T. Measurement of urban–rural integration level in suburbs and exurbs of big cities based on land-use change in Inland China: Chengdu. Land 2021, 10, 474. [Google Scholar] [CrossRef]
  44. Li, W.; Guan, H.; Han, Y.; Zhu, H.; Zhao, P. Accessibility of multimode transport facilities to suburban tourist attractions: Analysis based on meso- or microcommunity scale in Beijing. J. Urban Plan. Dev. 2021, 147, 04021026. [Google Scholar] [CrossRef]
  45. Fernandes, P.A. Introduction of non-topological costs in syntactic analyses: The case of Gulbenkian estate. In Back to Human Scale: Rethinking Living Spaces for Tomorrow; Universidade Lusofona de Humanidades e Tecnologias: Lisboa, Portugal, 2022. [Google Scholar]
  46. Tsou, K.-W.; Cheng, H.-T.; Tseng, F.-Y.E. Exploring the relationship between multilevel highway networks and local development patterns—A case study of Taiwan. J. Transp. Geogr. 2015, 43, 160–170. [Google Scholar] [CrossRef]
  47. An, H. Accessibility Study of Parks Based on Space Syntax Theory in Harbin Main Urban Area. Master’s Thesis, Northeast Agricultural University, Harbin, China, 2019. [Google Scholar]
  48. Volchenkov, D.; Blanchard, P. Scaling and universality in city space syntax: Between Zipf and Matthew. Phys. A Stat. Mech. Its Appl. 2008, 387, 2353–2364. [Google Scholar] [CrossRef]
  49. Pezeshknejad, P.; Monajem, S.; Mozafari, H. Evaluating sustainability and land use integration of BRT stations via extended node place model, an application on BRT stations of Tehran. J. Transp. Geogr. 2020, 82, 102626. [Google Scholar] [CrossRef]
  50. Zhou, M.; Lu, X.; Li, X.; Zhang, X. Tourism Drives Reconstruction of rural cultural space in Ethnic areas under the Background ofrural revitalization: A Four-dimensional Analysis Framework. Issues Agric. Econ. 2021, 9, 68–79. [Google Scholar]
  51. Qian, C.; Sasaki, N.; Jourdain, D.; Kim, S.M.; Shivakoti, P. Local livelihood under different governances of tourism development in China–A case study of Huangshan mountain area. Tour. Manag. 2017, 61, 221–233. [Google Scholar] [CrossRef]
  52. Wang, X.; Shen, S. Cross-regional adaptation of ‘urban-rural amphibious’ groups in rural tourism destinations. Tour. Trib. 2021, 36, 5–7. [Google Scholar]
  53. Dai, L.; Wan, L.; Xu, B.; Wu, B. How to improve rural tourism development in Chinese suburban villages? Empirical findings from a quantitative analysis of eight rural tourism destinations in Beijing. Area 2017, 49, 156–165. [Google Scholar]
  54. van Nes, A. The impact of the ring roads on the location pattern of shops in town and city centres. A space syntax approach. Sustainability 2021, 13, 3927. [Google Scholar] [CrossRef]
  55. Vorobjovas-Pinta, O.; Wilk, V. Marketing suburban tourism destinations on social media: The case of the city of Joondalup, Western Australia. In Case Based Research in Tourism, Travel, Hospitality and Events; Springer: Singapore, 2022; pp. 219–236. [Google Scholar]
  56. d’Angella, F.; De Carlo, M. Linking online communication strategies to destinations’ performance: An explorative. Int. J. Hosp. Tour 2012, 1, 19–28. [Google Scholar]
  57. Zhu, S.; He, S.; Hu, F.; Guo, Y.; Su, Y.; Cui, G.; Li, J.; Qiu, Q.; He, Q. Exurban and suburban forests have superior healthcare benefits beyond downtown forests. Front. Ecol. Evol. 2023, 11, 1105213. [Google Scholar] [CrossRef]
  58. Li, C.; Zhao, Z.Z.; Feng, S.S. Physiology, psychology and comprehensive loading perception models of cyclists. J. Traffic Transp. Eng. 2020, 20, 181–191. [Google Scholar]
  59. Li, C.; Yang, Y.F.; Shao, Z.Z.; Huang, Y.Z. Characteristics of Urban Cyclist Perception of Fatigue. China J. Highw. Transp. 2018, 31, 291–298. [Google Scholar]
Figure 1. Geographic position of the study area.
Sustainability 16 04359 g001
Figure 2. Comparison of POI data between the Dayan Pagoda and Kunming Lake (a) the location of the Dayan Pagoda and Kunming Lake; (b) POI distribution for the circular area within a radius of 3 km of Kunming Lake in 2018; (c) POI distribution for the circular area within a radius of 3 km of Kunming Lake in 2023; (d) POI distribution for the circular area within a radius of 3 km of the Dayan Pagoda in 2018; (e) POI distribution for circular area within a radius of 3 km of the Dayan Pagoda in 2023.
Sustainability 16 04359 g002aSustainability 16 04359 g002b
Figure 3. Definition of the convex space.
Sustainability 16 04359 g003
Figure 4. Principle comparison of axial modeling and segment modeling.
Sustainability 16 04359 g004
Figure 5. Principles of road network mapping.
Sustainability 16 04359 g005
Figure 6. Road network in the study area.
Sustainability 16 04359 g006
Figure 7. Symmetry differences across topological structures.
Sustainability 16 04359 g007
Figure 8. A diamond-shaped structure.
Sustainability 16 04359 g008
Figure 9. Axial map depth (centered on the Kunming Lake entrance road).
Sustainability 16 04359 g009
Figure 10. Segment map depth (centered on the Kunming Lake entrance road).
Sustainability 16 04359 g010
Figure 11. Distribution of depth values.
Sustainability 16 04359 g011
Figure 13. Comparison of data distributions with different radii.
Sustainability 16 04359 g013
Figure 14. Road network choice analysis.
Sustainability 16 04359 g014
Table 1. POI data types.
Consumer Conditions
Broad Category
Consumer Conditions Mid-Category
Accommodation ServicesHotels, guesthouses, accommodation-service-related places
Healthcare ServicesAnimal medical establishments, first aid centers, disease prevention organizations, healthcare service places, pharmaceutical and healthcare sales stores, clinics, specialized hospitals, general hospitals
Sports and Leisure ServicesVacation spas, leisure places, theaters, entertainment venues, sports venues
Living ServicesElectricity sales offices, telecommunication sales offices, shared equipment, travel agencies, beauty salons, job markets, photography studios, business offices, ticket offices, repair stations, logistics centers, laundromats, information centers, baby service centers,
post offices
Business
and Residential
Industrial parks, buildings, business and residential places
Science, Education, and CultureMuseums; media organizations; archive libraries; convention and exhibition centers; driving schools; science and technology museums; science, education, and culture centers; scientific research organizations; art museums; training organizations; libraries; cultural palaces; literary organizations; schools; exhibition halls
Financial and Insurance ServicesInsurance companies, finance companies, financial and insurance service organizations, banks, securities companies, automatic teller machines
Transportation ServicesMetro stations, port terminals, bus stations, transportation services, parking lots
Shopping ServicesConvenience stores; supermarkets; clothing, shoe, hat, and leather goods stores; personal goods and cosmetic stores; flower, bird, fish, and insect markets; home appliance and electronics stores; home building materials markets; shopping malls; specialty shopping streets; special trading places; sporting goods stores; cultural goods stores; specialty stores; comprehensive markets
Company EnterprisesFactory, company, agriculture, forestry, and fishery bases
Catering ServicesTea ceremony house, pastry shops, coffee shops, fast food restaurants, cold drinks shops, dessert shops, foreign restaurants, casual dining restaurants, Chinese restaurants
Table 2. Number of POI for the circular area within a radius of 3 km.
POI TypesDayan Pagoda in 2018Dayan Pagoda in 2023Kunming Lake in 2018Kunming Lake in 2023
Accommodation Services103215671312
Sports and Leisure Services7719091524
Transportation Services167614864042
Shopping Services57712954256277
Catering Services2821422664204
Total number of POIs19,64319,452666862
Table 3. Number of POIs for transportation services.
Consumer Conditions Mid-CategoryDayan Pagoda in 2018Dayan Pagoda in 2023Kunming Lake in 2018Kunming Lake in 2023
Metro station325000
Port Terminal2202
Bus Station213862619
Transportation Services Related251443
Parking lot140413341018
Total number of POIs167614864042
Table 4. Descriptive statistics analysis results.
Raw ValuesNormalization Values
MeanMedianStandard
Deviation
MeanMedianStandard
Deviation
Integration
(R = 1000 m)
28.34024.17417.9930.0640.0550.038
Integration
(R = 3000 m)
101.87795.10748.9310.3050.2840.145
Integration
(R = 5000 m)
210.690200.89589.3680.3360.3200.142
Integration
(R = 10,000 m)
560.427547.595205.7620.4360.4260.160
Integration
(R = 20,000 m)
1388.0271309.154498.7510.4260.4020.153
Integration
(R = 30,000 m)
2057.3362037.841634.5220.5310.5260.163
Table 5. Pearson’s correlation test.
Choice
R300
Choice
R500
Choice
R800
Choice
R1000
Choice
R3000
Choice
R5000
Choice
R10000
Choice
R20000
Choice
R30000
NCR3000.714 **0.759 **0.651 **0.571 **0.217 **0.091 **−0.048 **−0.120 **−0.127 **
NCR5000.593 **0.728 **0.706 **0.639 **0.282 **0.148 **−0.006−0.096 **−0.110 **
NCR8000.498 **0.639 **0.691 **0.668 **0.366 **0.228 **0.057 **−0.053 **−0.076 **
NCR10000.462 **0.586 **0.650 **0.649 **0.413 **0.277 **0.096 **−0.023 **−0.051 **
NCR30000.274 **0.340 **0.390 **0.410 **0.475 **0.417 **0.252 **0.099 **0.058 **
NCR50000.206 **0.260 **0.292 **0.305 **0.383 **0.385 **0.281 **0.147 **0.108 **
NCR100000.070 **0.096 **0.123 **0.137 **0.212 **0.242 **0.269 **0.220 **0.183 **
NCR20000−0.016 *−0.027 **−0.0030.014 *0.083 **0.108 **0.156 **0.201 **0.195 **
NCR30000−0.028 **−0.055 **−0.039 **−0.020 **0.035 **0.050 **0.089 **0.145 **0.156 **
** Correlation is significant at the 0.01 level (two-tailed). * Correlation is significant at the 0.05 level (two-tailed).
Disclaimer/Publisher’s Note: The statements, opinions and data contained in all publications are solely those of the individual author(s) and contributor(s) and not of MDPI and/or the editor(s). MDPI and/or the editor(s) disclaim responsibility for any injury to people or property resulting from any ideas, methods, instructions or products referred to in the content.

