Abstract
Transport-on-demand services, such as demand-responsive transport (DRT), involve a flexible transportation service that offers convenient and personalised mobility choices for public transport users. Integrating DRT with mobile data and data analytics enhances understanding of travel patterns and allows the development of improved algorithms to support design-optimised services. This study introduces a replicable framework for DRT that employs an on-demand transport simulator and routing algorithm. This framework is supported by a mobile data set, enabling a more accurate service design grounded on actual demand data. Decision-makers can use this framework to understand traffic patterns better and test a DRT solution before implementing it in the actual world. A case study was conducted in Porto, Portugal, to demonstrate its practicality and proof of concept. Results show that the DRT solution required 135% fewer stops and travelled 81% fewer kilometres than the existing fixed-line service. Findings highlight the potential of this data-driven framework for urban public transportation systems to improve key performance metrics in required buses, energy consumption, travelled distance, and stop frequency, all while maintaining the number of served passengers. Under specific circumstances, embracing this approach can offer a more efficient, user-centric, and environmentally sustainable urban transportation service.
1. Introduction
Urban regions are experiencing significant population growth, increasing a vital challenge for cities regarding how to efficiently move people while maintaining the quality of life of its residents and other users. With city users’ dynamic and evolving travel patterns, it becomes harder for traditional, fixed-route public transportation systems to keep pace with the diversity of demand requirements. This weakness can result in underutilised resources, heightened congestion, overall suboptimal transit experience, operational inefficiencies, and misalignment with current environmental sustainability imperatives. Additionally, the rigid nature of transit networks can force users into suboptimal routes, lacking the flexibility needed to address the heterogeneity of mobility patterns within the city. Under such a context, mobility planners and municipal stakeholders are increasingly exploring transport-on-demand services such as demand-responsive transport (DRT) as a prospective solution for optimising the efficiency of the public transport network [1,2]. Its adoption can take place either as a complement to the existing services or, in specific circumstances, even replace them.
The concept of DRT was primarily focused on providing cost-effective public transportation in suburban and rural areas and was mainly organised based on empirical evidence [3]. The advancements in communication and tracking technology, such as vehicle positioning systems and Global Positioning System (GPS)-enabled mobile phones, have transformed DRT from a traditional dial-a-ride service managed by public transport operators or taxi firms into (mobile) application-based services. These services incorporate flexible routes, stops, and adequate vehicle dimensions and are run by operators such as Zeelo [4] and Uber. The successful implementation and adaptability of DRT systems rely on dynamic scheduling to meet fluctuating demand, enhancing operational efficiency for service providers. Incorporating higher flexibility, due to the use of advanced optimisation techniques and data analytics, allows a more tailored solution to address the distinct needs of specific user groups in urban areas and economise expenses in regions with low or sparse demand. It can also foster connectivity between rural or peri-urban areas and urban centres [5]. Moreover, it can contribute to fuel savings, simultaneously reducing greenhouse gas emissions [6,7,8], thus aligning with environmental sustainability goals. Altogether, integrating DRT systems within urban transportation presents a multifaceted approach to addressing the complex challenges of sustainability [9]. DRT fosters economic efficiency by optimising resource utilisation and reducing operational costs for service providers by mitigating the inefficiencies inherent in traditional fixed-route public transportation systems.
Furthermore, DRT enhances social inclusivity by offering tailored mobility solutions to the diverse needs of urban populations, including those living in underserved or remote areas. The flexibility of DRT services ensures equitable access to transportation, promoting social cohesion and enhancing the quality of life for all residents. Additionally, the accessibility and convenience offered by DRT can contribute to the economic empowerment of marginalised communities by facilitating access to employment, education, and essential services. From an environmental perspective, by optimising route efficiency and minimising empty vehicle miles, DRT helps to alleviate congestion and air pollution in urban areas. In addition, adopting DRT encourages modal shifts towards more sustainable transportation options, such as shared mobility and active transportation modes, thereby promoting cleaner and greener urban environments. Overall, the adoption of demand-responsive transport aligns with the pillars of sustainability by enhancing economic efficiency, fostering social inclusivity, and promoting environmental stewardship within urban transportation systems.
With such effects, in the last years, an increasing number of on-demand mobility pilot services have been launched in Europe and North America [10], namely, XBUS in Portugal [11], BerlKönig in Germany [12], Zeelo in the UK [4], and Shotl in Spain [13]. Results show that on-demand and DRT services can potentially reduce various adverse effects of transportation under specific circumstances. BerlKönig’s findings [12] demonstrate a positive impact on congestion and respective reduction of both CO2 and NOx emissions per passenger ride. Approximately 60% of BerlKönig rides were made replacing trips made by private vehicles, carsharing, ridesharing, and taxis.
By planning routes shortly before service provision and optimising vehicle characteristics for user needs, DRT minimises the total distance travelled within urban settings while maintaining commuter coverage. However, computationally addressing these goals is challenging due to multiple objectives and constraints. DRT is closely related to the dynamic vehicle routing problem (DVRP), a well-known NP-hard combinatorial problem, which aims to efficiently serve demand while meeting various objectives and constraints, such as minimising delays, costs, and travel distance. Optimised solutions for DVRP are crucial for DRT systems to respond to requests in real time.
The implementation of DRT systems entails more than just resolving mathematical models; it requires a thorough understanding of how various operational nuances impact both customers and service operators. Conventional journey-planning methods for on-demand transport frequently overlook the complexities of real-world factors, including variations in journey times and delays experienced by users at stops [14].
Current data collection from various sources, such as real-time geospatial data from mobile devices, smart cards, GPS, and vehicle location data, aims to enhance understanding by analysing system behaviour during specific uncertain conditions and events. In today’s urban environment, these devices serve as ubiquitous sensors that provide a rich source of information on travel patterns, congestion, and user behaviour. However, these data sources are not fully utilised despite their richness, particularly in improving public transportation performance [2]. This study aims to bridge this research gap.
Harnessing data-driven techniques becomes essential for evaluating the efficiency of transportation systems, promoting service enhancements, and laying a factual groundwork for well-informed regulatory and decision-making processes. Incorporating on-demand transport services, analysing mobile data derived from personal cell phones, and applying data analytics represent a viable approach to grasp the complexities of transportation dynamics.
This study presents a transport-on-demand framework that utilises a DRT optimisation solution. It outlines the core components of the framework, emphasising the role of multi-source and mobile data analysis in identifying and responding to travel patterns. The DRT optimisation solution that underpins the framework has two main components: a simulation module and a routing optimisation module responsible for dynamically adjusting transit routes based on the requests. This study’s outcomes will contribute to theoretical and practical discussions on urban mobility, steering cities toward a future where public transportation is customised to individual needs, increasingly environmentally conscious, and inherently efficient.
The remainder of the paper is organised as follows: Section 2 reviews the existing literature. Section 3 describes the case study area and the data sets used and explains the proposed framework. Section 4 presents the experimental setup. The experiment’s result is given in Section 5. Section 6 and Section 7 discuss and conclude the paper.
2. Literature Review
Urban mobility systems are constituted mainly by a combination of private vehicles, public transportation fleets, and increasing options such as ridesharing and micro-mobility solutions competing for public space usage, and are struggling to provide more efficient, sustainable, and user-friendly solutions [15,16]. Considering these challenges, studying and exploring the concept of transport on demand has gained significant importance as a potential concept in urban transportation.
Recent advancements in on-demand transportation systems are detailed and described in [6,7,14,17,18,19]. In [20], the findings indicate that the significance of on-demand services in the strategic choices made by public transport authorities varies depending on the intrinsic political context. In other words, while certain cities prioritise urban transportation, others emphasise rural transit services. In areas with long distances to cover and a shortage of public transportation, DRT seems to be a notable need, such as in the suburbs of Hanover, Germany [3].
Several factors can influence the efficiency of DRT services. The existing literature suggests that factors including the area’s lack of availability of public transport service, high car ownership rates, and diminished demand are pivotal in the optimal design of DRT systems [5]. Furthermore, in scenarios characterised by overall low demand and a minimal gap between off-peak and peak demand periods, using minibuses emerges as a cost-effective measure to enhance the economic viability of DRT solutions [5]. Empirical investigations reveal that regular public transport users display a greater tendency to adopt DRT [1], while users exhibit increased tolerance for waiting times compared to enduring longer detours. Alonso-González et al. [21] argue that DRT offers potential as a complement to fixed transit services, but its implementation may involve significant risks. A large fleet may be needed for DRT efficiency, potentially leading to a costly taxi-like service. If DRT offers lower generalised costs, it could affect fixed transit ridership, affecting revenue and possibly increasing congestion in extreme cases. Careful analysis of generalised costs is crucial to identify potential disparities. Additionally, declining fixed transit revenue could lead to the deterioration or elimination of fixed transit services, even though DRT may not fully accommodate passenger demand. Thus, spatial analyses of declined and completed rides are essential for effective risk assessment and mitigation strategies.
Several research studies proposed analytical frameworks and models to study various aspects of on-demand services [21,22,23]. The research in [21] introduced a framework for evaluating the effectiveness of DRT services and their impact on accessibility. They also empirically analysed a DRT service introduced in the Netherlands. In comparison to fixed-line transit, the findings suggest DRT has the potential to enhance user accessibility, particularly for specific origin–destination pairs that are currently underserved. Daganzo et al. [24] introduced an analytical framework to model the ongoing performance of different demand-responsive transit systems, which cover non-shared taxis, dial-a-ride services, and ridesharing as specific instances and situations. Davison et al. [25] examined the state of DRT schemes in Great Britain. They used linear regression models to show that, particularly in rural areas, passenger numbers are affected by the scale of the service (in terms of available seats) and the use of smaller vehicles. Several studies have used simulations to assess how on-demand services could affect actual urban networks, including Lisbon (Portugal) [26], New York City (United States) [27], São Paulo (Brazil) [28], and Bremerhaven (Germany) [29].
Gomes et al. [30] introduced a DRT optimisation solution that consists of a simulator and routing algorithm. This methodology leverages a theoretical demand scenario alongside static statistical data to inform the model. The exploration further indicates that enriching the analytical framework with mobile data to ascertain mobility patterns and demand probabilities could refine the inputs for the optimisation process. Such an approach is posited to enhance the model’s precision and applicability in diverse real-world contexts, thereby potentially improving the overall effectiveness of DRT systems.
Martinez et al. [26] introduced a shared taxi service system for urban areas with a central dispatching approach. They used an agent-based simulation to evaluate its potential market application in Lisbon, Portugal. The findings indicate that the system could be a favourable transportation option, particularly for locations with aligned origins and destinations. It showed an average fare reduction of 9% compared to the conventional system, while the impact on taxi revenues was relatively small.
Costa et al. [28], demonstrated that DRT systems can help to attract individual vehicle users and complement public transport. The authors assessed the viability of DRT as a feeder service to major transport systems like Bus Rapid Transit or Metro. They used a simulation-optimisation model to determine its potential. The model was applied to a first/last mile transport system near a São Paulo, Brazil, subway station. The result showed a significant environmental advantage that results from the lower emissions associated with the reduced travel distance by up to 56%.
Schlüter et al. [29] assessed the potential of DRT systems in connecting rural and urban areas, using Bremerhaven, Germany and its surroundings as a case study. They simulated the resident mobility patterns and calculated operational costs for different scenarios, including automated vehicles with various powertrains. The findings suggest that automated DRT systems can effectively lower economic and environmental transportation costs when bridging rural and urban regions.
A study by Deka et al. [19] found that in 2011, the primary focus was on environmental sustainability. Still, since then, there has also been a relevant concern about the economic aspects of DRT development. The authors argue that the most crucial indicator for assessing the commercial sustainability of a DRT system is the percentage of the operation cost covered by the fare of its service operation. The authors also analysed a DRT system operating in Dubai that could reduce the travel duration and pick-up estimated arrival time by about 14% and 22%, respectively. In [31], Martinez et al. concluded that replacing private cars, buses, and taxis with shared modes while retaining the metro service would reduce vehicle travel and CO2 emissions.
Zhang et al. [2] highlighted that there is untapped potential in using multi-source data, particularly in evaluating the performance of public transportation. The main challenge lies in how to combine these data sources efficiently. The authors suggested a data-driven method using multiple data sources to assess public bus system performance. They tested this approach on the inner-city public bus system in Brisbane, Australia. Zhang et al. [32] introduced a method for positioning taxi group-ride service stands throughout a city. This method is based on regular taxi trips and creates specific pick-up and drop-off points on taxi routes, allowing multiple passengers to share a single trip. Lang et al. [33] investigated how taxi data can be processed in real-time using clustering algorithms. They also examined the areas where passengers frequently get dropped off. The authors used the K-means clustering algorithm combined with the Canopy algorithm based on the Spark framework to perform the clustering and analysis of the data. Franco et al. [34] developed an agent-based model for the simulation of DRT systems in Bristol, UK. The results show that using mobile data can lead to better modelling of demand and user travel patterns. It underscores the significance of mathematical and statistical models in addressing urban mobility challenges. The authors suggest that using mobile and multi-source data and employing advanced modelling methods increases understanding of the needs of different passenger groups. Furthermore, it allows for easier identification of obstacles to design more efficient and environmentally friendly solutions and integrate transportation systems.
Thao et al. [5] investigated how conditions in peri-urban areas affect the design and operation of DRT and travel patterns, using trip data and surveys. The study found that public transport services in such areas, along with high car ownership and low demand, significantly influence DRT design. The authors concluded that combining DRT with public transport can be successful in peri-urban areas, improving accessibility without replacing public transport. However, there is a risk of people switching from walking and cycling to DRT. DRT users are more patient with wait times to be picked up than they are with longer routes resulting from deviation.
Based on the review, it is noticeable that optimising the efficiency of flexible transportation solutions, such as DRT, which can adapt to dynamic demand fluctuations, can be achieved by integrating multi-source data, including mobile datasets. To the best of the authors’ knowledge, this integration has never been performed in the way it is carried out on the framework proposed in this study. It introduces a data-driven framework designed to leverage multi-source data inputs—comprising actual mobile data, demand information from transport operators, and public transportation datasets—to inform and enhance a DRT optimisation solution. Subsequently, the effectiveness of this framework has been empirically evaluated through a comparative analysis with a conventional fixed-schedule bus service in Porto, Portugal. This comparison highlights the potential of data-driven optimisation in improving the responsiveness and efficiency of DRT systems and underscores the significance of adaptable transportation solutions in urban settings.
3. Materials and Methods
This study explores whether DRT service incorporating a flexible demand built upon mobile data can lead to better operational efficiency and respective environmental effects, maintaining the same level of transport supply coverage. To this end, an analytical mobility framework has been proposed and applied in the city of Porto, Portugal. Various tools, including the Python programming language, Pandas, and QGIS, were used to implement the framework and perform data processing and analysis. The following subsections describe the data sets used, the proposed framework, and an overview of the case study area.
3.1. Case Study Description
Following the operator’s recommendations on possible routes to evaluate the framework’s effectiveness, the developed model was applied to a specific region in Porto. The goal was to identify a high-demand region in the city and assess whether the framework and DRT solution would produce results that could be translated into a more efficient allocation of resources than the existing fixed-schedule line bus service in the city, managed by the operator STCP, Sociedade de Transportes Colectivos do Porto (Porto’s Public Transport Operator).
STCP operated 69 bus lines with a fleet of 420 buses covering a network of 493 kilometres and serving 2514 stops [35]. STCP carries approximately 68 million passengers per year. Weekdays registered 57 million passengers, weekends and holidays had 10.8 million, and 571,000 used the morning peak period. The average journey per passenger was 3.7 km, with a bus occupancy rate of 13.5%. Of the total bus fleet, 5% is electric and 79% is natural gas, making up 84% of the entire fleet. The remaining 16% is diesel. The average price of occasional tickets is €2.96.
3.2. Data Set
Data sets that provide insights into the region under study are essential for any data-driven framework. Examples of valuable data sets include mobile phone call detail records (CDRs), origin–destination matrices, existing bus/taxi mobility data, and GPS traces. Such data can help identify points of interest, calculate the movement of people among regions, and estimate the probability of demand distribution. In this work, two types of data were used:
- The first data set consists of anonymised mobile data in the form of origin–destination (O–D) matrices. It encompassed a three-week data record from the mobile operator, aggregated for the municipalities within the Porto metropolitan area. It included information such as time, municipality, origin, destination, inflow, and outflow counts.
- The second set was the mobility data, which contained the data of the STCP network (the public transport firm operating buses and trams in Porto Metropolitan Area, Portugal.) The mobility data included the routes of the buses, bus stops, stop times, frequency, trips, etc. The operator also provided actual demand flows.
These data sets have been used at different stages of the framework to analyse the region’s mobility pattern and extract the required information for implementing the DRT simulation, as described in the following sections.
3.3. The Analytical Mobility Framework
This section outlines and describes the stages of the proposed framework and illustrates how the steps have been applied to the data sets and the case study. The framework consists of four stages for processing multi-source data and utilises a DRT optimisation solution. It involves analysing and estimating the mobility patterns using real data sets to feed the required inputs to the DRT optimisation solution.
The data flow diagram presented in Figure 1 depicts the four stages of the framework:
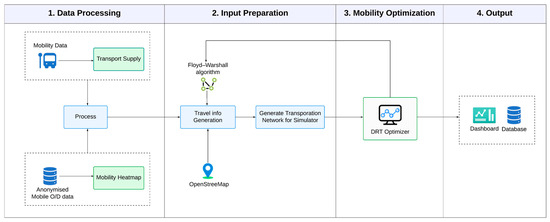
Figure 1.
The stages of the proposed framework.
- The Data Processing stage involves cleaning, visualising, analysing, and processing the data sets to obtain the necessary information. This stage aims to allow the operators and the interested parties to identify and define the region(s) in which to apply the DRT solution by analysing hotspot regions, checking the mobility data availability for the selected regions, and identifying available existing fixed-transit bus lines;
- The Input Preparation stage calculates the required inputs for DRT optimization solutions (Stage 3) from the processed data. This information may include travel information and transportation network, spatial demand probability distribution, pick-up and drop-off locations, travel time, etc.;
- Mobility optimisation encompasses the execution of the DRT optimiser. It uses the inputs prepared in the previous stage and executes the DRT simulation/optimisation solution;
- Finally, in Stage 4, the optimisation results are processed and stored and can be made accessible through a database or a dashboard.
3.3.1. Data Processing Stage
During this stage, the datasets must undergo a data-cleaning process to eliminate errors and duplicate data points. Subsequently, visualisation techniques are employed to aid in analysing and extracting essential information. Furthermore, any abnormalities in the data sets are identified and removed. Ultimately, the processed data is utilised to identify hotspot regions and assess the availability of mobile and mobility data in selected areas, which are used to examine the existing fixed-transit bus lines for selecting the pick-up and drop-off spots.
Python scripts were developed to perform this stage, which utilised various libraries, including Pandas, for data analysis. The O–D for the statistical section regions of the city of Porto was extracted from the data set. The scripts help to analyse data based on the volume of movements occurring between various regions of the city. These calculations were conducted hourly and daily, aiming to determine the averages and totals of these movements. The data analysis also enabled the comprehension of daily peak hours, mobility patterns, and potential anomalies in mobility patterns (such as those arising from events). As a result of the analysis, we conscientiously identified and eliminated these anomalies from the data set before utilising the data within the mobility optimisation solution.
Next, OpenStreetMap’s APIs were used to find the referencing streets. Analysis of this data provided an insight into the mobility patterns, temporal dynamics, and variations of mobile usage during these specific weeks. Next, this information was plotted and overlaid over the map. Figure 2 illustrates an example of such a chart. It provides an overview of the movements between each origin and destination in the city of Porto. It allows for a comprehensive view of the data set and highlights the underlying patterns. The thickness of the line represents the amount of demand movements, and the size of the nodes present the inter-regional movements. By aggregating the demand movements and applying clustering, it was possible to pinpoint the hotspots within the region of interest.
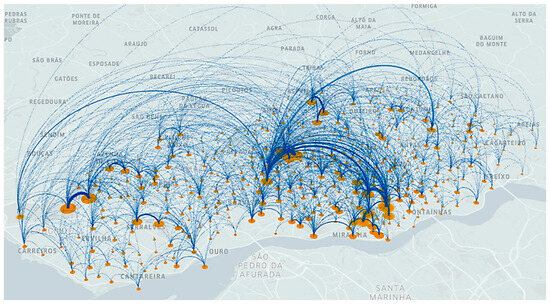
Figure 2.
Graphical representation of the movements between source-destination.
Then, the data were overlaid with the mobility data, which helped to identify the bus services, routes, bus stops, and schedules covered by the mobile data. This facilitated the comprehension of mobility movements and patterns in relation to the mobility data, enabling the identification of fixed transit bus lines in regions with high-demand requests. In the Experimental Setup section, more analysis of these findings is provided.
3.3.2. Input Preparation Stage
In this stage, the extracted data from Stage 1 can be used to infer the required inputs for DRT/mobility solutions in Stage 3. Depending on the chosen mobility solution, various inputs may be necessary. This study generated input information for the DRT optimiser by integrating the mobile and mobility data. This included travel and network information such as routes, spatial demand probability distribution for each region, pick-up and drop-off locations, and travel time.
With the help of the developed Python scripts, the OpenStreetMap and OSRM APIs were used to find information such as route, distance travelled, and bus stop locations and their corresponding names. In some cases where these services could not find the travel distances and routes, the Floyd–Warshall algorithm [36] was used. The Floyd–Warhall algorithm is a dynamic programming approach used for finding the shortest paths between all pairs of vertices in a weighted graph. Alternatively, A* and Dijkstra algorithms can be used.
During this phase, there is a potential for grouping the regions into grids to decrease the number of regions, intending to minimise computational complexities and cost.
3.3.3. Mobility Optimisation Stage
In this stage, the travel and network information (from the previous stage) was fed into the DRT optimisation solution, which optimises different parameters such as routes, number of buses, pick-up and drop-off time, etc., to meet the objectives. This includes determining stops and the number of buses needed and evaluating essential metrics such as the carbon footprint, total distance travelled, and the number of satisfied requests.
Below is a brief overview description of the utilised DRT optimiser. The detailed information on the implementation of the DRT optimiser, including the simulation model and heuristic, as well as the algorithms and calculations steps, is described in [37], co-authored by one of the authors of this study. The design of services plays a crucial role in DRT success, requiring decision-makers to understand how different operational approaches impact performance thoroughly. For that reason, the DRT optimiser integrates a simulation model and a constructive multi-objective heuristic (Parallel Reactive-GRASP), both implemented in Java, to minimise operating costs and maximise service quality. Its primary goal is to devise efficient strategies for a multi-objective problem, focusing on reducing operational expenses, wait times, and passenger journey durations and enhancing service requests’ fulfilment.
The simulator generates time-ordered trip requests based on the trip request template. These requests are inputs to the route optimisation module that tries to satisfy each request, considering a fleet of vehicles (with their respective locations and other attributes of the vehicle model) and the expected travel times.
The set of parameters supported by the platform makes it possible to simulate a wide range of on-demand transport systems, namely, to model different vehicle fleets (number of vehicles, capacity, cost structures, etc.), different service areas (number of stops, distances, average speeds, etc.), different degrees of dynamism (real-time requests), and different demand structures (number of requests, spatiotemporal distribution of requests, etc.).
In this solution, it is assumed that passengers select starting and ending points from predefined locations. They will be served by a fleet of vehicles that have an equal number of seats. Multiple passengers can share one vehicle, e.g., a minibus. Each location, except for the depot, can be used for pick-ups, drop-offs, or both. At a pick-up spot, different passengers can have different destinations.
The simulation module proposed in this work involves 4 components: the service area model, the trip request model, the vehicle model, and a real-time events generator. A brief overview of the components is given below:
- Service area model: To simulate vehicle movements realistically, the simulation models the physical road network and the stochastic variation of travel time across network sections. The network is modelled by a set of stops and lanes that connect the stops. Each route is associated with average travel times and standard deviation as a function of the time of day based on historical data;
- Travel requests model: The purpose of the travel request model is to generate travel requests with a structure consistent with the study area and road network on which the service operates. The defined simulation system generates two types of transport requests: “a priori” transport requests (before the service starts) and real-time transport requests (orders that arrive during the service time);
- Vehicles type: It distinguishes the vehicles by characteristics like capacity, operating costs, availability period, and depot location. It continuously tracks and updates the vehicles’ status, which can be at the depot, pick-up, drop-off stops, or on the route, while maintaining data such as routes, stops, speeds, positions, and delays, and employs a queue-based system for assigned requests in a discrete-event simulation;
- Real-time event model: These events in the system can be broadly categorised into user- and vehicle-related events. User-related events include new real-time requests, cancellations, and no-shows. Vehicle-related events are arrivals at stops, breakdowns during service, and delays. Each time a user requests a service, the algorithm must make a routing and scheduling decision by changing the system conditions. The system decides which vehicle should serve the new customer and at what position on the route of the specific current vehicle.
To speed up the calculation, the model uses a parallel reactive GRASP-based algorithm [38]. The routing algorithm runs in parallel to speed up the process. For each demand request, it iteratively constructs routes followed by a local improvement phase. The reactive mechanism of the algorithm adjusts the balance between greediness and randomness of the process.
The algorithm constructs a route by inserting the next best node to the route while considering the DRT problem objective and constraints. The nodes are selected using a node ranking function (Equation (1)).
where NS is the list of nodes not yet in the solution. Ci is the cost of going from the current node to node i. NPi is the list of the number of passengers at each node i. PTi is the list of pick-up lower time limits of node i. DTi is the delivery lower time limit at each node i. βc, βp, and βd are the weights for the cost, pick-up, and delivery time, respectively.
NRFi = βc Ci + NPi +βp PTi + βd DTi ∀i ∈ NS,
3.3.4. Output Stage
In the final stage, the result of the DRT optimiser is stored in a database and provided as a dashboard to display the results in a user-friendly manner. This allows the interested parties to utilise the result for decision-making or develop applications to access the data in the database. The result of the optimiser provides the information required for effective DRT-related decision-making.
4. Experimental Setup
This section outlines the process of selecting the testbed through data analysis. It then details the simulation setup and parameters employed in the experiment.
4.1. Data Analysis Results
As mentioned in the data-processing section, we processed and analysed the mobile data to understand the mobility pattern and movement across the city and select a region to assess the feasibility of the DRT solution. A brief overview of our findings is given in this section. Figure 3 presents the aggregated daily movement across the mobile data set.
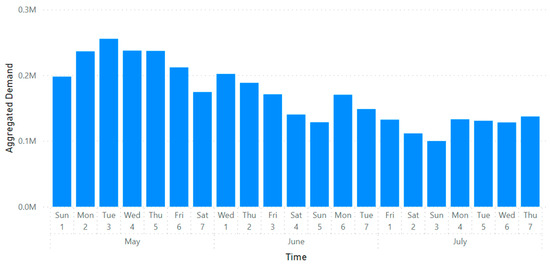
Figure 3.
Aggregated demand by the first week of each month and day from the mobile data set.
In this data set, it was noted that May exhibited the highest overall demand movement in the data set. Through analysis, we determined that this surge in demand was directly influenced by noteworthy events taking place in the city during that month, such as the Queima das Fitas celebration (University Students Party Week). Also, the data provided did not cover some of the statistical section regions. Therefore, the data was cleared from the anomalies. After this process, it was noted that June 1 between 12 noon and 14 h 30 min had the highest volume of movements. This information is used during the simulation.
By overlaying the data over geographic vector figures and shape files, finding hotspots, and referencing streets, we attempted to identify the top hotspot regions. These regions and the movement between the origins and destinations are depicted in Figure 4. The thickness of the line represents the amount of demand movements, and the size of the nodes present the inter-regional movements. Similarly, Figure 5 presents the aggregated demand movement among top origins and destinations within the data set. The thickness of the links on the graph indicates the demand between each origin and destination pair. In this example, based on the sum of demands, Rua do Zaire, Travessa de São Dinis, and Rua de São Dinis were the top three origins and destinations, which fall in the region highlighted by the square in Figure 4. The analysis of such charts provided insights into the prominent patterns, significant locations, routes, and connections within the data set that allowed us to select the region within the case study area.
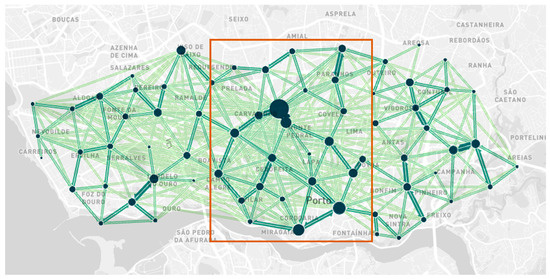
Figure 4.
Hotspot regions and the movements between origin and destination.
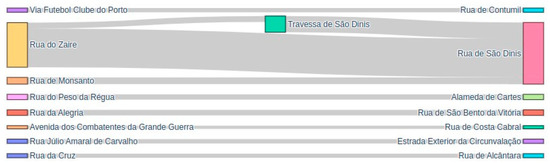
Figure 5.
Aggregated movements between top origin and destination streets.
4.2. Testbed Selection
The Asprela to the downtown path was chosen as the pivotal pair of the case study to determine the most suitable region for assessing the framework and DRT solution based on the operator’s recommendation and analysed data. The reasons for selecting this route were:
- As illustrated in the result section, mobile data show high movement across these regions;
- Asprela is an area where several faculties from the University of Porto and the main hospital of the North of Portugal are located, while downtown hosts Porto’s historical centre and popular dining and entertainment spots.
By examining the operator network, three specific routes (300, 301, and 305) ensure the bus connection between Asprela and downtown and share some bus stops along their paths. Taking this into consideration, the circular routes 300 and 301 were selected for the study, as they encompass most of the bus stops within this region. Figure 6 shows these two routes and the regions that are covered by the mobile data set.
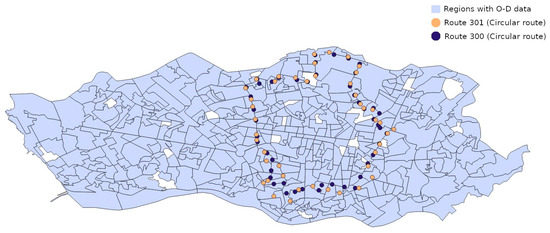
Figure 6.
Selected region and routes for case study.
4.3. Simulation Setup
During the simulation, we tested to complement or replace STCP lines 300 and 301, which serve demand on the “Asprela–Aliados” axis, with an on-demand transport service for a duration of 2 h 30 min, between 12 noon and 14 h 30 min, on 1 June 2022, the day that registered the highest demand and therefore allowed for testing the worst-case scenario. To simulate the structure of demand (the origins and destinations of transport requests), with the help of the proposed framework, the mobile data was used for the selected day, thus obtaining a Poisson rate, spatial probability distribution, and the STCP stop network. The simulation parameters used are given in Table 1. During the experiments, minibuses were used to serve the demand requests. The service time was 2 h and 30 min, and the maximum allowed waiting time was 10 min.

Table 1.
The simulation parameters used during the experiment.
The Number of Vehicles is the maximum number of minibuses to be used in the simulation. Vehicle Capacity is the maximum number of passengers that can board a vehicle. The real-time request arrival rate, i.e., the intensity of new requests being generated, is modelled as a Poisson process and is represented by Request Lambda. Mean Travel Time is the average travel time in the service area. Standard Deviation Travel Time represents the standard deviation of travel time in the service area. Mean and standard deviation travel time parameters are used in the simulation to generate the “desired” delivery times for transport services where the users specify both the pick-up and delivery time. The Number of Requests is the maximum number of requests generated during the service period. The Time Window is the maximum time users can accept to wait at each stop which the operator sets. The setting of the time window size needs to balance customer service with the impact on productivity and cost. ‘Service duration’ is the duration of the DRT service.
5. Experimental Results
We applied the mobility optimisation solution to the scenario described in the previous section. The optimisation solution allows us to obtain performance indicators, such as total distance travelled, trips per productive hour, and operational cost per trip, among others. We simulated 50 transport requests in the defined period and according to the probabilistic distribution of the data. On the supply side, we defined a fleet of up to 10 minibuses with 27 seats per vehicle capacity. The result is illustrated in Table 2.
Table 2.
Comparison of conventional service with on-demand service.
The DRT optimiser recommends using four minibuses for the study area to meet demand. This solution is optimised regarding the number of passengers served, distance travelled, cost, and fuel consumption. We could conclude that it is possible to satisfy the 50 transport requests using four minibuses, with an average delay in picking up passengers of less than 3 min, visiting 86 stops, in a total of 73 km travelled. By comparison, the regular service of the STCP for the same period has routes every 30 min for Lines 300 and 301. This means, for each line: visiting 225 stops (45 in each service, five services in 2 h 30 min), a total distance travelled of 174 km, and a bus (for each line).
Figure 7a presents the route taken by the fixed-line bus transport, Line 300, and Figure 7b shows the route taken by an on-demand bus in the simulation. As shown, the on-demand bus is more flexible in taking different routes. By utilising this flexibility and real-time road conditions, reduced waiting and travel time can be expected.
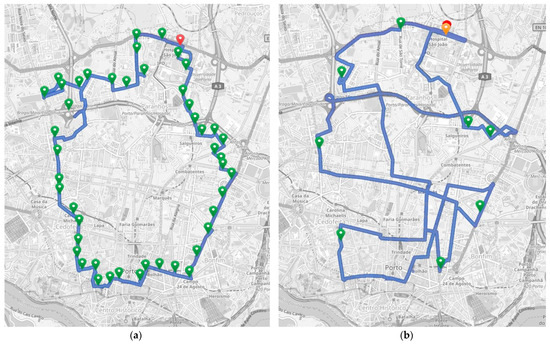
Figure 7.
The bus routes: (a) The fixed route for the bus Line 300; (b) A route taken by one of the on-demand buses during the simulation.
Finally, given the dynamic nature of transport-on-demand, the use of such an optimised solution allows operators to accommodate the same number of passengers with fewer resources, reducing average waiting and journey times. In addition, it helps lower costs while improving service quality.
6. Discussion
This study demonstrates that leveraging multiple data sources presents diverse opportunities for analysing, designing, and implementing flexible on-demand transportation solutions. The findings indicate that implementing such a framework can have various implications for both users and service providers. In the case study, the solution could fulfil requests with four minibuses, whereas fixed-line transit would require two full-size buses to meet the same demand, which may impact costs and service quality. The wages from drivers of two versus four vehicles are compensated by the reduction of the distance travelled by those vehicles and associated operational costs. The DRT solution required 86 stops, 135% fewer than the fixed-line transit (450 bus stops for both Lines 300 and 301), and performed 81% fewer kilometres. Unlike fixed-line transit, which operates on a fixed schedule, DRT systems offer more flexible pick-up schedules. In this case, passengers were picked up in less than three minutes, a 163% reduction compared to fixed-line transit’s 30-min intervals. Additionally, due to vehicle type and distance travelled, DRT’s carbon footprint is estimated to be 73% lower than fixed-line transit. Furthermore, planned investments in electric buses can further reduce emissions.
These results show that such frameworks and DRT systems have the potential to have positive impacts on passengers’ experience and environment. Moreover, they offer service providers an opportunity to enhance service quality and manage their operational costs by utilising these methodologies to implement DRT systems to supplement or replace their existing transportation during off or high-demand periods.
Ensuring the ongoing quality of DRT services relies heavily on continuous analysis and assessing these solutions. When deciding to adopt on-demand mobility options, it is crucial to weigh the potential complexities involved and their effect on transportation and climate [39]. As discussed in [21], achieving high efficiency may necessitate a sizable fleet, potentially leading to a heavily subsidised taxi-like service and, in extreme cases, may even exacerbate road congestion. Therefore, conducting thorough analyses of regions using multi-source data [40] becomes imperative, considering factors such as peak and off-peak hours, socioeconomic conditions [41], and the availability of public transportation. Subsequently, these services could be used to complement and enhance public transportation rather than entirely replace it or to introduce new on-demand services by identifying regions that could benefit from it [42].
The advantage of using such a framework is that the service providers can use the framework:
- To select regions to implement DRT solutions, i.e., to identify the regions where DRT is required to replace, complement, or introduce new services;
- To perform a feasibility study. Before implementing DRT systems, the providers may need to base their decision-making on analysing the cost, quality of the service, and environmental effects. Hence, such feasibility analysis can be performed by utilising the framework and multi-source datasets that indicate the current or historical condition of the regions;
- Fleet real-time decision-making. Such a framework can be used to schedule fleets dynamically, calculate routes based on real-time road network conditions, and dynamically assign passengers to the vehicles. Therefore, it potentially can lead to flexible and dynamic fleet operations that can respond to the changes in the road network and demand requests.
Data play a crucial role in these data-driven frameworks. These frameworks can operate more effectively by harnessing data with more precise spatiotemporal details. However, while using mobile data can provide valuable insight into tracking mobility behaviour, they also implies some limitations. Mobile data signals can be difficult to access as their use raises privacy concerns, as it involves tracking individuals’ movements and activities, requiring robust data anonymisation and protection measures. Additionally, these data may not be available or reliable in all areas, leading to gaps in data coverage due to factors like signal strength, maintenance issues, or other network infrastructure-related issues. To overcome those limitations, authors propose a framework that includes other data sources, such as actual demand transport data and infrastructure data, so that it is possible to extract the maximum value from mobile data and mitigate the respective limitations by enhancing the accuracy and reliability of the demand representation that feeds the bus-on-demand optimisation model.
7. Conclusions
This study introduced a framework that follows a data-driven approach and utilises a demand-responsive transportation (DRT) simulation model. Anonymised mobile data and public transport data were used to analyse hot spots, demand rates, peak hours, etc., for the city of Porto, Portugal. This information is then used as input to the DRT model. Compared to public transport buses in the selected region, the result shows that such systems can improve the distance travelled, the number of passengers served, the delay, and the number of required stops. Such data-driven methodologies can enable transportation service providers to make more informed decisions while analysing and implementing new on-demand mobility solutions.
The study provides two main contributions to the field of transportation planning. The first contribution is theoretical, creating a framework that integrates underutilized data sets for transport planning. This significantly improves transport efficiency, allowing for adding new ones in the future. The second contribution is practical, providing a tool that is applicable in different geographical contexts and adaptable for diverse strategic managerial policies.
Regarding the theoretical contribution, the framework should be tested in actual contexts to validate its universal application and find whether improving it is possible. Moreover, other transport-on-demand responsive configurations can be integrated into the framework. For example, integrating a hybrid model that includes specific fixed spots based on the predicted higher demand for those spots. Such features could be built by incorporating machine learning algorithms to forecast demand and generate synthetic data for locations where the required data is missing [43].
As a practical contribution, this framework can be integrated into the transport operators’ strategies by assessing the impacts of a DRT system either in one of the lines, a chosen O-D area, or through the whole network. Furthermore, to make the framework more suitable for online assessment of the paths, machine learning methods could be used to reduce the time and cost required to solve the routing optimisation. Having the quantification of operational and environmental impacts prior to its implementation can lead transport operators to choose, in an informed way, the options that better fit their service’s purpose while replying to society’s scrutiny about its carbon footprint.
Author Contributions
Conceptualisation, S.M., R.G. and R.A.; methodology, R.A., R.G. and A.A.; validation, R.G. and R.A.; investigation, S.M., R.G., R.A. and A.A.; writing—original draft preparation, S.M. and R.A.; writing—review and editing, S.M., R.G., R.A. and A.A.; supervision, S.M. and A.A.; funding acquisition, S.M. and A.A. All authors have read and agreed to the published version of the manuscript.
Funding
This research is sponsored by national funds through the Foundation for Science and Technology’s support through funding UIDB/04625/2020 from the research unit CERIS (DOI: 10.54499/UIDB/04625/2020); the project City Catalyst—Catalisador para Cidades Sustentáveis, POCI—Programa Operacional Competitividade e Internacionalização, PO Lisboa—Programa Operacional Lisboa: POCI-01-0247-FEDER-046112, with the reference 46119. The authors would also like to acknowledge the European fund that supports the project Digital Innovation Hub for Climate Neutrality (DIH4CN), part of the European Digital Innovation Hubs Network, with the reference 03/C16-i03/2022.P767.
Institutional Review Board Statement
Not applicable.
Informed Consent Statement
Not applicable.
Data Availability Statement
Upon request, the corresponding authors can provide the processed data from this study, subject to privacy, commercial, and legal considerations.
Acknowledgments
The authors thank the partners involved in the funded projects by providing the data that allowed them to carry on this research.
Conflicts of Interest
The authors declare no conflicts of interest.
References
- Alonso-González, M.J.; Van Oort, N.; Oded, C.; Hoogendoorn, S. Urban Demand Responsive Transport in the Mobility as a Service Ecosystem: Its Role and Potential Market Share. In Proceedings of the 15th International Conference on Competition and Ownership in Land Passenger Transport: International Conference Series on Competition and Ownership in Land Passenger Transport, Stockholm, Sweden, 13–17 August 2017. [Google Scholar]
- Zhang, X.; Wu, Y. Analysis of Public Transit Operation Efficiency Based on Multi-Source Data: A Case Study in Brisbane, Australia. Res. Transp. Bus. Manag. 2023, 46, 100859. [Google Scholar] [CrossRef]
- Gilibert, M.; Ribas, I.; Maslekar, N.; Rosen, C.; Siebeneich, A. Mapping of Service Deployment Use Cases and User Requirements for an On-Demand Shared Ride-Hailing Service: MOIA Test Service Case Study. Case Stud. Transp. Policy 2019, 7, 598–606. [Google Scholar] [CrossRef]
- Zeelo A Fully Managed Electric Commuter Bus Service for Your Employees. Available online: https://info.zeelo.co/electric-commuter-service (accessed on 2 May 2024).
- Thao, V.T.; Imhof, S.; Von Arx, W. Demand Responsive Transport: New Insights from Peri-Urban Experiences. Travel Behav. Soc. 2023, 31, 141–150. [Google Scholar] [CrossRef]
- Chan, N.D.; Shaheen, S.A. Ridesharing in North America: Past, Present, and Future. Transp. Rev. 2012, 32, 93–112. [Google Scholar] [CrossRef]
- Furuhata, M.; Dessouky, M.; Ordóñez, F.; Brunet, M.-E.; Wang, X.; Koenig, S. Ridesharing: The State-of-The-Art and Future Directions. Transp. Res. B Methodol. 2013, 57, 28–46. [Google Scholar] [CrossRef]
- Yu, B.; Ma, Y.; Xue, M.; Tang, B.; Wang, B.; Yan, J.; Wei, Y.-M. Environmental Benefits from Ridesharing: A Case of Beijing. Appl. Energy 2017, 191, 141–152. [Google Scholar] [CrossRef]
- Filipe, R.P.; Heath, A.; McCullen, N. The Path to Sustainable and Equitable Mobility: Defining a Stakeholder-Informed Transportation System. Sustainability 2022, 14, 15950. [Google Scholar] [CrossRef]
- Foljanty, L. Mapping the Global On-Demand Ridepooling Market. Available online: https://lukas-foljanty.medium.com/mapping-the-global-on-demand-ridepooling-market-f8318de1c030 (accessed on 2 May 2024).
- XBUS Mobilidade a Pedido. Available online: https://xbus.carris.pt/ (accessed on 2 May 2024).
- Diel, A.; Herpich, C.; Von, V.; Lorenz, W. Zwischenergebnisse Des Forschungsprojekts BerlKönig. Available online: https://unternehmen.bvg.de/wp-content/uploads/2022/05/Zwischenergebnisse-Forschungsprojekt-BerlKoenig.pdf (accessed on 2 May 2024).
- Shotl Improving Mobility in Smaller Towns. Available online: https://shotl.com/news/improving-mobility-in-smaller-towns (accessed on 2 May 2024).
- Ahani, P.; Arantes, A.; Melo, S. An Optimisation Model for Structuring a Car-Sharing Fleet Considering Traffic Congestion Intensity. J. Adv. Transp. 2023, 2023, e9283130. [Google Scholar] [CrossRef]
- Zardini, G.; Lanzetti, N.; Pavone, M.; Frazzoli, E. Analysis and Control of Autonomous Mobility-On-Demand Systems. Annu. Rev. Control Robot. Auton. Syst. 2022, 5, 633–658. [Google Scholar] [CrossRef]
- Ahani, P.; Arantes, A.; Garmanjani, R.; Melo, S. Optimising Vehicle Replacement in Sustainable Urban Freight Transportation Subject to Presence of Regulatory Measures. Sustainability 2023, 15, 12266. [Google Scholar] [CrossRef]
- Seng, K.P.; Ang, L.-M.; Ngharamike, E.; Peter, E. Ridesharing and Crowdsourcing for Smart Cities: Technologies, Paradigms and Use Cases. IEEE Access 2023, 11, 18038–18081. [Google Scholar] [CrossRef]
- Hansen, T.; Sener, I.N. Strangers on This Road We Are On: A Literature Review of Pooling in On-Demand Mobility Services. Transp. Res. Rec. 2023, 2677, 1368–1381. [Google Scholar] [CrossRef]
- Deka, U.; Varshini, V.; Dilip, D.M. The Journey of Demand Responsive Transportation: Towards Sustainable Services. Front. Built Environ. 2023, 8, 942651. [Google Scholar] [CrossRef]
- Pavanini, T.; Liimatainen, H.; Sievers, N.; Heemsoth, J.P. The Role of DRT in European Urban Public Transport Systems—A Comparison between Tampere, Braunschweig and Genoa. Future Transp. 2023, 3, 584–600. [Google Scholar] [CrossRef]
- Alonso-González, M.J.; Liu, T.; Cats, O.; Van Oort, N.; Hoogendoorn, S. The Potential of Demand-Responsive Transport as a Complement to Public Transport: An Assessment Framework and an Empirical Evaluation. Transp. Res. Rec. J. Transp. Res. Board 2018, 2672, 879–889. [Google Scholar] [CrossRef]
- Marković, N.; Edward Kim, M.; Schonfeld, P. Statistical and Machine Learning Approach for Planning Dial-a-Ride Systems. Transp. Res. A Policy Pract. 2016, 89, 41–55. [Google Scholar] [CrossRef]
- Huang, D.; Tong, W.; Wang, L.; Yang, X. An Analytical Model for the Many-To-One Demand Responsive Transit Systems. Sustainability 2019, 12, 298. [Google Scholar] [CrossRef]
- Daganzo, C.F.; Ouyang, Y. A General Model of Demand-Responsive Transportation Services: From Taxi to Ridesharing to Dial-a-Ride. Transp. Res. B Methodol. 2019, 126, 213–224. [Google Scholar] [CrossRef]
- Davison, L.; Enoch, M.; Ryley, T.; Quddus, M.; Wang, C. A Survey of Demand Responsive Transport in Great Britain. Transp. Policy 2014, 31, 47–54. [Google Scholar] [CrossRef]
- Martinez, L.M.; Correia, G.H.A.; Viegas, J.M. An Agent-Based Simulation Model to Assess the Impacts of Introducing a Shared-Taxi System: An Application to Lisbon (Portugal). J. Adv. Transp. 2015, 49, 475–495. [Google Scholar] [CrossRef]
- Alonso-Mora, J.; Samaranayake, S.; Wallar, A.; Frazzoli, E.; Rus, D. On-Demand High-Capacity Ride-Sharing via Dynamic Trip-Vehicle Assignment. Proc. Natl. Acad. Sci. USA 2017, 114, 462–467. [Google Scholar] [CrossRef]
- Costa, P.C.; Cunha, C.B.; Arbex, R.O. A Simulation-Optimization Model for Analysing a Demand Responsive Transit System for Last-Mile Transportation: A Case Study in São Paulo, Brazil. Case Stud. Transp. Policy 2021, 9, 1707–1714. [Google Scholar] [CrossRef]
- Schlüter, J.; Bossert, A.; Rössy, P.; Kersting, M. Impact Assessment of Autonomous Demand Responsive Transport as a Link between Urban and Rural Areas. Res. Transp. Bus. Manag. 2021, 39, 100613. [Google Scholar] [CrossRef]
- Gomes, R.; Pinho, J.; Dias, T.G. Sustainable Demand Responsive Transportation Systems in a Context of Austerity: The Case of a Portuguese City. Res. Transp. Econ. 2015, 51, 94–103. [Google Scholar] [CrossRef]
- Martinez, L.M.; Viegas, J.M. Assessing the Impacts of Deploying a Shared Self-Driving Urban Mobility System: An Agent-Based Model Applied to the City of Lisbon, Portugal. Int. J. Transp. Sci. Technol. 2017, 6, 13–27. [Google Scholar] [CrossRef]
- Zhang, W.; Ukkusuri, S.V. Share-a-Cab: Scalable Clustering Taxi Group Ride Stand from Huge Geolocation Data. IEEE Access 2021, 9, 9771–9776. [Google Scholar] [CrossRef]
- Lang, K.; Chai, X. Research on Clustering Algorithm Based on Spark. In Proceedings of the 2023 3rd International Conference on Consumer Electronics and Computer Engineering (ICCECE), Guangzhou, China, 6–8 January 2023; pp. 855–858. [Google Scholar]
- Franco, P.; Johnston, R.; McCormick, E. Demand Responsive Transport: Generation of Activity Patterns from Mobile Phone Network Data to Support the Operation of New Mobility Services. Transp. Res. A Policy Pract. 2020, 131, 244–266. [Google Scholar] [CrossRef]
- STCP 150 Anos de Mobilidade, Relatorio E Contas. Available online: https://www.stcp.pt/fotos/editor2/Relat%C3%B3rios%20e%20Contas/stcp_r_c2022.pdf (accessed on 2 May 2024).
- Cormen, T.; Leiserson, C.; Rivest, R.; Stein, C. Introduction to Algorithms, 4th ed.; MIT Press: Cambridge, MA, USA; London, UK, 2022; pp. 655–662. [Google Scholar]
- Gomes, R.; Pinho, J.; Galvão, T. An Integrated Approach for the Design of Demand Responsive Transportation Services. In Computer-Based Modelling and Optimisation in Transportation; Advances in Intelligent Systems and Computing; Freire, J., Rossi, R., Eds.; Springer: Cham, Switzerland, 2014; Volume 262, pp. 223–235. [Google Scholar] [CrossRef]
- Feo, T.A.; Resende, M.G.C. Greedy Randomized Adaptive Search Procedures. J. Glob. Optim. 1995, 6, 109–133. [Google Scholar] [CrossRef]
- Sturzaker, J.; Catulli, M.; Kubitz, B. Sustainability Trade-Offs in Climate Change Geographies in England. Sustainability 2024, 16, 549. [Google Scholar] [CrossRef]
- Huo, Y.; Qiu, Z.; Xin, Y.; Dai, S.; Pan, R.; Wen, Y. Exploring the Influencing Factors on Demand-Responsive Customized Bus Ridership Using Multi-Source Data. In Proceedings of the 2021 6th International Conference on Transportation Information and Safety (ICTIS), Wuhan, China, 22–24 October 2021. [Google Scholar]
- Si, H.; Shi, J.; Hua, W.; Cheng, L.; De Vos, J.; Li, W. What Influences People to Choose Ridesharing? An Overview of the Literature. Transp. Rev. 2023, 43, 1211–1236. [Google Scholar] [CrossRef]
- Kim, H.; Choi, J.; Cho, S.; Liu, F.; Jin, H.; Lim, S.; Kim, D.; Lee, J.; Joh, C.-H. Identifying Different Sources of the Benefit: Simulation of DRT Operation in the Heartland and Hinterland Regions. Sustainability 2022, 14, 16519. [Google Scholar] [CrossRef]
- Simini, F.; Barlacchi, G.; Luca, M.; Pappalardo, L. A Deep Gravity Model for Mobility Flows Generation. Nat. Commun. 2021, 12, 6576. [Google Scholar] [CrossRef] [PubMed]
Disclaimer/Publisher’s Note: The statements, opinions and data contained in all publications are solely those of the individual author(s) and contributor(s) and not of MDPI and/or the editor(s). MDPI and/or the editor(s) disclaim responsibility for any injury to people or property resulting from any ideas, methods, instructions or products referred to in the content. |
© 2024 by the authors. Licensee MDPI, Basel, Switzerland. This article is an open access article distributed under the terms and conditions of the Creative Commons Attribution (CC BY) license (https://creativecommons.org/licenses/by/4.0/).