Article

Ecologically Oriented Freeway Control Methods Integrated Speed Limits and Ramp Toll Booths Layout

1
School of Mechanical and Automotive Engineering, Shanghai University of Engineering Science, Shanghai 201620, China
2
Shanghai Intelligent System Co., Ltd., Shanghai 200063, China
*
Author to whom correspondence should be addressed.
Sustainability 2024, 16(11), 4404; https://doi.org/10.3390/su16114404
Submission received: 3 March 2024 / Revised: 28 April 2024 / Accepted: 20 May 2024 / Published: 23 May 2024
(This article belongs to the Section Sustainable Transportation)

Abstract

:
Traffic exhaust pollution, especially in congested areas of freeways, is one of the main causes of air pollution. With the increase in the number of vehicles, traffic and environmental issues have become more prominent. In addition, traffic congestion leads to frequent starting and stopping of vehicles, further exacerbating environmental pollution. This article focuses on the problem of frequent starting and stopping of vehicles, using variable speed limit control to smooth traffic flow, reduce vehicle speed, and alleviate exhaust emissions caused by traffic congestion. At the same time, considering the traffic and environmental benefits of bottleneck areas on freeways, the VT-Micro model is used to calculate exhaust emissions, and a coordinated control method for the mainline and ramp of freeways is proposed. The simulation experiment results show that the total driving time of the mainline and ramp collaborative control method considering environmental benefits has been reduced by 24.69%, CO emissions have been reduced by 4.79%, HC emissions have been reduced by 7.65%, NOx emissions have been reduced by 2.48%, and fuel consumption has been reduced by 4.98%.

1. Introduction

The continuous growth of car ownership has led to an increasingly prominent traffic problem on freeways, resulting in frequent traffic accidents and long-term congestion. It is well known that congestion reduces the capacity of freeways, increases travel time for drivers, decreases traffic safety, and exacerbates environmental pollution [1,2,3]. Merge areas between mainlines and ramps are frequently congested. Therefore, traffic control is necessary for the merge areas on freeways.
One of the significant causes for road congestion is the traffic volume at the intersection of mainlines and ramps exceeding the road capacity. Coordinated control of traffic flow between mainlines and ramps is an effective choice for managing the traffic on freeways. Variable Speed Limit (VSL) systems have been introduced as an advanced traffic management method in freeway systems. The VSL system delays or prevents traffic breakdown by slowing down the flow that would otherwise enter bottleneck locations on the mainline [4,5]. Metering at ramps restricts the number of vehicles entering the freeway from on-ramp, reducing the traffic flow in merge areas. By coordinating the variable speed limits on the mainline and ramp controls, the traffic flow in merge areas can be mitigated, preventing congestion caused by excessive traffic flow exceeding the capacity of the merge area roads.
The VSL can reduce the likelihood of traffic congestion by balancing the vehicle speeds on the mainline. The principle is to limit the inflow and optimize the traffic flow by timely adjusting the values of VSL, avoiding stop-and-go traffic waves [6,7,8,9]. The VSL control can adjust the traffic conditions based on real-time traffic information, including traffic speed, flow, etc., especially for dynamic situations such as emergencies or adverse conditions. By dynamically adjusting the appropriate speed based on current conditions, VSL control offers advantages in terms of both traffic efficiency and environmental benefits [10,11].
Ramp metering is one of the most effective methods to alleviate traffic congestion in merge areas. Ramp control aims to control the traffic flow by controlling the number of vehicles entering from the ramps. The classical algorithm for ramp metering, such as the ALINEA algorithm [12,13], uses feedback control loops. This algorithm mitigates traffic congestion by controlling the downstream mainline occupancy, ensuring the maximum downstream mainline capacity at the ramps. Several extensions of ALINEA have been developed to improve performance, including AD-ALINEA and UP-ALINEA [14]. Jacobson et al. [15] proposed a bottleneck algorithm that uses control rates to coordinate the bottleneck area and all upstream ramps, reducing the number of vehicles entering the bottleneck area. Scholars have studied various ramp control methods and achieved satisfactory control effects on road traffic [16,17].
In recent years, many scholars have coordinated the use of VSL and Ramp Metering (RM) control [18,19,20,21]. Lu et al. developed and analyzed VSL control using the METNET model to complement ramp metering at bottlenecks on highways [22]. Both strategies individually showed improvements in overall travel time, but the greatest improvement came from combining the two approaches. Su et al. introduced a traffic control algorithm that combines VSL and ramp metering to enhance flow while reducing delays [23]. The results showed significant improvements in traffic performance. Carlson et al. argued that VSL serves as a supplement to ramp metering. Experimental studies have shown that VSL and ramp metering are individually effective in alleviating traffic bottleneck congestion [24] but combining them can yield even greater benefits. Ma et al. use a macroscopic micro emission model, using variable speed limits to coordinate and improve traffic efficiency and reduce exhaust emissions [25].
However, some of the ramps are designed to connect to toll plazas on freeways. In such cases, the conventional ramp control methods do not take this into consideration, leading to secondary queueing of vehicles and affecting the safety and travel experience, resulting in a waste of public infrastructure resources and impacting the vehicles entering the ramps. Many studies have focused on the maximum capacity of toll plazas as their objective [26,27]. Zou et al. considered the road capacity of toll plazas, and Liu modeled the toll plaza based on the characteristics of ETC lanes [28,29]. Yuan et al. proposed adjusting the ramp flow by changing the number and configuration of toll plaza lanes, supplementing VSL with RM control to effectively alleviate road congestion [30]. However, toll plazas are only one strategy for adjusting ramp flow and do not fully reflect the fundamental features of ramp control, including adjusting the release rate of ramps according to different demands.
In conclusion, this paper proposes a collaborative control strategy based on toll plaza for mainline ramp control. This strategy takes into account both traffic efficiency and environmental benefits, fully utilizing public facilities and avoiding negative impacts such as secondary queueing caused by control strategies. With the widespread implementation of ETC toll collection, scholars are focusing on toll plazas as important components of transportation hubs, which will also undertake additional tasks.
The remainder of this study is organized as follows. In Section 2, the VSL and CA models are introduced, the macroscopic traffic flow model is extended by VSL control, and it is integrated with the microscopic emission model. A VSL–ramp coordinated control strategy is designed in Section 3. In Section 4, a comparison with different control strategy measurements is made to demonstrate the validity of the results. Finally, conclusions are given in Section 5.

2. Traffic Flow Evolution Model

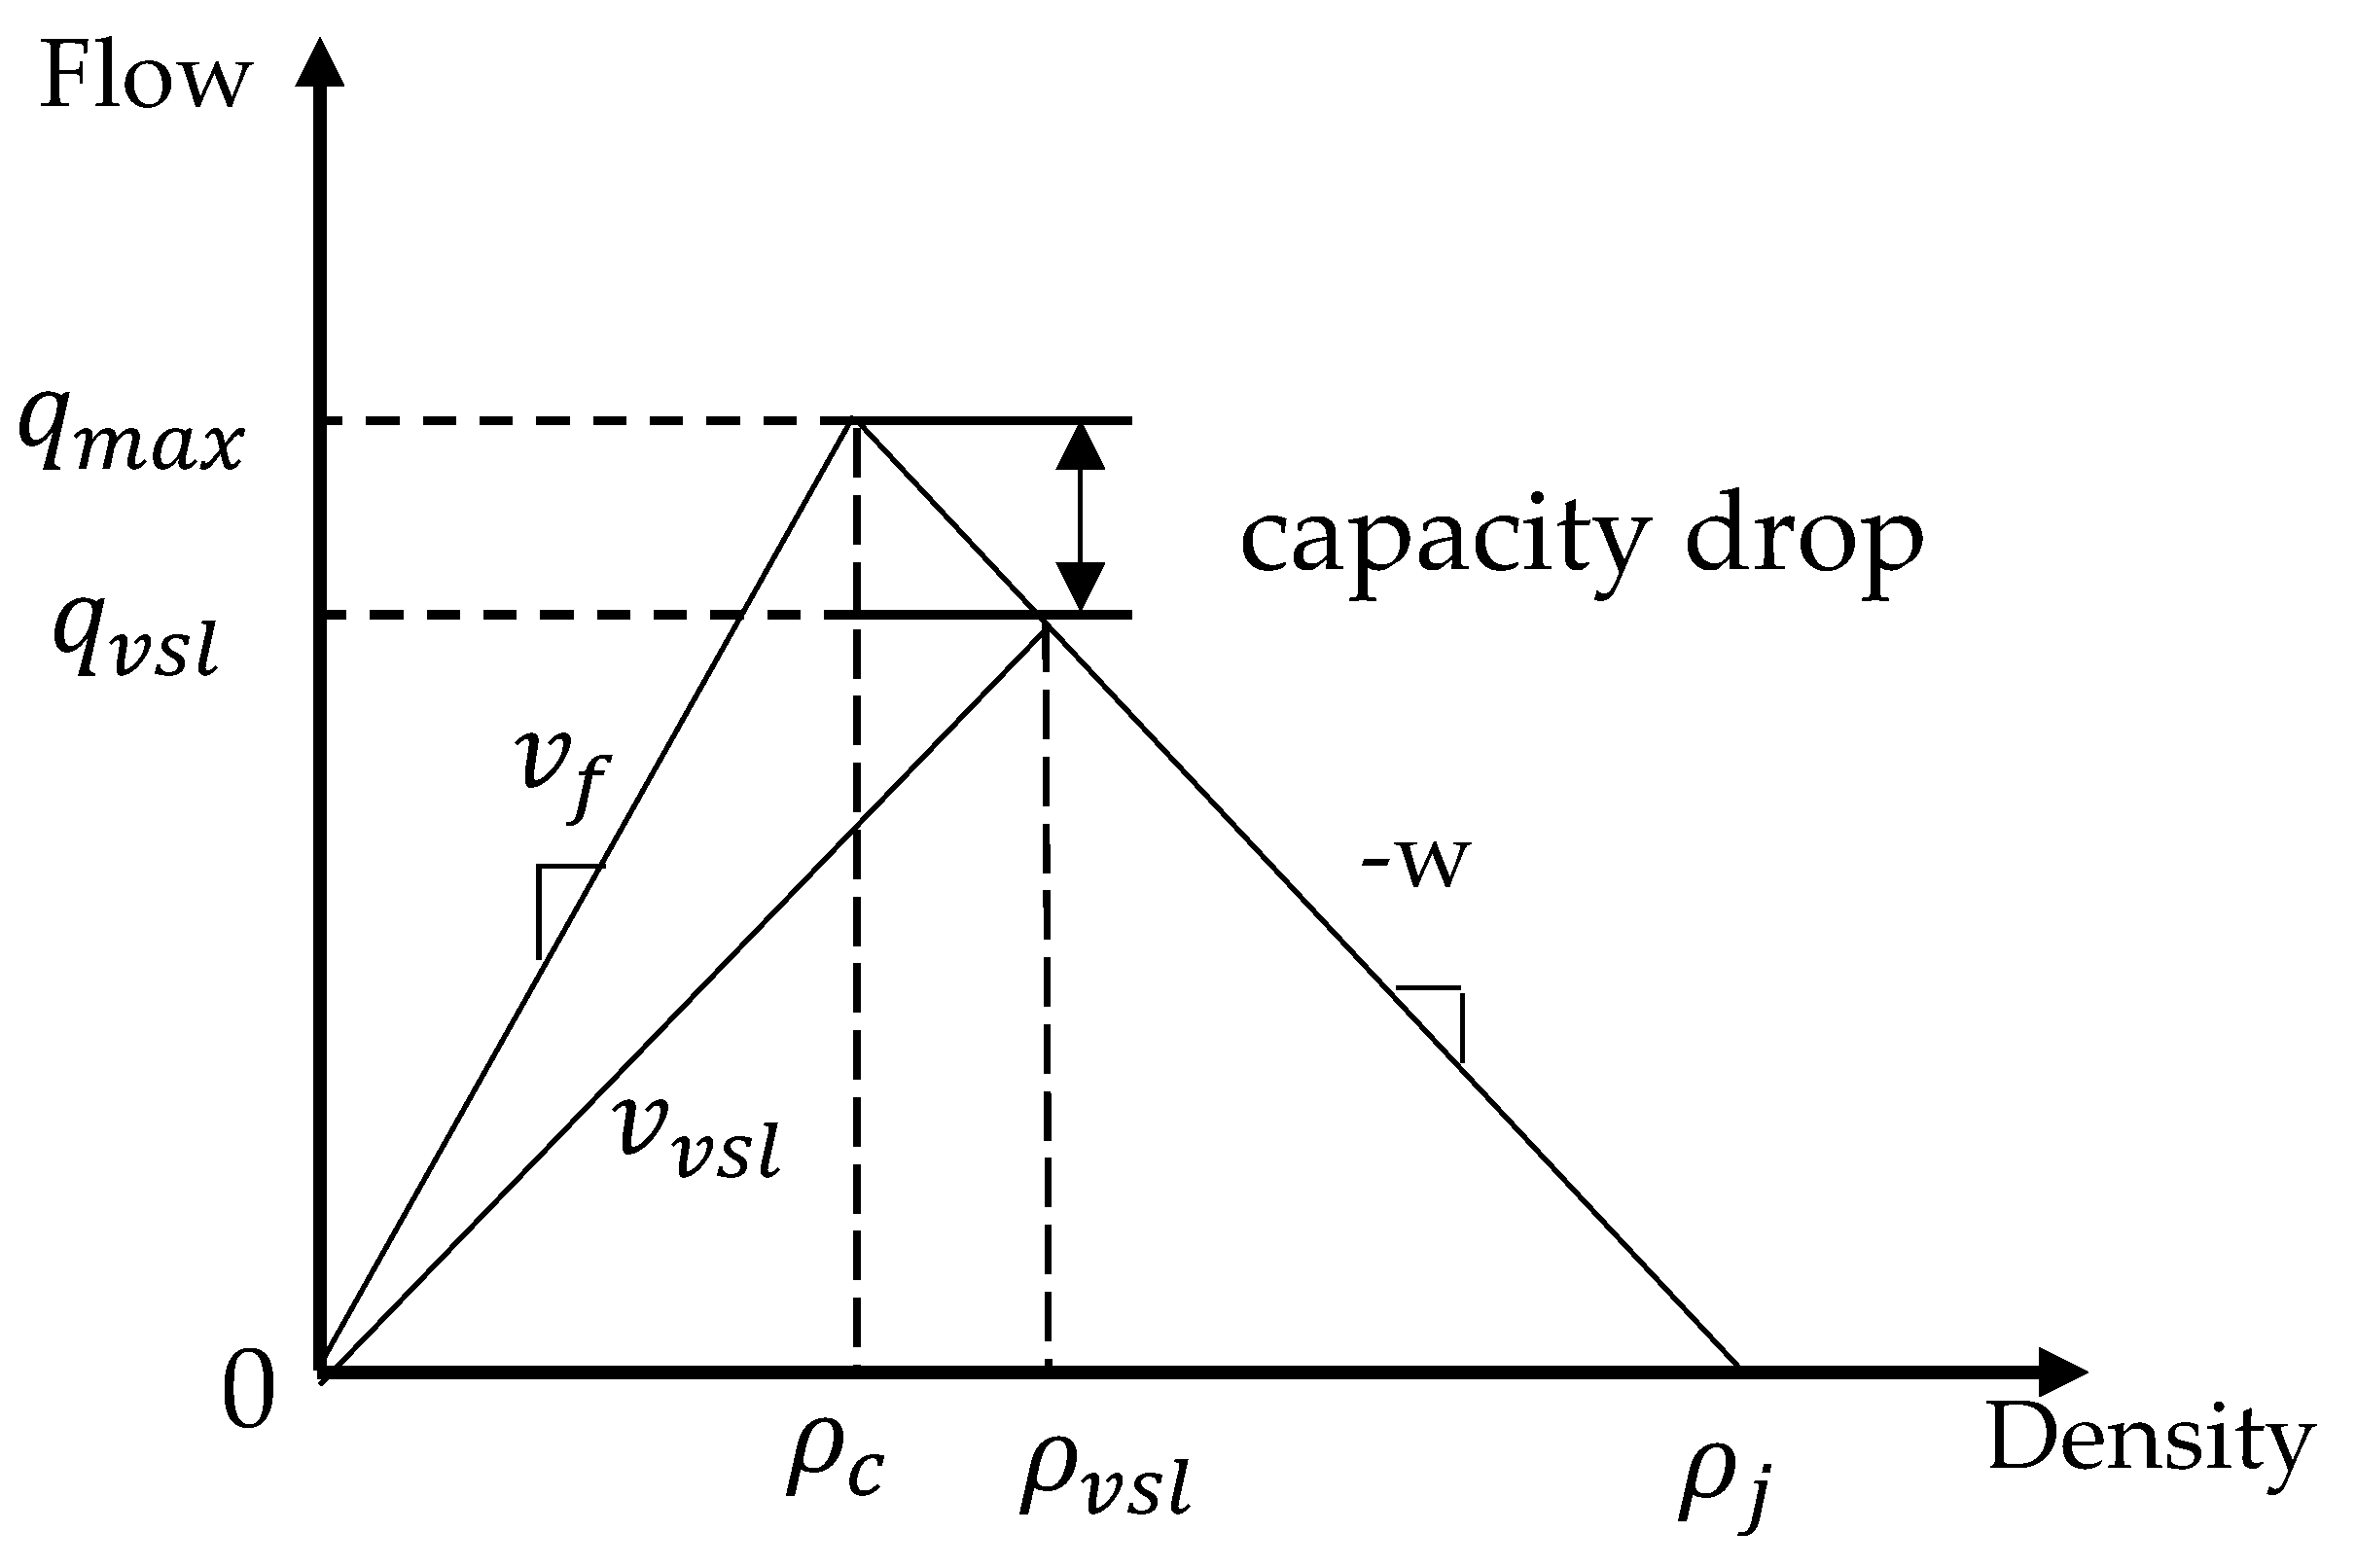
2.1. VSL-Based CTM Model

In macroscopic simulation models, the Cell Transmission Model (CTM) is the most commonly used modeling approach in variable speed limit control. The CTM model divides the mainline segments of the freeway into N cells and determines the evolution of traffic flow states within each cell based on the fundamental relationship between density and flow. The density equation is updated as follows:
ρ n k = ρ n k 1 + T N L n [ f n 1 k 1 f n ( k 1 ) ]
where ρ n k represents the density of cell n at time step k, T is the duration of the discrete time step, L n represents the length of cell n, and f n 1 k 1 represents the traffic flow from cell n - 1 to cell n at time step k − 1. The sending and receiving capacities are important characteristics of the CTM model, and it can be divided into two types based on the presence or absence of on-ramps.
The sending and receiving capacities of cells:
R n ( k ) = m i n ρ n k v f N , q max N
S n ( k ) = m i n w ρ j ρ n k N , q m a x N
f n k = min R n ( k ) , S n k
where R n ( k ) represents the sending capacity at time step k, S n ( k ) represents the receiving capacity at time step k, v f is the free-flow velocity, q max is the maximum capacity of the road, w is the shock wave speed in congested traffic, ρ j represents jam density, and ρ c represents the critical density.
The sending and receiving capacity of cells when on-ramps are present:
f n k = R n k f D k = R D k i f R n k + R D k S n + 1 k
f n ( k ) = m i d R n ( k ) , S n + 1 ( k ) R D ( k ) , γ S n + 1 ( k ) f D ( k ) = m i d R D ( k ) , S n + 1 ( k ) R n ( k ) , ( 1 γ ) S n + 1 ( k )         i f R n k + R D k S n + 1 k
The presence of interconnected cells involving on-ramp D, particularly in the merging zone where the upstream previous cell n merges with the ramp, leads to alterations in flow relationships. Here, γ represents the ratio of the flow sent from cell n to the flow received by cell n + 1.
The Figure 1 demonstrates the fundamental diagram of traffic flow under VSL control, indicating that the relationship between the sending and receiving capacity of cells is altered under VSL control:
R n ( k ) = min v f , v v s l k ρ n k N S n ( k ) = min w ρ j ρ n k N , q v s l N v n = min v f , v v s l k         i f   ρ n k ρ vsl k
R n ( k ) = min min v f , v v s l k ρ n k N min q v s l , q max N S n ( k ) = min w ρ j ρ n k N min q v s l , q max N v n = w ρ j ρ n k + 1 ρ n k + 1         i f   ρ n k ρ vsl k
where v v s l k , ρ vsl ( k ) and q v s l represent the velocity, density, and flow of the cells with limited speed.

2.2. CA Model

Cellular automaton (CA) is a discrete model of grid dynamics that considers time, space, and state as discrete entities, with local spatial interactions and causal relationships over time. It has the capability to simulate the spatio-temporal evolution processes of complex systems. In this paper, we adopt the NaSch model. In the NaSch model, the time step progresses from t to t + 1 according to the following stages:
(1)
Accelerate:
v i t + 1 = m i n { v i t + a , v max }
(2)
Deterministic deceleration:
v i t + 1 = min d i t + 1 , v i t
(3)
Random deceleration:
v i t + 1 = max v i t 1 , 0 , r a n d ( ) < p i ( t )
(4)
Vehicle motion:
x i t + 1 = x i t + v i t + 1
(5)
Distance between front and rear vehicles:
d i t + 1 = x i t + 1 x i t l v e h x g a p
where v i t is the velocity of vehicle i at time t, v max is the maximum velocity of the vehicle, x i t is the position of vehicle i at time t, d i t represents the distance between vehicles, x g a p is the safe distance without collision between preceding and following vehicles, l v e h is the length of the vehicle, a represents the acceleration of the vehicle, p i ( t ) is the probability of random deceleration for the vehicle.
When queues exist at toll plazas, the principle of vehicle fairness is adopted, and drivers autonomously choose the shorter queues based on the length of the queues. The lane selection rule for vehicles entering toll plazas is as follows:
L y = min L n u m 1 , L n u m 2 , L n u m 3
The L y represents the lane that a vehicle enters at the toll plaza, and L n u m 1 represents the number of queued vehicles on lane i (i ∊ 1, 2, 3) at the current moment at the toll plaza.

2.3. VT-Micro Model

The VT-micro model is a micro-scale model calculator that calculates emissions and fuel consumption of individual vehicles based on second-by-second velocity and acceleration. The model has the following form:
J k = e v T   k P a k
where J(k) represents the estimated emissions of CO, NO, HC, and fuel consumption of vehicles at time step k, v T ( k ) is the velocity vector at time step k, v T ( k ) = [ 1 , v k , v 2   k , v 3   k ] , a k represents the acceleration vector at time step k, where a k = [ 1 , a k , a 2 k , a 3 k ] , P represents the model parameter matrix for emissions or fuel consumption.
P C O = 0.01 1292.81 48.8324 32.8837 4.7675 23.2920 4.1656 3.2843 0 0.8503 0.3291 0.5700 0.0532 0.0163 0.0082 0.0118 0
P H C = 0.01 1454.4 0 25.1563 0.3284 8.1857 10.9200 1.9423 1.2745 0.2260 0.3531 0.4356 0.1258 0.0039 0.0072 0.0080 0.0021
P N O X = 0.01 1488.32 83.4524 9.5433 03.3549 15.2306 16.6647 10.1565 3.7076 0.1830 0.4591 0.6836 0.0737 0.0020 0.0038 0.0080 0.0021
P F C = 0.01 753.7 44.3809 17.1641 4.2024 9.7326 5.1753 0.2942 0.7068 3.014 0.0742 0.0109 0.0116 0.0053 0.0006 0.0010 0.0006
The VT-micro model requires velocity and acceleration. Since the CTM is discrete in both space and time, the model involves two components of acceleration. The first component is the “temporal” acceleration of vehicles flowing within a given road segment. The second component is the “spatial” acceleration of vehicles transitioning from one road segment to another within a simulated time step.
a t k = v i k + 1 v i k T
a s k = v i k + 1 v i 1 k T
where a t k is the temporal acceleration, which refers to the acceleration of vehicles from one time step to the next within a particular cell. The total number of vehicles is L i N ρ n k T f n ( k ) , where v i k is the average velocity. On the other hand, a s k represents the spatial acceleration, which denotes the acceleration of vehicles moving from cell n − 1 to cell n. The total number of vehicles in this case is T f n ( k ) , and v i 1 k represents the average velocity.
To connect the micro-level VT Micro model with the macro-level CTM model, the key is to multiply the individual results calculated by VT Micro with the corresponding total number of vehicles calculated by CTM. In summary, a new macro-level emissions and fuel consumption model can be characterized as follows:
J n , i k = L i N ρ n k T f n k e v i T   k P a k + T f n 1 k e v i 1 T   k P a k
where J n , i k represents the total emissions or fuel consumption of all vehicles in a partial region.

3. Control Strategy

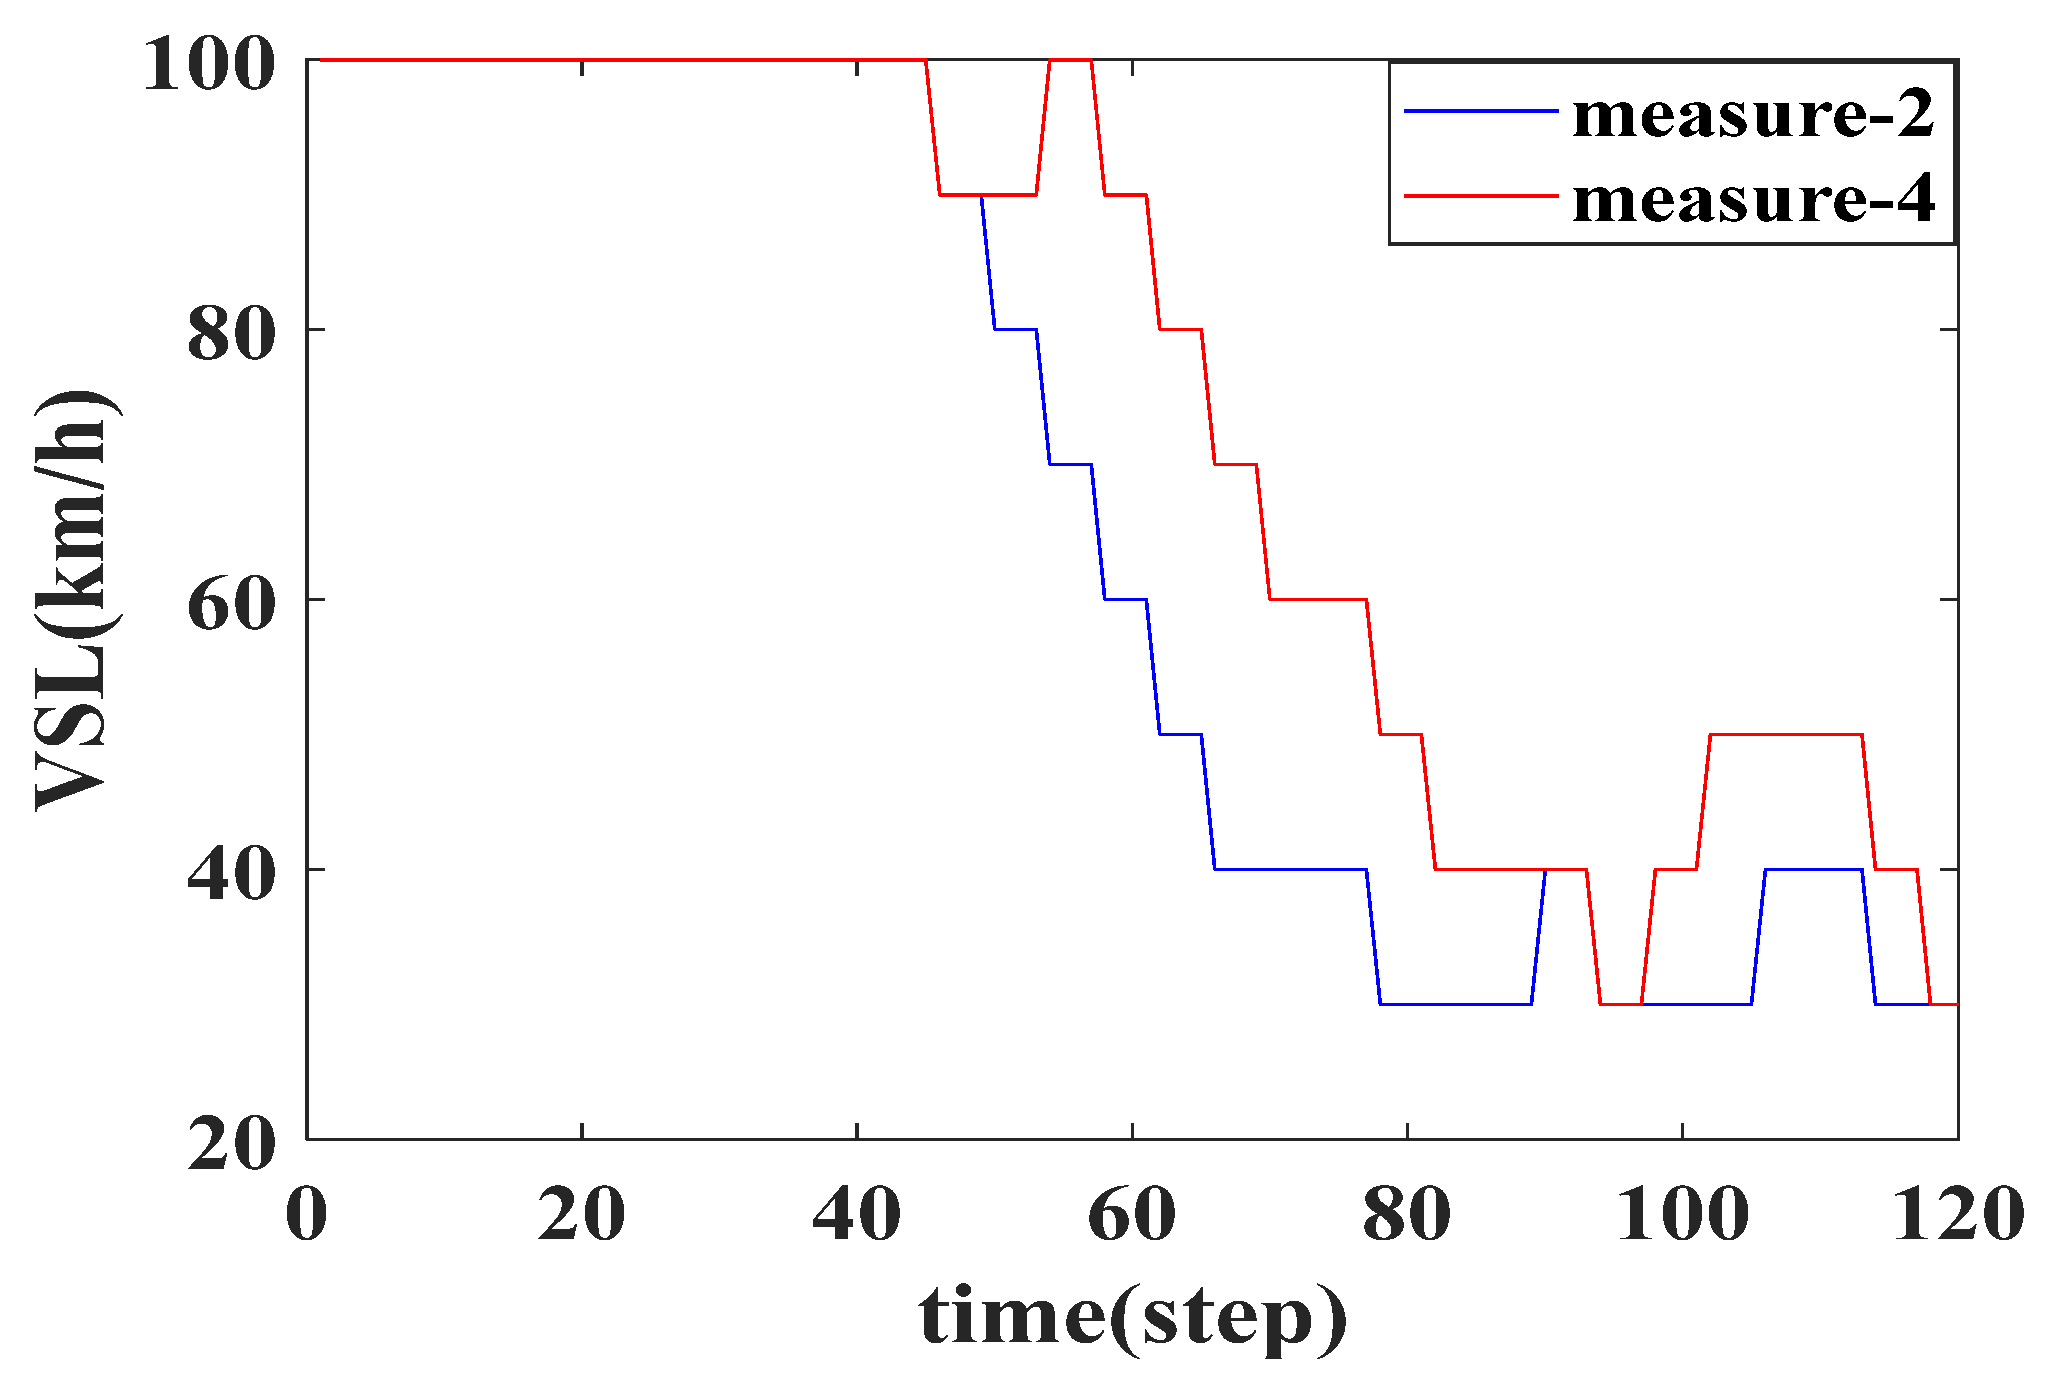
3.1. VSL Control Strategy Design

This study adopts the VSL optimization algorithm, which takes into account individual speed limits and constraints. The optimal value of the speed limit for each speed limit cycle corresponds to the minimum value of the objective function. The optimal speed value V(k − 1) can be obtained from the previous control cycle, k − 1. Considering driver acceptance and traffic safety, the speed difference between adjacent speed limit cycles is set as ΔV. Therefore, the speed limit value for the current cycle K can be VC(K) = [VC(K) − ΔV, VC(K), VC(K) + ΔV]. Subsequently, the effectiveness of the control, represented as JS, varies with the speed limit value, and the best speed limit value VC(K) is selected based on optimal performance. By minimizing the objective function, appropriate speed limits are chosen.
J S 1 , 2 , 3 = F V C ( K ) Δ V V C ( K ) V C ( K ) + Δ V
J T = min J S ( 1 ) , J S ( 2 ) , J S ( 3 )
where J S is the range of selectable variable speed limit values for each cycle, J T represents the minimum value of the objective function.

3.2. Ramp Control Strategy Design

The toll plaza lanes are divided into electronic toll collection (ETC), manual toll collection (MTC), and ETC/MTC mixed lanes. Each lane has a different capacity, and the release rate of the ramps is controlled by adjusting the lane configuration. Although the lane configuration can regulate the ramp release rate, it is not an exact control. It adapts to different ramp release requirements by providing different ramp flow rates based on different configurations. By changing the vehicle’s dwell time at the toll plaza, the ramp release rate can be more accurately controlled. Regarding the vehicle’s dwell time at the toll plaza, without any control, a constant dwell time is assigned for ETC and MTC vehicles separately. Considering driver emotions and ramp queuing issues, let x = T E C n 1   T E P n 1 ∊ (0, 5), where T E C n 1 is the dwell time of vehicle n1 at the toll plaza, T E P n 1 is the constant dwell time for vehicle n1 at the toll plaza, and x represents the dynamic dwell time.
The ramp is designed with three lanes. Each lane can be configured in three ways: ETC lane, MTC lane, and ETC/MTC mixed lane. We use an exhaustive search method to list all possible lane configurations and present different lane configurations. Additionally, we consider six different strategies for the dynamic parking time at toll plazas, ranging from 0 to 5 s, and predict the ramp release rate generated by each strategy. The expression for predicting the ramp release rate is as follows:
Q q ,     x ( k ) = u = 1 m n u m u + I u
where Q q ,     x ( k ) represents the predicted flow under a time step of k with a dwell time of x, m is the number of lanes, num(u) denotes the number of vehicles present from toll plaza to on-ramp on lane u, and I(u) represents the number of vehicles before the toll plaza on lane u.
In this study, the time step is 30 s, based on the CA model, assuming vehicles travel at the maximum speed after passing the toll plaza. The prediction representation of I(u) is as follows:
I u = 0 i f c ( a ) = M T C   o r   0 b 1                 i f c ( b ) = M T C 8 i f b > 8
where c ( a ) represents the type of vehicles at the toll plaza, c ( a ) = 0 indicates that there are no vehicles, and c ( b ) represents the type of vehicles counted forward from the toll plaza, specifically the closest MTC vehicle, and b should not exceed 8.
The basic control principle of the ALINEA algorithm is to dynamically adjust the number of vehicles merging from the current ramp to the mainline based on the relationship between the actual occupancy rate and the desired occupancy rate, using the occupancy parameters collected by downstream detectors in the mainline. This is done to maintain good traffic conditions downstream of the merge area. The specific control algorithm is as follows:
R C k + 1 = R C k + K ( I ( t ) I ( t ) )
where R C k represents the ramp release rate at time step k, I(t) represents the optimal downstream occupancy rate of the mainline at time k, I’(t) represents the actual downstream occupancy rate of the mainline at time k, and I(t) = 0.8 ρ c , where the adjustment coefficient K = 16.
Based on the ALINEA algorithm, the next cycle’s optimal release rate is compared with Q q ,   x (k), and the dynamic dwelling time corresponding to the minimum difference in ramp release rate between the two strategies is selected as the dynamic control time for the next cycle.

3.3. Collaborative Control Strategy

When the traffic volume on the mainline and ramp is high, using a single VSL control or ramp control alone does not effectively alleviate traffic congestion. Ramp control can adjust the ramp flow based on the mainline traffic conditions, but if the mainline flow is too high and there is insufficient space for ramp flow to enter, the ramp control will be ineffective or even fail. VSL control delays the arrival of vehicles in the merging area, allowing ramp vehicles to enter, but its control effect in congested areas is limited. However, when VSL control and ramp control are coordinated, they can effectively ease traffic congestion. VSL control provides space for ramp vehicles to enter, while ramp control adjusts the ramp flow based on the mainline conditions. By combining variable speed limits on the upstream road of the mainline, further congestion relief can be achieved, making traffic flow smoothly and reducing significant fluctuations in vehicle speed, thereby improving traffic safety. As mentioned above, in order to optimize the traffic conditions on the mainline and ramp and coordinate their control, the objective function reflects the operating status of the freeway traffic.
The coordinated control starts with implementing the variable speed limit strategy, selecting appropriate speed limit values based on the objective function, and reducing the flow of vehicles towards the merging area on the mainline. At the same time, the ramp toll plaza begins dynamic control and selects the optimal dynamic control time for the next cycle. For each control step, there are three possibilities for the speed limit values in the VSL control. In the ramp part, in the case of a three-lane ramp with three possible lane configurations, the first step is to list 25 lane allocation schemes for the toll plaza (excluding the case of three lanes being consistent). From there, six dynamic dwelling times were selected within the range of 0–5 s for control. Subsequently, 150 schemes were enumerated to calculate the actual ramp release rate and find the control scheme that minimizes the deviation between the actual and optimal release rates. Based on this model, control schemes with the optimal objective function were computed.

3.4. Optimization Objective Function

In this study, the objective function of the controller must reflect the congestion situation and environmental benefits of freeways.
J T T T = T k = 1 K T n = 1 N n N L n ρ n k + T k = 1 K W ( k )
J n k = k = 1 K T L i N ρ n k T f n k e v T   k P a k + T f n k e v T   k P a k
J = α J T T T + β J n k
where W(k) represents the travel time of vehicles within the ramp at each time step, J T T T is the total travel time of vehicles, J n k represents emissions, J is the overall objective function, and α and β are dimension balancing coefficients that balance the influence of each model on the objective function.
The coordinated control objective function has the following constraints during the optimization process:
| V v s l k + 1 V v s l k | V g a p v m i n V v s l v m a x 0   T M C T M P   5 0   T E C T E P   5
The v m i n and v m a x respectively represent the minimum and maximum speed limits that can be used for Variable Speed Limit (VSL) control. To ensure safety and prevent excessive speed changes within the speed limit zone, it is important to limit the rate of speed change for vehicles at any given time, denoted as V g a p , set at 10 km/h. Additionally, taking into account drivers’ emotions and traffic conditions, the dynamic time change for ETC (Electronic Toll Collection) vehicles and MTC (Manual Toll Collection) vehicles should be within the range of 0–5 s.

4. Simulation

4.1. Experimental Plan

To validate the effectiveness of ramp control and coordinated control with variable speed limits, this study conducted tests on four control strategies using high, medium, and low traffic flow rates: no control (Measurement-1), VSL control (Measurement-2), ramp control (Measurement-3), and coordinated control (Measurement-4). The experiments were conducted on a 10 km long main freeway segment and a 680 m long on-ramp section. According to the CTM model, this segment was divided into 12 cells, with each cell approximately 833 m long, accommodating 3 lanes on both the mainline and the ramp. The 9th cell served as the bottleneck cell in the merging area with an on-ramp, while the 8th cell acted as a buffer cell. VSL control was applied to the 7th cell.
The following parameters were used in this study: q m a x = 1900 veh/h, w = 18.09 km/h, ρ c = 19 veh/km, N n = 12, T = 120, v f = 100 km/h, t c = 30 s, NC = 4 × T, L n = 0.83 km, φ = 0.1, µ = 0.14, v m a x = 100   km / h , v m i n = 30   km / h , α = 1, and β = 7.
Based on relevant literature survey data and data from the Ministry of Transport of China, this study set the proportion of ETC (Electronic Toll Collection) vehicles to be 66.6%. The traffic flow rate at the on-ramp was set to be 1200 veh/h, following a Poisson distribution. The average dwell time for ETC and MTC (Manual Toll Collection) vehicles at the toll plaza were set to be 2 s and 15 s respectively. The parameter settings for the CA model are as follows: x l = 340 units, 1 unit = 2 m, l v e h = 2 units, v m a x = 4 units/s, x g a p = 1 unit, p = 0.3, T E = 2 s, and T M = 15 s.

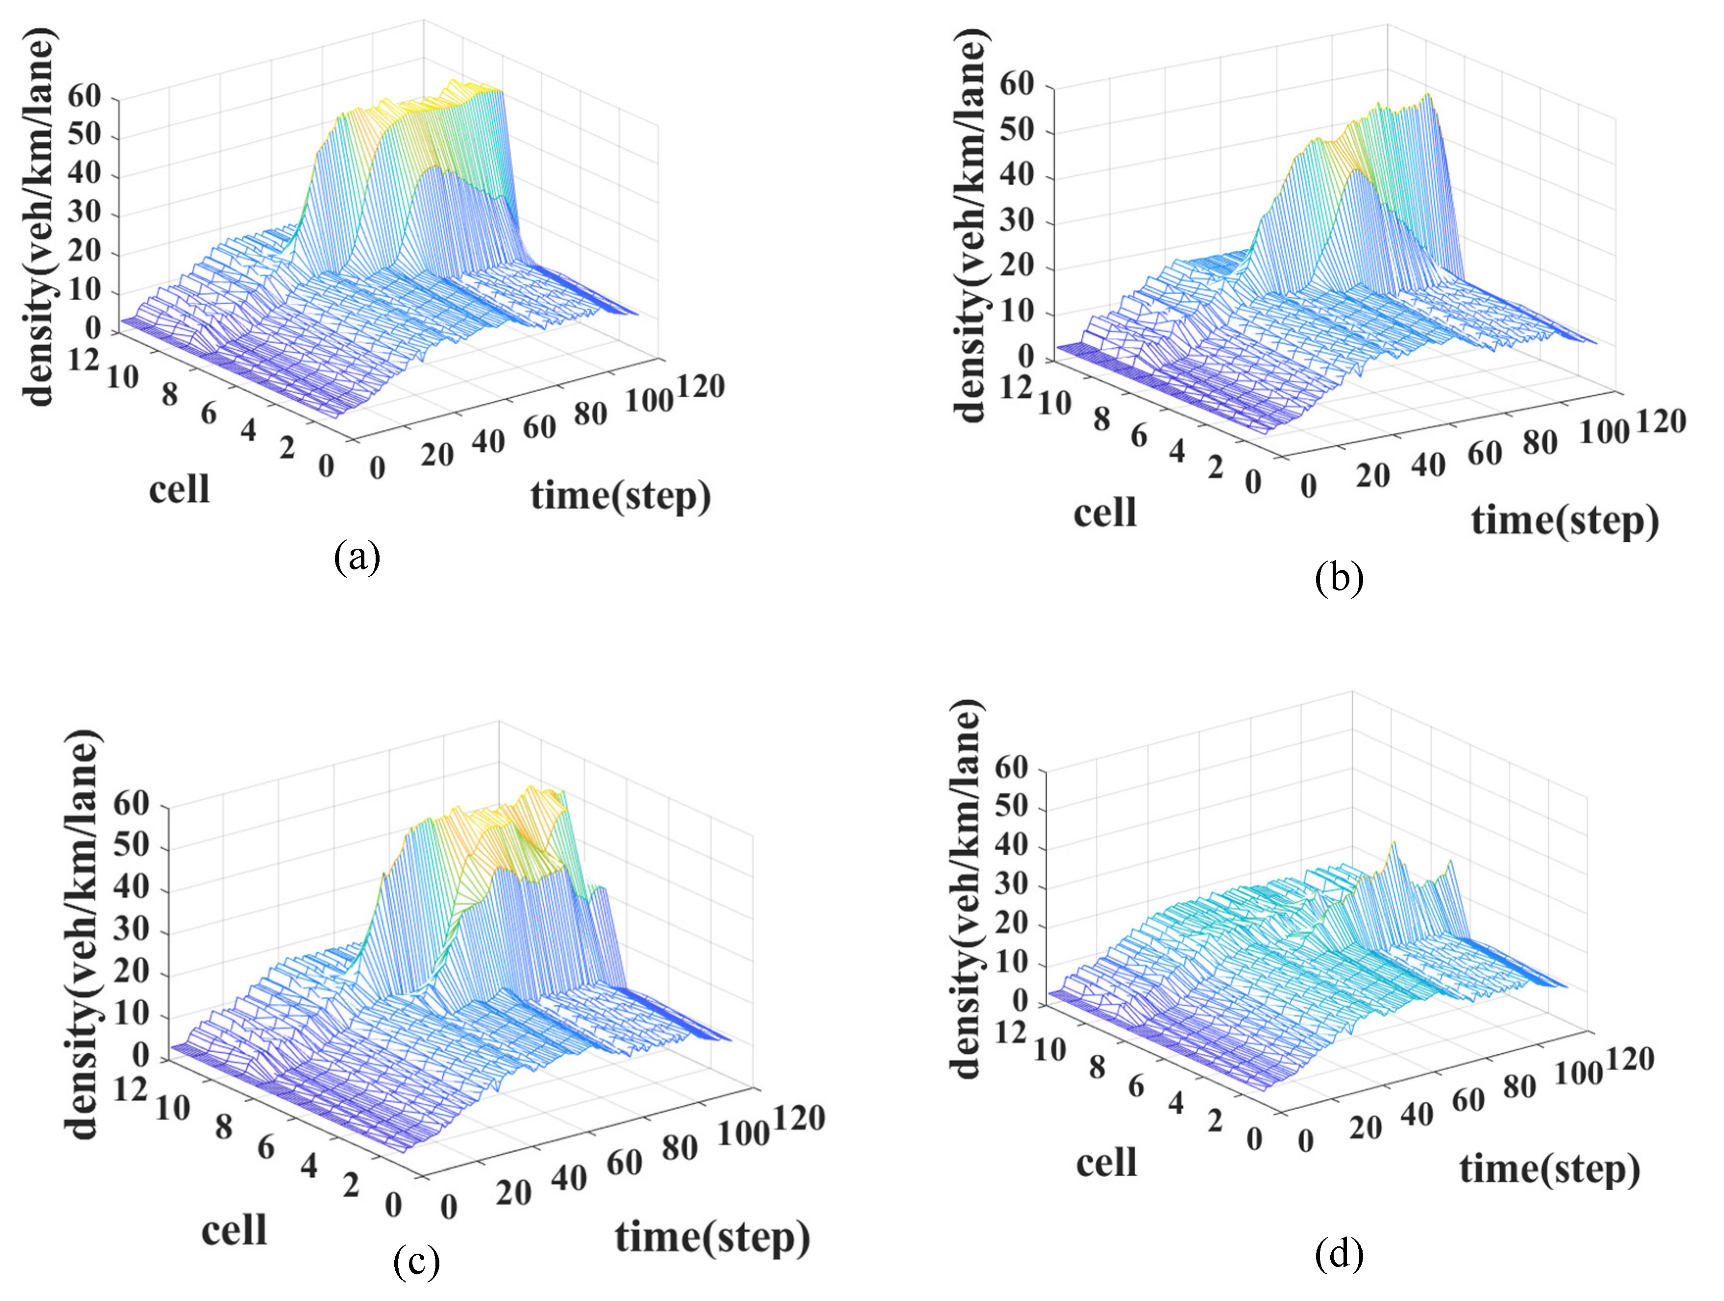
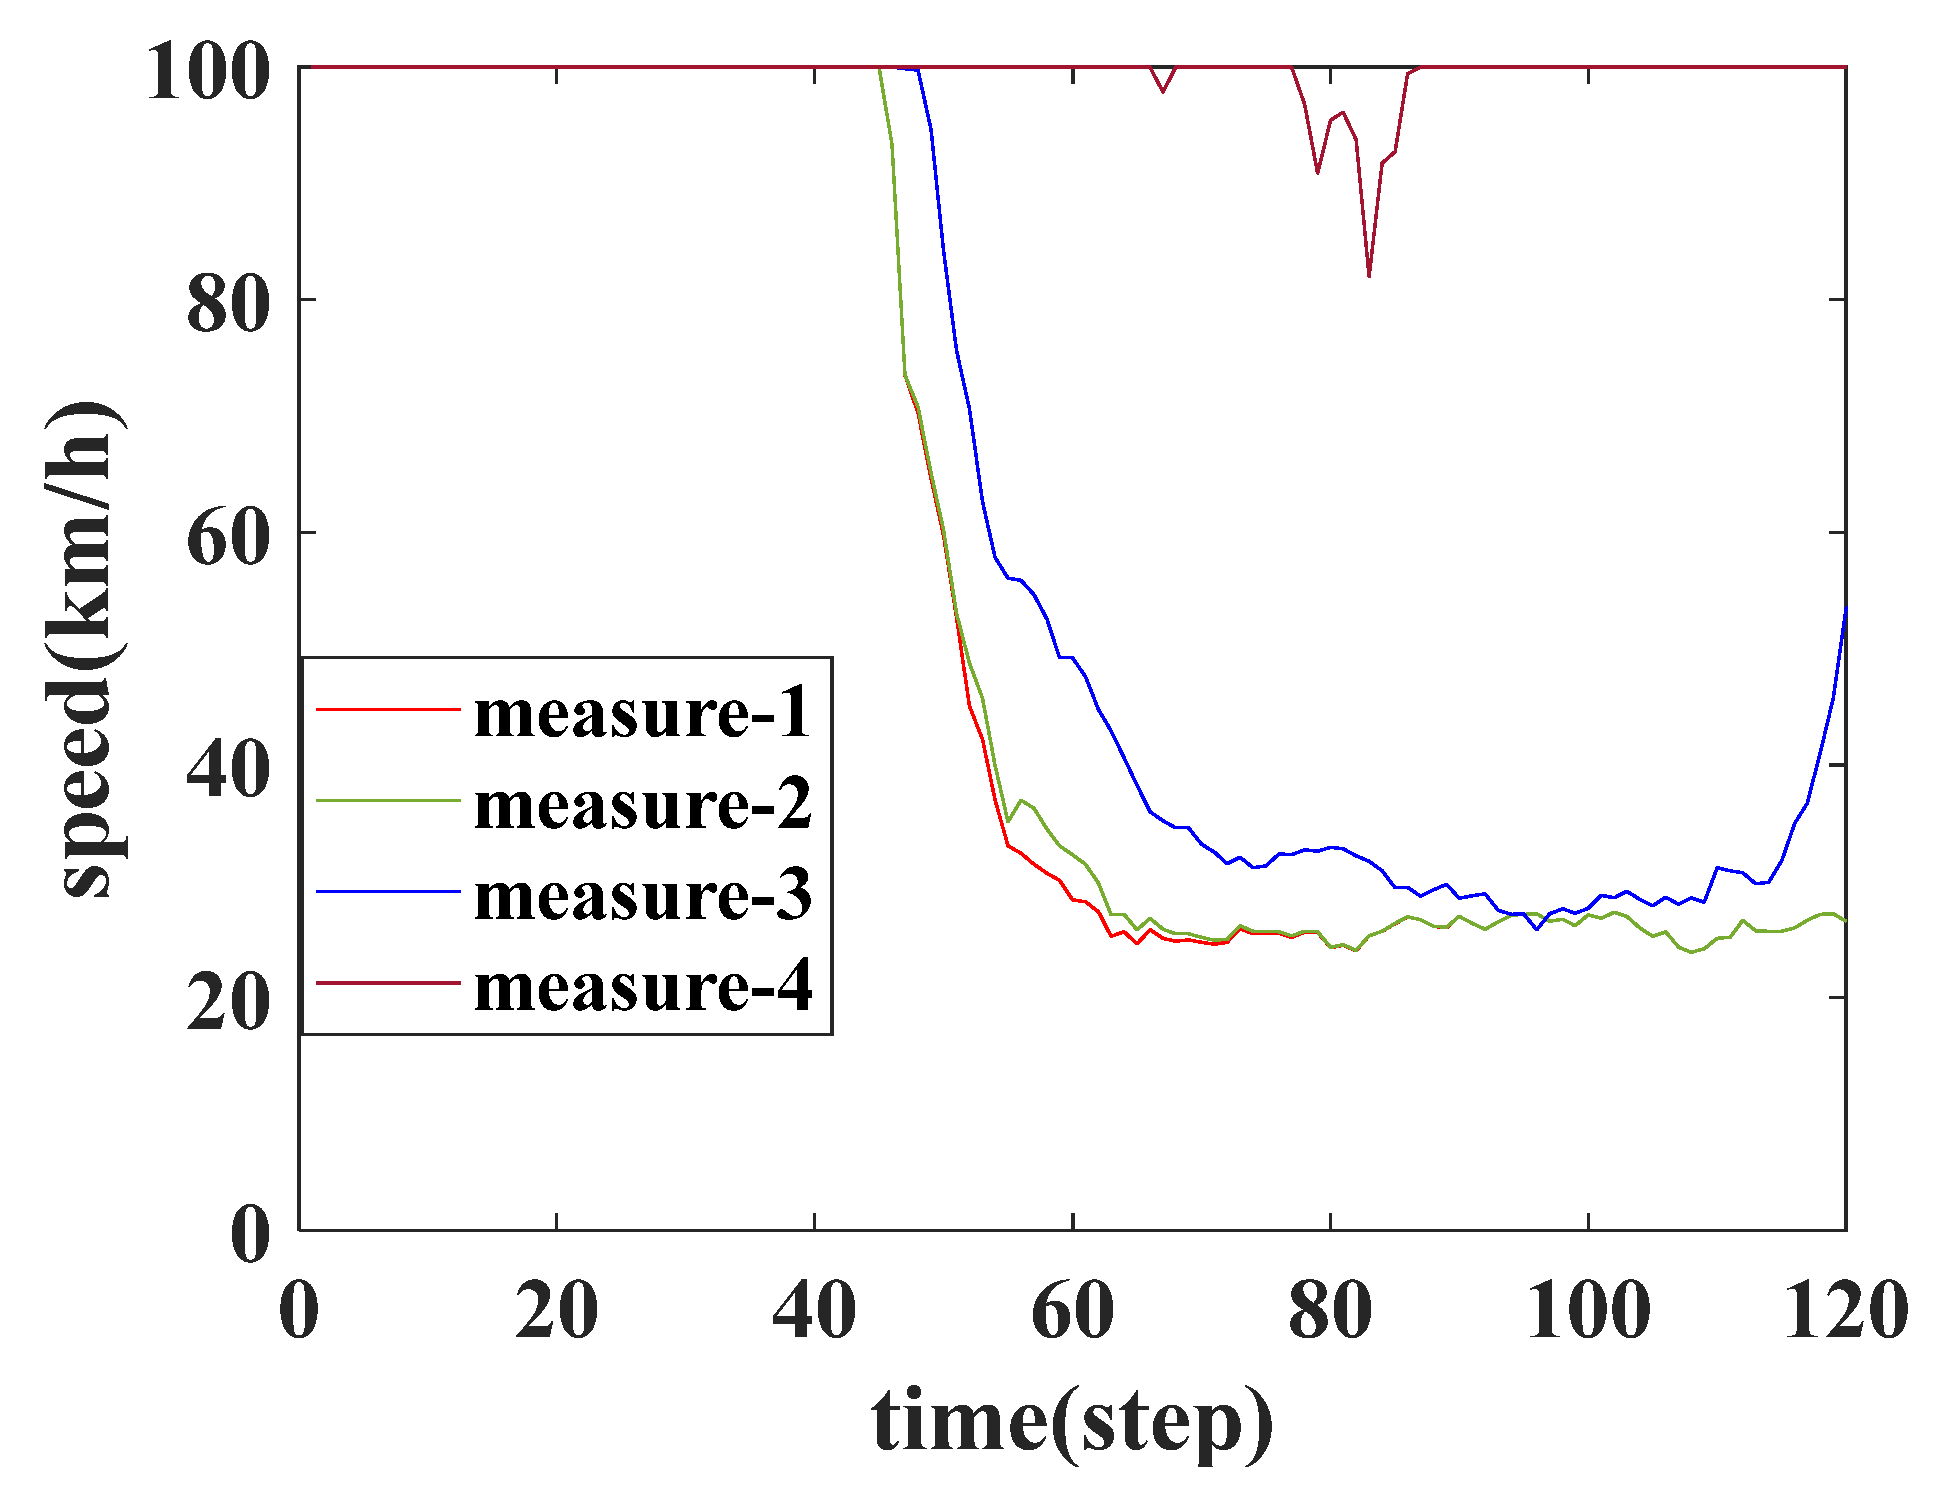
4.2. Result Analysis

The simulation runs for one hour, during which the traffic flow exhibits a peak period and two non-peak periods, with significant fluctuations. Changing mainline and ramp flows to verify the control effectiveness of the control strategy and comparatively analyze the mainline density changes.
Figure 2 illustrates the density plots of a main freeway in three scenarios, namely (a), (b), and (c). When the density reaches a high level, congestion arises in the merging area. By comparing the density patterns under different control strategies within the same scenario, we can observe the control effect of each strategy. Additionally, conducting a vertical comparison allows us to evaluate the effectiveness of these strategies across different scenarios.
The control strategy is examined as an illustration when both the mainline and ramp experience high flow conditions. Figure 2 illustrates the density diagrams of various cells on the mainline throughout the simulation period for four strategies in diverse traffic scenarios. Moving from right to left, the density diagrams correspond to the no control, VSL control, ramp control, and coordinated control strategies: (a) for low flow, (b) for medium flow and (c) for high flow. From Figure 2, it can be observed that when both the mainline and ramp flows are low, Measurement-2 and Measurement-3 effectively manage the traffic flow on the freeway, alleviating congestion. However, as the flow rate increases, a single control strategy gradually loses its effectiveness, resulting in subpar control performance. In contrast, Measurement-4 consistently enhances traffic efficiency and alleviates congestion on the mainline.
Figure 3 presents a comparison of VSL changes. In contrast to Measurement-2, Measurement-4 demonstrates a delayed reduction in speed limits, allowing for speed recovery towards free-flow conditions and ultimately higher speed limits. This can be attributed to the fact that the controller effectively mitigates traffic congestion through ramp control when traffic flow starts to increase. However, as the flow continues to rise and reaches its peak period, the speed limits gradually decrease accordingly.
The Figure 4 illustrates the density diagrams of different cells at various time intervals during the simulation. Moving from right to left, they depict the mainline density diagrams for four strategies: no control, VSL control, ramp control, and coordinated control. As shown in Figure 4a,b shows the main line density diagram. The bottleneck exhibits a higher density distribution. Measurement-1, without any control, is not sufficient to adapt to the changing traffic conditions. Measurement-2, which involves VSL control, can reduce congestion. However, when the ramp flow is high, the impact of this control strategy on the merging area is poor. Measurement-3, in high flow conditions, results in a higher number of vehicles on the mainline, without sufficient space for the ramp vehicles to merge, leading to poor ramp control effectiveness. From Figure 4d, it can be observed that Measurement-4 has a distinct difference in density peak compared to the other strategy. This difference is primarily seen under high flow conditions, where the control effectiveness of a single strategy is poor and exhibits clear deficiencies. Coordinated strategies can effectively combine the advantages of both controls and better regulate traffic flow. This indicates that coordinated control strategies are beneficial for alleviating freeway congestion.
The speed curves depicted in Figure 5 illustrate the speeds in the bottleneck area under different control strategies. It can be observed that under high flow conditions, the effectiveness of Measurement-2 diminishes significantly. Measurement-3 exhibits limited control effectiveness due to insufficient space on the mainline for the merging of ramp vehicles. Conversely, Measurement-4 demonstrates a slight decline in speed in the peak area of the mainline during high flow conditions, and the traffic situation gradually becomes congested in the bottleneck area. However, the speed quickly recovers to free-flow speed. Consequently, in Measurement-4, the bottleneck speed only slows down during traffic peaks, and the duration of congestion is shorter compared to other control strategies, effectively enhancing traffic efficiency.
When the traffic flow is high flow, the obviousness of the effect of cooperative strategy control, but the impact of ramp control cannot be ignored. The vehicle trajectory at the ramp is analyzed to verify its queuing under the control strategy, Table 1 shows the lane configuration of the toll station.
Figure 6a–c depicts the spatio-temporal trajectories of the three ramps under Measurement-4, while Figure 6d represents the difference between the actual ramp flow and the optimal ramp flow for Measurement-3 and Measurement-4. In Figure 6, it is observed that there are vehicles queuing at the ramps, but long queues do not form, indicating that the ramp control strategy does not trade space for time. Figure 6d shows that the single TB-RM (Tollbooth ramp) control strategy, during high flow conditions, does not allow enough space on the mainline for the ramp vehicles to enter, resulting in a larger difference between the optimal and actual ramp flows and leading to poor control effectiveness.
From the results presented in Table 2, it is evident that Measurement-4 achieves the most significant reduction in total travel time, with a decrease of 24.69% observed under high flow conditions. On the other hand, Measurement-2 and Measurement-3 exhibit lower levels of improvement and not effective in complex traffic scenarios. Regarding environmental benefits, both Measurement-2 and Measurement-3 demonstrate some enhancements when compared to Measurement-1. However, Measurement-4 outperforms them by reducing CO emissions by 4.79%, HC emissions by 7.65%, NOx emissions by 2.48%, and decreasing fuel consumption by 4.98%. To summarize, the coordinated control strategy exhibits distinct advantages in terms of enhancing traffic efficiency and reducing emissions.

5. Conclusions

To enhance the traffic efficiency and environmental benefits of freeways, a coordinated strategy that combines Variable Speed Limit (VSL) systems and Toll Booth Ramp Metering (TB-RM) has been proposed. Comparative analysis of mainline densities under four different control strategies, implemented at varying traffic flow levels, reveals that these strategies strike a balance between environmental efficiency and traffic efficiency by employing appropriate thresholds. The evaluation of these control strategies in alleviating traffic congestion demonstrates the effectiveness of the proposed strategy in mitigating congestion waves on freeways, improving environmental benefits, and outperforming the no-control strategy, VSL strategy, and ramp control strategy. It is worth noting that in scenarios with lower traffic flow, all control strategies effectively reduce traffic congestion and enhance traffic efficiency. However, for high traffic flow scenarios, relying on a single control strategy is inadequate to handle the complexity of traffic conditions.
This paper proposes toll booth control as a solution to alleviate traffic congestion and enhance travel efficiency in bottleneck sections of freeways. In the context of a complex and dynamic road traffic system, toll booths, as essential infrastructure on freeways, can play a pivotal role. For instance, they can leverage reinforcement learning techniques to improve toll booth control capabilities. Toll booths also play a role in managing ramp queues, among other functions.

Author Contributions

P.Y.: Methodology, Writing—original draft, Writing—review & editing, Software. M.M.: Formal analysis, Conceptualization, Supervision, Data curation. C.W.: Validation, Investigation, Writing—review & editing. All authors have read and agreed to the published version of the manuscript.

Funding

This research received no external funding.

Conflicts of Interest

The authors declare that they have no known competing financial interests or personal relationships that could have appeared to influence the work reported in this paper.

References

  1. Papageorgiou, M.; Kotsialos, A. Freeway ramp metering: An overview. IEEE Trans. Intell. Transp. Syst. 2002, 3, 271–281. [Google Scholar] [CrossRef]
  2. Marzoug, R.; Lakouari, N.; Ez-Zahraouy, H.; Téllez, B.C.; Téllez, M.C.; Villalobos, L.C. Modeling and simulation of car accidents at a signalized intersection using cellular automata. Phys. A Stat. Mech. Its Appl. 2022, 589, 126599. [Google Scholar] [CrossRef]
  3. Qiang, X.H.; Huang, L. Traffic flow modeling in fog with cellular automata model. Mod. Phys. Lett. B 2021, 35, 20150180. [Google Scholar] [CrossRef]
  4. Hegyi, A.; DeSchutter, B.; Hellendoorn, J. Optimal coordination of variable speed limits to suppress shock waves. IEEE Trans. Intell. Transp. Syst. 2005, 6, 102–112. [Google Scholar] [CrossRef]
  5. Carlson, R.C.; Papamichail, I.; Papageorgiou, M. Local feedback-based mainstream traffic flow control on motorways using variable speed limits. IEEE Trans. Intell. Transp. Syst. 2011, 12, 1261–1276. [Google Scholar] [CrossRef]
  6. Fang, X.; Péter, T.; Tettamanti, T. Variable Speed Limit Control for the Motorway–Urban Merging Bottlenecks Using Multi-Agent Reinforcement Learning. Sustainability 2023, 15, 11464. [Google Scholar] [CrossRef]
  7. Lu, X.Y.; Shladover, S.; Jawad, I.; Jagannathan, R.; Phillips, T. A Novel Speed-Measurement Based Variable Speed Limit/Advisory Algorithm for A Freeway Corridor with Multiple Bottlenecks. In Proceedings of the Transportation Research Board 94nd Annual Conference, Washington, DC, USA, 11–15 January 2015. [Google Scholar]
  8. Wang, H.; Wang, W.; Chen, X.; Chen, J.; Li, J. Experimental Features and Characteristics of Speed Dispersion in Urban Freeway Traffic. Transp. Res. Rec. J. Transp. Res. Board 2007, 1999, 150–160. [Google Scholar] [CrossRef]
  9. Spiliopoulou, A.D.; Papamichail, I.; Papageorgiou, M. Toll Plaza Merging Traffic Control for Throughput Maximization. J. Transp. Eng. 2010, 136, 67–76. [Google Scholar] [CrossRef]
  10. Han, Y.; Hegyi, A.; Zhang, L.; He, Z.; Chung, E.; Liu, P. A New Reinforcement Learning-Based Variable Speed Limit Control Approach to Improve Traffic Efficiency against Freeway Jam Waves. Transp. Res. Part C Emerg. Technol. 2022, 144, 103900. [Google Scholar] [CrossRef]
  11. Othman, B.; De Nunzio, G.; Di Domenico, D.; Canudas-de-Wit, C. Analysis of the Impact of Variable Speed Limits on Environmental Sustainability and Traffic Performance in Urban Networks. IEEE Trans. Intell. Transp. Syst. 2022, 23, 21766–21776. [Google Scholar] [CrossRef]
  12. Hadj-Salem, H.; Blosseville, J.M.; Papageorgiou, M. ALINEA: A local feedback control law for on-ramp metering. Transp. Res. Rec. J. Transp. Res. Board 1991, 1320, 58–64. [Google Scholar]
  13. Papageorgiou, M.; Haj-Salem, H. A Low Cost Tool for Freeway Ramp Metering. In Proceedings of the IFAC Symposium on Low Cost Automation, Buenos Aires, Argentina, 13–15 September 1995; pp. 49–54. [Google Scholar]
  14. Smaragdis, E.; Papageorgiou, M.; Kosmatopoulos, E. A flow-maximizing adaptive local ramp metering strategy. Transp. Res. Part B Methodol. 2004, 38, 251–270. [Google Scholar] [CrossRef]
  15. Jacobson, L.N.; Henry, K.C.; Mehyar, O. Real-time metering algorithm for centralized control. Transp. Res. Rec. 1989, 1232, 17–26. [Google Scholar]
  16. Ci, Y.; Wu, H.; Sun, Y.; Wu, L. A prediction model with wavelet neural network optimized by the chicken swarm optimization for on-ramps metering of the urban expressway. J. Intell. Transp. Syst. 2022, 26, 356–365. [Google Scholar] [CrossRef]
  17. Chai, G.; Cao, J.; Xu, S. An optimized on-ramp metering method for urban expressway based on reinforcement learning. J. Intell. Fuzzy Syst. 2020, 38, 2703–2715. [Google Scholar] [CrossRef]
  18. Chen, D.; Ahn, S.; Hegyi, A. Variable speed limit control for steady and oscillatory queues at fixed freeway bottlenecks. Transp. Res. Part B Methodol. 2014, 70, 340–358. [Google Scholar] [CrossRef]
  19. Chen, D.; Ahn, S. Variable speed limit control for severe non-recurrent freeway bottlenecks. Transp. Res. Part C Emerg. Technol. 2015, 51, 210–230. [Google Scholar] [CrossRef]
  20. Khondaker, B.; Kattan, L. Variable speed limit: A microscopic analysis in a connected vehicle environment. Transp. Res. Part C Emerg. Technol. 2015, 58, 146–159. [Google Scholar] [CrossRef]
  21. Shaaban, K.; Khan, M.A.; Kim, I.; Hamila, R. Queue discharge at freeway on-ramps using coordinated operation of a ramp meter and an upstream traffic signal. Procedia Comput. Sci. 2020, 170, 347–353. [Google Scholar] [CrossRef]
  22. Lu, Y.X.; Qiu, T.Z.; Varaiya, P.; Horowitz, R.; Shladover, S.E. Combining Variable Speed Limits with Ramp Metering for Freeway Traffic Control. In Proceedings of the 2010 American Control Conference, Baltimore, MD, USA, 30 June–2 July 2010. [Google Scholar]
  23. Su, D.; Lu, X.Y.; Varaiya, P.; Horowit, R.Z.; Shladover, S.E. Variable Speed Limit and Ramp Metering Design for Congestion Caused by Weaving. In Proceedings of the Transportation Research Board 90th Annual Meeting, Washington, DC, USA, 22–27 January 2011. [Google Scholar]
  24. Carlson, R.C.; Papamichail, I.; Papageorgiou, M.; Messmer, A. Optimal Motorway Traffic Flow Control Involving Variable Speed Limits and Ramp Metering. Transp. Sci. 2010, 44, 238–253. [Google Scholar] [CrossRef]
  25. Ma, M.; Zhang, Y.Z.; Liang, S.D. Dynamic control cycle speed limit strategy for balanced reduction of travel time and emissions. Mod. Phys. Lett. B 2021, 35, 2150153. [Google Scholar] [CrossRef]
  26. Levinson, D.; Chang, E. A model for optimizing electronic toll collection systems. Transp. Res. Part A Policy Pract. 2003, 37, 293–314. [Google Scholar] [CrossRef]
  27. Boronico, J.S.; Siegel, P.H. Capacity planning for toll roadways incorporating consumer wait time costs. Transp. Res. Part A Policy Pract. 1998, 32, 297–310. [Google Scholar] [CrossRef]
  28. Zou, F.; Wang, H.; Tian, J.; Guo, F.; Cai, Q. Analysis on Lane Capacity for Expressway Toll Station Using Toll Data. J. Adv. Transp. 2022, 2022, 9277000. [Google Scholar]
  29. Liu, L.L.; Weng, J.C.; Rong, J. Simulation based mixed ETC/MTC freeway toll station capacity. In Proceedings of the 19th ITS World Congress, Vienna, Austria, 22–26 October 2012. [Google Scholar]
  30. Yuan, N.; Ma, M.; Liang, S.; Wang, W.; Zhang, H. Optimal control method of freeway based on tollbooths lane configuration and variable speed limit control. Phys. A Stat. Mech. Its Appl. 2022, 603, 127801. [Google Scholar] [CrossRef]
Figure 1. Basic diagram of traffic flow under VSL control.
Sustainability 16 04404 g001
Figure 2. Mainline density plots of the four control strategies for different flow scenarios: (a) for low flow, (b) for medium flow and (c) for high flow.
Sustainability 16 04404 g002
Figure 3. VSL trajectory contour.
Sustainability 16 04404 g003
Figure 4. Density profiles under different control strategy at high flows.
Sustainability 16 04404 g004
Figure 5. Velocity trajectory profiles in bottlenecks.
Sustainability 16 04404 g005
Figure 6. Spatio−temporal trajectory of ramp three lanes at Measurement-4.
Sustainability 16 04404 g006
Table 1. Toll lane configuration schemes of three controlled lanes.
MeasurementsToll Lane
Lane 1Lane 2Lane 3
Measurement-1ETC/MTCETCETC/MTC
Measurement-2ETC/MTCMTCETC/MTC
Measurement-3ETC/MTCETC/MTCETC
Measurement-4ETC/MTCETC/MTCETC
Table 2. Performance comparison.
Measurement-1Measurement-2Measurement-3Measurement-4
Value-ValueImprovement (%)ValueImprovement (%)ValueImprovement (%)
TTT (veh/h)497.05-487.951.83452.079.04374.3424.69
CO (kg/s)542.12-519.034.26536.361.06516.144.79
HC (kg/s)27.33-27.270.1825.337.3225.247.65
NOx (kg/s)62.02-60.572.3461.990.0560.482.48
FC (kg/L)17544-174350.62170582.77166674.98
Disclaimer/Publisher’s Note: The statements, opinions and data contained in all publications are solely those of the individual author(s) and contributor(s) and not of MDPI and/or the editor(s). MDPI and/or the editor(s) disclaim responsibility for any injury to people or property resulting from any ideas, methods, instructions or products referred to in the content.

