Article

Growth Dynamics and Nutrient Removal from Biogas Slurry Using Water Hyacinth

1
Bioenergy Laboratory, Department of Environmental Studies, Siksha-Bhavana (Institute of Science), Visva-Bharati, Santiniketan 731235, India
2
Department of Environmental Science, Tezpur University, Tezpur 784028, India
3
Department of Microbiology and Cell Science, University of Florida, Gainesville, FL 32611, USA
4
Socio-Energy Laboratory, Department of Lifelong Learning and Extension, Institute of Rural Reconstruction, Visva-Bharati, Sriniketan 731236, India
5
Defiant Renewables Pvt Ltd., Bhoir Colony, Chinchwad, Pune 411033, India
6
School of Chemical and Process Engineering, University of Leeds, Leeds LS2 9JT, UK
*
Authors to whom correspondence should be addressed.
Sustainability 2024, 16(11), 4450; https://doi.org/10.3390/su16114450
Submission received: 10 April 2024 / Revised: 10 May 2024 / Accepted: 20 May 2024 / Published: 24 May 2024
(This article belongs to the Section Environmental Sustainability and Applications)

Abstract

:
Aquatic macrophytes, notably the invasive water hyacinth, exhibit proficiency in nutrient removal from polluted water bodies, rendering them appealing for water remediation applications. This study investigates the potential of water hyacinth in phytoremediation, focusing on the effect of using nutrient-rich biogas slurry mixed with water in varying concentrations, i.e., 16.6, 33, 66.6, 100, and 133 mg/L for the investigation. The physiochemical properties of the liquid biogas slurry were evaluated before and after treatment with water hyacinth over eight weeks, with continuous monitoring of nutrient reduction rates. Results showcased substantial average reductions of nitrogen, phosphorus, and potassium, with a relative growth rate of 5.55%. The treatment also decreased pH, total dissolved solids, hardness, and chemical oxygen demand. The theoretical BMP of water hyacinth was determined using Buswell’s equation. Water hyacinth grown in the concentration of the biogas slurry exhibited the highest methane yield at 199 mL CH4/gm VS, along with the highest relative growth rate. This study used experimental data to create a mathematical model that describes how the relative growth of water hyacinth depends on the number of days and biogas slurry concentration (C). The model’s quality and effectiveness were evaluated using the goodness of fit (R2) and observable approaches. The polynomial model, referred to as Poly model 1, 2, is the best fit for describing the relationship between the growth percentage of water hyacinth, days, and nutrient solution concentration. In this model, C has a polynomial degree of one (normalized mean of 69.84 ± 43.54), while D has a degree of two (normalized mean of 30 ± 21.65).

1. Introduction

Phytoremediation serves as an environmentally friendly and cost-effective alternative to conventional methods. It harnesses the power of plants to purify soil, air, and water through the physical, chemical, or biological removal and detoxification of contaminants [1]. The concept of phytoremediation, initially presented in 1983, continues to be fundamental to investigations into the cleanup of polluted soil [2,3]. It effectively eliminates heavy metals without causing secondary pollution [4,5,6,7]. The criteria for selecting plants for phytoremediation involve high metal tolerance, a short life cycle, wide distribution, significant biomass, and a translocation factor exceeding one [8,9]. Among these criteria, water hyacinth (WH) stands out as a plant that fulfils all these requirements and has proven to be one of the most promising options for phytoremediation [1,10]. The proliferation of WH, identified as Eichhornia crassipes, in nutrient-rich water bodies is of global concern. Due to its rapid spread and dire implications for water ecosystems, urgent measures must be taken to address the WH problem. The dense growth of WH leads to decreased oxygen levels in the water, endangering aquatic life and exacerbating water loss through evapotranspiration. Known for its swift propagation and resilience even in nutrient-poor environments, WH poses a significant threat to freshwater bodies. These negative characteristics of WH can be turned into a positive aspect with phytoremediation techniques [11].
In response to the extensive prevalence of WH within aquatic ecosystems, researchers have undertaken investigations to explore value-added applications for this plant species [12,13,14]. WH has been recognised for its utility in water pollution control since the 1980s [15]. WH biomass is known for its capacity to adsorb and remove metals and organic contaminants from water [16,17,18,19]. The overall average WH growth rate was high at 0.297 kg wet wt./m2/day during a research period of over 500 days, including both the active and non-active growing seasons. This research illustrated that WH generates promising aquatic plant biomass for bioenergy production [20]. WH is a good bioaccumulator of various metals (acidic and alkaline forms of chemicals) even at high concentrations [21], and it effectively removes nitrogen and phosphorus, reduces BOD, and absorbs heavy metals and toxic compounds [22,23,24,25]. It is reported that WH can decrease the eutrophication level of water by taking up 2.5 g of nitrogen (N) and 0.2 g of phosphorus (P) per square meter per day. In eutrophic freshwaters, WH can grow up to 600–900 tonnes of fresh biomass (35–54 tonnes of dry biomass) per hectare in temperate climate zones [26]. It has applications in treating various water bodies, including eutrophication lakes, polluted riverways, industrial wastewater, leachate from landfills, and more [27,28]. Fazal et al. [29] assessed the phytoremediation potential of WH, which exhibited remarkable effectiveness in reducing various water quality parameters, including electrical conductivity, turbidity, chemical oxygen demand (COD), total suspended solids (TSS), total dissolved solids (TDS), total solids (TS), nitrates, ammonia, and phosphates. Buhari et al. [30] highlight the potential of WH as a valuable tool for phytoremediation by an operational constructed wetland, where WH contributed to a 29.4% enhancement in nitrogen removal, with a particularly high ammonia removal efficiency of 81%. This efficiency boost can be attributed to various mechanisms, including bacterial action within periphyton and phytoplankton communities, uptake of ammonia by WH, nitrification processes, and release of ammonia gas into the atmosphere. The buffering capacity of WH, which helps maintain near-neutral pH levels in the wetland, rendered alternative methods less feasible.
Biogas slurry, a frequently employed resource rich in organic carbon and plant nutrients, is widely utilized as fertilizer which is a byproduct of anaerobic digestion. Following fermentation, it is known for removing the majority of pollutants and harmful microbes, rendering it an environmentally friendly option for agricultural systems [31]. Research has demonstrated that incorporating biogas slurry into soil can enhance soil quality and increase crop yields [32,33]. Managing biogas slurry poses challenges primarily because it comprises a substantial liquid fraction rich in valuable nutrients [34]. Due to its high liquid content and nutrient-rich composition, proper handling and disposal are essential to maximize the agricultural benefits and prevent environmental consequences [35]. The presence of high concentrations of carbon (C), nitrogen (N), and phosphorus (P) in biogas slurry poses significant environmental challenges. Inadequate management and disposal practices can lead to severe pollution issues and the wastage of these valuable resources [36]. Furthermore, the cycling of N and P within stream ecosystems, influenced by runoff from improperly managed biogas slurry, can disrupt nutrient availability for primary production and negatively impact downstream ecosystems [37]. Indeed, proper and conscientious management practices are essential for minimizing the risk of nutrient runoff and contamination of water bodies and the potential for eutrophication. There are various management processes for biogas slurry [38] but the present study involves the cultivation of WH in biogas slurry, exploiting its dual potential as an effective phytoremediator [1] and a viable substrate for biogas production [39]. This approach represents a novel method that capitalizes on the unique characteristics of WH, thereby offering a sustainable solution for both wastewater treatment and renewable energy generation.
WH has excellent potential to be used as a substrate in anaerobic digestion, which enhances the CH4 potential in biogas. This study aimed to cultivate WH in liquid biogas slurry, a valuable biofuel feedstock. The primary objectives of this study are to (i) assess the phytoremediation potential of WH by examining relative growth rate and nutrient uptake in different concentrations of biogas slurry under a managed culture system; (ii) develop a model to predict growth rate with nutrients and number of days; and (iii) calculate the theoretical BMP potential of cultivated WH.

2. Phytoremediation Potentiality of WH: A Bibliometric Study

Various studies have recognised WH as a valuable resource for removing pollutants from waste effluents [1]. Numerous investigations have emphasized its effectiveness in eliminating heavy metals (HM) and organic matter from water bodies and wastewater streams [14,40,41]. WH exhibits a noteworthy capacity to efficiently absorb and eliminate heavy metals and nutrients, making it a promising contender for global wastewater treatment. Hence, using WH presents substantial promise for phytoremediation and the generation of bioenergy and bioproducts.
A thorough bibliometric analysis, enabled through systematic literature exploration, holds crucial significance within the framework of a comprehensive systematic review. Employing the Web of Science (WoS) database, well known for its multi-database accessibility, a comprehensive and systematic literature search was conducted. This search aimed to enhance transparency by elucidating the methodologies employed to pinpoint relevant studies and demonstrate how the review findings correspond with the pre-existing scientific evidence. The research covered exploration within the WoS utilising specific keywords, including “Water hyacinth” and “Phytoremediation”, retrieving 326 articles. Using the VOS viewer software (version 1.6.20), the articles screened based on keyword co-occurrence values up to seven, resulting in the selection of 85 keywords which were further screened for an optimised and relevant visualisation resembling this study objective [1,39,42,43,44,45]. A network map was generated using frequently used keywords, and the findings are illustrated in Figure 1.
The map was constructed based on linlog analysis with a total of 846 links and a cumulative link strength of 3201. Clusters and the prominence of individual keywords are denoted by their colour and size, while the connections between the nodes represent their interrelationships. This keyword network analysis revealed that the articles primarily revolved around four main clusters. Cluster 1 (red colour): WH, as an aquatic macrophyte, is an effective bioagent in phytoremediation, capable of addressing eutrophication issues by absorbing excess nutrients from water bodies. Beyond its environmental benefits, WH biomass can be harnessed for sustainable energy generation through anaerobic digestion, yielding valuable biogas as a renewable energy source. This dual functionality highlights the potential of WH in ecological restoration and bioenergy production, making it a valuable bioasset in searching for more sustainable aquatic ecosystems and energy solutions. Cluster 2 (green colour): The vigorous growth of certain plants, associated with their ability to perform bioremediation of heavy metal through phytoextraction and accumulation, not only facilitates environmental remediation but also offers the potential for biogas production, providing a sustainable solution for both pollution control and renewable energy generation. Cluster 3 (blue colour): WH’s phytoremediation abilities extend to remediate copper (Cu), mercury (Hg), and chromium (Cr) pollution while offering the potential for biogas production. Cluster 4 (yellow colour): Rhizofiltration and phytoaccumulation with WH or other aquatic plants like water lettuce and duckweed are promising approaches for removing heavy metals while exploring their biomass for biogas production.

3. Collection and Characterization of Biogas Slurry and Plant Samples

The biogas slurry employed in this study was obtained from a local biogas facility having an operational volume of 20 m3 (Latitude 23.679849 and Longitude 87.670076). This facility is a part of the Visva-Bharati sponsored by the INDO-UK BioCPV Project under the SEED Division, Department of Science and Technology. The biogas slurry was collected from the outlet of the biogas digester, and initial characteristics have been analysed. Table 1 depicts the physiochemical properties of the biogas slurry. Young WH plants were collected from the ponds of Goalpara, a nearby village of Santiniketan, West Bengal, India, for cultivation trials.

4. Experimental Setup for the Study

4.1. Experimental Setup 1: Removal of Nutrients by WH

The experimental setup for this study was conducted at a laboratory scale using food-grade PVC tanks with a capacity of 6 L without aeration. Five tanks representing different concentrations of biogas slurry (C1, C2, C3, C4, and C5) were used in the experiment. Fresh water and different amounts of biogas slurry were added to tap water to prepare variable concentration solutions.
Specifically, C1 contained 100 gm of biogas slurry, C2 had 200 gm, C3 had 400 gm, C4 had 600 gm, and C5 had 800 gm of biogas slurry (Figure 2a). To maintain consistency, the water level in each tank remained fixed by adding fresh water as necessary. Young WH plants were collected, and their initial weight was measured and introduced into the tanks for the experiment, with four plants in each tank. This study was conducted over 60 days, with sampling carried out at 15-day intervals.

4.2. Experimental Setup 2: Measurement of the Biomass Quality

Five tanks labelled C1, C2, C3, C4, and C5, along with their respective replicate tanks, were installed in the Department of Environmental Studies, Visva-Bharati. Each tank contained four WH plants in each concentration of anaerobically digested cow dung biogas slurry. Four plants were tagged and designated as P1, P2, P3, and P4 in a specific grouping with a uniform concentration. For example, in Tank C1, the plants were tagged and labelled as C1P1, C1P2, C1P3, and C1P4. After every 15-day interval, one plant from each tank was harvested for biomass assessment (Figure 2b). The final weight of the WH was measured and tagged separately to monitor any changes in biomass over time. This was systematically followed for other plants tagged as P2, P3, and P4 in each tank for evaluating biomass quality and its variation with time and biogas slurry concentration.

5. Materials and Methods

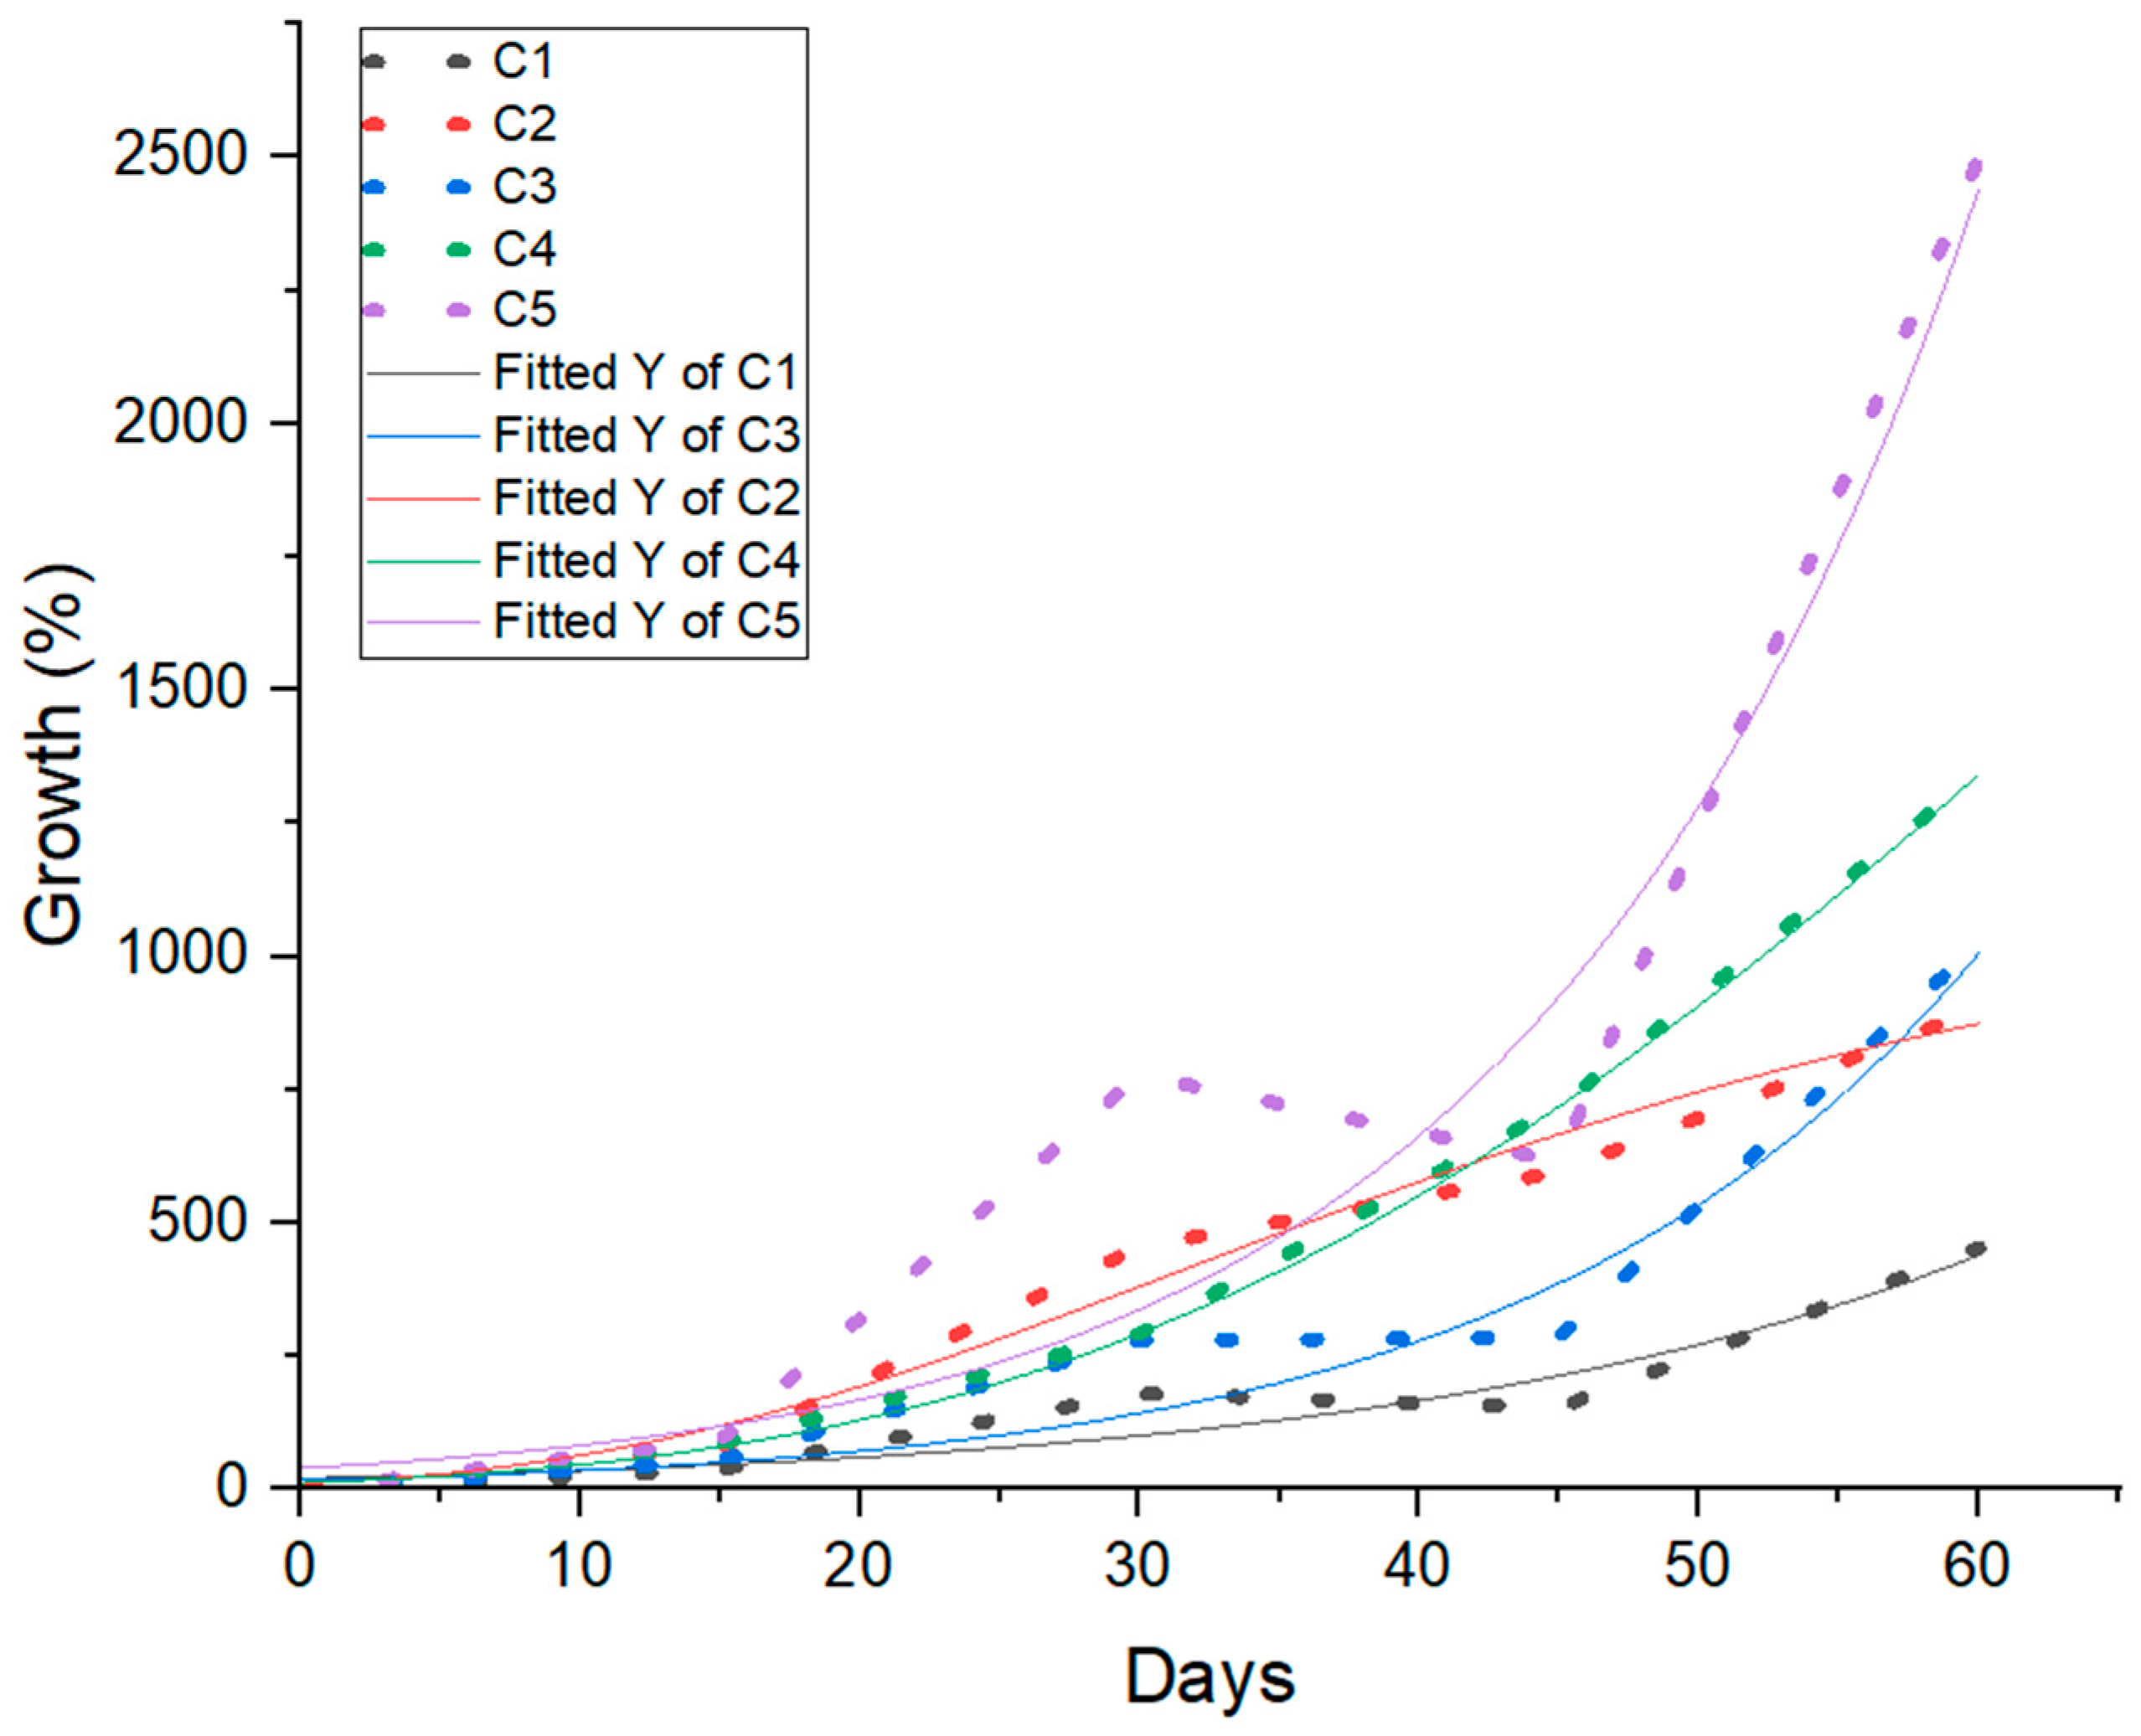
5.1. Relative Growth Rate of the Biomass

At 15, 30, 45, and 60 days, the plants were harvested, and their weights were recorded. The increased growth rate (IGR) was calculated using the formula IGR = (FWP − IWP), where FWP represents the final weight after 15 days of the interval, and IWP represents the initial weight of the plant. The relative growth rate was then determined as
Relative Growth Rate (RGR Biomass) = (Weight F − Weight I)/(t2 − t1)
where Weight I and Weight F are the initial weights of the plants at times t1 and t2.
At 15-day intervals, five water samples were collected from the five tanks in triplicate (Figure 2b). The sampling was performed using plastic bottles, and each sample was collected from the water surface down to a depth ranging from 50 cm to 100 cm.

5.2. S-Gompertz Model

The growth of WH was analysed using the S-Gompertz model, with the modelling process carried out using OriginLab software (OriginPro 2022). The equation used for the model is:
Y = A × exp(−exp(−k × (X − XC)))
  • Y: This represents the growth of WH at a given time (X). It is the dependent variable we are trying to model or predict.
  • A: This parameter represents the upper asymptote of the growth curve. In the context of WH growth, it signifies the maximum growth level that can be reached. As time (X) approaches infinity, Y will asymptotically approach A.
  • exp: This is the exponential function with the base e (approximately 2.71828). It is used to model exponential growth or decay.
  • k: This is the growth rate coefficient. It controls the steepness of the S-shaped growth curve. A higher value of k implies a steeper curve, indicating faster growth.
  • XC: This represents the time at which the growth curve undergoes an inflection point. The inflection point is the point where the growth rate transitions from accelerating to decelerating. In other words, it is the time when the rate of growth is the highest.
Modelling was performed using OriginLab software. The Gompertz model was applied to describe the phenomenon, and the software facilitated data organization, equation definition, parameter estimation, and result visualization, streamlining the modelling process effectively.

5.3. Physiochemical Analysis of Biogas Slurry

The collected water samples were then analysed for various parameters, including total Kjeldahl nitrogen following the ASTM method [49], while total hardness, pH, electrical conductivity, total solids, total dissolved solids, total suspended solids, and combined CO2 followed APHA [50]. The regular sampling (15, 30, 45, and 60 days) and analysis schedule allowed for monitoring and assessing these parameters throughout the experiment.

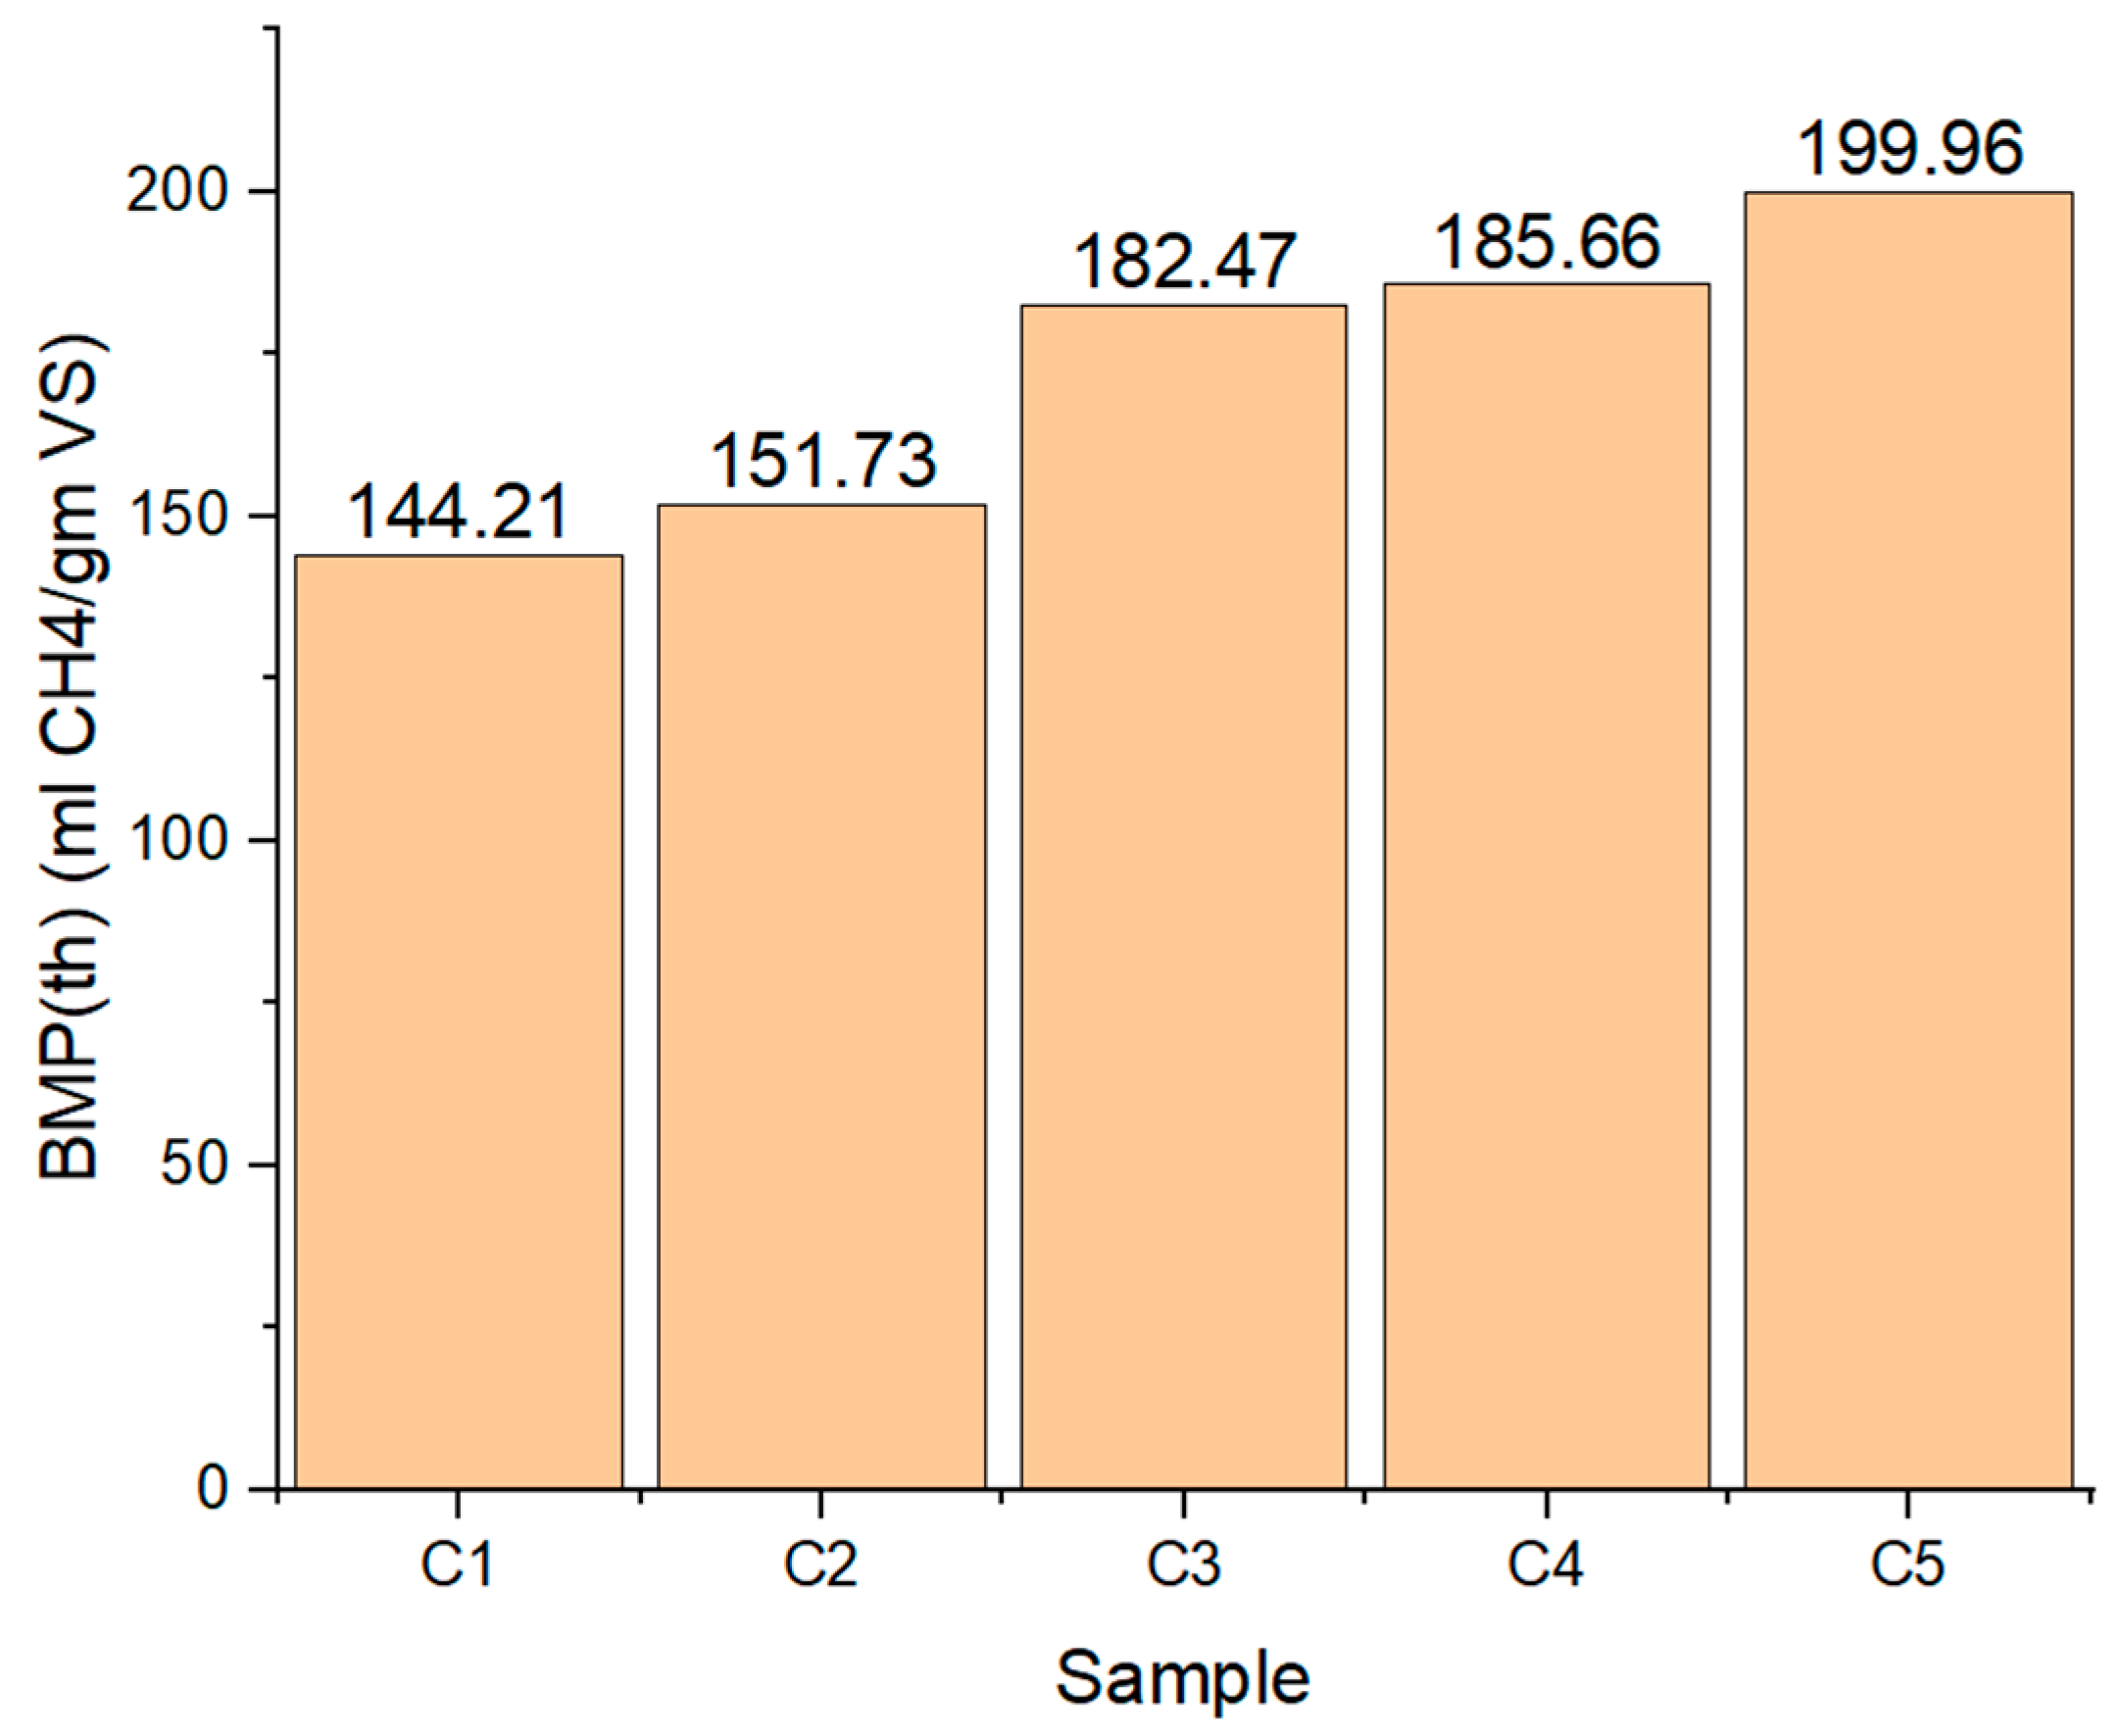
5.4. Theoretical BMP (BMPth) Analysis

The elemental composition of WH samples harvested on day 60 of the experiment, including carbon (C), hydrogen (H), nitrogen (N), sulfur (S), and oxygen (O), was determined using a CHNS-O Elemental Analyzer (Thermo Flash 2000). The analysis was conducted to estimate the theoretical biochemical methane potential (BMPth) of the WH substrate, which was calculated based on Buswell’s equation:
BMP th = 22400 × ( C 2 + h 8 o 4 3 n 8 ) 12 c + h + 16 o + 14 n
where c, h, o, and n state the molar fractions of C, H, O, and N, respectively [51]. This equation assumes a complete substrate transformation into CH4 and its byproduct, CO2, with 100% efficiency. The BMPTh values are expressed on a VS basis by considering only the biodegradable content and thus subtracting the ash fraction from the calculation [52].

5.5. Statistical Analysis

The study employed two key statistical methodologies to investigate the determinants of WH growth: (i) analysing the intricate relationships between various physiochemical parameters, and (ii) analysing growth dynamics within the context of WH mediated phytoremediation of biogas slurry. Pearson correlation analysis was conducted with Minitab (Version 21.2) to quantify the strength and direction of linear relationships between the diverse physiochemical parameters and growth dynamics. Secondly, principal component analysis (PCA) was conducted using SPSS (Version 27), a technique chosen for its ability to uncover underlying factors influencing WH growth and simplify the complexity inherent in our dataset. The loading plot was prepared using Minitab (Version 21.2).

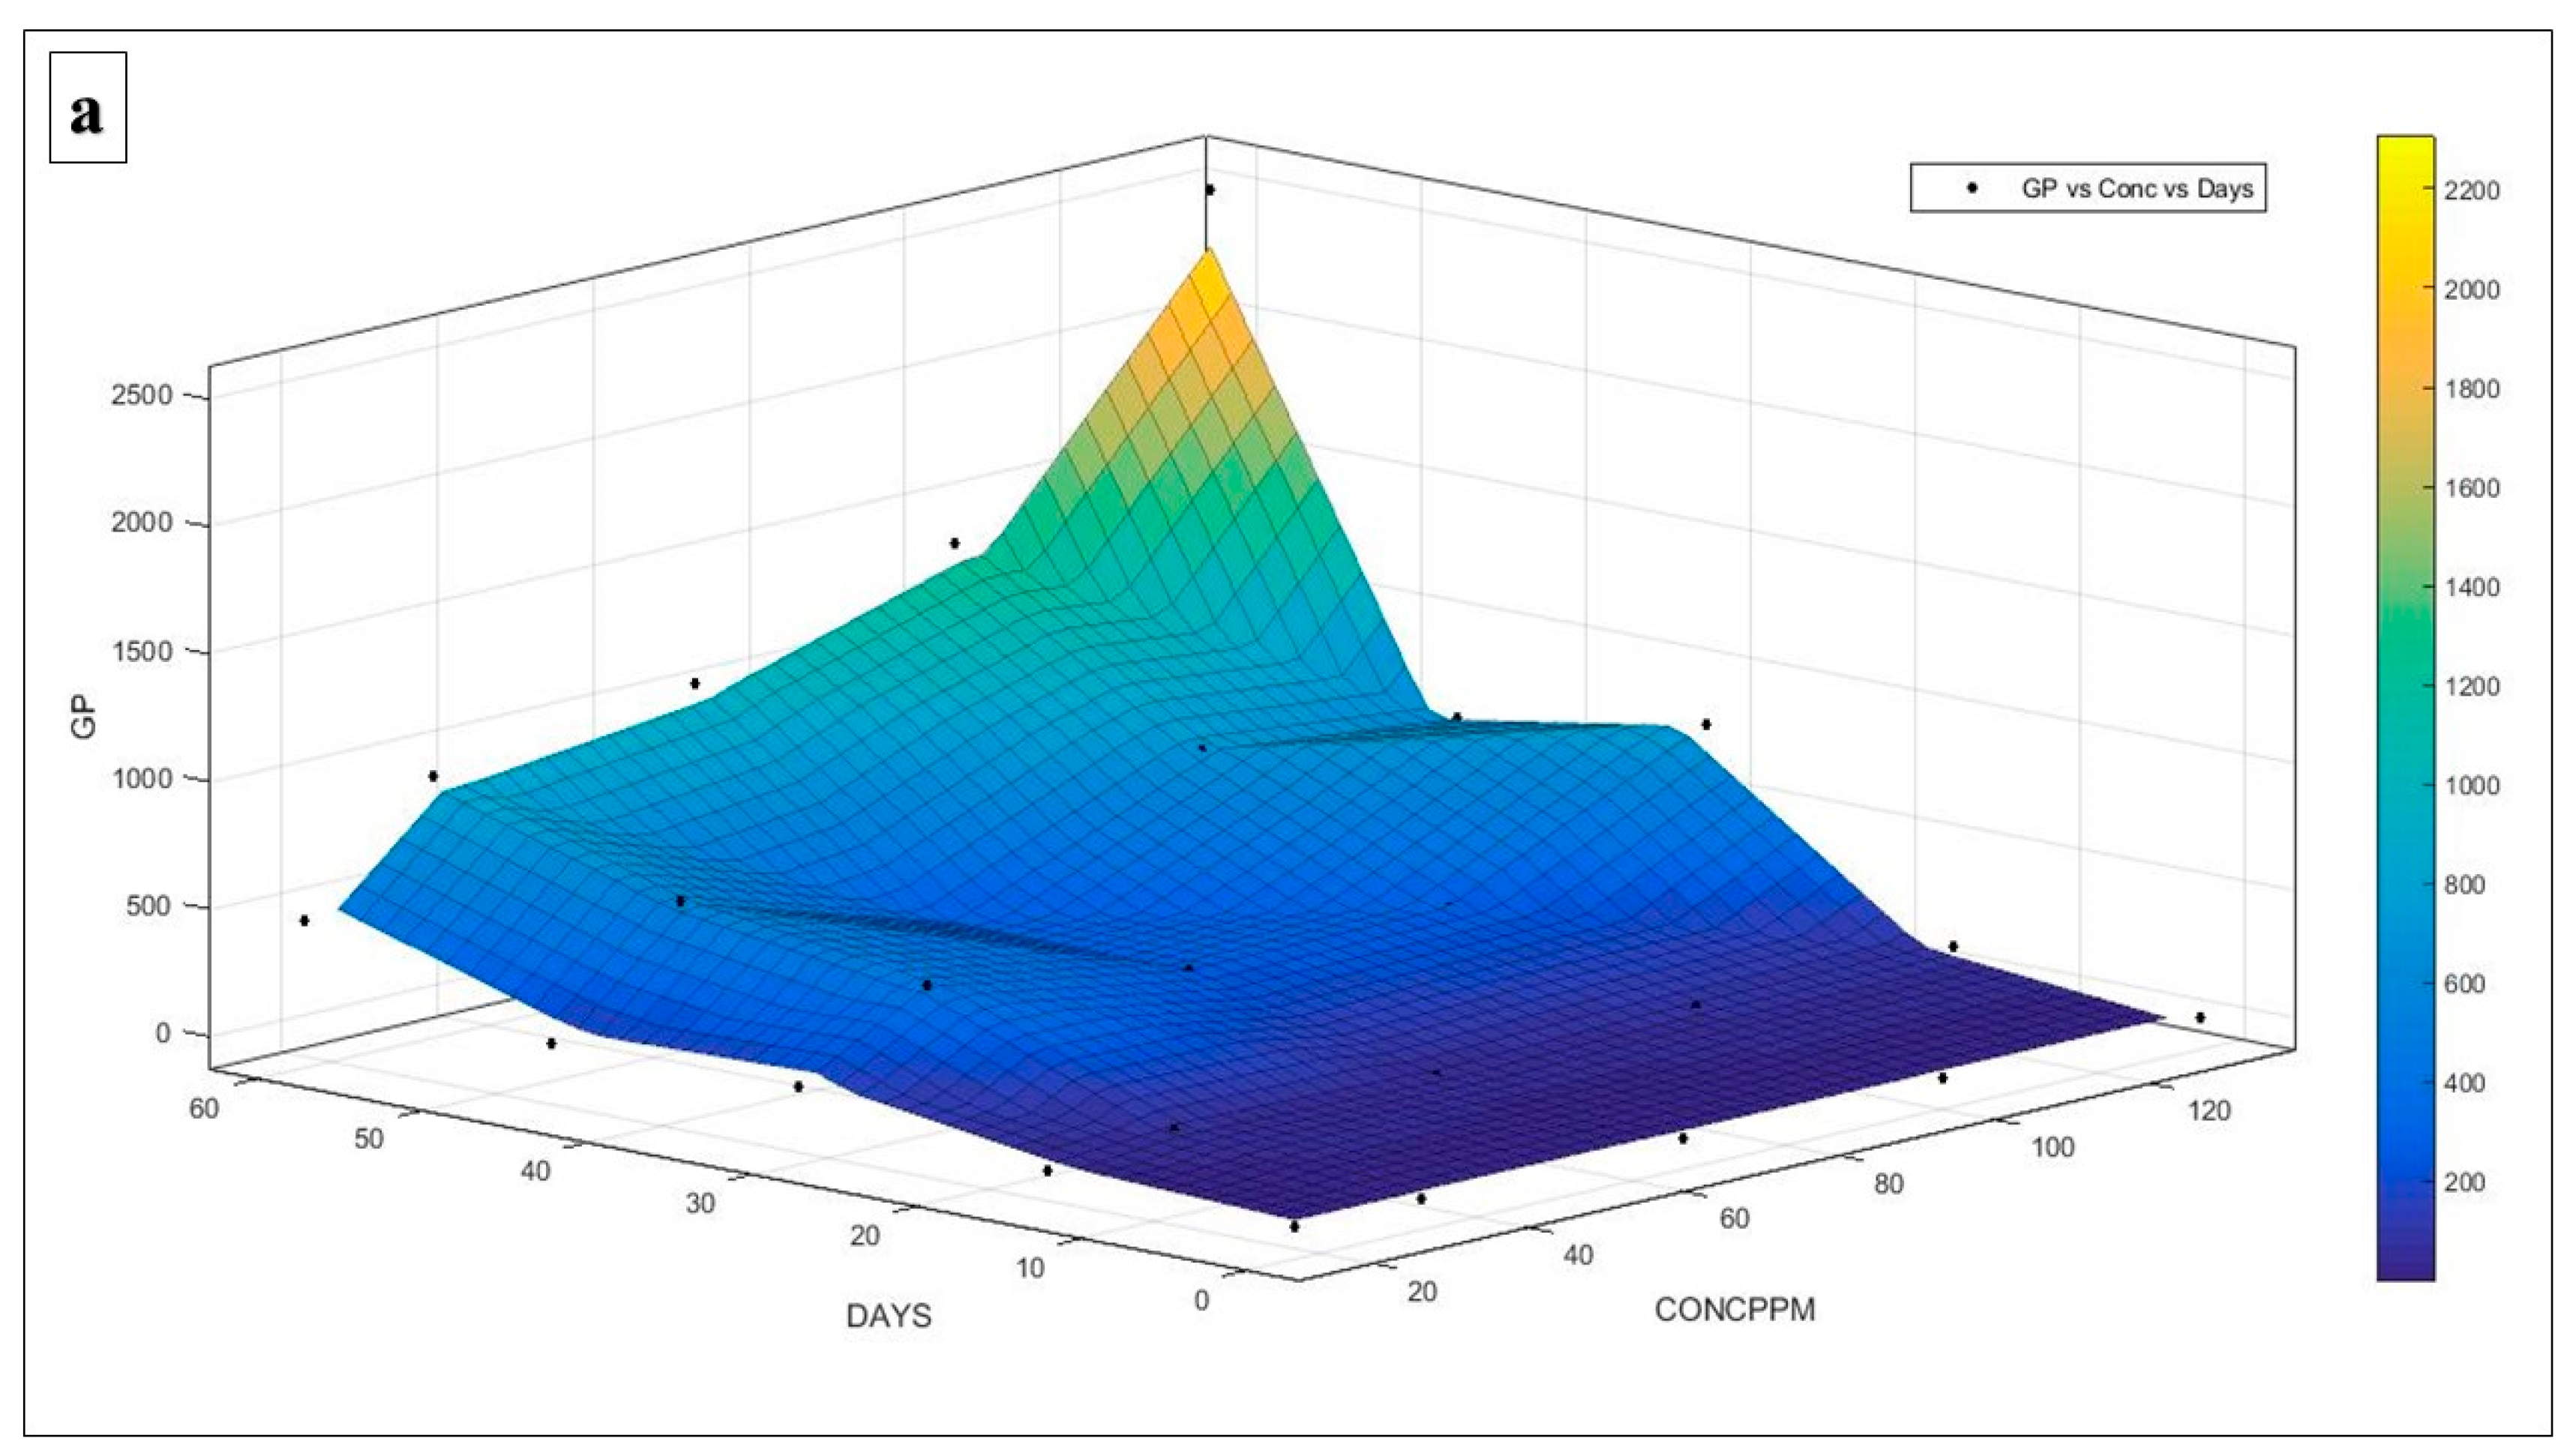
5.6. Mathematical Modelling

Based on the experimental data, this study’s critical parameters are the number of days (D) and concentration (C) of the biogas slurry solution, which were plotted against the growth percentage (GP) of WH. The plot thus obtained was carefully analysed to establish a mathematical model through the curve-fitting approach. The interpolant plot obtained was then fitted with various known functions. The best and most appropriate fit was then adopted as the best-fitting mathematical model describing the interdependency of D, C, and GP. The goodness of fit (R2) was taken as the evaluating parameter to determine the fit’s quality and effectiveness, along with some observable approaches of the authors. The fitting was accomplished using the curve fitting toolbox of MATLAB, (version R2021a) in which the bisquare fitting technique was employed.

6. Results

6.1. Relative Growth Rate (RGR)

Tank 5 showed the maximum RGR followed by C4 (1.66), C3 (1.43), C2 (1.15), and C1 (0.64), indicating the influence of concentration on the RGR of the plants in the different tanks. Tank C5 Plant 4, having a very high concentration, exhibited the highest RGR among all experimental setups. The growth difference observed in this case was 332.9 gm from day 0 to day 60, resulting in a RGR of 5.55%. The RGR was also high for the rest of the plants in Tank 5, i.e., where C5P2 was 2.31, followed by C5P3 (2.22) and C5P1 (1.92). Bray et al. (2022) [53] observed WH growth rates of 0.038 and 0.11 g/g/day in cultivation trials with unfertilised and fertilised (20:80 cow dung:water) for three weeks. Rapid growth of plants was observed in all the tanks, generally after 40–45 days. This notable growth could be mainly attributed to the increased number of replications during that period. At that stage, the plants had reached sufficient maturity and the maximum number of replications were in place, which likely facilitated the accelerated growth observed across all treatments leading to decreased nutrient content in the biogas slurry.
Several key observations emerge in the analysis of WH growth using the S-Gompertz model across different tanks. First, Tank 4 demonstrates an exceptionally well-fitted model with a high adjusted R2 and realistic parameter estimates suggesting robust data and an accurate representation of growth dynamics (Supplementary Table S1). Conversely, Tanks 2 and 5 present concerns due to notably high or unrealistic parameter estimates, potentially indicating data anomalies or model limitations. Tank 1 shows a good fit overall, with parameter estimates falling within reasonable ranges. However, Tank 3 raises questions with an exceptionally high upper asymptote and late inflection point, warranting further investigation. In summary, while the S-Gompertz model offers valuable insights into WH growth, scrutiny of parameter estimates and data quality is crucial to ensure accurate growth characterization in different tanks.
The S-Gompertz model fits the growth data of WH in five different tanks with varying biogas slurry concentrations. Tanks 1 and 4 exhibit well-fitting models with realistic parameter estimates, indicating that the upper asymptote, inflection point, and growth rate provide reasonable descriptions of their growth patterns. However, Tank 2 displays an unusually high growth rate coefficient, potentially suggesting an outlier or experimental anomaly. Tanks 3 and 5 present challenges, with parameter estimates that appear idealistic, including extremely high upper asymptotes and inflection points due to high biogas slurry concentration (Figure 3).

6.2. Changes in Physiochemical Parameters

The pH measurements in tanks containing various concentrations of biogas slurry demonstrated only minor variations, leading to a marginal decrease in pH. Statistical analysis revealed specific percentage decreases in pH for Tanks C1, C2, C3, C4, and C5, amounting to 1.8%, 4.1%, 5.3%, 6.4%, and 10.8%, respectively. In a study conducted by Saha et al. [54], WH demonstrated an approximate 11% reduction in the pH of industrial mine wastewater. On the other hand, Mahmood et al. (2012) [55] highlighted a significant decrease in pH from 8.25 to 7.1 within 96 h, highlighting the effective pH-regulating capability of WH in their experimental setup. These findings underscore and emphasize the potential of WH as a natural solution for pH reduction in different wastewater environments. Remarkably, a significant reduction in electrical conductivity was observed in Tanks C1, C2, C3, C4, and C5, with percentage reductions of 14%, 14.2%, 14.1%, 14.7%, and 14.4%, respectively.
The most substantial reduction of TDS was noted in Tank C5 at 93.75%, followed by C4, C2, C1, and C3. Panneerselvam and Priya [56] observed 10% to 20% removal of TDS. Saha et al. (2017) [54] observed more than 18% removal of TDS from mine wastewater. On the other hand, Kumar et al. [57] observed 72.54% of TDS removal from paper mill effluents. Similarly, TSS showed significant reductions, with Tank C5 demonstrating the most effective reduction at 90.7%, trailed by C2, C3, C4, and C1.
Evaluating hardness reduction, the study unveiled varying levels of effectiveness among the tanks, with Tank C1 displaying the highest reduction at 71.43%, followed by C2 at 70%, C3 at 50%, C4 at 37.5%, and C5 at 31.03%. Panneerselvam and Priya [56] observed the removal efficiency of hardness at 30–50%. Fazal et al. [29] observed that WH in constructed wetlands reduced EC and TDS by 74.9% and 71.6%, respectively.
Conversely, the analysis of COD reduction yielded distinct findings, as Tank C3 exhibited the highest COD reduction at 92.73%, highlighting its superior efficiency in lowering COD levels. Tank C1 also demonstrated a significant COD reduction of 86.15%, while C4 exhibited a reduction of 82.42%. Tank C5 recorded a COD reduction of 79.71%, while Tank C2 displayed the lowest reduction at 40%. These findings indicate that WH can potentially reduce hardness and COD in nutrient-rich water environments. More than 80% reduction in COD was observed in the study by Rezania et al. [58] and Kumar et al. [57], while Saha et al. [54] observed 34% reduction in COD.
Nitrogen removal from aquatic ecosystems primarily occurs through three pathways. First, it is absorbed by algae, aquatic plants, and animals and subsequently removed when their biomass is harvested. Second, nitrogen in the water and sediment undergoes various biological processes like mineralization, nitrification, and denitrification, transforming them into gases like N2O and N2 that escape the ecosystem. Third, nitrogen is deposited and temporarily trapped in the sediments, halting its biogeochemical cycling. Aquatic plants play a crucial role in these processes, as they contribute significantly to the nitrogen cycle and, in turn, influence the nitrogen concentration in the water. WH roots can activate microbial activity, facilitating nitrification and denitrification processes, thus enhancing the biological removal of nitrogen from aquatic environments. WH has gained growing recognition as a key macrophyte for remediating eutrophic lakes during ecological restoration and rebuilding efforts [59]. Among the tanks, the most substantial reduction in TKN was observed in C4, achieving a remarkable 95.45% reduction. Following C4, C3 exhibited a TKN reduction of 84%, C5 displayed a reduction of 82%, C1 showed a reduction of 64%, and C2 showed a reduction of 55%. WH also can remove total nitrogen up to 100% in 9 weeks, as studied by Jayaweera & Kasturiarachchi [60]. Singh et al. [61] and Mayo and Hanai [62] also observed reductions in total nitrogen of 93.86% and 63.9% respectively, while 89.27% reduction was observed by Kumar et al. [57]. Fox et al. [27] examined the pollution abatement potential of the hyacinths, and found it to account for 60–85% of the nitrogen removed from the solution. Fang et al. [63] observed total N concentration in the enclosures decreased from 2.1 to 0.50 mg L−1 after growing WH for 44 d. The study by Singh et al. [61] reported a remarkable 93.86% reduction in TKN achieved using WH.
Among the tanks in our study, C4 exhibited the most significant efficiency, achieving a 53% reduction in potassium levels. In comparison, Tank C1 presented the second-highest reduction at 50%, followed by C3 at 48%, C5 at 42%, and C2 at 40% (Figure 4). Panneerselvam and Priya [56] observed 28 to 40% potassium removal. WH efficiently eliminates approximately 69% of K in water [27].

6.3. Pearson Correlation and Principal Component Analysis (PCA)

The Pearson correlation analysis revealed significant relationships among various physiochemical parameters and growth dynamics (GP) in the context of WH-mediated phytoremediation of biogas slurry (Figure 5). Notably, the concentration of the biogas slurry exhibited strong positive correlations with K, TDS, TKN, hardness, COD, and combined CO2. K displayed strong positive associations with several parameters, including TDS, TKN, hardness, COD, combined CO2, and GP. TDS showed strong positive correlations with TKN, hardness, COD, EC, combined CO2, and GP (Supplementary Table S2). The results indicate that these parameters are interrelated and may collectively impact the growth dynamics of WH during biogas slurry phytoremediation. Additionally, GP demonstrated notable positive correlations with hardness, COD, EC, and combined CO2, suggesting that these parameters may influence the growth rate of WH in nutrient-rich wastewater environments.
A principal component analysis (PCA) was also performed to identify the different factors affecting the growth of WH. The analysis included a correlation matrix, with the extraction method being PCA. Varimax rotation with Kaiser normalization was applied to enhance interpretability. Components with eigenvalues greater than one were retained, simplifying the dataset and revealing essential patterns. The percentages of variance explained by Component 1 and Component 2 are significant, with Component 1 capturing the majority of the variability (54.37%) and Component 2 contributing an additional substantial portion (31.06%). The cumulative percentage of 85.4 emphasizes that these two components together account for a significant share of the total variance in the dataset, reinforcing their importance in summarizing and understanding the underlying patterns in the physiochemical data (Supplementary Table S3).
Component 1 accounts for a substantial portion of the overall variance, explaining approximately 54.377% of the total variability in our dataset. It demonstrates strong positive loadings for several parameters, including “K” (potassium), “TDS” (total dissolved solids), “TKN” (total Kjeldahl nitrogen), hardness, chemical oxygen demand (COD), “CO2” (combined CO2). These positive loadings imply a positive relationship between these parameters and Component 1. Notably, “GP” (growth percentage) in Component 1 is characterized by a negative loading. This signifies an inverse relationship between growth percentage and the aforementioned parameters. In other words, lower values of these physiochemical parameters tend to correspond with higher growth percentages. This observation holds significance in understanding the potential impact of water quality factors on growth dynamics, as indicated by “GP”. Component 2 explains an additional 27.5% of the total variance. It displays strong positive loadings for “PH” and “EC”. These positive loadings suggest a positive association between pH, electrical conductivity, and Component 2. In Component 2, “GP” and “DAYS” also exhibit a negative loading, indicating an inverse relationship between growth percentage, pH, electrical conductivity, and other physiochemical parameters. This implies higher pH levels and electrical conductivity values are associated with lower growth percentages.
The loadings plot (Figure 6) of the two components (first component and second component) shows the distribution of all the physicochemical parameters along with growth, days, and concentration of biogas slurry. The grouping of parameters hardness, K, TKN, combined CO2, COD, TDS, pH, EC, and concentration of biogas slurry in the loadings plot suggests their significant mutual positive correlation. GP and Days are grouped, signifying an inverse relationship between growth percentage and the aforementioned parameters.

6.4. Establishment of an Appropriate Model

An interpolant plot between the parameters GP, C, and D is shown in Figure 7a. The plot depicts the interdependencies between the critical parameters of this study. It investigates the GP of WH over varying numbers of days (D) and concentrations of biogas slurry solution (C). The data suggest that both the number of days and the concentration of nutrient solution significantly impact the growth rate of the plant.
As the number of days increases, the GP generally shows a marked increase, especially at higher nutrient concentrations. Likewise, a rise in nutrient solution concentration also notably boosts GP. This multi-dimensional relationship is complex, as indicated by the varying GP values across different combinations of days and concentrations. The interpolant plot visually captures these interactions, providing a more intuitive understanding of how these two parameters affect the growth percentage of WH.
In our analysis, the polynomial model with the configuration 1, 2—referred to as poly model 1, 2—emerged as the most suitable fit for describing the relationship between the GP of WH, the number of days (D), and the concentration of nutrient solution (C). In this model, the polynomial degree for C (normalised by a mean of 69.84 ± 43.54) is one, while that for D (normalised by a mean of 30 ± 21.65) is two. Mathematically, the model is represented as:
f x , y = p 00 + p 10 × x + p 01 × y + p 11 × x × y + p 02 × y 2
The coefficients, along with their 95% confidence intervals, are as follows: p{00} = 281.5 (164, 399), p{10} = 42.25 (−34.72, 119.2), p{01} = 378.9 (302, 455.9), p{11} = 36.99 (−41.56, 115.5), and p{02} = 124.9 (31, 218.8). The model’s goodness of fit is substantiated by an R2 value of approximately 91%. Notably, altering the polynomial degrees for x and y led to decreases in the R2 and adjusted R2 values, affirming the optimality of the poly model 1, 2 for this dataset. Figure 7b visually elucidates this best-fit relationship.

7. Theoretical Methane Production Potentiality

The elemental composition analysis of WH samples collected on day 60 of the experiment included the determination of carbon (C), hydrogen (H), nitrogen (N), sulfur (S), and oxygen (O) content (Supplementary Table S4) to calculate the theoretical biochemical methane potential (BMPTh) of WH using Buswell’s equation. The BMPTh values, as shown in Figure 8, represent the estimated maximum methane production potential for different conditions or samples labelled as C1, C2, C3, C4, and C5. The highest methane yield was observed in Tank C5, reaching 199 mL CH4/gm VS, and this tank also exhibited the highest RGR. Tank C4 followed closely with a methane yield of 185.66 mL CH4/gm VS, while Tanks C3 and C2 had methane yields of 182.47 mL CH4/gm VS and 151.74 mL CH4/gm VS, respectively. Tank C1 had the lowest methane yield, with 144.21 mL CH4/gm VS.
Different studies have been conducted to measure the biogas potentiality from WH. Barua and Kalamdhad [64] investigated biogas production using WH with a heat pre-treatment, reporting a methane yield of 143 ± 14 mL CH4/g VS. In a subsequent study by Barua and Kalamdhad [65], WH biologically pre-treated with Citrobacter werkmanii resulted in a higher methane yield of 156 ± 192 mL CH4/g VS. Barua et al. [66] explored biogas production using a combination of pulverized Dwarf Cavendish peels and water hyacinth, achieving a methane yield of 170 ± 10 mL CH4/g. Daniel et al. [67] investigated biogas production from WH pre-treated with 5% sulfuric acid for 60 min, combined with cow dung and sewage sludge at a 1:1 ratio, resulting in a biogas yield of 155 mL. In another study, Show et al. [68] investigated biogas production from water hyacinth with chemical pre-treatment (5% NaOH), yielding 142.61 mL/gmVs of biogas. The studies demonstrate the biogas potential of WH with pre-treatment, yielding results that are lower than the theoretical methane potential.

8. Future Prospects

The findings of the above study indicate a promising future for WH in addressing nutrient pollution and management of biogas slurry. WH has demonstrated effectiveness in removing nutrients from nutrient-rich mediums, which is particularly relevant for managing biogas waste. The study also highlights the significant presence of CHNS-O in WH, which directly contributes to biogas production. Leveraging WH as a resource for biogas slurry and utilising it as raw material for biogas production holds great potential for cost-effectiveness and nutrient circulation. Integrating WH into biogas production can offer dual benefits, addressing nutrient pollution while harnessing its potential for renewable energy generation. As further research and implementation progress, the prospects of WH in sustainable waste management and biogas utilisation appear promising.

9. Conclusions

This laboratory-based study provided valuable insights into the potential utilisation of WH for phytoremediation, particularly in nutrient-rich biogas slurry at varying concentrations. The results validate the proficiency of aquatic macrophytes, specifically the invasive WH, in nutrient removal from polluted water bodies, making it a promising option for water remediation applications. Over eight weeks, the treatment with WH led to substantial average reductions of 82% for nitrogen (N), 71% for phosphorus (P), and 22% for potassium (K) while also achieving a relative growth rate of 5.55%. Furthermore, the treatment effectively decreased key physiochemical parameters, including pH, total dissolved solids (TDS), hardness, and chemical oxygen demand (COD), by 10.8%, 93.75%, 71.4%, and 86%, respectively. These findings emphasize the potential of WH as a phytoremediation agent for nutrient-rich wastewater. The study also determined the theoretical BMP (BMPth) of water hyacinth using Buswell’s equation, revealing its methane production potential of 199 mL CH4/gm VS. This highlights the multifaceted benefits of WH in wastewater treatment, encompassing both nutrient removal and methane production. The uniqueness of this study is its thorough investigation of the effectiveness of WH in removing nutrients in the specific context of nutrient-rich biogas slurry. This work fills an important gap in current research and provides strong evidence for using WH as an effective agent for treating nutrient-rich wastewater via phytoremediation. Moreover, the determination of BMPth underscores the multifaceted benefits associated with WH utilization, extending beyond remediation to encompass renewable energy generation. Overall, the findings presented in this study hold significant implications for advancing sustainable solutions in water remediation and renewable energy production.

Supplementary Materials

The following supporting information can be downloaded at: https://www.mdpi.com/article/10.3390/su16114450/s1, Table S1: S-Gompertz Model. Table S2: Pearson Correlation. Table S3: Principal Component Analysis. Table S4: Theoretical Biogas Production Potential.

Author Contributions

Conceptualization, Methodology, Formal analysis, Visualization, Writing—original draft: A.K. and K.D.; Software, Validation, Visualization: R.G., A.B., N.G., A.G., and B.K.S.; Project Administration, Funding Acquisition, Writing—review & editing, Investigation: A.B.R.; Investigation, Supervision, Writing—review & editing: S.C., A.K.H., G.N., and S.B. All authors have read and agreed to the published version of the manuscript.

Funding

This research was funded by BEFWAM project: Bioenergy, Fertilizer and Clean Water from Invasive Aquatic macrophytes, grant number BB/S011439/1.

Informed Consent Statement

Not applicable.

Data Availability Statement

Data will be available on request.

Acknowledgments

Apurba Koley, Binoy Kumar Shaw, and Aishiki Banerjee are thankful to the BBSRC, United Kingdom, for receiving funding from the BEFWAM project: Bioenergy, Fertilizer and Clean Water from Invasive Aquatic macrophytes [Grant Ref: BB/S011439/1] for financial support and research fellowship. Nitu Gupta is thankful to the Department of Biotechnology, Govt. of India, for granting the DBT Twinning Project and Research Fellowship [No. BT/PR25738/NER/95/1329/2017 dated 24 December 2018].

Conflicts of Interest

Gaurav Nahar was employed by the company Defiant Renewables Pvt Ltd. The remaining authors declare that the research was conducted in the absence of any commercial or financial relationships that could be construed as a potential conflict of interest.

References

  1. Koley, A.; Bray, D.; Banerjee, S.; Sarhar, S.; Thahur, R.G.; Hazra, A.K.; Mandal, N.C.; Chaudhury, S.; Ross, A.B.; Camargo-Valero, M.A.; et al. Water hyacinth (Eichhornia crassipes) a sustainable strategy for heavy metals removal from contaminated waterbodies. In Bioremediation of Toxic Metals; CRC Press: Boca Raton, FL, USA, 2022; pp. 95–114. [Google Scholar]
  2. Ullah, A.; Mushtaq, H.; Ali, H.; Munis, M.F.H.; Javed, M.T.; Chaudhary, H.J. Diazotrophs-assisted phytoremediation of heavy metals: A novel approach. Environ. Sci. Pollut. Res. 2015, 22, 2505–2514. [Google Scholar] [CrossRef]
  3. Jeong, S.; Moon, H.S.; Nam, K. Increased ecological risk due to the hyperaccumulation of As in Pteris cretica during the phytoremediation of an As-contaminated site. Chemosphere 2015, 122, 1–7. [Google Scholar] [CrossRef]
  4. Ashraf, S.; Ali, Q.; Zahir, Z.A.; Ashraf, S.; Asghar, H.N. Phytoremediation: Environmentally sustainable way for reclamation of heavy metal polluted soils. Ecotoxicol. Environ. Saf. 2019, 174, 714–727. [Google Scholar] [CrossRef] [PubMed]
  5. Ali, H.; Khan, E.; Sajad, M.A. Phytoremediation of heavy metals—Concepts and applications. Chemosphere 2013, 91, 869–881. [Google Scholar] [CrossRef]
  6. Sarwar, N.; Imran, M.; Shaheen, M.R.; Ishaque, W.; Kamran, M.A.; Matloob, A.; Rehim, A.; Hussain, S. Phytoremediation strategies for soils contaminated with heavy metals: Modifications and future perspectives. Chemosphere 2017, 171, 710–721. [Google Scholar] [CrossRef] [PubMed]
  7. Sharma, J.K.; Kumar, N.; Singh, N.P.; Santal, A.R. Phytoremediation technologies and their mechanism for removal of heavy metal from contaminated soil: An approach for a sustainable environment. Front. Plant Sci. 2023, 14, 1076876. [Google Scholar] [CrossRef]
  8. Mazumdar, K.; Das, S. Phytoremediation of Pb, Zn, Fe, and Mg with 25 wetland plant species from a paper mill contaminated site in North East India. Environ. Sci. Pollut. Res. 2015, 22, 701–710. [Google Scholar] [CrossRef] [PubMed]
  9. Sharma, P.; Rai, S.; Gautam, K.; Sharma, S. Phytoremediation strategies of plants: Challenges and opportunities. In Plants and Their Interaction to Environmental Pollution; Elsevier: Amsterdam, The Netherlands, 2023; pp. 211–229. [Google Scholar]
  10. Koley, A.; Ghosh, A.; Banerjee, S.; Gupta, N.; Thakur, R.G.; Show, B.K.; Chaudhury, S.; Hazra, A.K.; Ross, A.B.; Nahar, G.; et al. Phytoremediation of Wastewater Discharged from Paper and Pulp, Textile and Dairy Industries using Water Hyacinth (Eichhornia crassipes). In Bioremediation for Sustainable Environmental Cleanup; CRC Press: Boca Raton, FL, USA, 2024; pp. 238–261. [Google Scholar]
  11. Getahun, S.; Kefale, H. Problem of Water Hyacinth (Eichhornia crassipes (Mart.)) in Lake Tana (Ethiopia): Ecological, Economic, and Social Implications and Management Options. Int. J. Ecol. 2023, 2023, 4618069. [Google Scholar] [CrossRef]
  12. Bajpai, S.; Nemade, P.R. An integrated biorefinery approach for the valorization of water hyacinth towards circular bioeconomy: A review. Environ. Sci. Pollut. Res. 2023, 30, 39494–39536. [Google Scholar] [CrossRef]
  13. Kushwaha, A.; Hans, N.; Upadhyay, N.; Goswami, S.; Pal, P.; Benettayeb, A.; Choi, Y.; Goswami, L.; Kim, B.S. Valorization of water hyacinth: A sustainable route for bioenergy generation and other value-added products. In Bio-Based Materials and Waste for Energy Generation and Resource Management; Elsevier: Amsterdam, The Netherlands, 2023; pp. 1–30. [Google Scholar]
  14. Madikizela, L.M. Removal of organic pollutants in water using water hyacinth (Eichhornia crassipes). J. Environ. Manag. 2021, 295, 113153. [Google Scholar] [CrossRef]
  15. Reddy, K.R.; DeBusk, T.A. State-of-the-art utilization of aquatic plants in water pollution control. Water Sci. Technol. 1987, 19, 61–79. [Google Scholar] [CrossRef]
  16. Erdoğan, E.M.; Özkan, M. Chromium and Lead Phytoremediation with Water Hyacinth and Use of Contaminated Biomass as Feedstock for Biofuel Production. Biomass Convers. Biorefin. 2023, 1–14. [Google Scholar] [CrossRef]
  17. Das, E.J.; Bhuiyan, M.A.R.; Hasan, M.M. Implementation of water hyacinth (Eichhornia crassipes) and water lettuce (Pistia stratiotes) in the re-treatment of conventionally treated pharmaceutical wastewater: A case study of Radiant Pharmaceuticals Limited, Dhaka, Bangladesh. Environ. Monit. Assess. 2023, 195, 1210. [Google Scholar] [CrossRef] [PubMed]
  18. Muthukumaran, M. Aquatic plant remediation to control pollution. In Biological Approaches to Controlling Pollutants; Woodhead Publishing: Sawston, UK, 2022; pp. 365–397. [Google Scholar]
  19. Ibrahim, H.S.; Ammar, N.S.; Soylak, M.; Ibrahim, M. Removal of Cd (II) and Pb (II) from aqueous solution using dried water hyacinth as a biosorbent. Spectrochim. Acta Part A Mol. Biomol. Spectrosc. 2012, 96, 413–420. [Google Scholar] [CrossRef] [PubMed]
  20. Fedler, C.B.; Duan, R. Biomass production for bioenergy using recycled wastewater in a natural waste treatment system. Resour. Conserv. Recycl. 2011, 55, 793–800. [Google Scholar] [CrossRef]
  21. Ansari, A.A.; Naeem, M.; Gill, S.S.; AlZuaibr, F.M. Phytoremediation of contaminated waters: An eco-friendly technology based on aquatic macrophytes application. Egypt. J. Aquat. Res. 2020, 46, 371–376. [Google Scholar] [CrossRef]
  22. Pang, Y.L.; Quek, Y.Y.; Lim, S.; Shuit, S.H. Review on phytoremediation potential of floating aquatic plants for heavy metals: A promising approach. Sustainability 2023, 15, 1290. [Google Scholar] [CrossRef]
  23. Aoyama, I.; Nishizaki, H. Uptake of nitrogen and phosphate, and water purification by water hyacinth Eichhornia crassipes (Mart.) Solms. Water Sci. Technol. 1993, 28, 47–53. [Google Scholar] [CrossRef]
  24. Malik, A. Environmental challenge vis a vis opportunity: The case of water hyacinth. Environ. Int. 2007, 33, 122–138. [Google Scholar] [CrossRef]
  25. Chaudhuri, S.R.; Salodkar, S.; Sudarshan, M.; Mukherjee, I.; Thakur, A.R. Role of water hyacinth-mediated phytoremediation in wastewater purification at East Calcutta wetland. Environ. Sci. 2008, 5, 53–62. [Google Scholar] [CrossRef]
  26. Zheng, J.; Chan, Z.; Chen, L.; Zhu, P.; Shen, J. Feasibility studies on N and P removal using water hyacinth in Taihu Lake region. Jiangsu Agric. Sci. 2008, 3, 247–250. [Google Scholar]
  27. Fox, L.J.; Struik, P.C.; Appleton, B.L.; Rule, J.H. Nitrogen phytoremediation by water hyacinth (Eichhornia crassipes (Mart.) Solms). Water Air Soil Pollut. 2008, 194, 199–207. [Google Scholar] [CrossRef]
  28. Liao, S.W.; Chang, W.L. Heavy metal phytoremediation by water hyacinth at constructed wetlands in Taiwan. J. Aquat. Plant Manag. 2004, 42, 60–68. [Google Scholar]
  29. Fazal, S.; Zhang, B.; Mehmood, Q. Biological treatment of combined industrial wastewater. Ecol. Eng. 2015, 84, 551–558. [Google Scholar] [CrossRef]
  30. Buhari, J.; Hasan, H.A.; Kurniawan, S.B.; Abdullah, S.R.S.; Othman, A.R. Future and challenges of co-biofilm treatment on ammonia and Bisphenol A removal from wastewater. J. Water Process Eng. 2023, 54, 103969. [Google Scholar] [CrossRef]
  31. Kumar, S.; Malav, L.C.; Malav, M.K.; Khan, S.A. Biogas slurry: Source of nutrients for eco-friendly agriculture. Int. J. Extens. Res. 2015, 2, 42–46. [Google Scholar]
  32. Musse, Z.A.; Yoseph Samago, T.; Beshir, H.M. Effect of liquid bio-slurry and nitrogen rates on soil physico-chemical properties and quality of green bean (Phaseolus vulgaris L.) at Hawassa Southern Ethiopia. J. Plant Interact. 2020, 15, 207–212. [Google Scholar] [CrossRef]
  33. Tang, J.; Yin, J.; Davy, A.J.; Pan, F.; Han, X.; Huang, S.; Wu, D. Biogas slurry as an alternative to chemical fertilizer: Changes in soil properties and microbial communities of fluvo-aquic soil in the North China Plain. Sustainability 2022, 14, 15099. [Google Scholar] [CrossRef]
  34. Malhotra, M.; Aboudi, K.; Pisharody, L.; Singh, A.; Banu, J.R.; Bhatia, S.K.; Varjani, S.; Kumar, S.; González-Fernández, C.; Singh, R. Biorefinery of anaerobic digestate in a circular bioeconomy: Opportunities, challenges and perspectives. Renew. Sustain. Energy Rev. 2022, 166, 112642. [Google Scholar] [CrossRef]
  35. Feng, L.; Guldberg, L.B.; Hansen, M.J.; Ma, C.; Ohrt, R.V.; Møller, H.B. Impact of slurry removal frequency on CH4 emission and subsequent biogas production; a one-year case study. Waste Manag. 2022, 149, 199–206. [Google Scholar] [CrossRef]
  36. Ke, L.; Liu, X.; Du, B.; Wang, Y.; Zheng, Y.; Li, Q. Component analysis and risk assessment of biogas slurry from biogas plants. Chin. J. Chem. Eng. 2022, 44, 182–191. [Google Scholar] [CrossRef]
  37. Palmer-Felgate, E.J.; Mortimer, R.J.; Krom, M.D.; Jarvie, H.P. Impact of point-source pollution on phosphorus and nitrogen cycling in stream-bed sediments. Environ. Sci. Technol. 2010, 44, 908–914. [Google Scholar] [CrossRef]
  38. Selvaraj, P.S.; Periasamy, K.; Suganya, K.; Ramadass, K.; Muthusamy, S.; Ramesh, P.; Palanisami, T. Novel resources recovery from anaerobic digestates: Current trends and future perspectives. Crit. Rev. Environ. Sci. Technol. 2022, 52, 1915–1999. [Google Scholar] [CrossRef]
  39. Koley, A.; Mukhopadhyay, P.; Gupta, N.; Singh, A.; Ghosh, A.; Show, B.K.; GhoshThakur, R.; Chaudhury, S.; Hazra, A.K.; Balachandran, S. Biogas production potential of aquatic weeds as the next-generation feedstock for bioenergy production: A review. Environ. Sci. Pollut. Res. 2023, 30, 111802–111832. [Google Scholar] [CrossRef]
  40. Sharma, R.; Saini, H.; Paul, D.R.; Chaudhary, S.; Nehra, S.P. Removal of organic dyes from wastewater using Eichhornia crassipes: A potential phytoremediation option. Environ. Sci. Pollut. Res. 2021, 28, 7116–7122. [Google Scholar] [CrossRef] [PubMed]
  41. Li, F.; He, X.; Srishti, A.; Song, S.; Tan, H.T.W.; Sweeney, D.J.; Ghosh, S.; Wang, C.H. Water hyacinth for energy and environmental applications: A review. Bioresour. Technol. 2021, 327, 124809. [Google Scholar] [CrossRef]
  42. Basu, A.; Hazra, A.K.; Chaudhury, S.; Ross, A.B.; Balachandran, S. State of the art research on sustainable use of water hyacinth: A bibliometric and text mining analysis. Informatics 2021, 8, 38. [Google Scholar] [CrossRef]
  43. Gupta, N.; Banerjee, S.; Koley, A.; Basu, A.; Gogoi, N.; Hoque, R.R.; Mandal, N.C.; Balachandran, S. Fungal Strategies for the Remediation of Polycyclic Aromatic Hydrocarbons. In Bioremediation for Sustainable Environmental Cleanup; CRC Press: Boca Raton, FL, USA, 2024; pp. 86–108. [Google Scholar]
  44. Banerjee, S.; Gupta, N.; Pramanik, K.; Gope, M.; GhoshThakur, R.; Karmakar, A.; Gogoi, N.; Hoque, R.R.; Mandal, N.C.; Balachandran, S. Microbes and microbial strategies in carcinogenic polycyclic aromatic hydrocarbons remediation: A systematic review. Environ. Sci. Pollut. Res. 2024, 31, 1811–1840. [Google Scholar] [CrossRef] [PubMed]
  45. Bagdi, T.; Ghosh, S.; Sarkar, A.; Hazra, A.K.; Balachandran, S.; Chaudhury, S. Evaluation of research progress and trends on gender and renewable energy: A bibliometric analysis. J. Clean. Prod. 2023, 423, 138654. [Google Scholar] [CrossRef]
  46. Islam, M.R.; Rahman, S.M.E.; Rahman, M.M.; Oh, D.H.; Ra, C.S. The effects of biogas slurry on the production and quality of maize fodder. Turk. J. Agric. For. 2010, 34, 91–99. [Google Scholar] [CrossRef]
  47. Yu, F.B.; Luo, X.P.; Song, C.F.; Zhang, M.X.; Shan, S.D. Concentrated biogas slurry enhanced soil fertility and tomato quality. Acta Agric. Scand. B Soil Plant Sci. 2010, 60, 262–268. [Google Scholar]
  48. Liang, F.; Xu, L.; Ji, L.; He, Q.; Wu, L.; Yan, S. A new approach for biogas slurry disposal by adopting CO2-rich biogas slurry as the flower fertilizer of Spathiphyllum: Feasibility, cost and environmental pollution potential. Sci. Total Environ. 2021, 770, 145333. [Google Scholar] [CrossRef] [PubMed]
  49. ASTM, E. 647; Annual Book of ASTM Standards. ASTM: Philadelphia, PA, USA, 1983; pp. 710–730.
  50. APHA (American Public Health Association). Standard Methods for the Examination of Water and Waste Water, 19th ed.; American Public Health Association Inc.: New York, NY, USA, 1995; p. 1193. [Google Scholar]
  51. Buswell, A.M.; Mueller, H.F. Mechanism of methane fermentation. Ind. Eng. Chem. 1952, 44, 550–552. [Google Scholar] [CrossRef]
  52. Quintana-Najera, J.; Blacker, A.J.; Fletcher, L.A.; Bray, D.G.; Ross, A.B. The Influence of Biochar Augmentation and Digestion Conditions on the Anaerobic Digestion of Water Hyacinth. Energies 2022, 15, 2524. [Google Scholar] [CrossRef]
  53. Bray, D.G.; Nahar, G.; Grasham, O.; Dalvi, V.; Rajput, S.; Dupont, V.; Camargo-Valero, M.A.; Ross, A.B. The Cultivation of Water Hyacinth in India as a Feedstock for Anaerobic Digestion: Development of a Predictive Model for Scaling Integrated Systems. Energies 2022, 15, 9599. [Google Scholar] [CrossRef]
  54. Saha, P.; Shinde, O.; Sarkar, S. Phytoremediation of industrial mines wastewater using water hyacinth. Int. J. Phytoremediation 2017, 19, 87–96. [Google Scholar] [CrossRef] [PubMed]
  55. Mahmood, T.; Malik, S.A.; Hussain, S.T.; Aamir, S. Metallic phytoremediation and extraction of nanoparticles. Int. J. Phys. Sci. 2012, 7, 6105–6116. [Google Scholar]
  56. Panneerselvam, B.; Priya, K.S. Phytoremediation potential of water hyacinth in heavy metal removal in chromium and lead contaminated water. Int. J. Environ. Anal. Chem. 2023, 103, 3081–3096. [Google Scholar] [CrossRef]
  57. Kumar, V.; Singh, J.; Chopra, A.K. Assessment of phytokinetic removal of pollutants of paper mill effluent using water hyacinth (Eichhornia crassipes [Mart.] Solms). Environ. Technol. 2018, 39, 2781–2791. [Google Scholar] [CrossRef]
  58. Rezania, S.; Fadhil, M.; Din, M.; Ponraj, M.; Sairan, F.M.; Fatimah, S.; Kamaruddin, B. Nutrient uptake and wastewater purification with Water Hyacinth and its effect on plant growth in batch system. J. Environ. Treat. Tech. 2013, 1, 81–85. [Google Scholar]
  59. Anipeddi, M.; Begum, S.; Anupoju, G.R. Integrated technologies for the treatment of and resource recovery from sewage and wastewater using water hyacinth. In Biomass, Biofuels, Biochemicals; Elsevier: Amsterdam, The Netherlands, 2022; pp. 293–314. [Google Scholar]
  60. Jayaweera, M.W.; Kasturiarachchi, J.C. Removal of nitrogen and phosphorus from industrial wastewaters by phytoremediation using water hyacinth (Eichhornia crassipes (Mart.) Solms). Water Sci. Technol. 2004, 50, 217–225. [Google Scholar] [CrossRef] [PubMed]
  61. Singh, J.; Kumar, P.; Eid, E.M.; Taher, M.A.; El-Morsy, M.H.; Osman, H.E.; Al-Bakre, D.A.; Kumar, V. Phytoremediation of nitrogen and phosphorus pollutants from glass industry effluent by using water hyacinth (Eichhornia crassipes (Mart.) Solms): Application of RSM and ANN techniques for experimental optimization. Environ. Sci. Pollut. Res. 2023, 30, 20590–20600. [Google Scholar] [CrossRef] [PubMed]
  62. Mayo, A.W.; Hanai, E.E. Modeling phytoremediation of nitrogen-polluted water using water hyacinth (Eichhornia crassipes). Phys. Chem. Earth, Parts a/b/c 2017, 100, 170–180. [Google Scholar] [CrossRef]
  63. Fang, Y.Y.; Yang, X.E.; Chang, H.Q.; Pu, P.M.; Ding, X.F.; Rengel, Z. Phytoremediation of nitrogen-polluted water using water hyacinth. J. Plant Nutr. 2007, 30, 1753–1765. [Google Scholar] [CrossRef]
  64. Barua, V.B.; Kalamdhad, A.S. Biochemical methane potential test of untreated and hot air oven pretreated water hyacinth: A comparative study. J. Clean. Prod. 2017, 166, 273–284. [Google Scholar] [CrossRef]
  65. Barua, V.B.; Kalamdhad, A.S. Anaerobic biodegradability test of water hyacinth after microbial pretreatment to optimise the ideal F/M ratio. Fuel 2018, 217, 91–97. [Google Scholar] [CrossRef]
  66. Barua, V.B.; Rathore, V.; Kalamdhad, A.S. Anaerobic co-digestion of water hyacinth and banana peels with and without thermal pretreatment. Renew Energy 2019, 134, 103–112. [Google Scholar] [CrossRef]
  67. Daniel, F.; Sekar, M.; Gavurová, B.; Govindasamy, C.; Boomadevi, P.; Praveenkumar, T.R. Recovering of biogas and nutrients via novel anaerobic co-digestion of pre-treated water hyacinth for the enhanced biogas production. Environ. Res. 2023, 231, 116216. [Google Scholar] [CrossRef]
  68. Show, B.K.; Shivakumaran, G.; Koley, A.; Ghosh, A.; Chaudhury, S.; Hazra, A.K.; Balachandran, S. Effect of thermal and NaOH pretreatment on water hyacinth to enhance the biogas production. Environ. Sci. Pollut. Res. 2023, 30, 120984–120993. [Google Scholar] [CrossRef]
Figure 1. Bibliometric analysis using VOS Viewer.
Sustainability 16 04450 g001
Figure 2. (a). Experimental setup for measurement of nutrient removal by WH. (b). Experimental setup for measurement of the biomass quality.
Sustainability 16 04450 g002
Figure 3. S-Gompertz model.
Sustainability 16 04450 g003
Figure 4. Removal of different physiochemical properties of biogas slurry using WH.
Sustainability 16 04450 g004
Figure 5. Pearson correlation analysis.
Sustainability 16 04450 g005
Figure 6. Plot of PCA loadings scores.
Sustainability 16 04450 g006
Figure 7. Establishment of mathematical model. (a): Interpolant Model; (b): visual elucidate of best-fit relationship.
Sustainability 16 04450 g007aSustainability 16 04450 g007b
Figure 8. Theoretical methane production potentiality.
Sustainability 16 04450 g008
Table 1. Composition of biogas slurry according to the current study and previous studies.
Current StudyPrevious Studies
Characteristics [46][47][48]
Total Nitrogen (N)92 ± 6 mg/L5.88 mg/kg0.71 gm/L1255.05 ± 5.41 NH4+- N mg/L
Total Phosphorus 15.23 ± 2 mg/L2.72 mg/kg15.5 gm/L64.01 ± 1.27 mg/L
Total Potassium (K)1600 mg/L1.33 mg/kg2.1 gm/L3006.81 ± 15.73 mg/L
pH7.537.8 7.80 ± 0.07
Electrical Conductivity18.6 dS/m-30 dS/m5.67 ± 0.13 mS/cm
Chemical Oxygen Demand382.52 mg/L-25,400 mg/L-
TS (%)1.85
VS (%)0.97
Disclaimer/Publisher’s Note: The statements, opinions and data contained in all publications are solely those of the individual author(s) and contributor(s) and not of MDPI and/or the editor(s). MDPI and/or the editor(s) disclaim responsibility for any injury to people or property resulting from any ideas, methods, instructions or products referred to in the content.

