Article

Effects of Rainfall Intensity and Slope on Infiltration Rate, Soil Losses, Runoff and Nitrogen Leaching from Different Nitrogen Sources with a Rainfall Simulator

by
Mzwakhile Petros Zakhe Simelane
,
Puffy Soundy
and
Martin Makgose Maboko
*
Department of Crop Sciences, Tshwane University of Technology, Private Bag X680, Pretoria 0001, South Africa
*
Author to whom correspondence should be addressed.
Sustainability 2024, 16(11), 4477; https://doi.org/10.3390/su16114477
Submission received: 8 April 2024 / Revised: 21 May 2024 / Accepted: 22 May 2024 / Published: 24 May 2024
(This article belongs to the Section Sustainable Agriculture)

Abstract

:
The combined effects of slope gradient, rainfall intensity, and nitrogen fertilizer source on infiltration, runoff, soil loss, and nitrogen (N) leaching in agricultural areas are not thoroughly understood, despite their critical importance in sustainable agriculture. Previous studies have focused on these factors individually, leaving a significant gap in knowledge regarding their synergistic impact. Investigating the interplay between slope gradients, rainfall intensities, and N fertilizer sources is vital to developing effective soil and water conservation strategies and implementing sustainable agricultural practices. This study is comprised of two experiments. Experiment 1 was designed as a 3 × 2 × 3 factorial arrangement, incorporating three levels of rainfall intensity (RI) (45, 70, and 100 mm/h), two slope gradients (5 and 8°), and three soil types (sandy loam, silt loam, and clay loam), aimed at assessing runoff, infiltration, and soil loss. Experiment 2, laid out as 3 × 2 × 3 × 3 factorial, expanded on this, adding N fertilizer source (urea, CaCN2, and limestone ammonium nitrate (LAN) at 130 kg/ha N) and assessing N leaching alongside the previous metrics. Both experiments used a rotating disc rainfall simulator and were replicated four times. Results revealed that steeper slopes (8°) led to increased runoff and soil loss, impeding infiltration, while gentler slopes (5°) facilitated greater infiltration and minimized soil loss. Rainfall intensity played a significant role, with 70 mm/h/5° combinations promoting higher infiltration rates (48.14 mm/h) and 100 mm/h/8° resulting in lower rates (37.07 mm/h for sandy loam and silt loam, 26.09 mm/h for clay loam). Nitrogen leaching varied based on N source; urea at 130 kg/ha N led to higher losses (7.2% in sandy loam, 6.9% in silt loam, 6.5% in clay loam), followed by LAN (6.9% in sandy loam, 6.7% in silt loam, 6.3% in clay loam) while CaCN2 at the same rate resulted in lower N losses (6.4% in sandy soil, 4.4% in silt loam, 4.2% in clay soil). This research highlights the critical need to consider both slope gradient and rainfall intensity in conjunction with appropriate nitrogen fertilizer sources when developing strategies to mitigate soil erosion and nutrient loss in agricultural settings.

1. Introduction

The intricate interplay of natural factors, such as slope gradient and rainfall intensity, profoundly shapes landscapes and ecosystems, significantly influencing soil behaviour [1]. This understanding is pivotal for scientists, agriculturists, and policymakers. Recent research delves into the impact of slope gradient and rainfall intensity on various soil processes, including infiltration rate, soil losses, runoff, and nitrogen leaching [2]. Rainfall simulators in innovative experiments replicate real-world conditions, providing insights into soil dynamics under different gradients and rainfall intensities. Key variables influencing soil nutrient loss encompass rainfall intensity, slope, farming practice, and vegetation cover [3,4,5,6].
Rainfall intensity’s impact on surface and subsurface runoff, as well as nutrient loss, remains not entirely clear [7]. While increased rainfall intensity can enhance infiltration due to soil surface heterogeneities [2,8], soil crust formation may reduce infiltration [9]. Patterns with maximum intensity at the storm’s end can lead to higher runoff and soil loss [10]. Kinetic energy, influencing soil processes, does not exhibit a linear relationship with rainfall intensity, resulting in varied effects on the soil surface, even with the same average intensity [11].
Field tests by Dunkerley [12] and Assouline and Ben-Hur [9] highlight that rainfall patterns affect infiltration, runoff, and soil losses differently. Intense rainfall heightens vulnerability to soil erosion, while lower-intensity rainfall results in minimal erosion [13]. Soil type also plays a significant role in nitrogen leaching, with higher sand content associated with increased leaching due to larger pore spaces [14]. Conversely, clay or organic-rich soils retain nitrogen better, mitigating leaching [15,16].
Soil erosion’s detrimental consequences on agricultural land, exacerbated by increased nitrogen fertilizer use, pose challenges to soil productivity [2,17,18]. Nitrogen loss into water bodies, a cause of eutrophication, underscores the need for effective management strategies [19,20,21].
Previous research emphasizes the impact of rainfall patterns on runoff and soil erosion processes [22,23,24]. The synergistic effects of slope gradient, rainfall intensity, and nitrogen fertilizer level on infiltration, runoff, soil loss, and nitrogen leaching are, however, not fully elucidated. Investigating these interactions is crucial for developing effective soil and water conservation strategies and advancing sustainable agriculture. In addressing this knowledge gap, our study aimed to comprehensively explore these factors’ collective impact and provide valuable insights for sustainable agricultural practices.
Slow-release fertilizers, such as calcium cyanamide (CaCN2), also known as Perlka, are gaining prominence in mitigating nitrogen loss [25]. Studies show that CaCN2 reduces nitrogen leaching more effectively than conventional fertilizers [26,27]. Incorporating these fertilizers aligns with sustainable farming, offering a balance between productivity and environmental conservation [28]. The study aimed to achieve the following objectives: (1) assess the impact of rainfall intensity and slope on various soil types on soil loss, runoff pattern, and soil infiltration rate; and (2) explore the effects of rainfall intensity, slope, soil type, and N source on nitrogen leaching. The findings of this research are anticipated to contribute to the establishment of a robust theoretical framework for comprehending watershed hydrological processes.

2. Materials and Methods

A laboratory experiment was carried out from 5 October to 5 December 2020 using a rainfall simulator at the Agricultural Research Council-Soil, Climate, and Water, located at 600 Belvedere Street, Arcadia, Pretoria (25°44′19.4″ S, 28°12′26.4″ E, altitude 1339 m).

2.1. Soil Sampling

Soil used in this study was part of the soil used by Mrubata et al. [29]. To collect soil samples while preserving the integrity of the topsoil, sampling trays were fabricated using mild steel. These trays were constructed from a 2 mm thick metal sheet, which was bent to form trays measuring 350 × 500 × 50 mm in dimensions. Samples of soil were collected from the surface layer (0–20 cm) and left to air-dry before being sifted through a 2 mm sieve [29]. Three soil samples were collected from three sites: Group 1-Irene (sandy loamy soil), Group 2-Maubane, (silty loamy soil), and Group 3-Ondersteport (clay loamy soil) (Table 1). The soil samples were transported to the laboratory in insulated cooler boxes and stored at temperatures equal to or below 4 °C. The soil samples were collected from a depth equivalent to the 5 cm depth of soil utilized in the runoff boxes or simulator tray. The soil selection and grouping were primarily determined by variations in texture, specifically clay content. Group 1 comprised soils with low clay content, Group 2 consisted of soils with medium clay content, and Group 3 comprised soils with a higher percentage of clay.

2.2. Soil Characterization and Water-Holding Characteristics

The soil samples underwent thorough characterization using established analytical techniques. The pH of each soil type was assessed by creating a 1:1.25 soil-to-water suspension, which was then analyzed using a laboratory pH meter, revealing distinct pH levels indicative of varying soil types (Table 2).
Particle size distribution, a crucial factor influencing water retention and movement within the soil profile, was assessed using the hydrometer method [30]. This method allows for the determination of the proportions of silt, sand, and clay fractions, contributing to a comprehensive understanding of soil texture and its implications for water holding capacity.
Aggregate stability, vital for water infiltration and retention, was evaluated utilizing the fast-wetting treatment [31]. Five grams of homogenized soil were placed in deionized water for 10 min to replicate rapid wetting conditions. Subsequently, the soil was transferred to a pre-immersed 53 μm sieve for fraction size distribution analysis [30]. The distribution of soil aggregates across different size fractions was assessed using dry sieving with a series of six sieves (with mesh sizes of 2000, 1000, 500, 200, 100, and 53 μm) [29]. The mean weight diameter, which serves as an indicator of aggregate stability, was computed by considering the remaining mass fraction on each sieve and the average diameter between adjacent sieves. In addition to assessing physical properties, the soil’s ability to retain cations, which is a crucial factor affecting nutrient availability and soil structure stability, was evaluated using the 1 M neutral ammonium acetate method [32]. Cation exchange capacity (CEC) was assessed through a method involving the extraction of cations from soil samples using a 1 M ammonium acetate solution at pH 7 [32]. After vigorous agitation for two hours, the solution was separated from the soil solids via centrifugation, and the concentration of cations was determined using an Inductively Coupled Plasma Optical Emission Spectroscopy (ICP-OES) [30]. This technique offers valuable insights into the soil’s capacity to retain crucial nutrients and uphold its structural integrity. By integrating these methodologies, a comprehensive understanding of soil properties, including pH, particle size distribution, aggregate stability, and cation exchange capacity, can be obtained. This understanding is crucial for assessing water-holding characteristics and overall soil health.

2.3. Rainfall Simulation

The investigation into soil behavior under diverse conditions employed a rigorous methodology, consisting of two distinct experiments. The initial experiment followed a structured 3 × 2 × 3 factorial design, analyzing the effects of three variables: rainfall intensity (at 45, 70, and 100 mm/h), slope gradient (5° and 8°), and soil type (sandy loam, silt loam, and clay loam). The chosen rainfall intensities were aimed at simulating realistic scenarios to assess soil behavior under varying conditions, facilitating the study’s objective of understanding the effects of rainfall on runoff, erosion, and soil loss. This investigation encompassed crucial phenomena such as infiltration rate, runoff, erosion, and soil loss. Subsequently, a second experiment augmented these factors by introducing an additional variable, nitrogen fertilizer source, and evaluating nitrogen leaching alongside the previously examined parameters. The procedure for applying nitrogen fertilizers involves careful planning and execution. It typically occurs after initial soil investigations, ensuring a baseline understanding of soil conditions. Notably, three distinct nitrogen sources were utilized: calcium cyanamide (CaCN2) at 19.8% nitrogen concentration, urea at 40% nitrogen concentration, and limestone ammonium nitrate (LAN) at 28% nitrogen concentration, each applied at a rate of 130 kg/ha. The experimental design for the second phase extended to a 3 × 2 × 3 × 3 factorial layout, replicated four times. Detailed records were kept to track fertilizer type, application timing, and plot allocation. Monitoring follows application to assess nitrogen leaching and its effects on soil behavior, contributing valuable insights to agricultural practices.
The experimentation was conducted using a laboratory-scale rainfall simulator housed at the Agricultural Research Council – Soil, Climate, and Water. This simulator closely adhered to the design framework outlined in Figure 1 by Morin et al. [33], featuring critical components such as the applicator and the soil box carousel. The applicator mechanism comprised a water pump supplying water to a rotating nozzle, in conjunction with a metal disc possessing adjustable apertures. Water droplets released from the rotating nozzle were precisely directed onto the soil boxes positioned beneath it.
In both experiments, a rotating disc rainfall simulator facilitated the imposition of storms with varying intensities and slope gradients on three distinct soil types. Each rain-simulator tray measured 60 cm × 30 cm × 5 cm and accommodated up to 5 kg of soil, with a maximum applied intensity of 150 mm/h. These trays were equipped with perforations for water collection and lined with selectively permeable cloth to prevent soil passage, crucial for maintaining experimental integrity. Upon soil processing, the soil was meticulously deposited into the trays, ensuring full capacity to enable unobstructed runoff. Pre-wetting of the soil with tap water at a conductivity of 0.7 dS/m preceded exposure to rainfall.
In Experiment 1, rainfall was applied in triplicate at two slope gradients (5° and 8°) and three intensities (45, 70, and 100 mm/h), with a consistent 20-min duration to synchronize with the final infiltration rate. The decision to employ slightly elevated intensities in this study was informed by considerations of projected climate change scenarios, distinguishing it from previous research endeavors.
Both experiments incorporated a comprehensive suite of measurements to fulfill their respective objectives. Experiment 1 specifically focused on infiltration rate, runoff, erosion, and soil loss, while Experiment 2 expanded the scope by incorporating assessments of nitrogen leaching alongside these parameters. Different nitrogen fertilizer sources (i.e., calcium cyanamide, urea, limestone ammonium nitrate) were compared to assess their impacts on nitrogen leaching. Additionally, variations in soil types, slope gradients, and rainfall intensities were examined to understand how these factors affect nitrogen leaching. The objective was to unravel the complex interplay between nitrogen fertilizers and soil-water dynamics, guiding sustainable agricultural practices.
In an assessment of infiltration rate, a graduated cylinder served as the primary instrument for quantification. This entailed the periodic measurement of water ingress at 2-min intervals throughout the simulation duration. The graduated cylinder facilitated precise determination of the volume of water infiltrating into the soil over time, thereby yielding insights into the soil’s moisture absorption and retention capabilities under diverse environmental conditions.
For the collection of runoff and sediment yield, a beaker was employed as the container. Runoff, representing the liquid phase, was directed into the beaker during the simulation. Subsequently, the accumulated runoff was meticulously decanted from the beaker, thereby separating it from any suspended sediment. The liquid phase was then quantified to determine the volume of runoff generated during the experimental procedure, thereby contributing to the assessment of soil erosion and surface water runoff dynamics.
To quantify soil loss, a comprehensive post-simulation methodology was implemented [34]. Following the conclusion of the simulation period, the mass of sediment accrued from each experimental plot was meticulously assessed. This encompassed the precise collection and extraction of sediment from the experimental setup. Subsequently, the gathered sediment underwent a drying process at a standardized temperature of 105 °C for 24 h. This procedure ensured the elimination of residual moisture, facilitating an accurate evaluation of the mass of soil eroded during the simulation. Through the adoption of this rigorous methodology, researchers [22,29,35] were able to effectively delineate the erosive potential of the soil under investigation and elucidate the influence of various factors such as rainfall intensity, slope gradient, and soil composition on soil stability and erosion susceptibility.
The concentration of total nitrogen (NO3-N and NH4-N) in percolation water was determined using a continuous-flow nitrogen analyzer (SKALAR, San Plus System, Breda, The Netherlands). Soil loss calculations were standardized to express values in kilograms per hectare, taking into account the area of the sampling tray.
The collected data underwent statistical analysis using a three-way analysis of variance (ANOVA) conducted with JMP version 14 statistics software (SAS Institute Inc., Cary, NC, USA, 2015). Mean differences were determined using Fischer’s protected least significant differences (LSD) at a confidence level of 95% (SAS Institute Inc., Cary, NC, USA, 2015).

3. Results and Discussion

3.1. Effect of Rainfall Intensity, Slope Gradient and Soil Property on Infiltration Rate

The study revealed significant variations in infiltration rates influenced by soil type, rainfall intensity (RI), and slope gradient (p < 0.001), as well as their interactions (soil type × RI × slope) (Table 3). The findings indicated that sandy soils generally exhibited higher infiltration rates compared to other soil types, with specific combinations showing exceptions.
Infiltration rates were notably influenced by higher rainfall intensities, with the most pronounced effect observed at an intensity of 70 mm/h on a 5° slope, where sandy soil exhibited the highest infiltration rate (48.14 mm/h); clay loam exhibited the lowest rate at 100 mm/h on a 5° slope (24.64 mm/h) (Figure 2). This phenomenon is attributed to the unsteady conditions arising from the continuous formation and destruction processes during seal development [36]. Under these unsteady conditions, the infiltration rate increases with higher rainfall intensity. According to Assouline and Ben-Hur [9], high-intensity rainfall diminishes the perpendicular component of raindrop impact, thereby reducing seal development. During the infiltration of water into the soil on a gentle slope, water tends to move more slowly across the surface, allowing more time for infiltration. This increased contact time between the water and the soil surface enhances the opportunity for the soil to absorb the water [37]. On a steep slope, water moves quickly due to gravity, reducing the contact time with the soil surface and thereby limiting infiltration. Much of the water tends to run off rather than soak [37].
The study underscored that the impact of rainfall intensity on infiltration varied across soil types. Sandy loam demonstrated the highest infiltration rates under varying conditions, followed by silty loam and clay soil (Figure 2). This pattern can be attributed to the higher sand content in these soils, which is associated with larger pore spaces that facilitate faster water infiltration.
Steeper slopes, such as those with an 8° gradient, generally led to reduced infiltration rates and increased runoff (Figure 2). This observation is consistent with findings from Xu [38], who reported that steeper slopes decrease infiltration rates, thereby increasing runoff, soil erosion, and nutrient loss, particularly nitrogen. On the other hand, Shmuel and Meni [39] found that steeper slopes could result in higher infiltration rates under conditions of high rainfall intensity, although they noted a decrease in cumulative runoff with increasing slope, coupled with an increase in soil erosion.
These results corroborate and extend the understanding from previous studies. The influence of soil type, rainfall intensity, and slope gradient on infiltration has been extensively documented. For instance, Lei [40] emphasized that soil texture and structure critically determine infiltration capacity, with sandy soils allowing for rapid infiltration due to their large pore spaces. In contrast, clayey soils, with their smaller pore spaces, exhibit lower infiltration rates and higher surface runoff.
The interaction between rainfall intensity and slope gradient is complex. While Xu [38] highlighted the negative impact of steeper slopes on infiltration, Li [39] findings suggest that under certain conditions, such as high rainfall intensity, infiltration might increase on steeper slopes due to increased water movement into the soil profile before runoff initiation. This divergence in findings highlights the necessity of considering specific environmental contexts and soil characteristics when assessing infiltration dynamics.
The current study enhances our understanding by providing detailed quantitative insights into how these factors interact to influence infiltration rates. The data illustrate the nuanced interplay between soil properties, rainfall intensity, and slope gradient, reinforcing the need for tailored land management practices that account for these variables to mitigate runoff and soil erosion effectively. This synthesis of current and new knowledge underscores the importance of integrating multiple factors in hydrological studies to better predict and manage water infiltration and soil conservation in various landscapes.

3.2. Effects of Rainfall Intensity (RI), Slope Gradient and Soil Property on Runoff

Table 4 illustrates how the intensity of rainfall, slope gradient, and soil type had distinct impacts on runoff. The interaction between Soil type × RI × Slope effects was statistically significant (p < 0.004).
The findings in Figure 3 indicate that the lowest runoff for all soil types was observed at the lowest intensity of 45 mm/h. Conversely, at an intensity of 70 mm/h, all soils exhibited their highest runoff amounts, with clay loam reaching a significantly higher value of 1836 mL, which was much higher than that of silt loam and sandy loam soils. The sandy loam soil recorded the lowest runoff. Additionally, the effect of slope gradient was minimal at the highest intensity of 100 mm/h across all soil types.
These results are consistent with the findings of Lei et al. [40], who observed a consistent increase in sediment yield as the slope steepness increased from 5° to 25°. While the trend for runoff yield was less pronounced, it also showed an increase with higher rainfall intensities on the same slope. Specifically, Lei et al. reported that when the slope increased from 5° to 25°, the runoff yield rose by 30.644, 24.008, 31.741, and 8.373 mL under rainfall intensities of 60, 75, 105, and 120 mm/h, respectively. This upward trend in runoff yield with increasing rainfall intensity and slope steepness supports the current study observation that higher rainfall intensities result in greater runoff, particularly for clay loam soils, which demonstrate a significant response to increased rainfall intensity.
In this study, the impact of slope on runoff was minimal at the highest intensity (100 mm/h) for all soils, except sandy loam. Steeper slopes (5°) generated more runoff, attributed to faster downhill water flow, increasing runoff. A 5° slope exhibited a higher infiltration rate, enabling more water absorption before runoff. Overall, steeper slopes lead to increased runoff. Clay loam soil showed higher runoff potential compared to silty loam and sandy loam soils due to slower water infiltration and faster saturation.

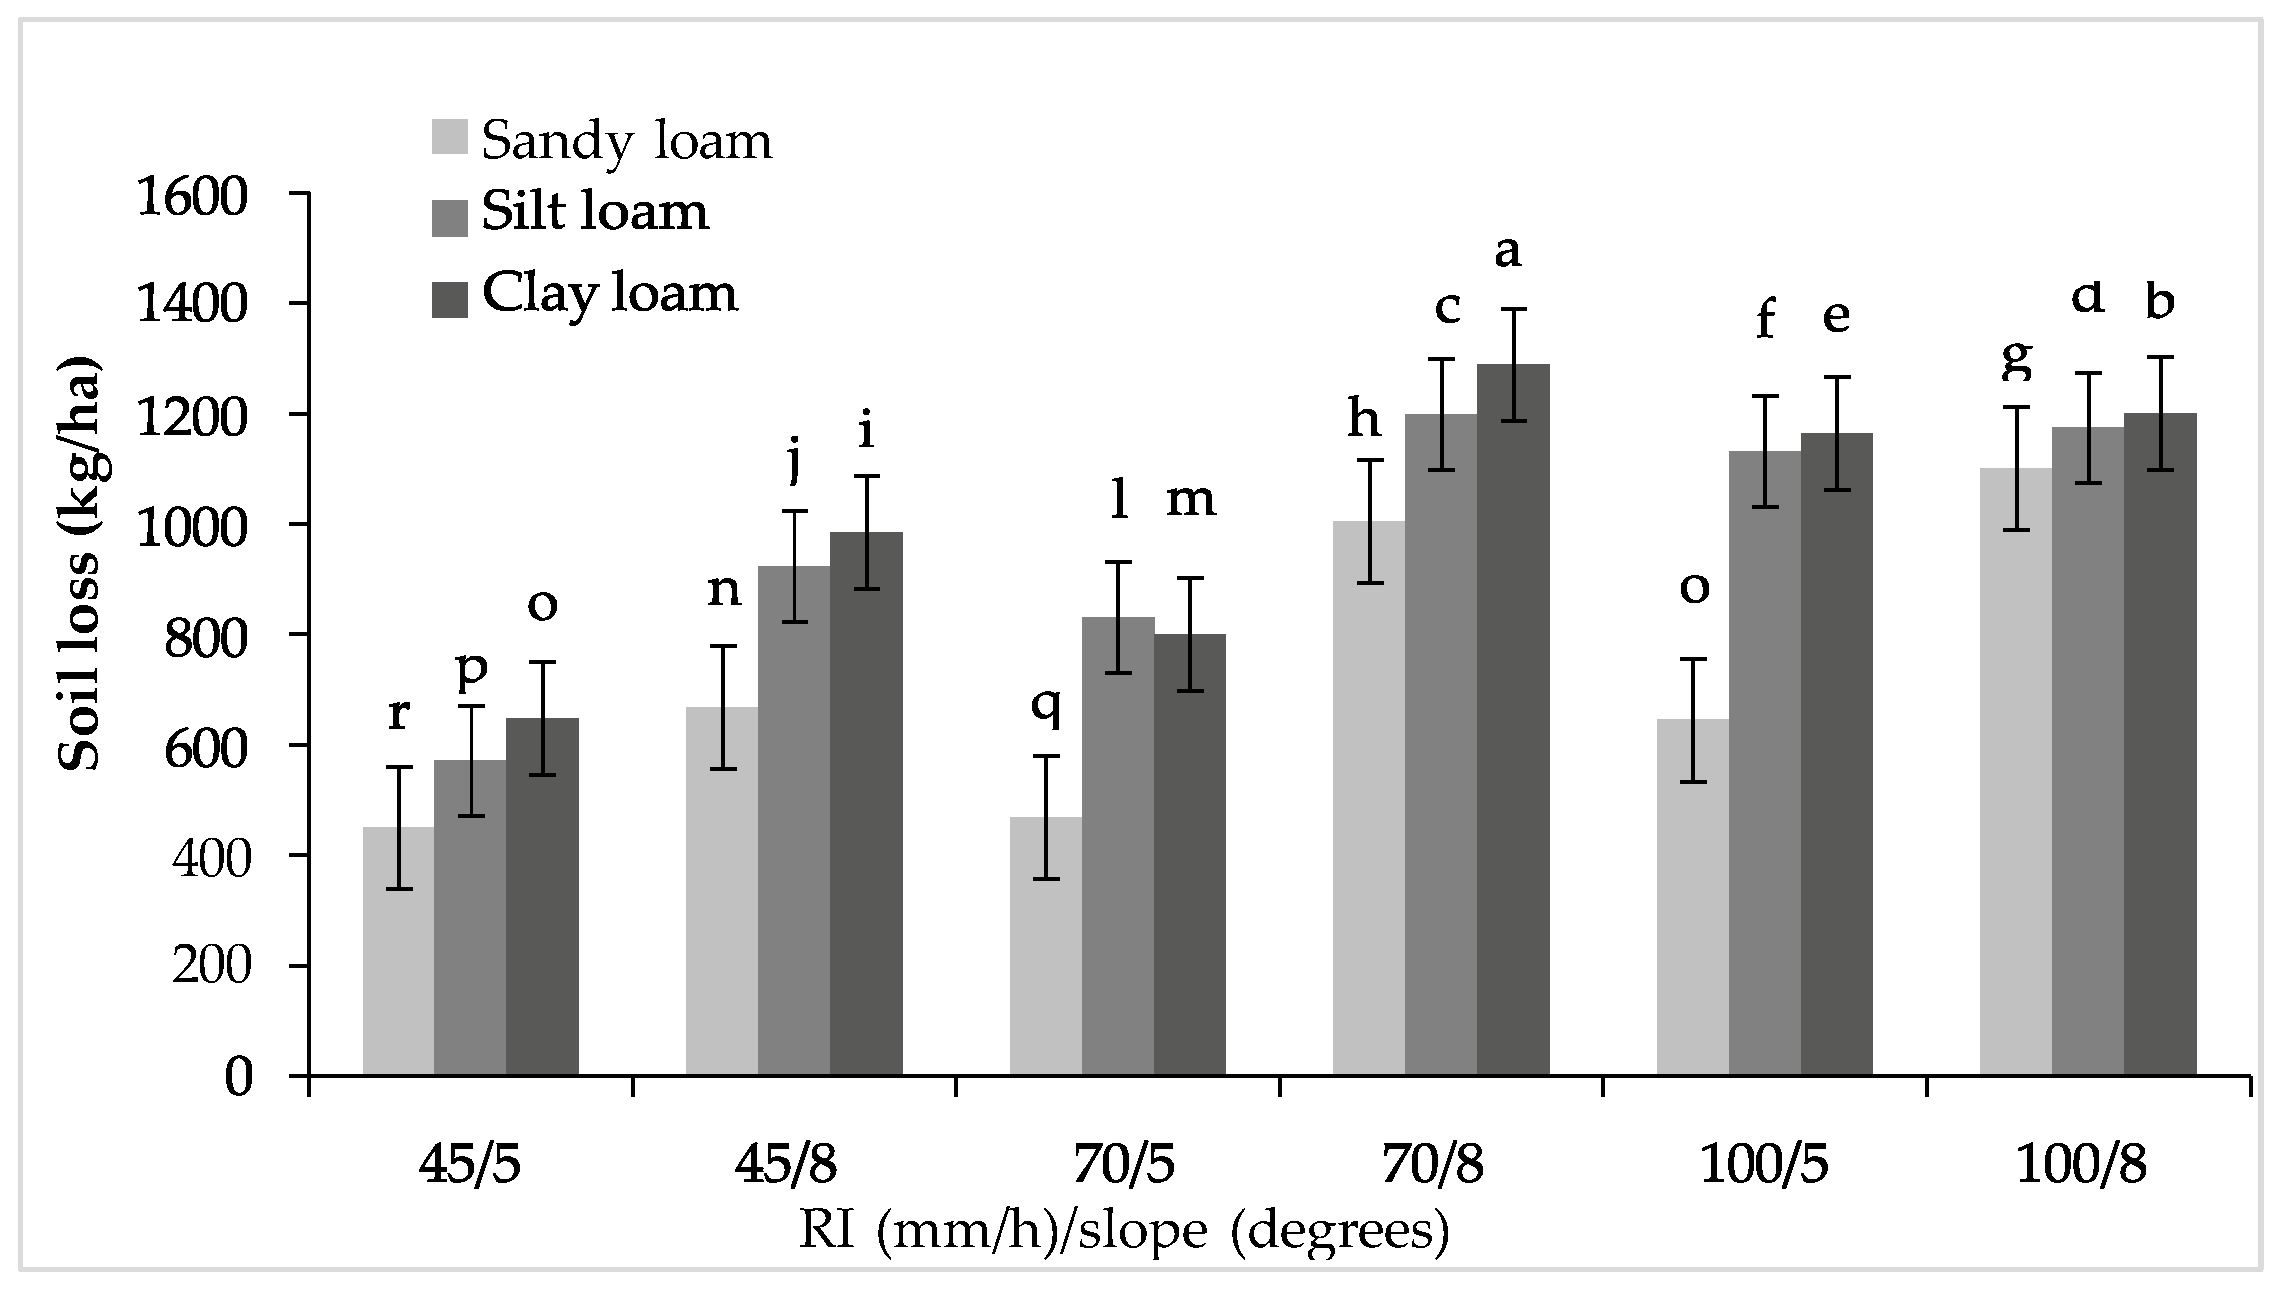
3.3. Effects of Rainfall Intensity (RI), Slope Gradient and Soil Type on Soil Loss

As shown in Table 5, soil loss demonstrated a significant impact from each of the four main components, consistent with other soil metrics. Additionally, it was verified that the interaction between these four main effects had statistical significance (p < 0.001).
Soil loss demonstrated substantial sensitivity to all three primary factors, as depicted in Table 5. Notably, the interaction between Soil type, Rainfall Intensity (RI), and Slope yielded significant findings (p < 0.002). For silt loam and clay loam soils, soil loss exhibited a gradual increase with heightened rainfall intensity and slope steepness, as illustrated in Figure 4. However, a notable decrease in soil loss was observed at higher intensities. Interestingly, both silt loam and clay loam soils exhibited heightened soil loss when subjected to the medium intensity of 70 mm/h.
Sandy soils displayed the highest erodibility, particularly evident at the highest intensity and slope steepness. Clay loam soil at 45/5 (648.22 kg/ha) and sandy loam soil at 100/5 (645.04 kg/ha) performed similarly. The most erodible soil was obtained under clay loam soil at 70/8 (1287.63 kg/ha) and the least soil to be eroded was sandy soil at 45/5 (449.58 kg/ha). This result shows that the slope gradient has a significant impact on soil erosion, as the steeper slope (8°) was more prone to erosion than the 5° slope (Figure 4). The reason for this could be that on steeper slopes, water tended to run off more quickly and with greater force, increasing the likelihood of soil erosion [41]. Similar findings were reported by Sobol et al. [42], who stated that there is a direct relationship between soil loss and both rainfall intensity (at 2, 4, and 6 mm/min) and slope inclination (at 3° and 7°).
The study revealed that higher rainfall intensity and steeper slopes were associated with increased soil loss due to erosion. In another study, Virendra et al. [43] examined how rainfall intensity affected directional splash erosion in simulated clay loam soil. Their findings showed that the rate of soil loss from splashing increased as the rainfall intensity increased, regardless of the land slope (which was set at 1%, 3%, 5%, 7%, or 10%). Additionally, the authors observed that as the land slope increased, so too did the rate of splash soil loss across all four rainfall intensities tested (3.28 cm/h, 4.23 cm/h, 5.8 cm/h, and 7.75 cm/h). The splash soil loss rate ranged from 2293 kg/ha to 17,898 kg/ha as the intensity varied from 3.28 to 7.75 cm/h.
Arjmand and Mahmoodabadi [36] noted that higher infiltration rates on steep slopes result from reduced seal development, as detached material is more easily washed away. This indicates that slope gradient not only affects the physical impact of rainfall but also influences the formation and stability of surface seals, ultimately affecting soil erosion and water infiltration.

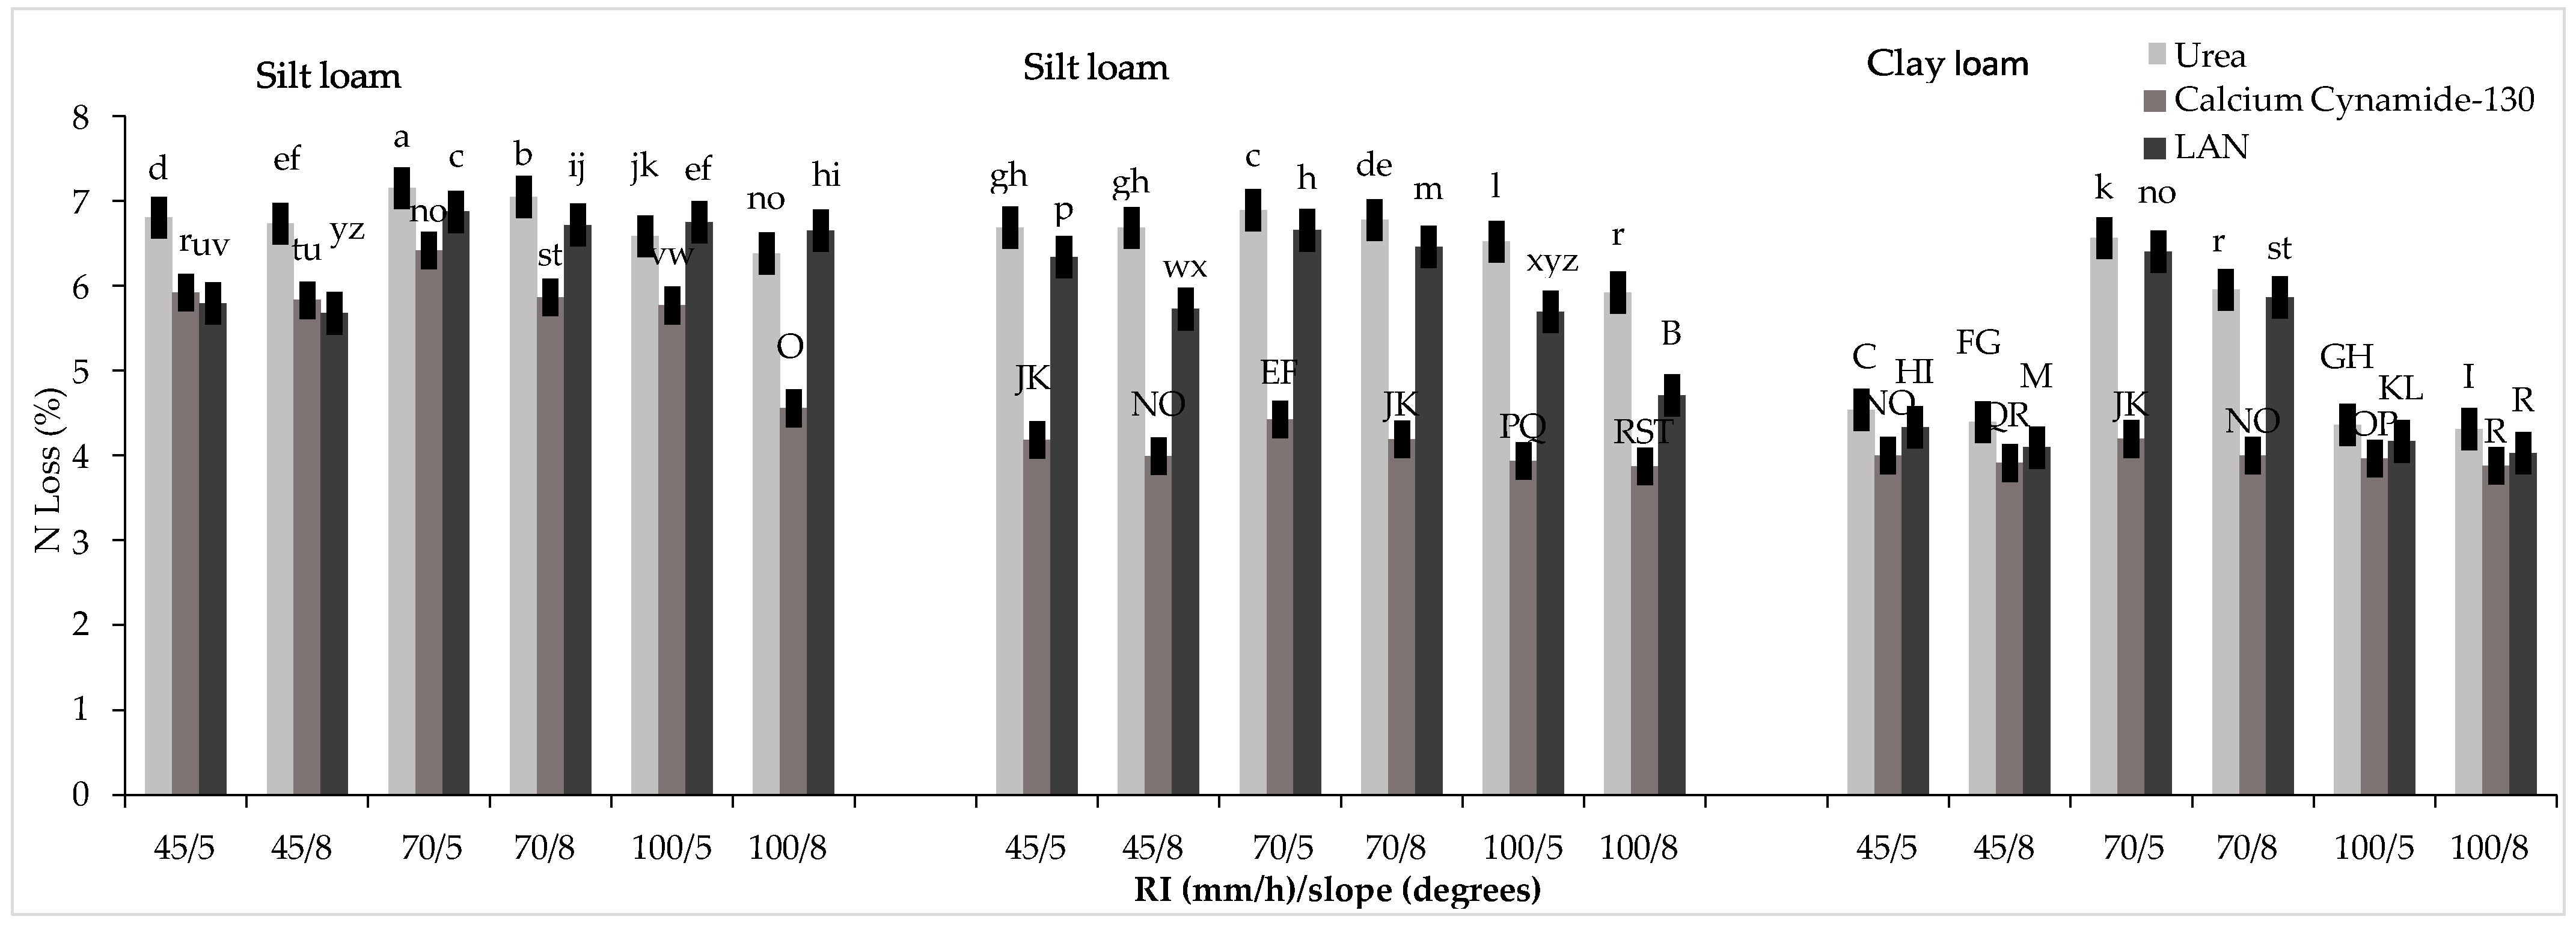
3.4. Effect of Soil Type, Rainfall Intensity, Slope Gradient and N Fertilizer on Total N Leaching

During a rainfall event, nitrogen can be lost through two mechanisms. The first involves surface runoff, which happens when the rate of rainfall exceeds the soil’s capacity to absorb it. The second mechanism involves the vertical movement of nitrogen through infiltration. This study focused specifically on examining the vertical leaching loss of nitrogen, omitting the investigation of nutrient loss through runoff. Leaching losses of total N were significantly influenced by rainfall intensity, slope, and soil type, with higher intensity leading to increased N leaching (Table 6). Results revealed that all soils experienced peak N loss at 70/5 intensity, particularly sandy loam (Figure 5). Interestingly, different nitrogen sources had varying effects; urea at 130 kg/ha N resulted in the highest N loss in all three soil types (7.15% sandy loam, 6.9% silty loam, and 6.5% clay loam), followed by LAN at 130 kg/ha N (6.9% sandy soil, 6.7% silt loam, and 6.3% sandy loam) while at the same level CaCN2 at 130 kg/ha N exhibited lower N leaching (6.4% sandy soil, 4.4% silt loam, and 4.2% clay loam) due to its slow-release nature. By comparison, Mrubata et al. [29] discovered that the variation curves of the total N loss under the rainfall intensities of 30 mm/h and 40 mm/h showed no noticeable difference, which may be due to the small effect of the low rainfall intensity on soil nutrient loss rate.
Su et al. [44] reported similar findings, noting that clay loam soil exhibited the least nitrate leaching compared to sandy loam soil. Using the HERMES model, Michalczyk et al. [45] simulated the long-term impact of various soil textures on nitrogen leaching. Their results indicated that nitrate leaching followed the order: sandy loam > silty loam > clay loam, with a decrease from 113.9 to 41.9 kg/ha. Rose et al. [46] conducted a study demonstrating that applying slow-release nitrogen to unplanted soil columns resulted in a 40% reduction in nitrous oxide emissions, reduced mineral nitrogen leaching, and maintained higher nitrogen levels in the topsoil compared to conventional urea application.
Additionally, previous studies by Lu et al. [47] and Fang et al. [48] have shown that the selective erosion of slope soil particles by runoff primarily drives the variation of total nitrogen concentration during runoff generation. Consequently, the variation process of particle concentration in lost sediment can be predicted based on the variation process of total nitrogen concentration. In this study, the nutrient loss rate (NLr) under the same rainfall intensity but different slope gradients indicates that nutrient concentration alone does not accurately reflect the actual situation of nutrient loss in a particular area. Specifically, in certain conditions, high nutrient concentrations in lost sediment do not necessarily correspond to large amounts of nutrient loss. Therefore, the nutrient loss rate is considered a more reliable indicator of soil nutrient loss compared to nutrient concentration, providing a more accurate assessment of nutrient depletion in specific land areas.

4. Conclusions

The study utilized a rainfall simulator experiment to investigate the influence of rainfall intensity and slope gradient on various factors, including infiltration rate, soil loss, runoff, and nitrogen leaching. The findings provided valuable insights into the interactions between these factors and their effects on soil erosion, infiltration, and nutrient loss. Soil loss increased gradually with higher rainfall intensity and steeper slope gradient for silt loam and clay loam soils, but a decrease was observed at higher intensities. Sandy soils exhibited the highest erodibility at the highest intensity and slope steepness. Runoff was also influenced by both rainfall intensity and slope, with the lowest runoff occurring at the lowest intensity and higher amounts observed at 70/8. Among soil types, clay loam had significantly higher runoff values compared to silt loam and sandy loam. Infiltration rates were consistently higher in sandy loam soils but decreased at higher intensities. The peak infiltration rate was observed at 70/5 for all soil types, with sandy loam showing the highest value. Notably, diverse nitrogen sources had contrasting impacts: urea at 130 kg/ha N caused the most significant N loss, whereas CaCN2 at the same level showed reduced leaching. Nevertheless, when surpassing 130 kg/ha N, CaCN2 leaching intensified, suggesting an optimal application threshold. The nitrogen leaching measurements provide crucial insights into the potential environmental impact of nitrogen fertilizers on soil and water quality. By assessing nitrogen leaching, the study sheds light on the mobility of nitrogen compounds within the soil profile and their potential to contaminate groundwater or contribute to nutrient imbalances in aquatic ecosystems. Understanding the dynamics of nitrogen leaching helps inform sustainable agricultural practices, guiding the appropriate application of fertilizers to minimize environmental degradation while optimizing crop productivity. Effective land use practices and soil conservation measures are crucial in managing these factors and minimizing their impact on soil and water resources. This knowledge can guide decision-making in soil and nutrient management to mitigate soil erosion and nitrogen leaching’s adverse environmental effects.

4.1. Scope

This study’s conclusions pertain specifically to the parameters examined under controlled experimental conditions. It investigates the impact of slope gradient, rainfall intensity, and nitrogen fertilizer source on soil behavior, focusing on infiltration, runoff, soil loss, and nitrogen leaching.

4.2. Limitations

  • Controlled Environment: Findings are confined to the controlled laboratory setting, which may not fully replicate natural environmental complexities.
  • Temporal Constraints: The study’s duration may limit understanding of long-term soil processes, necessitating further research.
  • Fertilizer Specificity: Conclusions about nitrogen leaching are specific to the studied fertilizer sources.
Acknowledging these limitations is crucial for interpreting the study’s findings and guiding future research efforts.

Author Contributions

M.M.M., P.S. and M.P.Z.S. conceived the study; M.M.M. and M.P.Z.S. designed the methodology; M.P.Z.S. conducted the investigation; M.P.Z.S. and M.M.M. drafted the original manuscript; M.M.M. and P.S. reviewed and edited the manuscript; P.S. and M.M.M. supervised the study; M.M.M. and P.S. acquired funding. All authors have read and agreed to the published version of the manuscript.

Funding

This research was supported by funding from the Tshwane University of Technology and Hygrotech S.A. Pty. Limited. The Tshwane University of Technology also funded the article processing charges (APC).

Institutional Review Board Statement

Not applicable.

Data Availability Statement

Data underlying this study will be provided upon request.

Acknowledgments

The authors gratefully acknowledge the Agricultural Research Council for granting access to their facilities and for providing technical assistance during the study. Financial support from the Tshwane University of Technology is also acknowledged.

Conflicts of Interest

The authors declare no conflicts of interest.

References

  1. Liu, D.; She, D.; Shao, G.; Chen, D. Rainfall intensity and slope gradient effects on sediment losses and splash from a saline–sodic soil under coastal reclamation. Catena 2015, 128, 54–62. [Google Scholar] [CrossRef]
  2. Wang, L.; Li, Y.; Wu, J.; An, Z.; Suo, L.; Ding, J.; Li, S.; Wei, D.; Jin, L. Effects of the rainfall intensity and slope gradient on soil erosion and nitrogen loss on the sloping fields of Miyun Reservoir. Plants 2023, 12, 423. [Google Scholar] [CrossRef] [PubMed]
  3. Meng, Q.H.; Yang, L.Z.; Yang, L.Z. Effects of land use on soil erosion and nutrient loss in the three gorges reservoir area, China. Soil Use Manag. 2001, 4, 288–291. [Google Scholar] [CrossRef]
  4. Ladha, J.K.; Reddy, P.M. Nitrogen fixation in rice systems: State of knowledge and future prospects. Plant Soil. 2003, 262, 151–167. [Google Scholar] [CrossRef]
  5. Wu, C.G.; Lin, D.S.; Xiao, W.F.; Wang, P.C.; Ma, H.; Zhou, Z.X. Spatiotemporal distribution characteristics of rainfall erosivity in three gorges reservoir area. Chin. J. Appl. Ecol. 2011, 22, 151–158. [Google Scholar]
  6. Huang, R.; Huang, L.; He, B.H.; Zhou, L.J.; Wang, F. Effects of slope forest and grass vegetation on reducing rainfall-runoff erosivity in three gorges reservoir region. Trans. Chin. Soc. Agric. Eng. 2012, 28, 70–76. [Google Scholar]
  7. Chen, L.; Sela, S.; Svoray, T.; Assouline, S. Scale dependence of hortonian rainfall-runoff processes in a semiarid environment. Water Resour. Res. 2016, 52, 5149–5166. [Google Scholar] [CrossRef]
  8. Rugendo, M.K.; Gichimu, B.M.; Mugwe, J.N.; Mucheru-Muna, M.; Mugendi, D.N. Surface runoff and soil erosion from Nitisols and Ferralsols as influenced by different soil organic carbon levels under simulated rainfall conditions. Heliyon 2023, 30, e17684. [Google Scholar] [CrossRef] [PubMed]
  9. Assouline, S.; Ben-Hur, M. Effects of rainfall intensity and slope gradient on the dynamics of inter-rill erosion during soil surface sealing. Catena 2006, 66, 211–220. [Google Scholar] [CrossRef]
  10. Flanagan, D.C.; Foster, G.R.; Moldenhauer, W.C. Storm pattern effect on infiltration, runoff, and erosion. Trans. ASABE 1988, 31, 414–420. [Google Scholar] [CrossRef]
  11. Parsons, A.J.; Stone, P.M. Effects of intra-storm variations in rainfall intensity on interrill runoff and erosion. Catena 2006, 67, 68–78. [Google Scholar] [CrossRef]
  12. Dunkerley, D. Effects of rainfall intensity fluctuations on infiltration and runoff: Rainfall simulation on dryland. Process 2012, 26, 2211–2224. [Google Scholar]
  13. Malhi, G.S.; Kaur, M.; Kaushik, P. Impact of climate change on agriculture and its mitigation strategies: A Review. Sustainability 2021, 13, 1318. [Google Scholar] [CrossRef]
  14. Krogstad, T.; Jarp, J.; Krogstad, T. Nitrogen leaching in relation to soil types and land use. Agric Ecosyst Environ. 2014, 186, 80–87. [Google Scholar]
  15. Schlesinger, W.H.; Bernhardt, E.S. Biogeochemistry: An Analysis of Global Change; Academic Press: Cambridge, MA, USA, 2013. [Google Scholar]
  16. Kuśmierz, S.; Skowrońska, M.; Tkaczyk, P.; Lipiński, W.; Mielniczuk, J. Soil organic carbon and mineral nitrogen contents in soils as affected by their pH, texture and fertilization. Agronomy. 2023, 13, 267. [Google Scholar] [CrossRef]
  17. Lal, R.; Stewart, B.A. Soil Degradation; Springer: New York, NY, USA, 1990. [Google Scholar]
  18. Pimentel, D.; Harvey, C.; Resosudarmo, P.; Sinclair, K.; Kurz, D.; Mcnair, M.; Crist, S.; Sphpritz, L.; Fitton, L.; Saffouri, R. Environmental and economic costs of soil erosion and conservation benefits. Science 1995, 267, 1117–1123. [Google Scholar] [CrossRef] [PubMed]
  19. Ladha, J.K.; Dawe, D.; Pathak, H.; Padre, A.T.; Yadav, R.L.; Bijay-Singh, Y.S.; Singh, Y.; Singh, P.; Kundu, A.L.; Sakal, R.; et al. How extensive are yield declines in long term rice-wheat experiments in Asia. Field Crops Res. 2003, 81, 159–180. [Google Scholar] [CrossRef]
  20. Galloway, J.N.; Dentener, F.J.; Capone, D.G.; Boyer, E.W.; Howarth, R.W.; Seitzinger, S.P.; Asner, G.P.; Cleveland, C.; Green, P.; Holland, E. Nitrogen cycles: Past, present, and future. Biogeochemistry 2004, 70, 153–226. [Google Scholar] [CrossRef]
  21. Xu, G.H.; Fan, X.R.; Miller, A.J. Plant nitrogen assimilation and use efficiency. Annu. Rev. Plant Biol. 2012, 63, 153–182. [Google Scholar] [CrossRef]
  22. An, J.; Zheng, F.L.; Han, Y. Effects of rainstorm patterns on runoff and sediment yield processes. Soil Sci. 2014, 179, 293–303. [Google Scholar] [CrossRef]
  23. Dunkerley, D. An approach to analysing plot scale infiltration and runoff responses to rainfall of fluctuating intensity. Hydrol. Process. 2017, 31, 191–206. [Google Scholar] [CrossRef]
  24. Mrubata, K. Soil Sealing and Crusting Effects on Infiltration, Erosion and Microbial Composition under Different Rainfall Intensities and Slope Conditions. Ph.D. Thesis, University of South Africa, Johannesburg, South Africa, 2019. [Google Scholar]
  25. Yang, X.; Geng, J.; Li, C.; Zhang, M.; Tian, X. Cumulative release characteristics of controlled-release nitrogen and potassium fertilizers and their effects on soil fertility, and cotton growth. Sci. Rep. 2016, 6, 39030. [Google Scholar] [CrossRef] [PubMed]
  26. Fröberg, M.; Bergström, L.; Kirchmann, H. Nitrogen leaching from an agricultural soil following application of calcium cyanamide and ammonium nitrate. Nutr. Cycling Agroecosyst. 2003, 66, 71–80. [Google Scholar]
  27. Cui, H.; Zhen, X.; Wang, H.; Li, Y.; Li, Z.; Pan, B. The effects of calcium cyanamide on nitrogen leaching and maize yield in a sandy soil. Environ. Sci. Pollut. Res. 2014, 21, 734–743. [Google Scholar]
  28. Wang, H.; Zhang, M.; Gao, J. Effects of calcium cyanamide on soil nitrogen mineralization and plant growth. Commun Soil Sci Plant Anal. 2015, 46, 2094–2106. [Google Scholar]
  29. Mrubata, K.; Nciizah, A.D.; Wakindiki, I.C.; Mudau, F.N. Effects of rainfall intensity and slope gradient on soil sealing and crusting, erosion, and phosphorus solubilizing bacteria. Sci. Afr. 2024, 23, e02064. [Google Scholar] [CrossRef]
  30. Berreta, A.N.; Silberman, A.V.; Paladino, L.; Torres, D.; Basahum, D.; Musselli, R.; Garcia-Lamohte, A. Soil texture analysis using a hydrometer: Modification of the Bouyoucos method. Cienc. Investig. Agrar. 2014, 42, 263–271. [Google Scholar]
  31. Le Bissonnais, Y.; Arruoays, B. Aggregate stability and assessment of soil crustability and erodibility. II. Application to humic loamy soils with various organic carbon content. Eur. J. Soil Sci. 1997, 48, 39–48. [Google Scholar] [CrossRef]
  32. Van Reeuwilk, L.P. Procedures for Soil Analysis, 6th ed.; Technical paper; International Soil Reference and Information Centre: Wageningen, The Netherlands, 2002. [Google Scholar]
  33. Morin, J.; Goldberg, S.; Seginer, I. A rainfall similar with a rotating disc. Trans. Am. Soc. Mech. Eng. 1976, 10, 74–79. [Google Scholar]
  34. Cao, L.; Liang, Y.; Wang, Y.; Lu, H. Runoff and soil loss from Pinus Massonianna Forest in Southern China after simulated rainfall. Catena 2015, 129, 1–8. [Google Scholar] [CrossRef]
  35. Nciizah, A.D.; Wakindiki, I.I.C. Rainfall intensity effects on crusting and mode of seedling emergence in some quartz dominated South African soils. Water SA 2014, 40, 587–594. [Google Scholar] [CrossRef]
  36. Arjmand, S.; Mahmoodabadi, M. Aggregate breakdown and surface seal development influenced by rain intensity, slope gradient and soil particle size. Solid Earth 2015, 6, 311–321. [Google Scholar] [CrossRef]
  37. Han, Y.; Fan, Y.; Xin, Z. Effects of wetting rate and simulated rain duration on soil crust formation of red loam. Environ. Earth Sci. 2016, 75, 149. [Google Scholar] [CrossRef]
  38. Xu, L.; Zhang, Q.; Huang, L. Nitrogen leaching in a typical agricultural extensively cropped catchment, China: Experiments and modelling. Water Environ. J. 2010, 24, 97–106. [Google Scholar] [CrossRef]
  39. Li, T.; Ma, F.; Wang, J.; Qiu, P.; Zhang, N.; Guo, W.; Xu, J.; Dai, T. Study on the Mechanism of Rainfall-Runoff Induced Nitrogen and Phosphorus Loss in Hilly Slopes of Black Soil Area, China. Water 2023, 15, 3148. [Google Scholar] [CrossRef]
  40. Lei, W.; Mengling, P.; Shanshan, Q.; Xiao-Yi, M. Effects of rainfall intensity and slope gradient on runoff and sediment yield characteristics of bare loess soil. Environ. Sci. Pollut. Res. 2018, 25, 3480–3487. [Google Scholar]
  41. United States Department of Agriculture (USDOA). Soil Infiltration. 2019. Available online: https://agcrops.osu.edu/newsletter/corn-newsletter/2018-03/soil-infiltration (accessed on 7 April 2024).
  42. Sobol, N.V.; Gabbasova, I.M.; Komissarov, M.A. Effect of rainfall intensity and slope steepness on the development of soil erosion in the Southern Cis-Ural region (A model experiment). Eurasian J. Soil. 2017, 50, 1098–1104. [Google Scholar] [CrossRef]
  43. Virendra, N.B.; Gajanan, U.S.; Atul, A.A. Effect of rainfall intensity on directional splash erosion in clay loam soil under simulated condition. Int. J. Bio-Resour. Stress Manag. 2018, 9, 13–16. [Google Scholar]
  44. Su, Y.Z.; Yang, X.; Yang, R. Effect of soil texture in unsaturated zone on soil nitrate accumulation and groundwater nitrate contamination in a marginal oasis in the middle of Heihe River basin. Huan Jing Ke Xue 2014, 35, 3683–3691. [Google Scholar]
  45. Michalczyk, A.; Kersebaum, K.C.; Dauck, H.P.; Roelcke, M.; Yue, S.C.; Chen, X.P.; Zhang, F.S. Quantifying nitrogen loss and water use via regionalization and multiple year scenario simulations in the North China Plain. J. Plant Nutr. Soil Sci. 2020, 183, 718–733. [Google Scholar] [CrossRef]
  46. Rose, M.T.; Perkins, E.L.; Saha, B.K.; Tang, C.W.; Cavagnaro, T.R.; Jackson, W.R.; Hapgood, K.P.; Hoadley, A.F.; Patti, A.F. A slow-release nitrogen fertiliser produced by simultaneous granulation and superheated steam drying of urea with brown coal. Chem. Biol. Technol. Agric. 2016, 3, 10. [Google Scholar] [CrossRef]
  47. Lu, J.; Zheng, F.; Li, G.; Bian, F.; An, J. The effects of raindrop impact and runoff detachment on hillslope soil erosion and soil aggregate loss in the Mollisol region of Northeast China. Soil Tillage Res. 2016, 161, 79–85. [Google Scholar] [CrossRef]
  48. Fang, N.; Shi, Z.; Chen, F.; Wang, Y. Partial least squares regression for determining the control factors for runoff and suspended sediment yield during rainfall events. Water 2015, 7, 3925–3942. [Google Scholar] [CrossRef]
Figure 1. Schematic diagram of the main parts of the laboratory rainfall simulator [33].
Sustainability 16 04477 g001
Figure 2. The impact of rainfall intensity (RI), slope gradient, and soil properties on infiltration rate (IR). Bars sharing the same letter indicate no significant differences.
Sustainability 16 04477 g002
Figure 3. Effects of soil type, rainfall intensity (RI), slope gradient, and soil property on runoff (RO). Bars with the same letter are not significantly different.
Sustainability 16 04477 g003
Figure 4. Effects of soil type, rainfall intensity (RI) and slope gradient on soil loss (SL). Bars with the same letter are not significantly different.
Sustainability 16 04477 g004
Figure 5. Effects of rainfall intensity (RI), slope gradient, soil type and nitrogen fertiliser source on nitrogen leaching. After exhausting all lowercase letters to label the bars representing various categories, the labeling transitioned to capital letters (A, B, C, etc.).
Sustainability 16 04477 g005
Table 1. Organic carbon content and soil texture.
Particle Size Distribution %
SoilOrganic Carbon (%)Sand Silt Clay
Group 1 (Sandy)1.3476618
Group 2 (Silt)1.0152840
Group 3 (Clay)1.21341254
Table 2. Selected chemical properties of the study soils.
Soil Type pHK
(Meq/100 g)
Ca
(Meq/100 g)
Mg (Meq/100 g)Na (Meq/100 g)CEC
(Meq/100 g)
SAR
(mmol/L)
ESP (%)
Sandy loam6.30.92.71.00.01411.10.0010.31
Silt loam5.30.33.51.00.00820.70.0050.17
Clay loam8.20.732.721.70.10042.60.0200.18
CEC: Cation Exchange Capacity; SAR: Sodium Adsorption Ratio; ESP: Exchangeable Sodium Percentage.
Table 3. Analysis of variance for the effect of rainfall intensity and slope gradient on infiltration rate.
Source DFMean of SquaresF RatioProb > F
Soil type25389.05999751.53<0.001 ***
RI (mm/h) 22351.64544255.31<0.001
Slope(degrees)1123.7554447.87<0.001
Soil type × RI4631.8371571.66<0.001
Soil type × Slope2318.2904575.95<0.001
RI × Slope2772.04421397.02<0.001
Soil type × RI × Slope4620.9746561.83<0.001
DF: degrees of freedom; RI: rainfall intensity; *** highly significant at 0.1%.
Table 4. Analysis of variance for the effect of rainfall intensity, slope gradient and soil type on runoff.
Source DFSum of SquaresF RatioProb > F
Soil type238,788,849.934,305.59<0.001 ***
RI (mm/h) 220,345,489.217,993.93<0.001 ***
Slope(degrees)1417,952.6739.29<0.001 ***
Soil type × RI4314,172.8138.93<0.001 ***
Soil type × Slope2476,316421.26<0.001 ***
RI × Slope25,745,8315081.72<0.001 ***
Soil type × RI × Slope41,618,139715.56<0.004 **
**, *** significant at 1% and 0.1%, respectively; DF: degrees of freedom; RI: rainfall intensity.
Table 5. Analysis of variance for the effects of soil type, rainfall intensity, and slope gradient on soil loss (SL).
Source DFSum of SquaresF RatioProb > F
Soil type2241.1133,700<0.001 ***
RI (mm/h) 2267.8148,500<0.001 ***
Slope (degrees)12.4692737.67<0.001 ***
Soil type × RI439.5310,959.23<0.001 ***
Soil type × Slope21.649914.17<0.003 **
RI × Slope21.47815.25<0.001 ***
Soil type × RI × Slope45.8181613.2<0.002 **
**, *** significant at 1%, 0.1%, respectively; DF: degrees of freedom; RI: rainfall intensity.
Table 6. Analysis of variance for the effect of soil type, rainfall intensity, slope gradient, and nitrogen (N) fertilizer source on total N loss.
SourceDFSum of SquaresF RatioProb > F
Soil type29968.958517,816.87<0.001
RI (mm/h)269.6818124.54<0.001
Slope (degrees)192.4261330.37<0.001
Nitrogen source (N)243,472.673238,847.93<0.001
Soil type × RI4102.947192<0.001
Soil type × Slope2184.2807329.35<0.001
RI × Slope286.8694155.26<0.001
Soil type × N4359.6185160.68<0.001
RI × N4209.249393.49<0.001
Slope × N225.244822.56<0.001
Soil type × RI × Slope2348.2983311.25<0.001
Soil type × RI × N8243.293954.35<0.001
Soil type × Slope × N4132.149759.05<0.001
RI × Slope × N477.433434.6<0.001
Soil type × RI × Slope × N8217.891348.68<0.001
DF: degrees of freedom; RI: rainfall intensity.
Disclaimer/Publisher’s Note: The statements, opinions and data contained in all publications are solely those of the individual author(s) and contributor(s) and not of MDPI and/or the editor(s). MDPI and/or the editor(s) disclaim responsibility for any injury to people or property resulting from any ideas, methods, instructions or products referred to in the content.

