
Sustainable Approach of a Multi-Hazard Risk Assessment Using GIS Customized for Ungheni Areal Situated in the Metropolitan Area of Iasi


Abstract
:1. Introduction
2. Literature Review Regarding Natural Hazards
2.1. Natural Hazards in the World
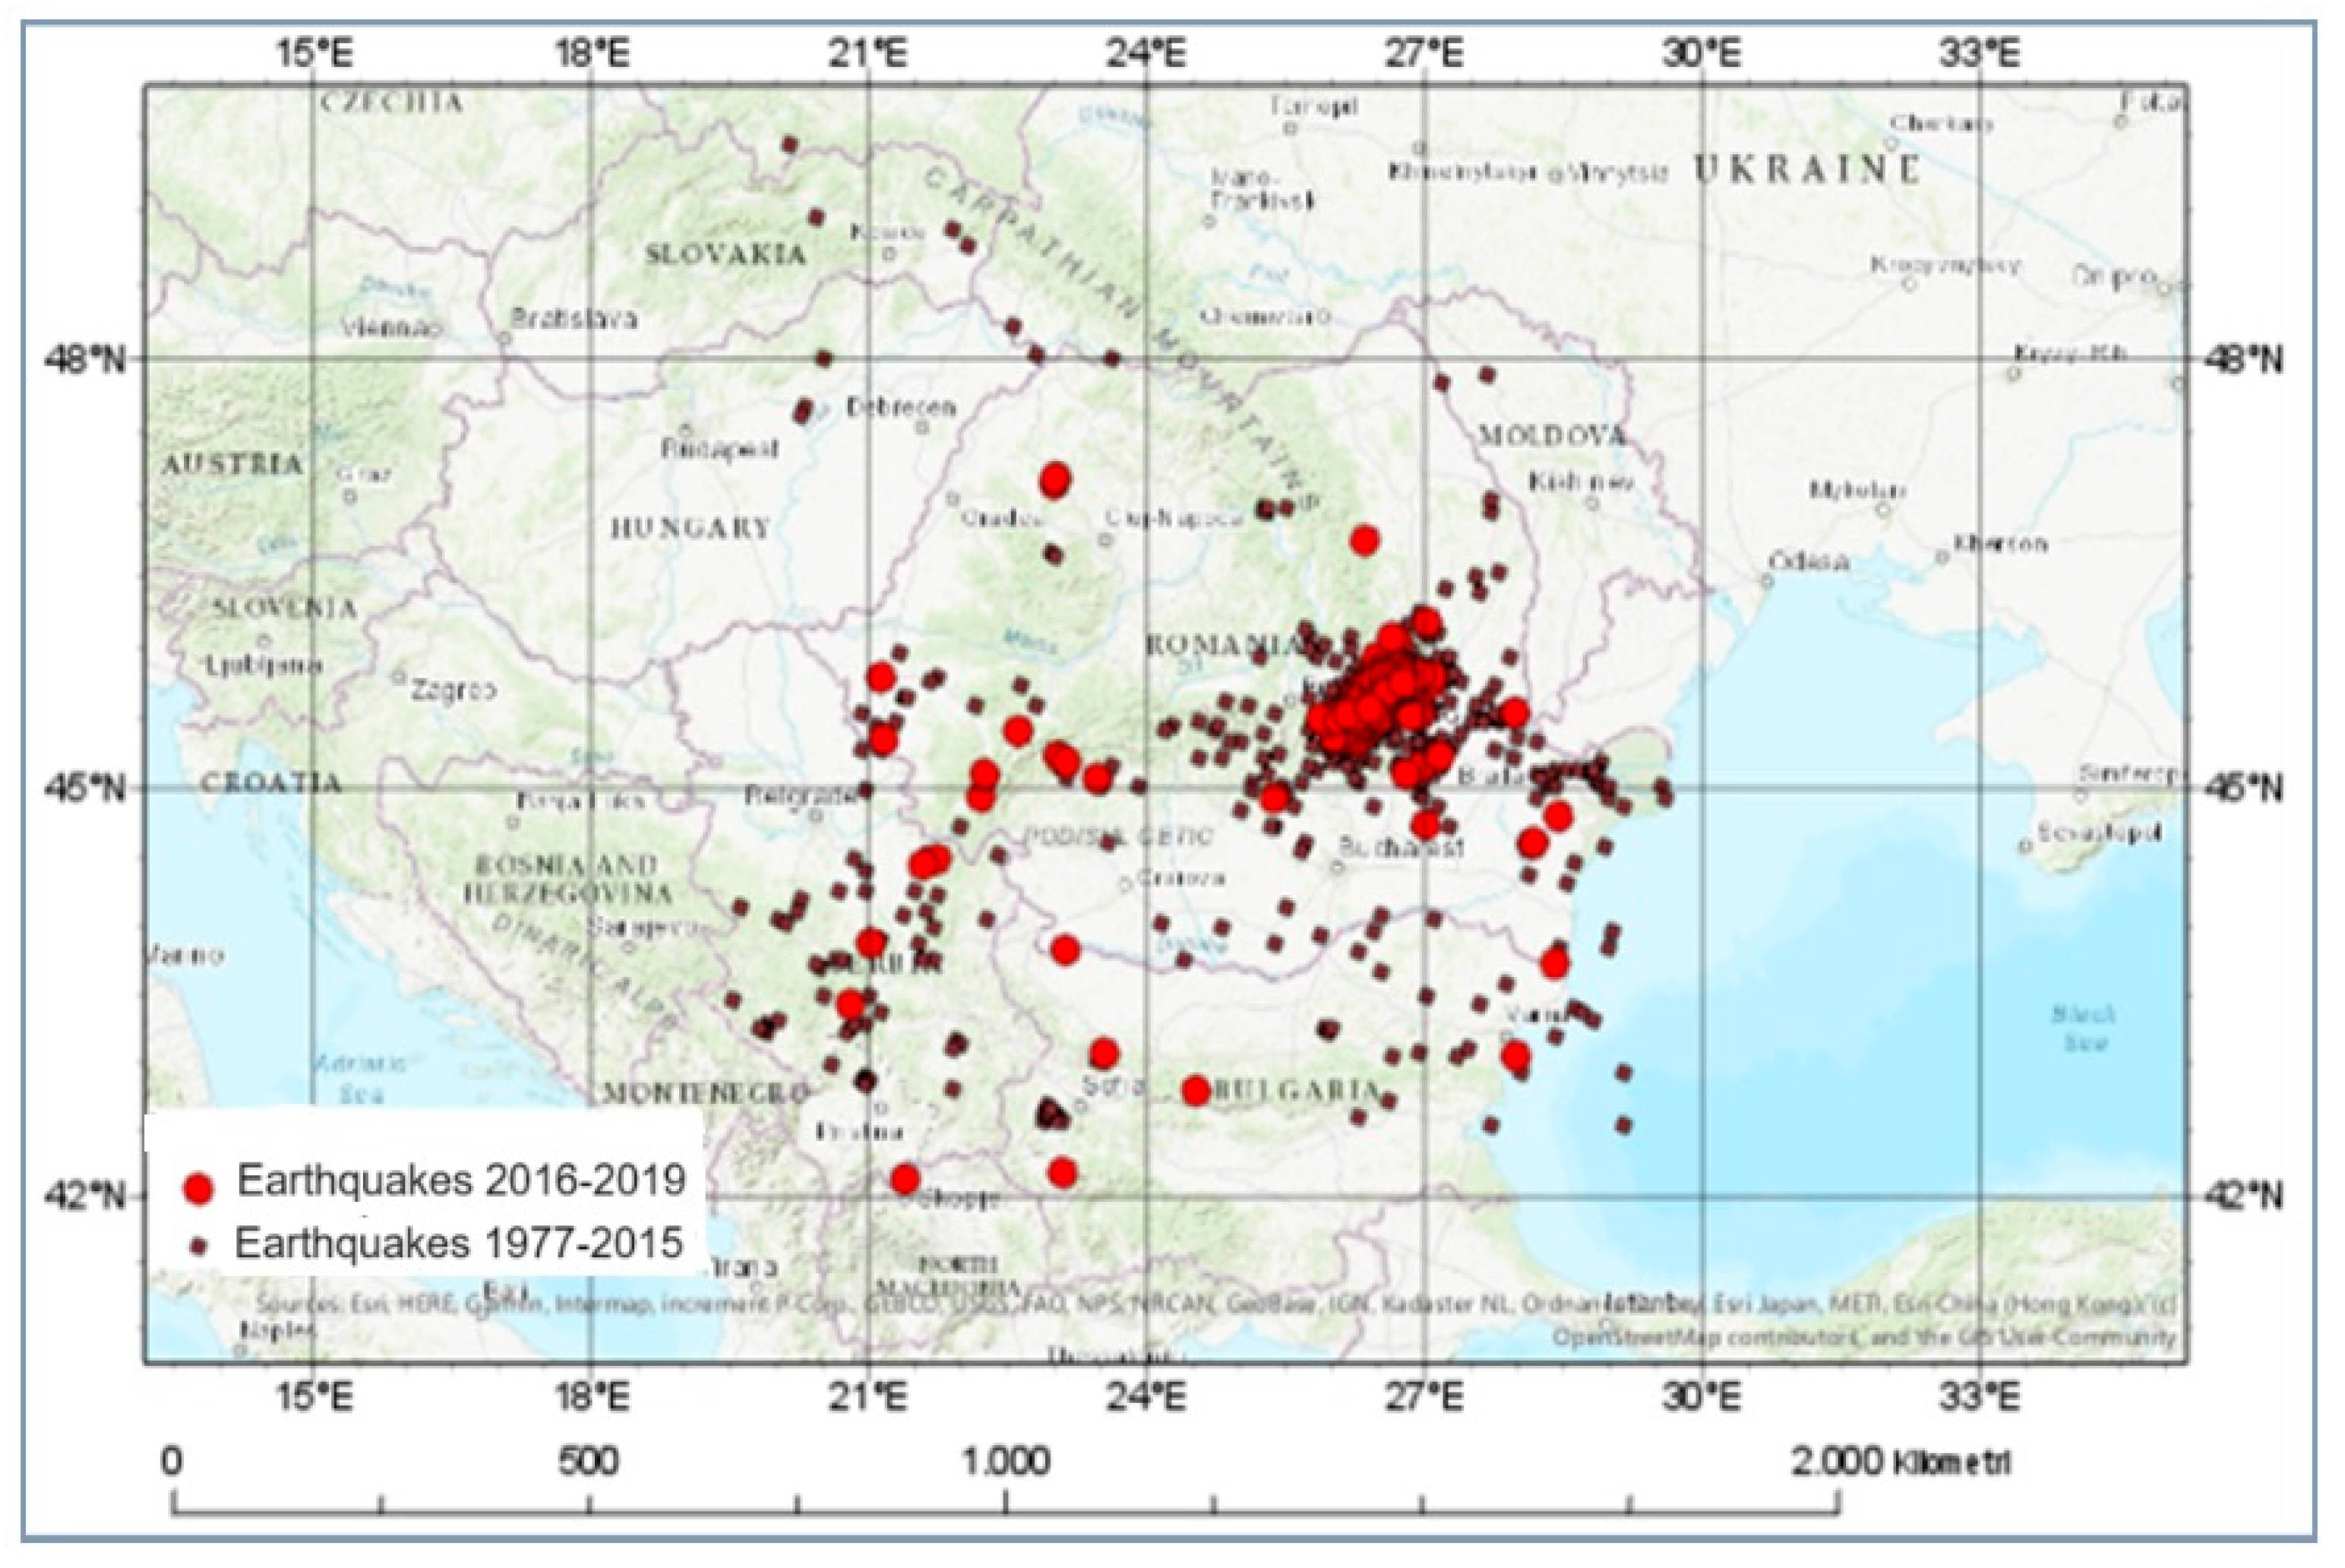
2.2. Natural Hazards in Romania
3. Methodology and Data Collection
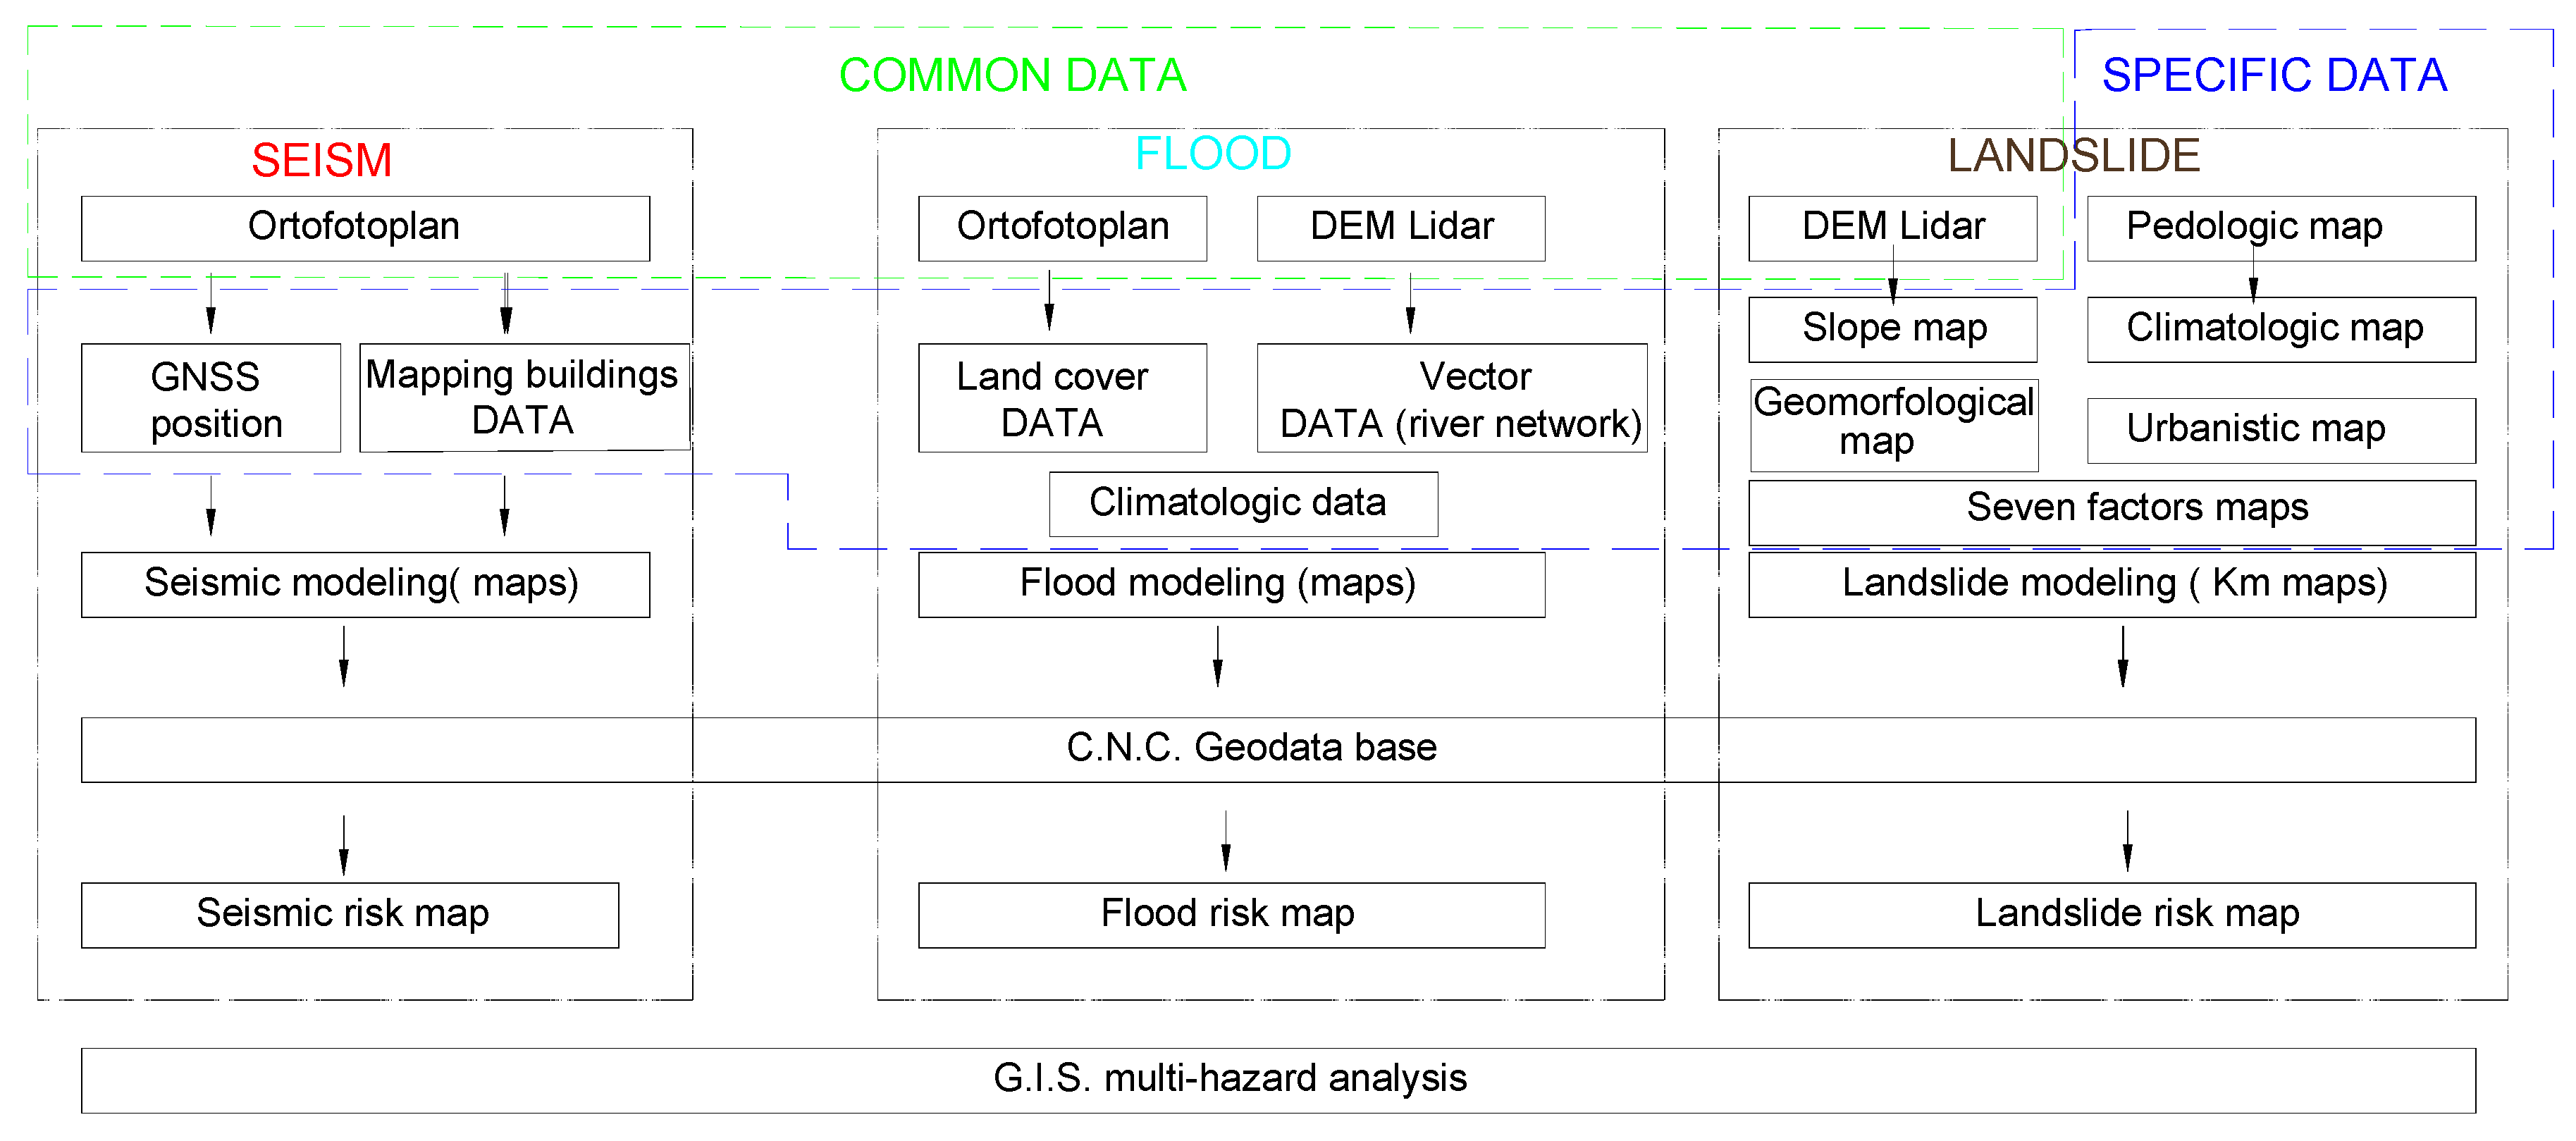
3.1. HAZARM Methodology
3.2. Data Collecting and Processing
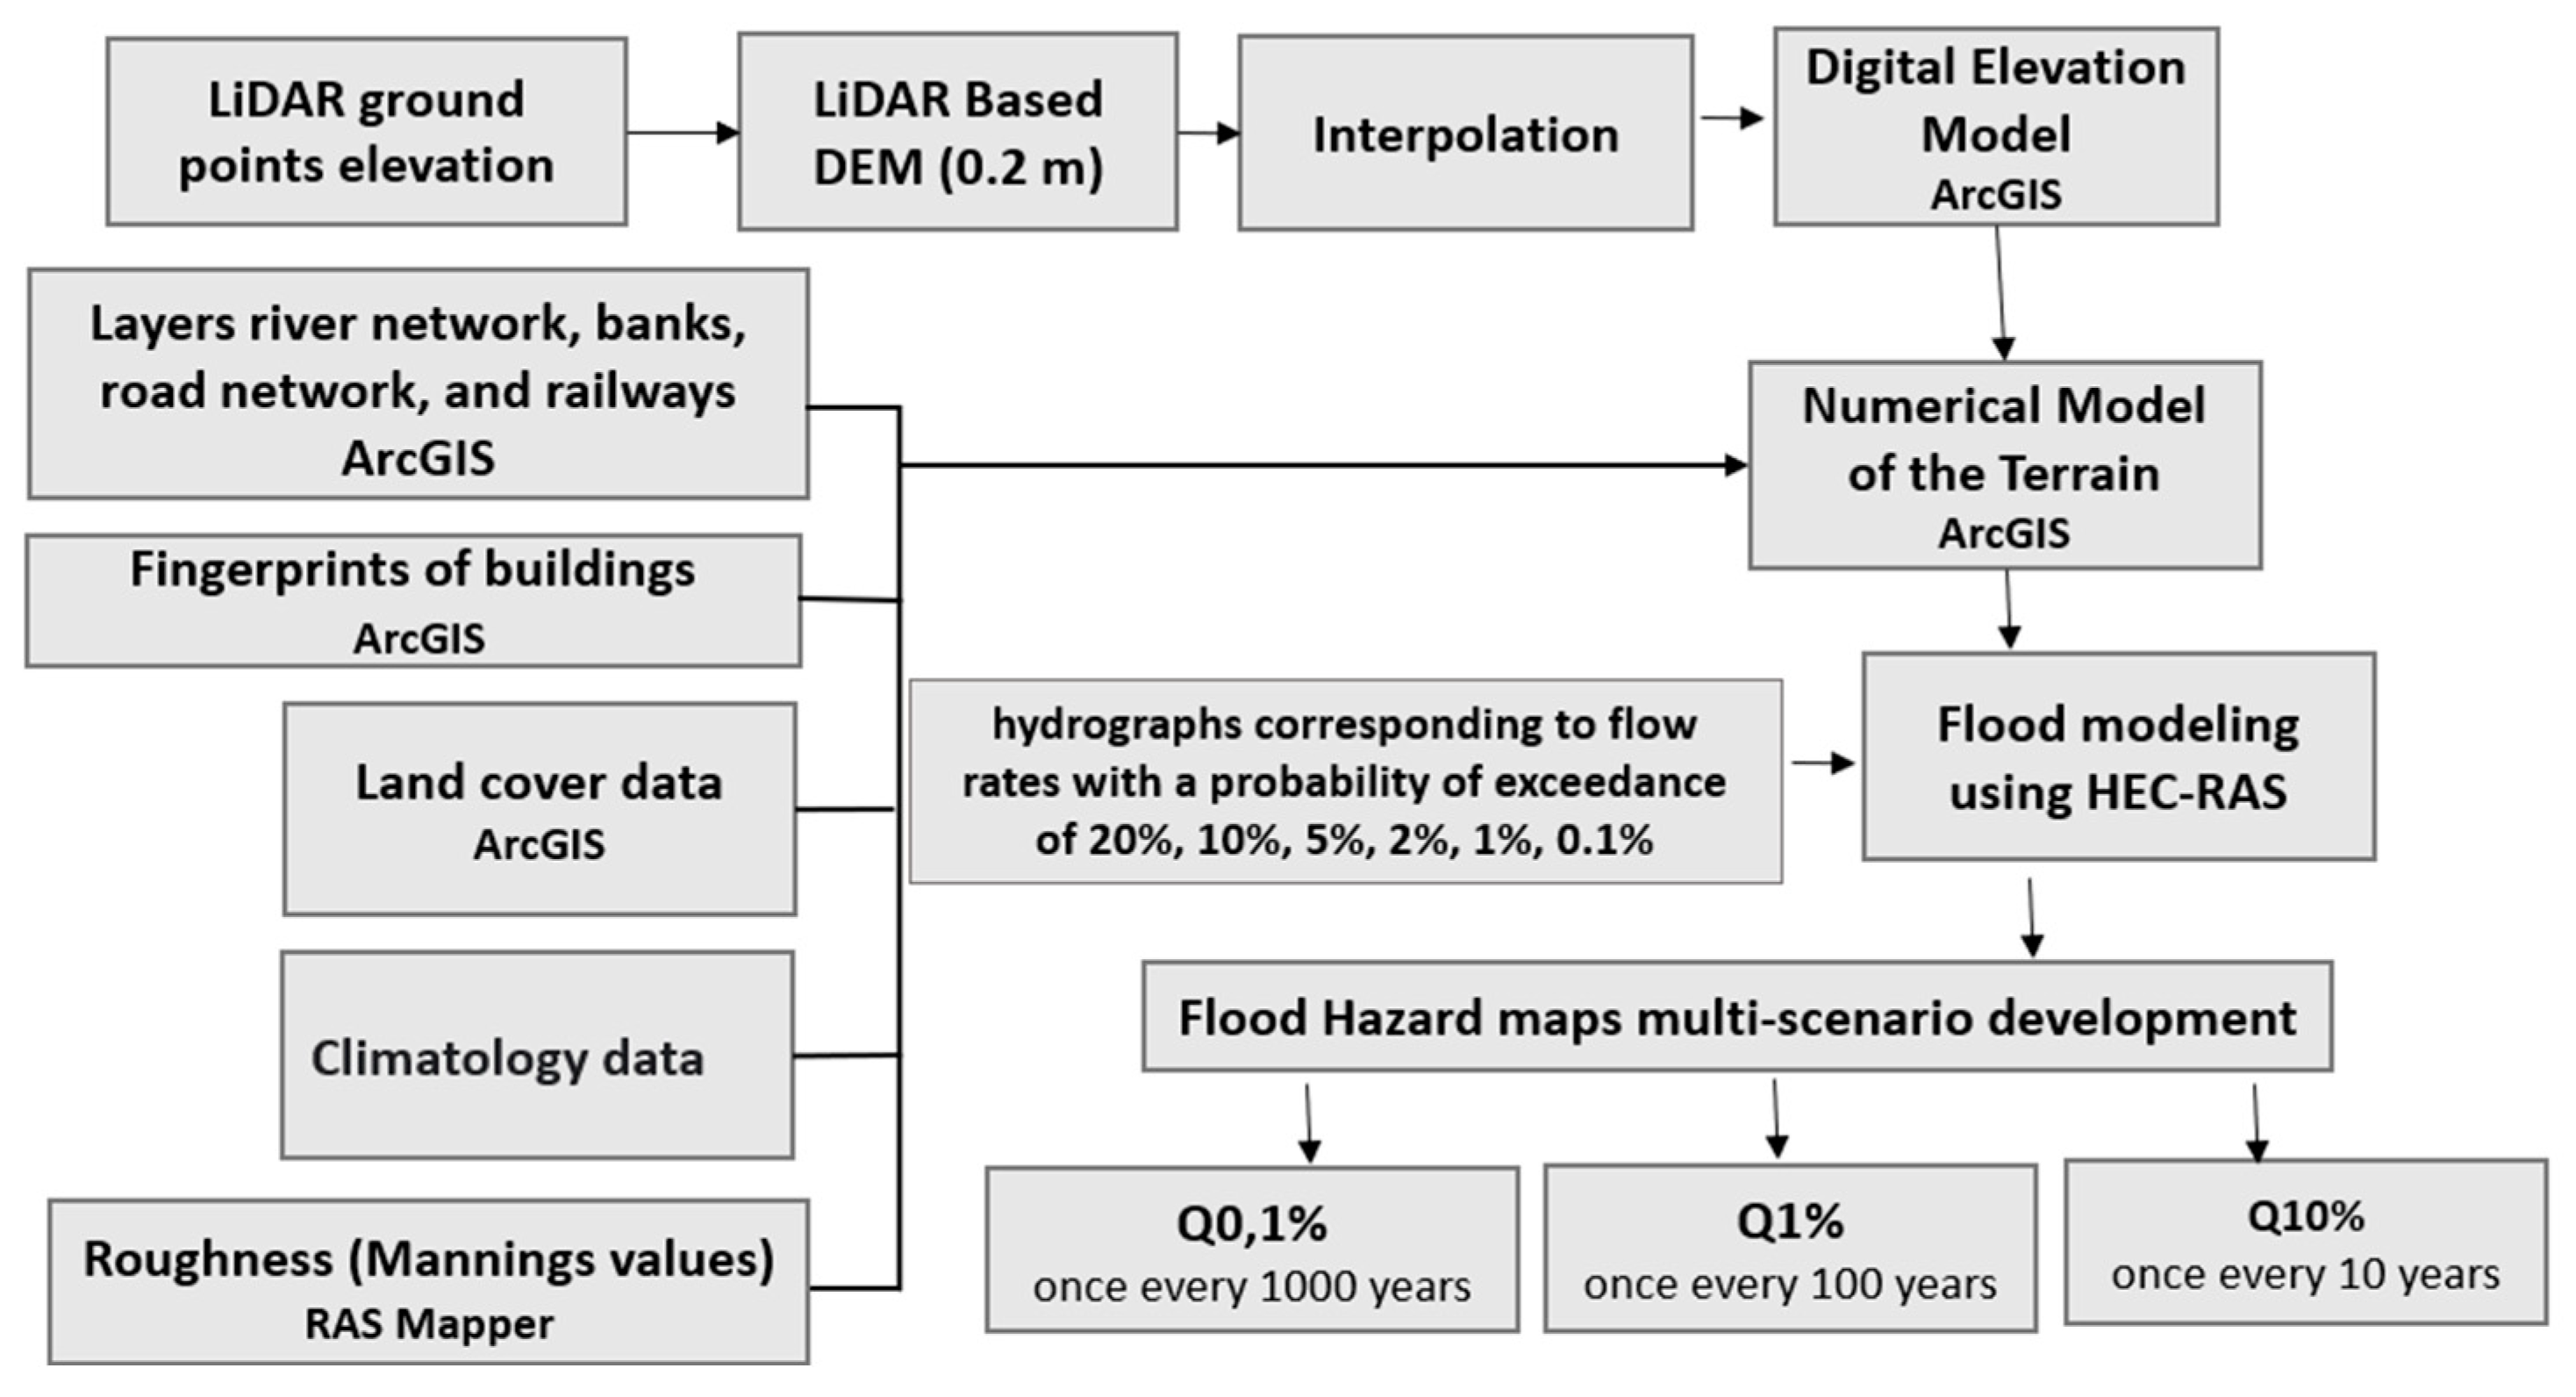
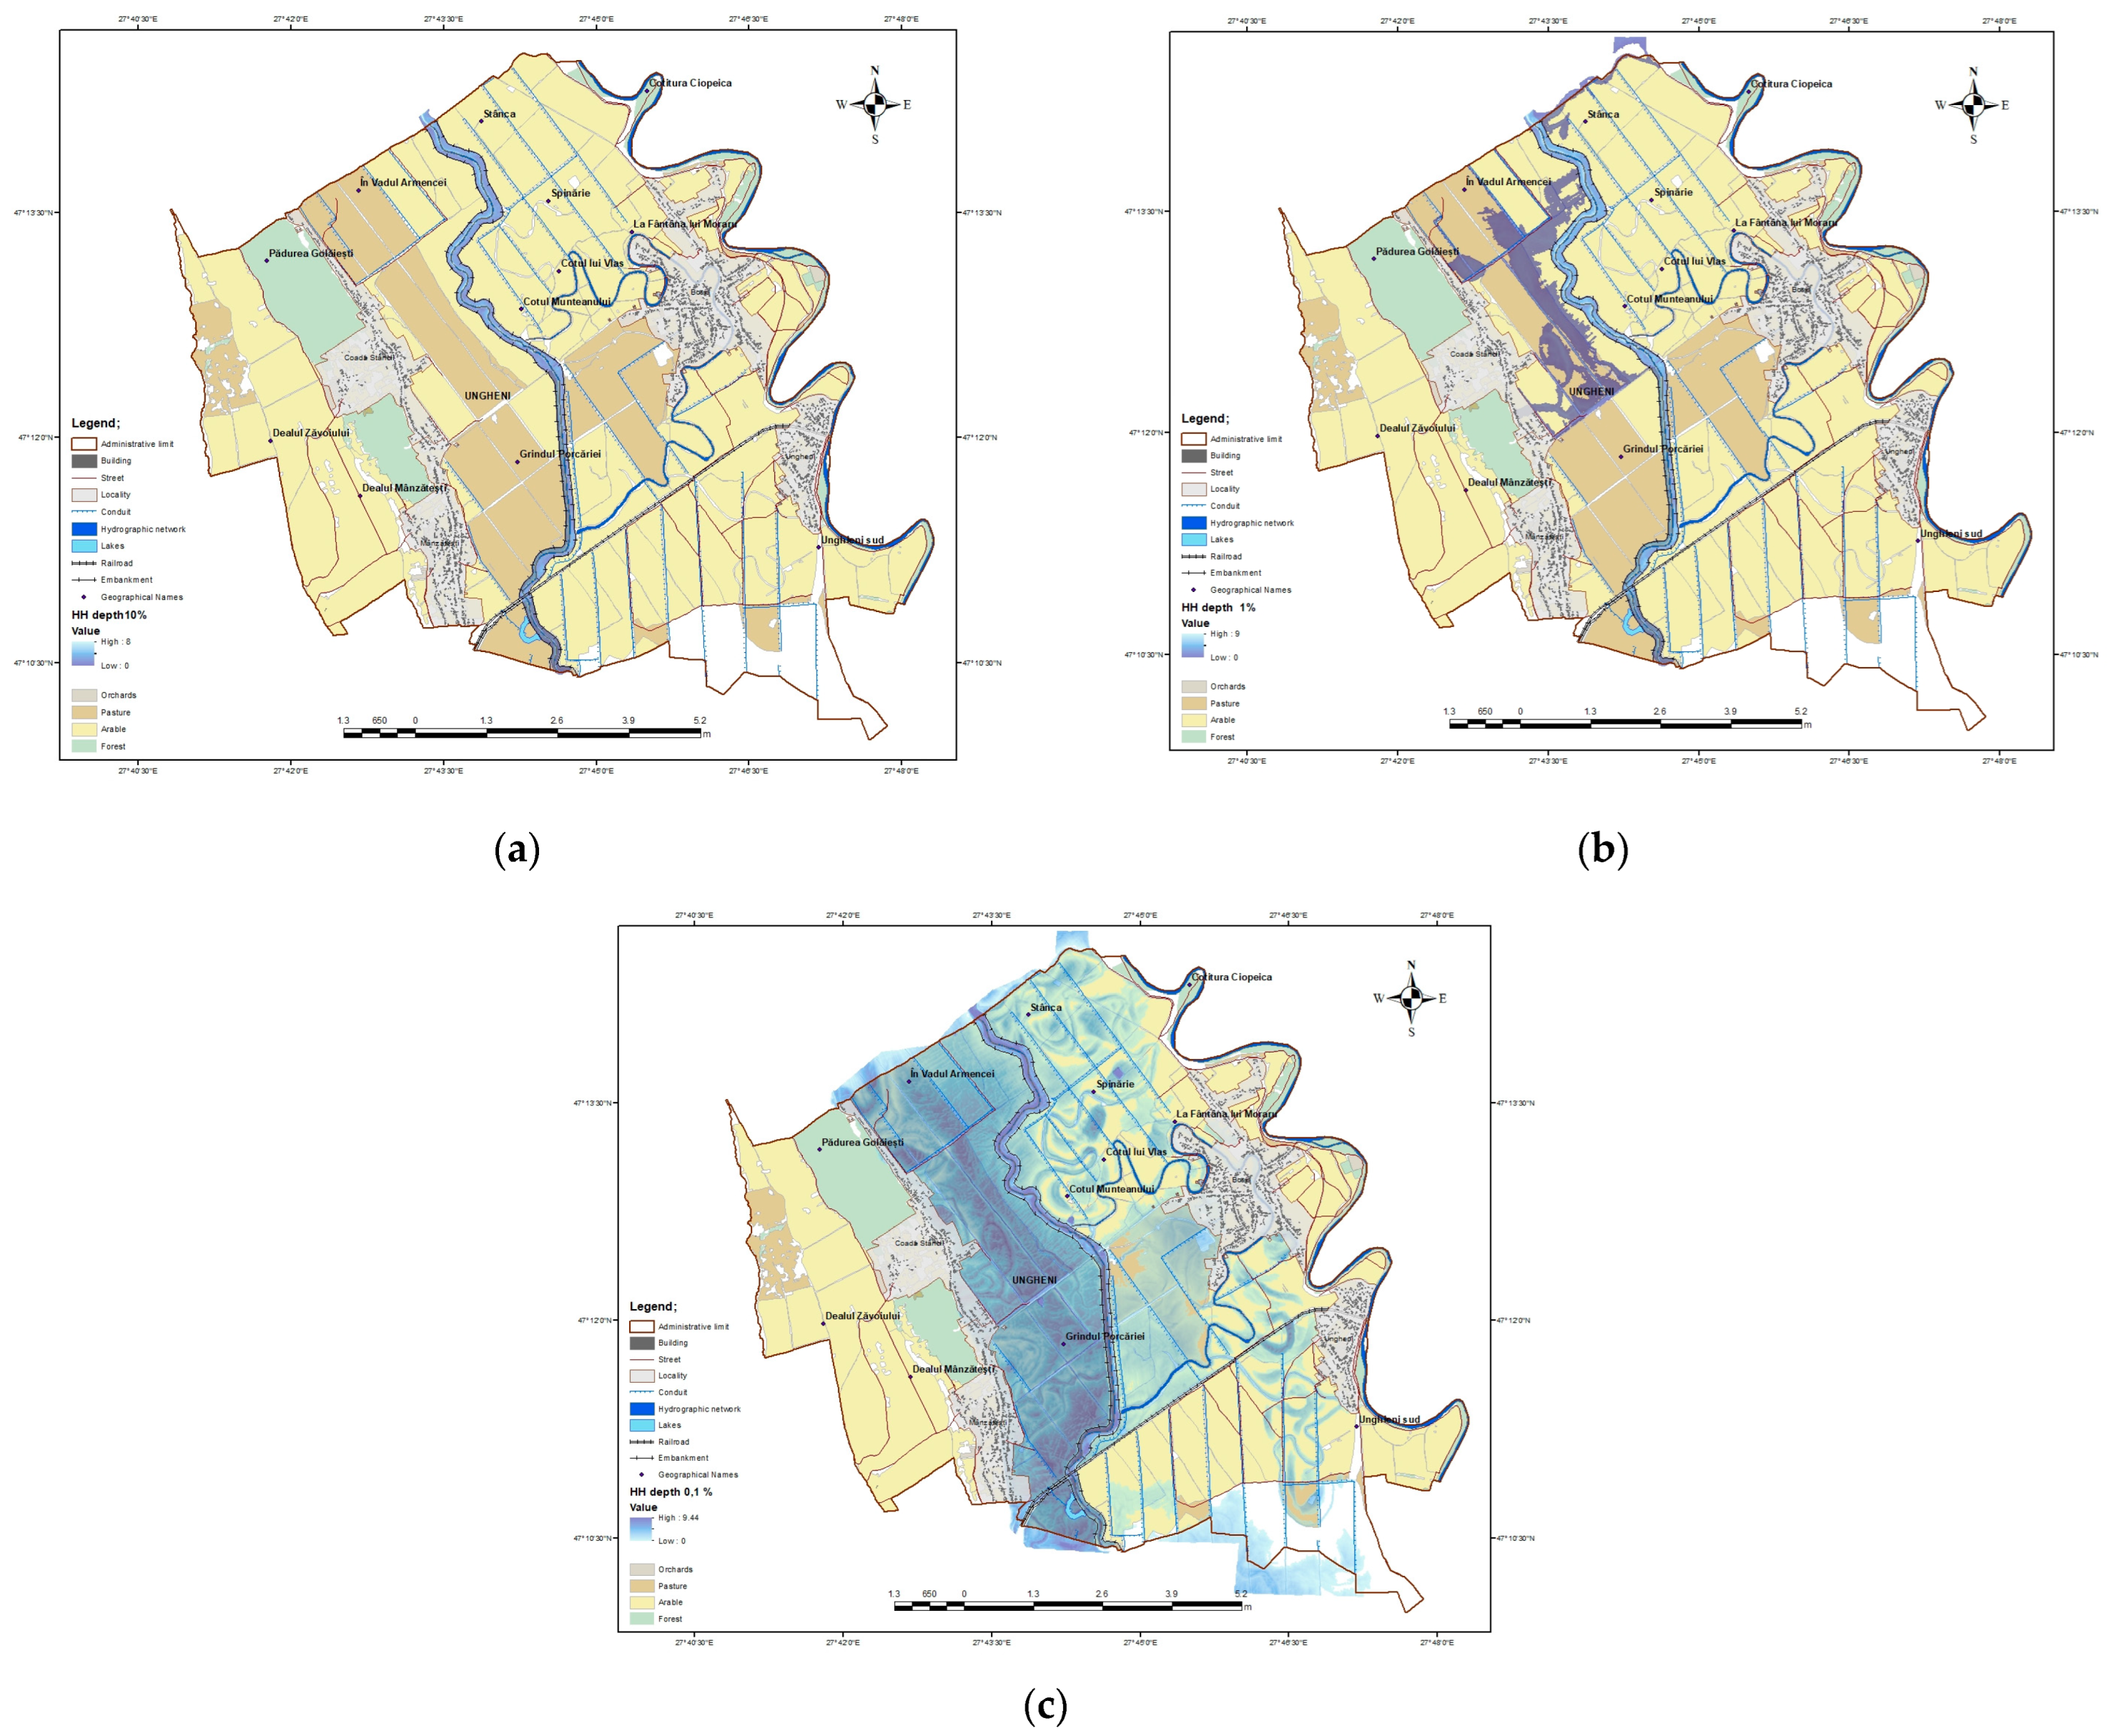
3.2.1. Flood Hazard Maps
3.2.2. Landslide Hazard Maps
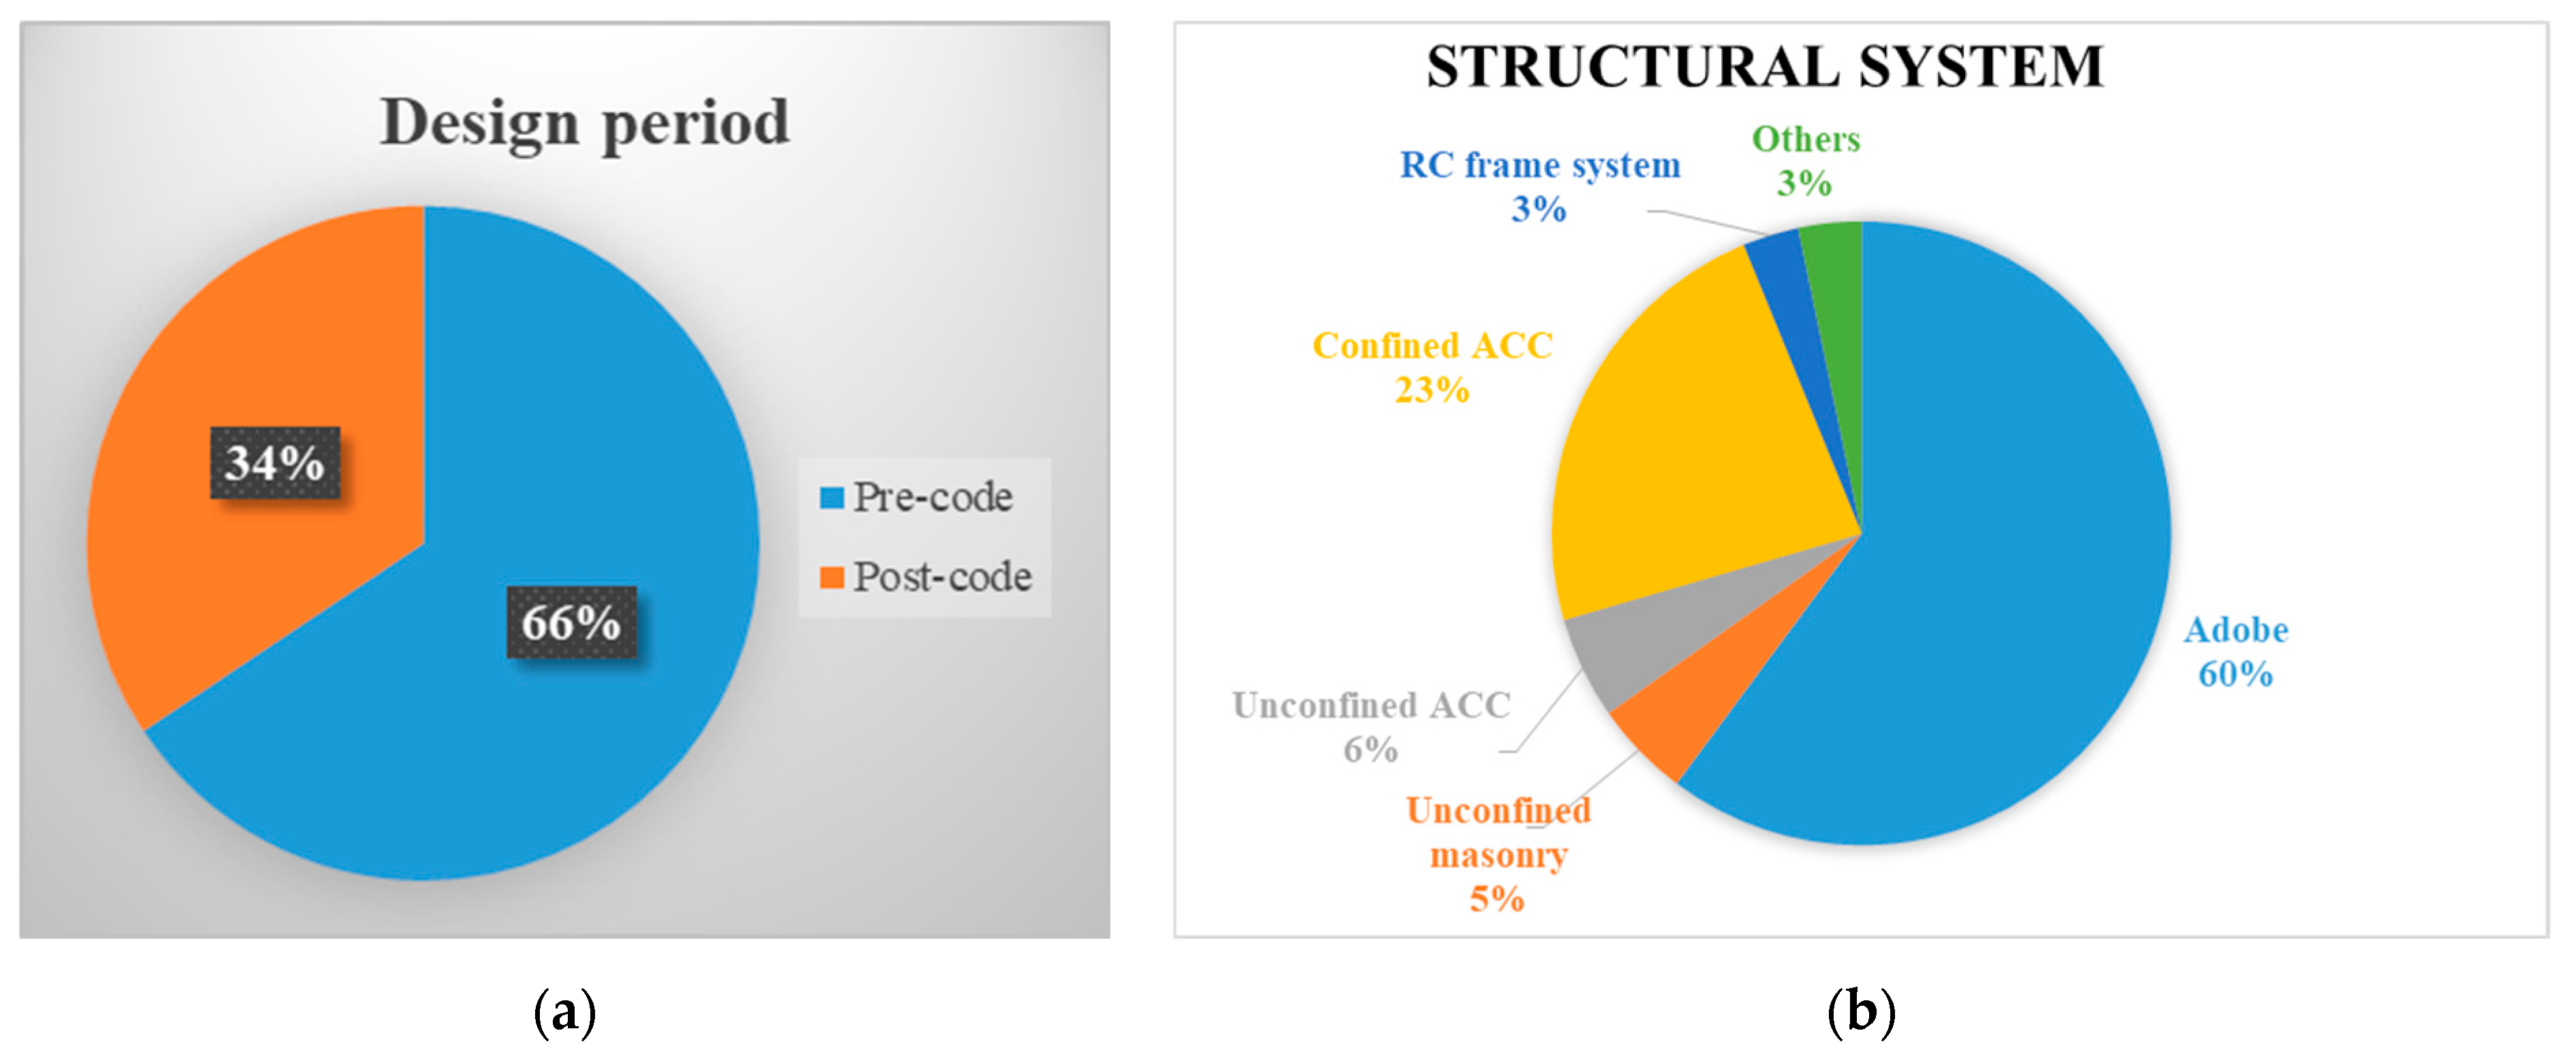
3.2.3. Seismic Hazard
4. Results
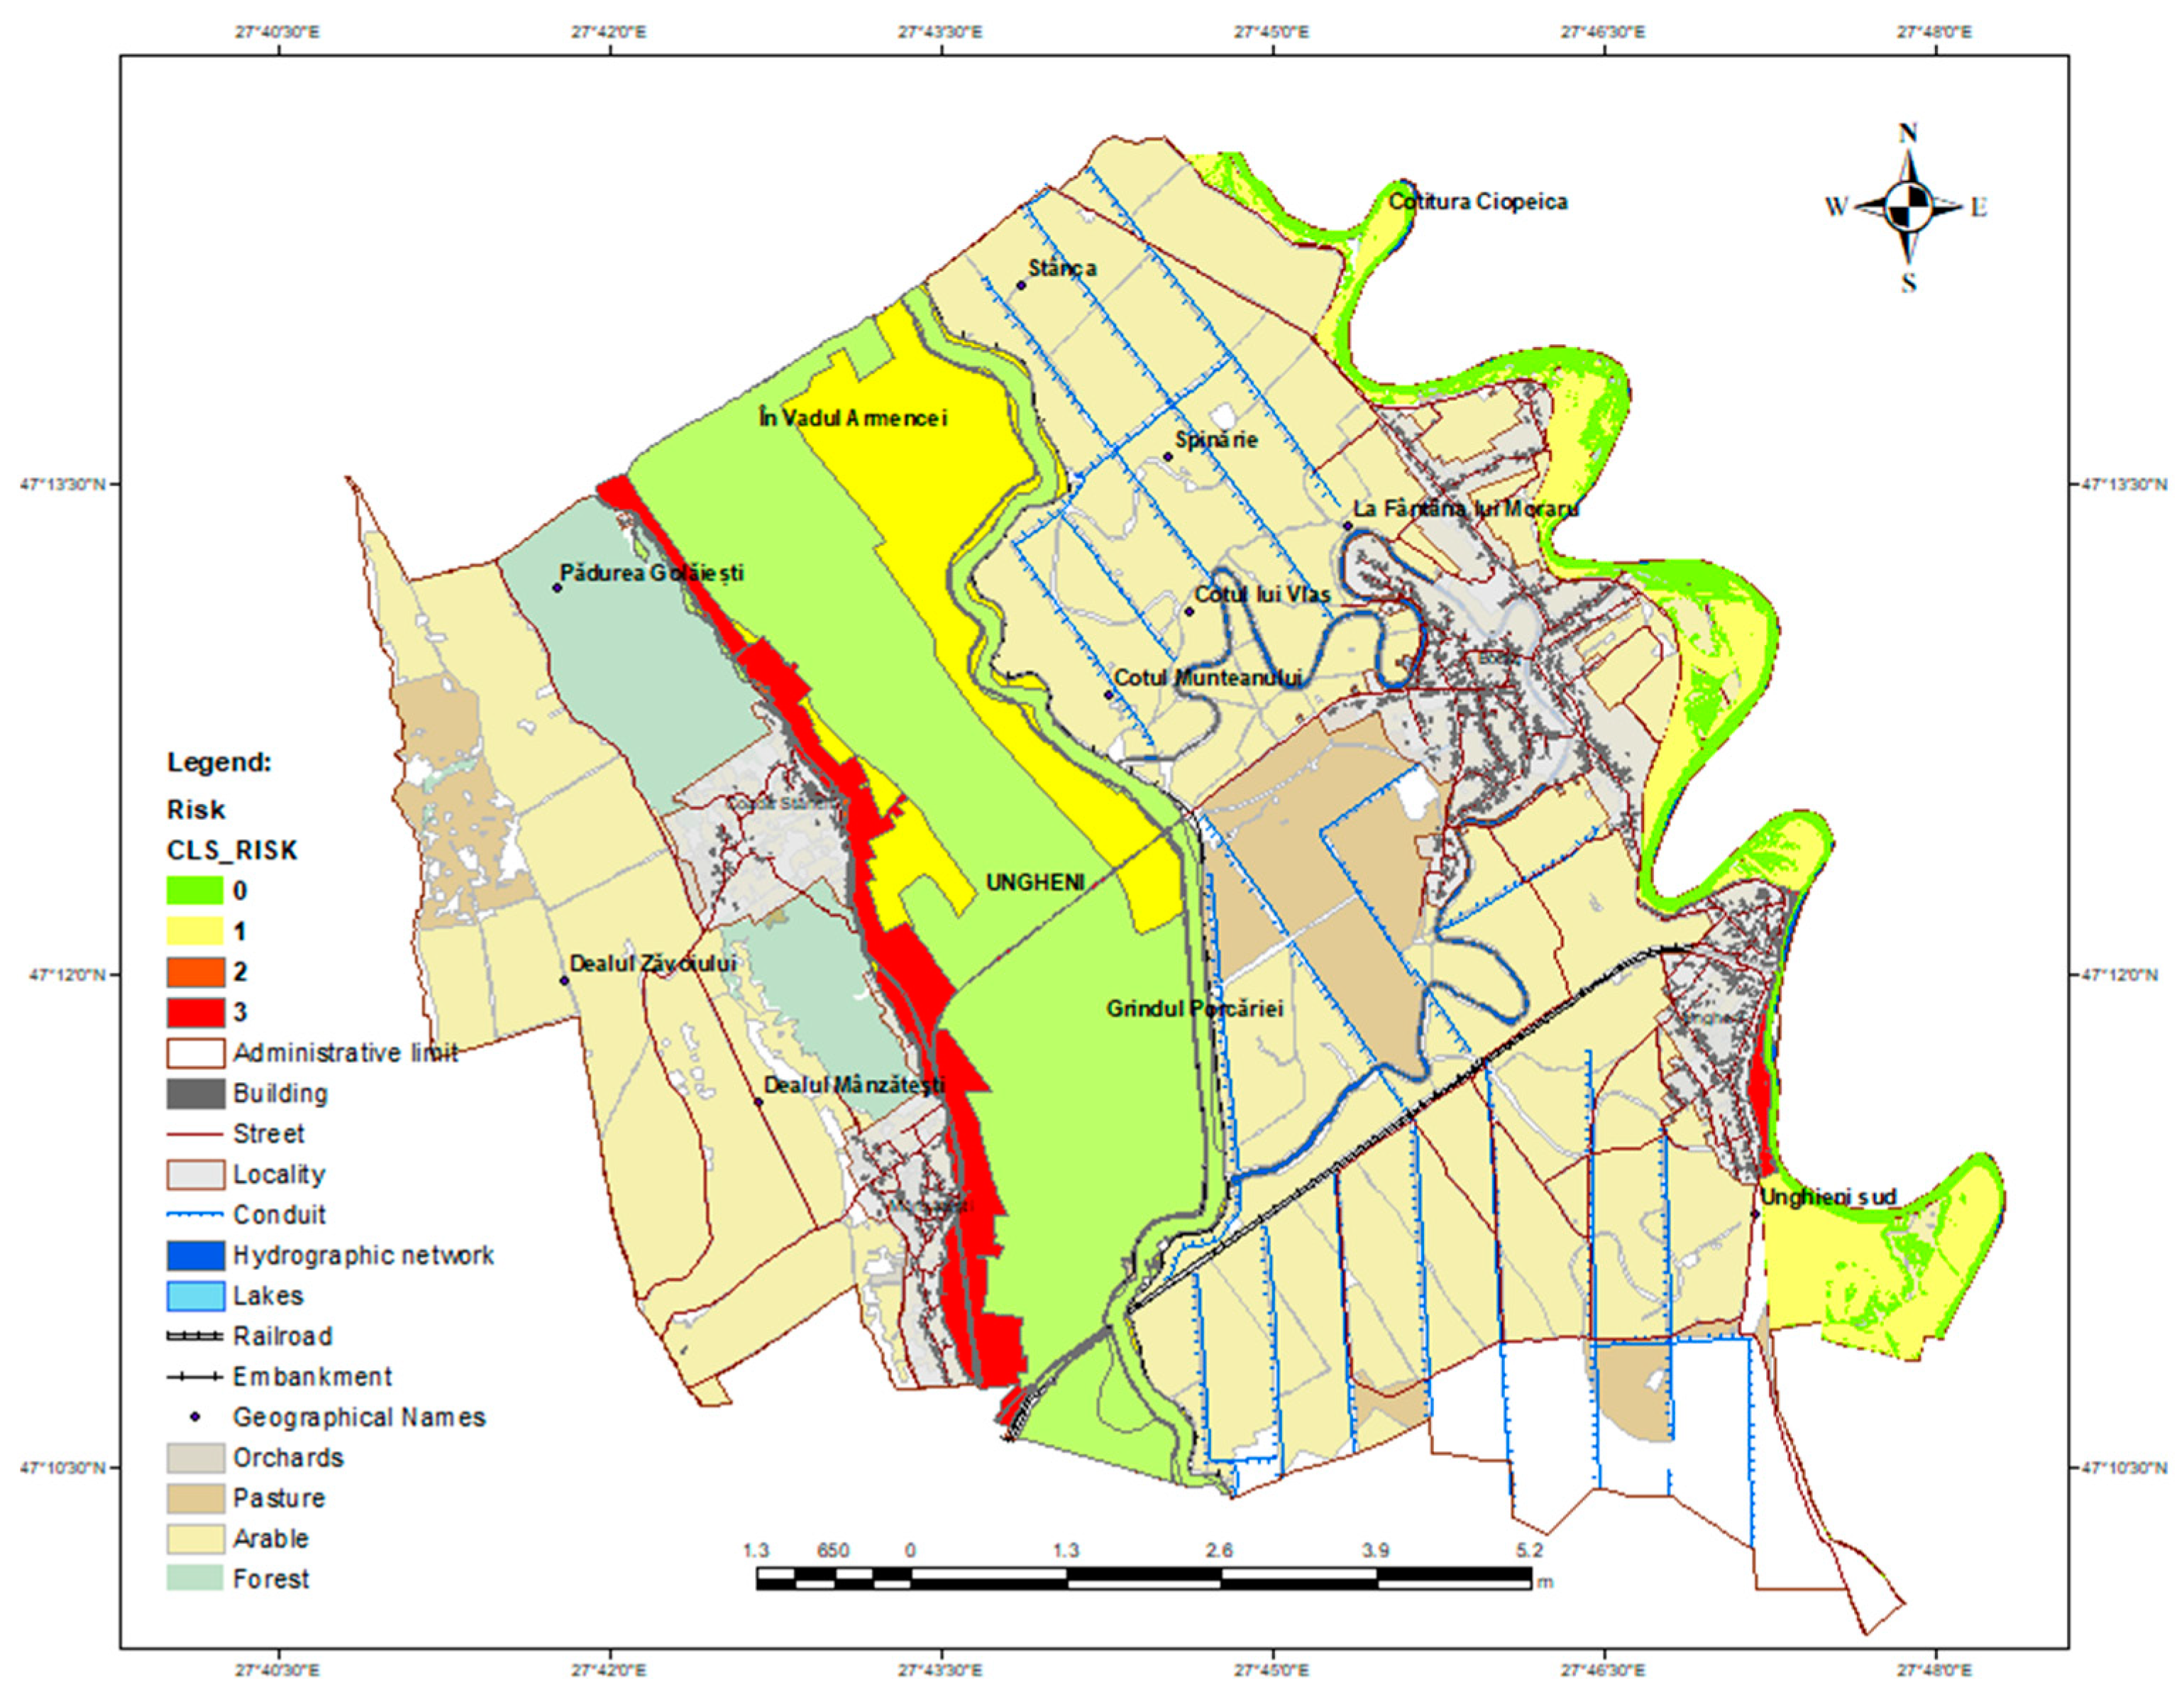
4.1. Flood Risk Map
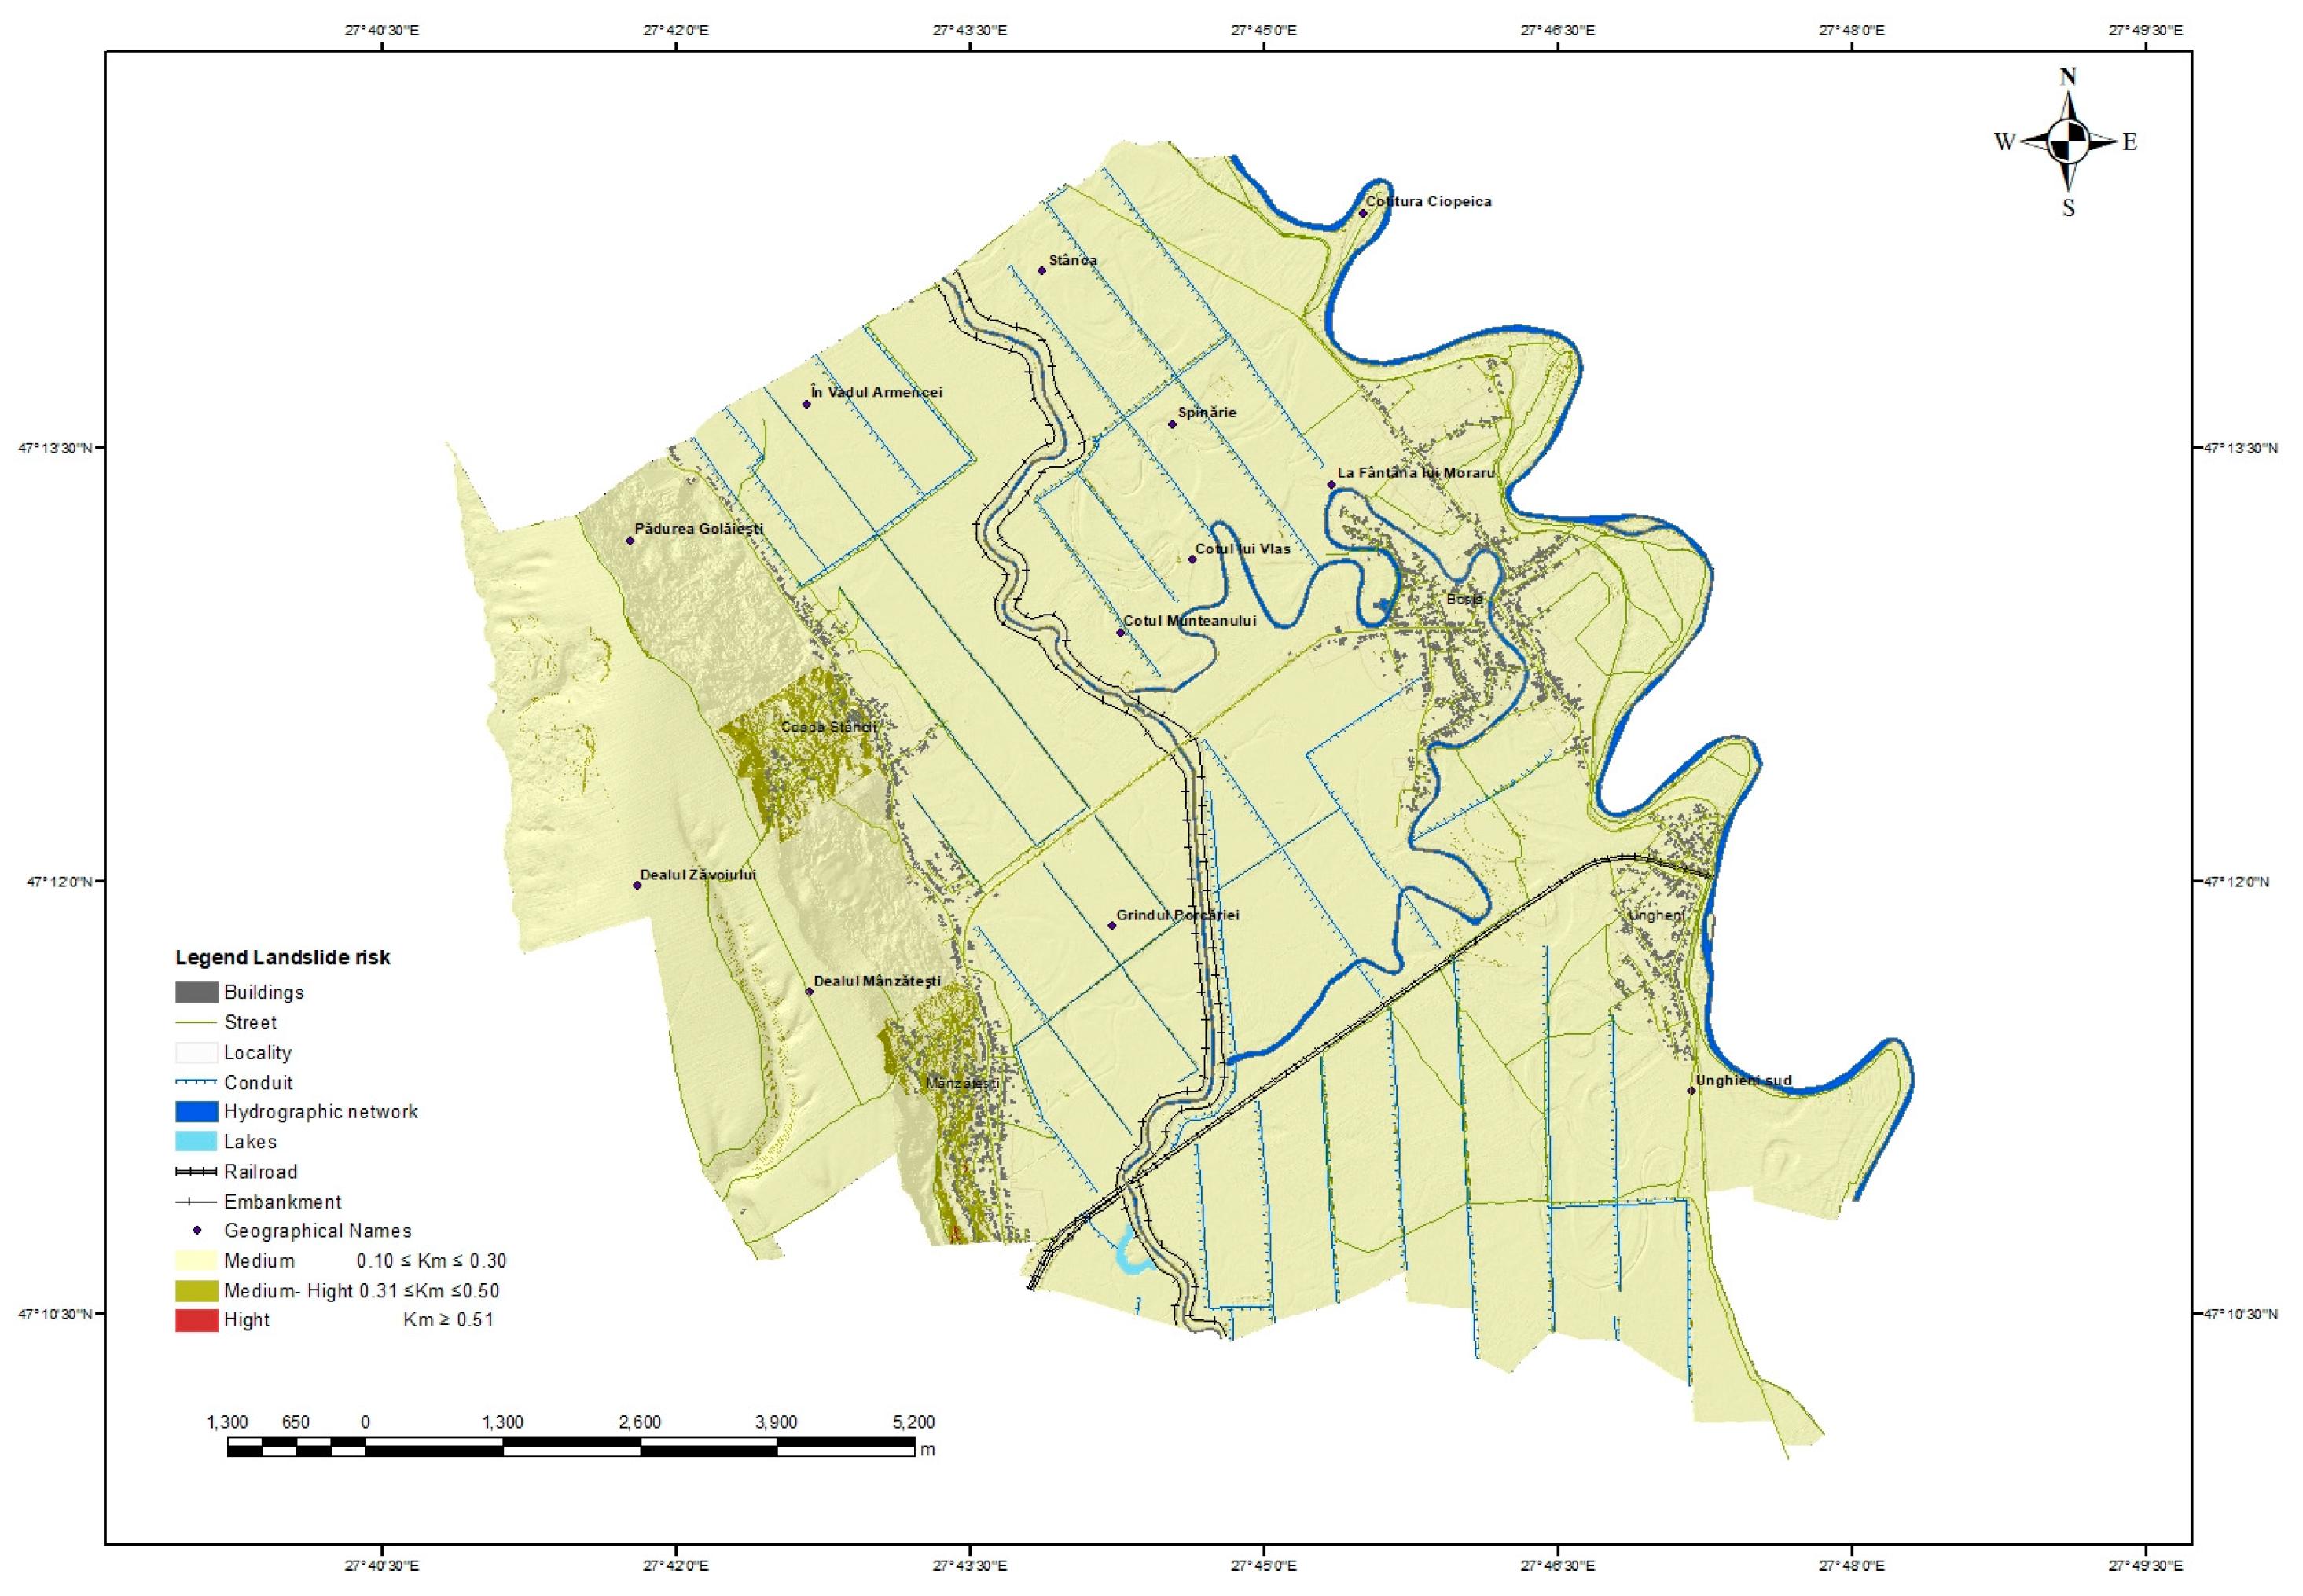
4.2. Landslide Risk Map
4.3. Seismic Risk Map
5. Discussion
6. Conclusions
Author Contributions
Funding
Institutional Review Board Statement
Informed Consent Statement
Data Availability Statement
Acknowledgments
Conflicts of Interest
References
- Ritchie, H.; Rosado, P. Natural Disasters, How Many People Die from Disasters, and How Are These Impacts Changing over Time? Available online: https://ourworldindata.org/natural-disasters (accessed on 10 March 2024).
- Drakes, O.; Tate, E. Social vulnerability in a multi-hazard context: A systematic review. Environ. Res. Lett. 2022, 17, 033001. [Google Scholar] [CrossRef]
- Yazdani, M.; Mojtahedi, M.; Loosemore, M.; Sanderson, D. A modelling framework to design an evacuation support system for healthcare infrastructures in response to major flood events. Prog. Disaster Sci. 2022, 13, 100218. [Google Scholar] [CrossRef]
- Chirilă, C.; Oniga, V.E.; Diac, M.; Crenganiș, L.M. Overview of Spatial Reference Systems for Hazard Risk Management in the NE Region of Romania. Bull. Polytech. Inst. Iasi-Constr. Archit. 2020, 66, 85–98. [Google Scholar]
- Chirilă, C. Sisteme de Referință Spațiale; Editura Tehnopress: Iași, Romania, 2015. [Google Scholar]
- EM-DAT Report. 2022. Available online: https://www.cred.be/sites/default/files/2022_EMDAT_report.pdf (accessed on 1 March 2024).
- Available online: https://blogs.egu.eu/divisions/nh/2021/10/04/natural-hazards-101-multi-hazards-and-multi-hazard-risk/ (accessed on 29 January 2024).
- Miller, N. More Flooding for Europe. BBC Weather, 27 February 2024. [Google Scholar]
- Hochwasser aktuell: Zahl der Toten in Rheinland-Pfalz steigt auf 128—Mindestens 177 Opfer durch Flut in Deutschland. Die Welt (în germană), 22 July 2021.
- Benoit, B.; Pancevski, B. Germany Flooding Explained: What to Know about the Devastating Downpour. The Wall Street Journal, 16 July 2021. [Google Scholar]
- Wilde, M.; Günther, A.; Reichenbach, P.; Malet, J.-P.; Hervás, J. Pan-European landslide susceptibility mapping: ELSUS Version 2. J. Maps 2018, 14, 97–104. [Google Scholar] [CrossRef]
- Günther, A.; Van Den Eeckhaut, M.; Malet, J.-P.; Reichenbach, P.; Hervás, J. Climate-physiographically differentiated Pan-European landslide susceptibility assessment using spatial multi -criteria evaluation and transnational landslide information. Geomorphology 2014, 224, 69–85. [Google Scholar] [CrossRef]
- Lee, W.H.K. Challenges in Observational Seismology. Int. Geophys. 2002, 81, 269–281. [Google Scholar] [CrossRef]
- Takewaki, I.; Murakami, S.; Fujita, K.; Yoshitomi, S.; Tsuji, M. The 2011 off the Pacific coast of Tohoku earthquake and response of high-rise buildings under long-period ground motions. Soil Dyn. Earthq. Eng. 2011, 31, 1511–1528. [Google Scholar] [CrossRef]
- Summers, J.K.; Sanderson, R.; Trahan, R.; Hendricks, K.; Ruffin, M.; Williams, A.; Lamper, A.; Lowery, M.; Harwell, L.C. Development of Community-Level Capacity of Resilience to Natural Hazards for Environmental- and Social-Justice-Challenged Communities: 1. Approach, Concepts, and Assessment of Existing Information. Sustainability 2024, 16, 963. [Google Scholar] [CrossRef]
- Pörtner, H.-O.; Roberts, D.C.; Tignor, M.; Poloczanska, E.S.; Mintenbeck, K.; Alegría, A.; Craig, M.; Langsdorf, S.; Löschke, S.; Möller, V.; et al. (Eds.) IPCC, 2022: Climate Change 2022: Impacts, Adaptation and Vulnerability. Contribution of Working Group II to the Sixth Assessment Report of the Intergovernmental Panel on Climate Change; Cambridge University Press: Cambridge, UK; New York, NY, USA, 2022; Chapter 12; 3056p. [Google Scholar] [CrossRef]
- Ba, R.; Deng, Q.; Liu, Y.; Yang, R.; Zhang, H. Multi-hazard disaster scenario method and emergency management for urban resilience by integrating experiment–simulation–field data. J. Saf. Sci. Resil. 2021, 2, 77–89. [Google Scholar] [CrossRef]
- Mouroux, P.; Brun, B. Presentation of RISK-UE project. Bull. Earthq. Eng. 2006, 4, 323–339. [Google Scholar] [CrossRef]
- Atlas of the Human Planet 2017—Global Exposure to Natural Hazards. Available online: https://ghsl.jrc.ec.europa.eu/documents/Atlas_2017.pdf?t=1494602313 (accessed on 27 February 2024).
- Available online: https://leap.unep.org/en/countries/ro/national-legislation/law-no-575-22-october-2001-approval-national-spatial-planning (accessed on 10 March 2024).
- Georgescu, E.; Pomonis, A. A Review of Socio-Economic Consequences, Losses and Human Casualties of the 1977 Vrancea, Romania Earthquake. Constr. J. Civ. Eng. Res. 2011, 12, 21. [Google Scholar]
- Adler, M.-J. Floods Monitoring. In Extreme Weather and Impacts of Climate Change on Water Resources in the Dobrogea Region; IGI Global: Hershey, PA, USA, 2015. [Google Scholar] [CrossRef]
- Available online: https://environmentalrisks.danube-region.eu/east-avert/ (accessed on 25 January 2024).
- Oniga, V.E.; Crenganiş, L.; Diac, M.; Chirilă, C. Overview on Remote Sensing Methods and Data Sources for Floods and Landslides Management. Bul. Institutului Politeh. Lasi. Sect. Constr. Arhit. 2020, 66, 59–70. [Google Scholar]
- World Bank Group; GFDRR. Accelerating Risk Reduction through Forward Looking Investments and Policies in Romania; GFDRR: Washington, DC, USA, 2019; Available online: https://thedocs.worldbank.org/en/doc/567591569916818709-0080022019/original/RomaniaRiskReduction2pagerOctober2019.pdf (accessed on 3 March 2024).
- World Bank Group; GFDRR. Strengthening Moldova’s Disaster Risk Management and Climate Resilience, June 2020. Available online: https://documents1.worldbank.org/curated/en/767811616046683526/pdf/Strengthening-Moldova-s-Disaster-Risk-Management-and-Climate-Resilience-Facing-Current-Issues-and-Future-Challenges.pdf (accessed on 1 May 2024).
- World Bank Group. Moldova Paths to Sustained Prosperity. A Systematic Country Diagnostic, Report No. 107502-MD; World Bank Group: Washington, DC, USA, 2016; Available online: https://documents1.worldbank.org/curated/en/465041475522681625/pdf/Moldova-SCD-clean-09232016.pdf (accessed on 3 March 2024).
- Available online: https://eur-lex.europa.eu/legal-content/RO/TXT/?uri=celex%3A32007L0060 (accessed on 27 January 2024).
- Crenganiş, L.; Bofu, C.; Balan, I.; Boariu, C.; Hogaş, H. Historic Flooding in The Prut-Bârlad Catchments. Int. Multidiscip. Sci. GeoConf. SGEM 2018, 18, 351–358. [Google Scholar]
- Albano, R.; Samela, C.; Crăciun, I.; Manfreda, S.; Adamowski, J.; Sole, A.; Sivertun, Å.; Ozunu, A. Large Scale Flood Risk Mapping in Data Scarce Environments: An Application for Romania. Water 2020, 12, 1834. [Google Scholar] [CrossRef]
- Nicuță Precul, A.M.; Nistor-Lopatenco, L.; Pantaz, A. Mapping floods risk for the implementation of an efficient management of natural disasters in Romania and Republic of Moldova. Int. Sci. J. Ind. 4.0 2022, 7, 147–150. [Google Scholar]
- Romanian Government Decision-Methodological Rules Regarding the Preparation and Content of Natural Risk Maps for Landslides. Available online: https://oot.rmdsz.ro/sites/default/files/HG_447-2003 (accessed on 3 March 2024).
- Boboc, N.; Bejan, I.; Castraveț, T.; Jechiu, I.; Muntean, V.; Ercanoglu, M.; Sîrodoev, G.; Sîrodoev, I.; Bolfos, N.; Serbina, S. Contributions to spatial landslide assessments in the Bâc tableland. Georeview Geogr. Ser. 2009, 18, 19–24. [Google Scholar]
- Shaker, R.R.; Sirodoev, I. Landslide Susceptibility in the Republic of Moldova: A Landscape and Multivariate Approach for Regional Assessment. Assessment 2011, 34, 288–298. [Google Scholar]
- Diac, M.; Chirilă, C.; Oniga, E.V.; Hogas, H.I. Creating hydrological risk maps based on the rectified digital terrain model in The Nicolina Hydrographical Basin. In Proceedings of the International Multidisciplinary Scientific GeoConference: SGEM, Albena, Bulgaria, 30 June–6 July 2016; Volume 1, pp. 219–226. [Google Scholar]
- Seismic Design Code P100_1_2013. Available online: https://www.mdlpa.ro/userfiles/reglementari/Domeniul_I/I_22_P100_1_2013.pdf (accessed on 3 March 2024).
- Diac, M.; Crenganis, L.M.; Bofu, C.; Marcu, C. Geospatial Input Data Validation in Modelling Hydrological Risk. In Proceedings of the Modern Tehnologies for the 3rd Millennium, Oradea, Romania, 4–5 April 2019; pp. 13–20. [Google Scholar]
- Iftode, V.-I.; Olteanu-Dontov, I.; Mihai, P. Structural particularities for an irregular building, in plan and elevation, situated in seismic area. Bull. Polytech. Inst. Iasi Construction. Archit. Sect. 2019, 65, 77–88. [Google Scholar]
- Rotaru, A.; Pescaru, R.; Olteanu-Dontov, I.; Nicuta, A.M.; Mihai, P.; Ciocan, V.; Balan, M.C. Hazard Risk Mitigation for a Sustainable Built Environment. In Critical Thinking in the Sustainable Rehabilitation and Risk Management of the Built Environment, CRIT-RE-BUILD, Proceeding of the International Conference, Iasi, Romania, 7–9 November 2019; Springer: Berlin/Heidelberg, Germany, 2019. [Google Scholar]
- Olteanu, I.; Bărbat, A.H.; Budescu, M. Vulnerability Assessment of Reinforced Concrete Framed Structures Considering the Effect of Structural Characteristics. Open Civ. Eng. J. 2015, 9, 321–329. [Google Scholar] [CrossRef]
- Budescu, M.; Soveja, L.; Olteanu, I. Some remarks regarding seismic vulnerability for orthodox churches. In The 1940 Vrancea Earthquake. Issues, Insights and Lessons Learnt; Springer International Publishing: Cham, Switzerland, 2016. [Google Scholar] [CrossRef]
- Țăranu, G. Case Study—Comparative Analysis of an RC Structure, Part of a Complex of Adjacent Buildings. Bull. Polytech. Inst. Jassy. Construction. Archit. Sect. 2020, 66, 107–122. [Google Scholar]
- Grunthal, G. European Macroseismic Scale; Cemtre Europeen de Geodynamique et de Seismologie: Luxembourg, 1998; ISBN 2-87977-008-4. [Google Scholar]
- Costabile, P.; Costanzo, C.; Ferraro, D.; Macchione, F.; Petaccia, G. Performances of the New HEC-RAS Version 5 for 2-D Hydrodynamic-Based Rainfall-Runoff Simulations at Basin Scale: Comparison with a State-of-the Art Model. Water 2020, 12, 2326. [Google Scholar] [CrossRef]
- Flood Risk Management Plan, National Synthesis. Available online: http://www.mmediu.ro/app/webroot/uploads/files/2016-04-26_PMRI_Sinteza_Nationala.pdf (accessed on 3 March 2024).


| Romania (EU Country) | Republic of Moldavia (Non-EU Country) | |
|---|---|---|
| Risks | Earthquakes, floods, doubt, landslides, wildfires, and extreme weather events | Earthquakes, floods, doubt, and extreme weather events |
| Strategy for Disaster Risk Management (DRM) |
|
|
| Factors | Class | Value | Range of Values | |
|---|---|---|---|---|
| Name | Label | |||
| lithological factor | Ka | medium-high | 0.7 | 0.7–0.95 |
| high | 0.8 | |||
| extreme | 0.95 | |||
| geomorphological factor | Kb | low | 0.05 | 0.05–0.9 |
| medium | 0.4 | |||
| medium-high | 0.7 | |||
| high | 0.9 | |||
| structural factor | Kc | medium | 0.3 | 0.3 |
| hydrological and climatic factors | Kd | medium | 0.4 | 0.4–0.5 |
| medium-high | 0.5 | |||
| hydrogeological factor | Ke | low | 0.05 | 0.05–0.4 |
| medium-high | 0.4 | |||
| seismic factor | Kf | high | 0.9 | 0.9 |
| forestry factor | Kg | low | 0.1 | 0.1–0.5 |
| medium-high | 0.3 | |||
| high | 0.5 | |||
| anthropic factor | Kh | low | 0.1 | 0.1–0.8 |
| high | 0.8 | |||
| Risk | Buildings | Land Use Categories | Infrastructure (Roads) | Urban Area | ||||
|---|---|---|---|---|---|---|---|---|
| probability | units | surface area (mp) | parcels | surface area (ha) | sections | length (km) | localities | area (ha) |
| 0.1% | 882 | 62,653.4 | 42 | 842.16 | 55 | 13.50 | 2 (Coada Stancii, Manzatesti) | 122.95 |
| 1% | 2 | 4.5 | 18 | 151.88 | 3 | 0.71 | 1 (Ungheni) | 3.81 |
Disclaimer/Publisher’s Note: The statements, opinions and data contained in all publications are solely those of the individual author(s) and contributor(s) and not of MDPI and/or the editor(s). MDPI and/or the editor(s) disclaim responsibility for any injury to people or property resulting from any ideas, methods, instructions or products referred to in the content. |
© 2024 by the authors. Licensee MDPI, Basel, Switzerland. This article is an open access article distributed under the terms and conditions of the Creative Commons Attribution (CC BY) license (https://creativecommons.org/licenses/by/4.0/).
Share and Cite
Olteanu, I.; Crenganiș, L.M.; Diac, M.; Precul, A.M. Sustainable Approach of a Multi-Hazard Risk Assessment Using GIS Customized for Ungheni Areal Situated in the Metropolitan Area of Iasi. Sustainability 2024, 16, 4485. https://doi.org/10.3390/su16114485
Olteanu I, Crenganiș LM, Diac M, Precul AM. Sustainable Approach of a Multi-Hazard Risk Assessment Using GIS Customized for Ungheni Areal Situated in the Metropolitan Area of Iasi. Sustainability. 2024; 16(11):4485. https://doi.org/10.3390/su16114485
Chicago/Turabian StyleOlteanu, Ioana, Loredana Mariana Crenganiș, Maximilian Diac, and Alina Mihaela Precul. 2024. "Sustainable Approach of a Multi-Hazard Risk Assessment Using GIS Customized for Ungheni Areal Situated in the Metropolitan Area of Iasi" Sustainability 16, no. 11: 4485. https://doi.org/10.3390/su16114485