Article

Sustainable Development in Gansu Province: Theil Index and Cluster Analysis

School of Architecture and Urban Planning, Lanzhou Jiaotong University, Lanzhou 730070, China
*
Author to whom correspondence should be addressed.
Sustainability 2024, 16(11), 4518; https://doi.org/10.3390/su16114518
Submission received: 25 March 2024 / Revised: 18 May 2024 / Accepted: 24 May 2024 / Published: 26 May 2024

Abstract

:
With the advancement of the rural revitalization strategy, counties have emerged as vital platforms for supporting rural revitalization, underscoring the increasing importance of sustainable development in their economies. It is imperative to evaluate the sustainable development potential of county economies and implement precise measures accordingly. This paper selects relevant economic development indicators from 2016 to 2020 for 76 counties in Gansu Province, constructs an evaluation system for assessing their sustainable development potential, and employs methods such as the Theil index, spatial autocorrelation, principal component analysis, and cluster grouping classification. The evaluation considers three aspects: the county economic development gap, the development potential score, and cluster analysis. The findings reveal that the economic development of Gansu Province’s counties exhibits spatial characteristics of multi-point flowering and scattered distribution, with relatively weak communication and development between surrounding counties. Over the five-year period, significant disparities in economic development among Gansu Province’s counties are evident. Liangzhou District ranks highest in county economic development, while other counties with robust economic development are primarily concentrated in the Lanzhou–Baiyin metropolitan area, the Tianshui metropolitan area, the west entrance of the Hexi Corridor economic belt, and the Qingyang–Pingliang group area. These counties exhibit a spatial pattern of agglomeration towards the central and eastern regions. Moreover, some counties in the southeastern region of Longdong demonstrate promising economic development potential, forming an initial scale of contiguous development. This indicates favorable prospects for sustainable development in the region’s county economy.

1. Introduction

Since the coronavirus disease of 2019 (COVID-19), the world has entered the post-epidemic era [1]. Due to the impact of the epidemic, the economic development of countries has been traumatized to varying degrees. The outbreak and spread of the epidemic not only brought economic activities to a standstill in many countries, but also exposed the vulnerability and unsustainability that economic development may encounter [2]. As countries gradually resume economic activities, sustainable economic development has become an important issue. The aim of sustainable economic development, in turn, is to achieve a balance between economic growth, social equity, and environmental protection to ensure the well-being of current and future generations [3]. From existing research, it is clear that cities with more developed economies will be more sustainable due to their own financial and resource expertise [4].
In 2022, China prioritized the county as a crucial entry point for advancing urban–rural integration [5], aiming to achieve Chinese-style modernization through high-quality urban–rural integration. Research findings on the high-quality development index of county economies in 2019 reveal that China’s counties collectively contributed 41% to the nation’s total economic volume, with the primary and secondary industries accounting for over 75% and 40% of the national total, respectively. This underscores the county’s significance as a pivotal node for urban–rural interactions, resource optimization, and coordinated development. Consequently, the economic advancement of counties is indispensable to the overall national economy [6].
In China, the development of county economies can not only promote the rational allocation and complementary development of urban and rural resources, but also promote industrial upgrading and increased employment opportunities in rural areas [7,8,9]. By strengthening the development of county economies, it is possible to narrow the development gap between urban and rural areas and realize balanced economic and social development. At the same time, the development of county economies will also help to protect environmental resources and promote the realization of green and sustainable development [10].
Since the promulgation of the ‘National Rural Revitalization Strategic Plan (2018–2022)’ policy, the development of China’s rural areas has accelerated significantly [11]. By 2021, China successfully eradicated poverty nationwide, marking a comprehensive victory in poverty alleviation efforts. With this achievement, rural development transitioned onto a new trajectory, emphasizing high-quality urban–rural integration [12].
This integration encompasses various dimensions, including economic, social, political, and cultural aspects, with economic integration taking precedence. Without a thriving economy, the implementation of social welfare policies becomes challenging. Particularly in the western region, the economic development of some counties lags behind, hindering their ability to lead rural revitalization efforts effectively.
Moreover, traditional agricultural practices in the western region suffer from small-scale operations, scattered layouts, limited value chains, and insufficient linkage between agricultural activities and county economies. These factors collectively diminish the vitality and capacity of county economies to support rural development [13].
The county economy typically functions as an administrative division economy centered around the county, with townships acting as connectors and rural areas serving as hinterlands. Its economic development is characterized by regionalization, specialization, individualization, and differentiation [14]. The progression of the county economy significantly influences communication and exchange between rural and urban areas. The vitality of the county economy will play a pivotal role in shaping the future national unified market system [15]. Simultaneously, the county economy reflects ecological aspects. China’s efforts in ecological civilization construction have imposed higher demands on counties. Carbon emissions reduction and ecological construction have emerged as focal points in county economic development. Numerous scholars have conducted analyses and research on the ecological aspects of the county economy [16,17].
In existing research on the county economy, scholars both domestically and internationally analyze its development through various lenses, including the impacts of COVID-19 [18,19], population dynamics [20], night light data [21,22,23], population aging [24], and the level of e-commerce development [25]. It is suggested that factors such as public health, demographic structure, the education sector, and industrial development all exert influence on the county economy. Additionally, scholars have investigated the driving forces and spatiotemporal pattern evolution of county economic development nationwide [26,27,28], as well as in specific regions such as Northeast China [29], the Chengdu–Chongqing region [30], Central China [31], the Yangtze River economic belt [32,33,34], and others, from a regional perspective.
Overall, it is recognized that natural resources and administrative boundaries profoundly shape the development of county economies in China [35]. County economies’ progress is intricately linked with the overall trajectory of China’s economic development and the sustainable advancement of the rural revitalization strategy.
Furthermore, the sustainable development of the county economy also influences the formulation and execution of economic resilience and sustainable financial policies [36]. Economic development within and among regions should strive for common growth and diminish inequality [37,38]. At the same time, finances also affect the development of the county and enhance competitiveness. The county’s financial success will effectively promote the growth of the county’s economy, but there are also uncoordinated and unsustainable factors to consider [39].
Under the current situation of China’s economic development, the development of county economies has been put on the agenda as an important path to realize balanced regional economic development. However, Gansu Province is a relatively economically backward province, and how to realize this economic transformation and sustainable development by deeply tapping into the potential of its counties is an important issue in front of us. For Gansu Province, its total Gross Domestic Product (GDP) has consistently ranked 27th among the 31 provincial-level regions in the country from 2016 to 2020. Breaking away from this development situation and promoting the sustainable development of the county economy has become imperative. Based on this, this paper analyzes the cities and counties in Gansu Province, selects 76 counties in Gansu Province as the research object, frames the index evaluation system, focuses on the economic status quo, development bottlenecks, and potential exploration of the counties, provides a theoretical basis for the formulation of targeted county development strategies, and promotes the overall economy of Gansu Province to achieve leapfrog development.
Lastly, the remainder of the paper is organized as follows: in Section 2, we discuss materials and methods, and in Section 3, we describe the results and provide discussion. Finally, we conclude the article with conclusions, recommendations, policy insights, and future work.

2. Materials and Methods

2.1. Study Area

Gansu Province (92°13′–108°46′ E, 32°11′–42°57′ N) is situated in northwestern China, bordering seven provinces, encompassing 12 prefecture-level cities, and including two autonomous prefectures (Linxia and Gannan), comprising a total of 86 counties (cities, districts). Positioned in the middle and upper reaches of the Yellow River, Gansu lies at the convergence of three plateaus. The province boasts a rugged terrain characterized by numerous mountains, predominantly running northwest to southeast [40]. Gansu exhibits a long and narrow geographical profile with diverse landforms. The southwestern region is elevated, gradually descending towards the northeast. Stretching 1569 km from east to west and 530 km from north to south, Gansu traverses four primary climate zones: subtropical monsoon, temperate monsoon, temperate continental arid, and plateau mountain climates. The average annual temperatures range from 0 to 15 °C, with annual precipitation ranging between 36.6 and 734.9 mm, generally decreasing from southeast to northwest. Monsoonal influences lead to concentrated precipitation primarily occurring from June to August, accounting for 50–70% of the annual total. The majority of areas in Gansu are situated at altitudes between 1500 and 3000 m.
In selecting the scope of this study, a total of 14 regions, including Jiayuguan City, Jinchuan District, Honggu District, Xigu District, Anning District, Qilihe District, Chengguan District, Baiyin District, Pingchuan District, Qinzhou District, Maiji District, Gansu Zhongmushan Danmachang, Taizishan Natural Forest Reserve, and Lianhuashan Scenic Forest Reserve, were excluded from the study area. These regions exhibit a higher economic volume and economic development trend or fall within protected areas compared to the remaining counties (districts) in Gansu Province. Considering that their overall analysis reveals a leading advantage and may not accurately depict the sustainable development level and spatial distribution characteristics of the county economies in Gansu Province, they were omitted from this study. Therefore, the study focuses on the 76 counties or district-level administrative districts in Gansu Province, delineated according to the National Geographic Information Resource Directory Service System’s 1:1 million public basic geographic information data (2021) (Figure 1).

2.2. Data Sources

In the existing understanding of regional economic development, the county economy has often been relegated to a lower position of consideration, typically overshadowed by urban development. However, as the social economy progresses, the county economy’s significance has grown, serving as a vital link between rural and urban areas and injecting vitality into regional economies.
Primarily, the development of the county economy directly impacts the quality of life for local residents. As the county economy advances, employment opportunities increase, leading to higher income levels and improved social welfare. This translates to enhanced access to education, healthcare, and social security services, elevating living standards and overall happiness among residents.
Secondly, county economic development plays a crucial role in the adjustment and upgrading of local industrial structures. Economic growth fosters the expansion and diversification of enterprises and industries within the county, giving rise to new industrial formats and business models. This transformation not only breathes new life into the local economy but also generates additional employment and entrepreneurial opportunities, driving the optimization and enhancement of industrial structures.
Moreover, county economic development contributes to the improvement of infrastructure construction and public services. With economic expansion, local governments gain more financial resources to enhance transportation, energy, and water conservation infrastructure, while also elevating the quality and accessibility of public service facilities. This, in turn, fosters increased inter-regional connectivity and exchanges, enhances productivity and efficiency, and creates a conducive environment for further economic development.
In conclusion, the sustainable development of the county economy profoundly impacts residents’ quality of life, the industrial structure, and infrastructure construction. Building upon this understanding, this study selects index factors from five dimensions: the level of GDP development, level of financial development, level of fiscal development, level of industrial development, and level of social development. Specific data sources include official statistics, statistical yearbooks of cities and counties, China’s county statistical yearbooks, government statistical bulletins, and other relevant statistical data. The data cover a five-year period from 2016 to 2020. Population data for 2020 were sourced from the seventh census bulletin published by each city and state. Administrative boundaries utilized in this study were obtained from the National Geographic Information Resource Directory Service System’s 1:1 million public version of basic geographic information data (2021).

2.3. Research Method

2.3.1. Analysis of Development Imbalance

The unbalanced development of regional economies typically stems from various factors, including the natural geographical environment, social conditions, and the political environment. To assess this imbalance, this paper adopts an approach based on economic disparity. Economic disparity can be analyzed using both absolute and relative indicators. By comprehensively employing these indicators, a more comprehensive evaluation of regional economic development imbalances can be achieved.
  • Absolute Index
Absolute indicators can provide insights into the absolute differences between various regional economies. This paper aims to measure the absolute gap in the county economies of Gansu Province using the average difference (AD) and standard deviation (SD) of per capita GDP [41].
A D = j = 1 | X i j X ¯ | n
S D = j = 1 X i j X ¯ 2 n
Among them, Xij represents the per capita GDP of county j (where j = 1, 2, 3, …, 76); X ¯ denotes the average per capita GDP of all counties in Gansu Province. Higher values of AD and SD indicate a greater absolute gap in the county economy.
2.
Relative Index
The relative index can illuminate the economic disparity between different regions relative to the overall average level. This paper aims to employ the Theil index to decompose the total disparity level of the county economies in Gansu Province into inter-regional gaps and intra-regional gaps based on the three major regions: the Lanzhou economic circle, the Hexi Corridor economic belt, and the Longdongnan region. This paper utilizes the T index of the Theil index [42,43]:
T P = i j Y i j Y i log Y i j / Y P i j / P
T W R = i Y i Y j Y i j Y j log Y i j / Y j P i j / P j
T B R = i Y i Y log Y i / Y P i / P
T p = T W R + T B R
Among them, TP is the total difference index, TWR is the difference between counties in the i region, and TBR represents the difference between regions. Yij is the GDP of county j in region i, Yi is the total GDP of region i, and Y is the total GDP of the whole province. Pij is the population of county j in region i, Pi is the total population of region i, and P is the total population of the province.

2.3.2. Moran’s Index

Moran’s index was proposed by the statistician Parker Moran in 1950. It serves to measure whether the distribution of per capita GDP in the county exhibits spatial autocorrelation. It is generally categorized into the global Moran’s index and the local Moran’s index [44,45].
3.
Global Moran’s Index
The global Moran’s index characterizes the overall spatial autocorrelation of the entire study area. The calculation is illustrated in Formula (7):
I = i = 1 n i = 1 n W i j ( x i x ¯ ) ( x j x ¯ ) i = 1 n i = 1 n W i j i = 1 n ( x i x ¯ ) 2
Z I = I E ( I ) V a r ( I )
In Equation (3), I represents the value of Moran’s index; n is the spatial data; xi and xj denote the attribute values of elements i and j, respectively; Wij is the spatial weight matrix of elements i and j. The value range of Moran’s I is −1 to 1. A positive value closer to the endpoint value of ‘1’ indicates stronger correlation of aggregation. Conversely, a negative value closer to the endpoint value of ‘−1’ signifies stronger correlation of dispersion. When Moran’s I value approaches ‘0’, it indicates spatial characteristics of random distribution in space, suggesting no spatial autocorrelation between elements. The Z value’s score and p-value can evaluate the confidence of spatial autocorrelation, indicating the significance level (Table 1). The calculation formula of the Z value is illustrated in Equation (8).
4.
Local Moran’s index
The local Moran’s index is utilized to identify high, low, and abnormal values within local space.
I = ( x i x ¯ ) S 2 n j = 1 W i j ( x j x ¯ )
In Formula (5), xi represents the attribute of element i; x ¯ is the mean value of the corresponding attribute; Wij denotes the spatial weight matrix of elements i and j; S 2 is the summation of the elements in the spatial weight matrix.

2.3.3. Principal Component Analysis

Principal component analysis (PCA) can amalgamate various index data to generate a set of independent comprehensive indicators that describe the original index values through dimensionality reduction analysis. It characterizes the internal structure of multiple variables using a few principal components. Given the complexity of the selected indices in this paper’s evaluation system, and the intricate relationships between them, PCA was chosen to comprehensively describe the economic development of each county. The software used for this analysis is SPSS27, with the relevant calculation process outlined in Reference [46]. To evaluate the sustainable development potential of the county economies in Gansu Province, relevant literature [47,48,49,50,51] was integrated. Impact factors were then selected to ensure the authenticity and effectiveness of the data, based on the principles of scientific rigor and practicality.
The index system was selected based on the development of Gansu Province, with index factors chosen from five dimensions: level of GDP development, level of financial development, level of fiscal development, level of industrial development, and level of social development. The index evaluation system was constructed accordingly, as shown in Table 2.
The level of GDP development (Gross National Product) serves to characterize economic development and allows for comparisons across different regions to discern developmental differences [52]. Regarding the level of financial development, two indicators were selected: the balance of residents’ savings deposits and the balance of loans from financial institutions. These indicators contribute to the stimulation of GDP growth to a certain extent and exert a positive effect on economic development [53]. In terms of fiscal development, the selection includes general public budget revenue and expenditure as indicator factors. Fiscal revenue and expenditure play pivotal roles in economic growth [54]. Additionally, general public budget revenue and expenditure can reflect the fiscal revenue and expenditure of regional governments, thereby fostering economic development.
Additionally, for the sustainable development of the county economy, the level of industrial development holds paramount importance. For instance, the added value of the primary and secondary industries, as well as the number of industrial enterprises above a designated size, serve as significant drivers for economic development. Among these, the added value of the primary industry can reflect key supporting reference indicators for the county’s agricultural development and vitality in rural areas. Furthermore, industrial enterprises above the designated size refers to legal entities with an annual main business income exceeding CNY 20 million. This criterion was established by the State Council in 2011 and remains a crucial indicator. Thus, this paper selected the added value of the primary and secondary industries, along with the number of industrial enterprises above a designated size, to aid in describing the incremental development indicators of the county economy.
In terms of the level of social development, the resident population constitutes the primary participants in each county’s economic activities, serving as the foundation of economic vitality and an inexhaustible driving force for the sustainable development of the county’s economy. Moreover, the number of students in ordinary middle schools and primary schools can reflect the local education level. They not only participate in the county economy but also represent a major driving force for its development. Additionally, the number of beds in medical and health institutions directly reflects the level of medical security and the capacity of the medical system in each region, while also indicating the development of the county’s medical industry.
To mitigate errors stemming from the varying quantitative units and dimensional differences in data analysis, it is essential to standardize the data of each index and eliminate the influence of dimension. The Z-score data standardization processing method employed in this paper is as follows [55]:
Z = X i X S
In Equation (10), Z represents the standardized data; Xi denotes the original index value; X is the mean; and S is the standard deviation.

2.3.4. Cluster Analysis

To understand the relationships in the sustainable development of each county economy, the clustering classification method in cluster analysis was adopted. Through grouping, the counties in Gansu Province could be better organized, grouped, distinguished, and divided. This method determines the natural grouping of a set of data through unsupervised machine learning. Traditional systematic clustering cannot effectively reflect the spatial clustering pattern. However, the clustering classification method can achieve maximum similarity within the same group and maximum differences between different groups through comprehensive clustering of various characteristics of the research object [56,57]. Usually, the pseudo-statistic F is used to determine whether the optimal number of groups is reached. The formula is
F = R 2 n c 1 ÷ 1 R 2 n n c
R 2 = S S T S S E S S T
S S T = n c i = 1 n i j = 1 n v k = 1 V i j k V k ¯ 2
S S E = n c i = 1 n i j = 1 n v k = 1 V i j k V i k ¯ 2
In the above formula, F represents the pseudo-F statistic; R2 reflects the degree of retention of the original data changes after the grouping process. The larger the R2, the better the groups can be distinguished. n is the number of elements, ni is the number of elements in group i, nc is the number of groups, and nv is the number of elements for grouping; V i j k is the k variable value of the j element in the i group, V k ¯ is the average value of the overall k variable, and V i k ¯ is the average value of the k variable in the i group.

3. Results and Discussion

3.1. Analysis of the Characteristics of County Economic Development

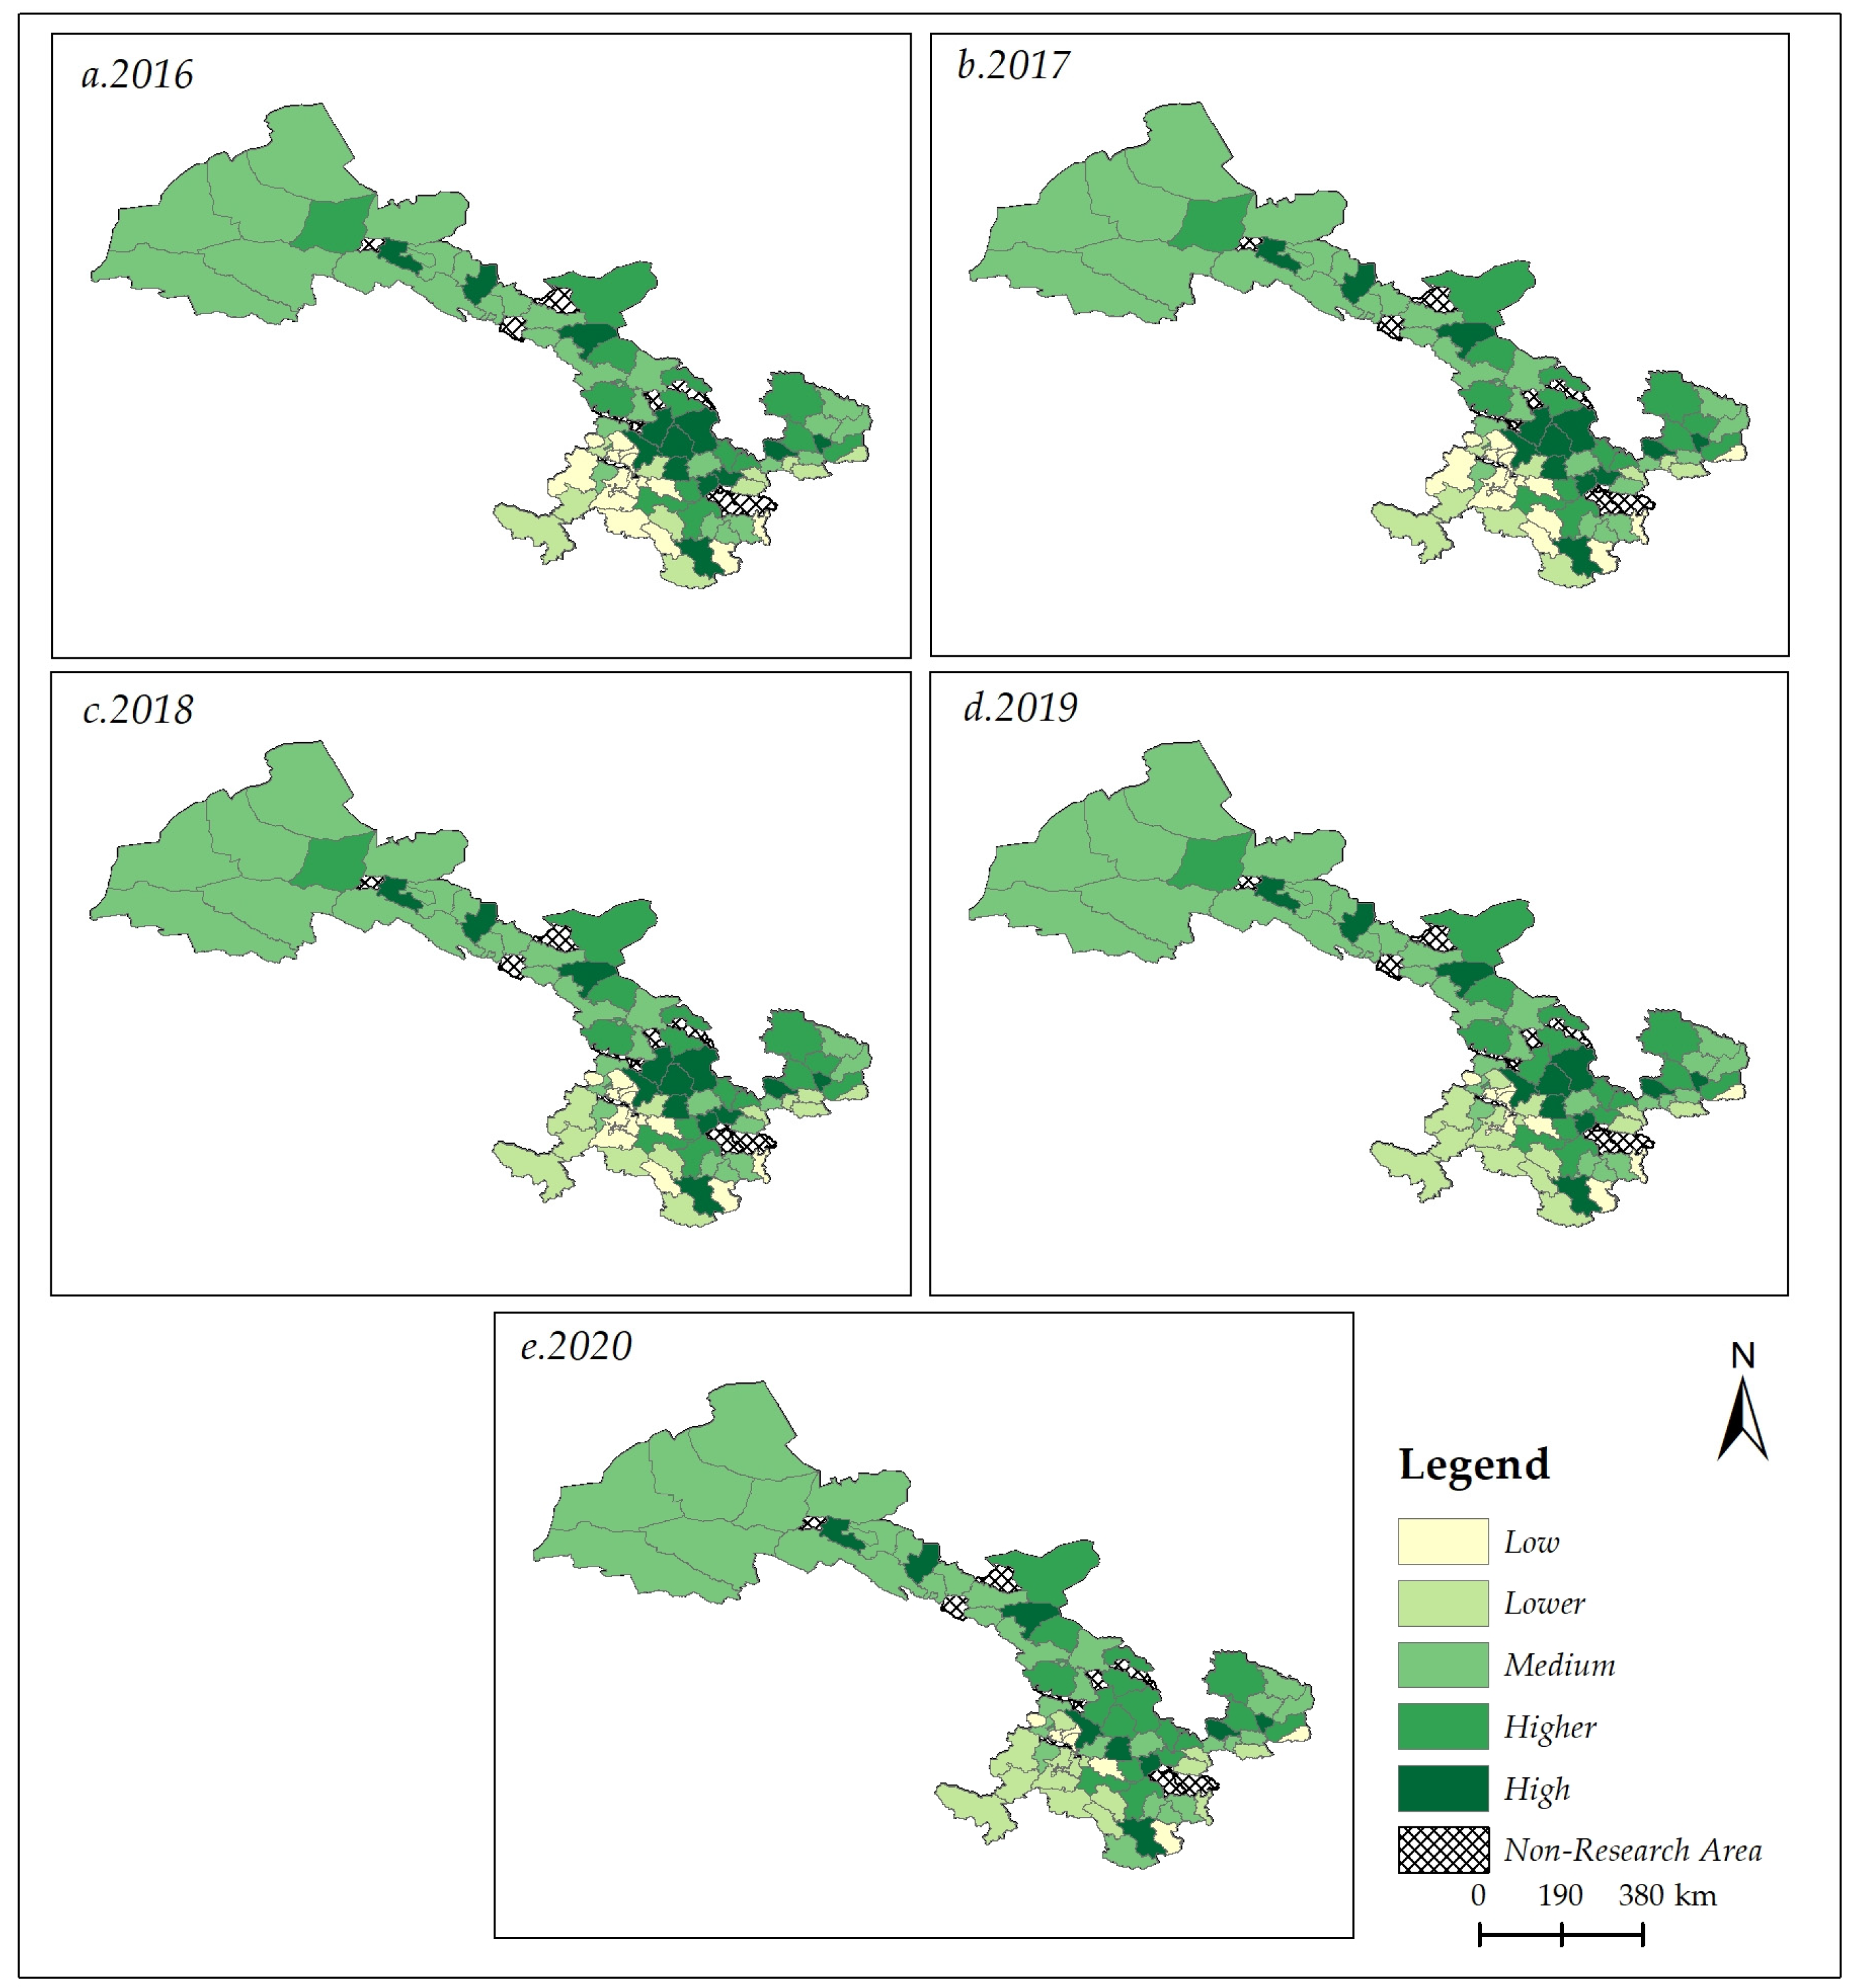
3.1.1. Spatial Distribution Characteristics

In analyzing the spatial distribution characteristics of county economic development, it is crucial to explore the differences and spatial differentiation characteristics of the sustainable development level of the county economy. This paper selected per capita GDP as an index to analyze the spatial distribution characteristics of county economic development. Compared to overall GDP, per capita GDP can better reflect the economic level and quality of life of residents in the county. The choice of per capita GDP aims to further investigate the income distribution of residents in different counties, the balance of economic development, and the regional economic gap. Through the analysis of per capita GDP, we can unveil the spatial differences and agglomeration trends of county economic development. Counties with high per capita GDP often possess a more developed economic base and industrial structure, with relatively high levels of resident income, as well as well-developed social services and infrastructure. Conversely, counties with low per capita GDP may face challenges such as a relatively lagging economy, a single industrial structure, and insufficient infrastructure.
According to the spatial distribution map of the per capita GDP of the county economies in Gansu Province from 2016 to 2020 shown in Figure 2, the 76 counties are divided into five levels using the natural discontinuity point classification method. Combined with the distribution of per capita GDP over five years, several trends of time evolution can be observed.
Firstly, from 2016 to 2020, the number of counties with a low per capita GDP decreased from 13 to 7, indicating that some counties with relatively lagging economies have made progress during this period. The number of counties with lower per capita GDP increased from 11 to 13, and the number of counties with medium GDP per capita increased from 25 to 30, indicating that relatively medium-level counties achieved economic growth and development during this period. Similarly, the number of counties with higher per capita GDP also increased from 14 to 17, while the number of counties with high per capita GDP decreased from 13 to 9, suggesting that some economically developed counties may have faced challenges and adjustments during this period.
Overall, counties at all levels of per capita GDP show a trend of continuous upward development. However, the difficulty of transitioning between different levels is gradually increasing, indicating that the gap in county economic development is widening. This underscores the need for more targeted policies and measures to promote the balanced development of the county economy.
From a spatial distribution perspective, the development of per capita GDP in the counties of Gansu Province exhibits characteristics of small-scale agglomeration. Counties with low per capita GDP development are primarily concentrated in Linxia, Gannan, and Longnan counties in the south of Gansu Province. Additionally, since 2016, counties with low per capita GDP have gradually transitioned to a lower level of per capita GDP, with particularly significant changes observed in Gannan Prefecture.
Counties with medium per capita GDP are mainly distributed in the Hexi Corridor region in the west of Gansu Province, with other regions characterized by point distribution. Meanwhile, counties with higher per capita GDP are mainly concentrated in the Lanzhou economic circle and the north of the Longdongnan region, maintaining a relatively stable development trend over a prolonged period.
Counties with high per capita GDP have shifted from a relatively agglomerated distribution to a more scattered distribution in the province since 2016, with some counties downgrading to the next level. Among the counties covered by the Lanzhou economic circle, more counties have degraded to the next level, while counties with high per capita GDP in the Hexi Corridor and southeastern Gansu have maintained a relatively stable development trend.

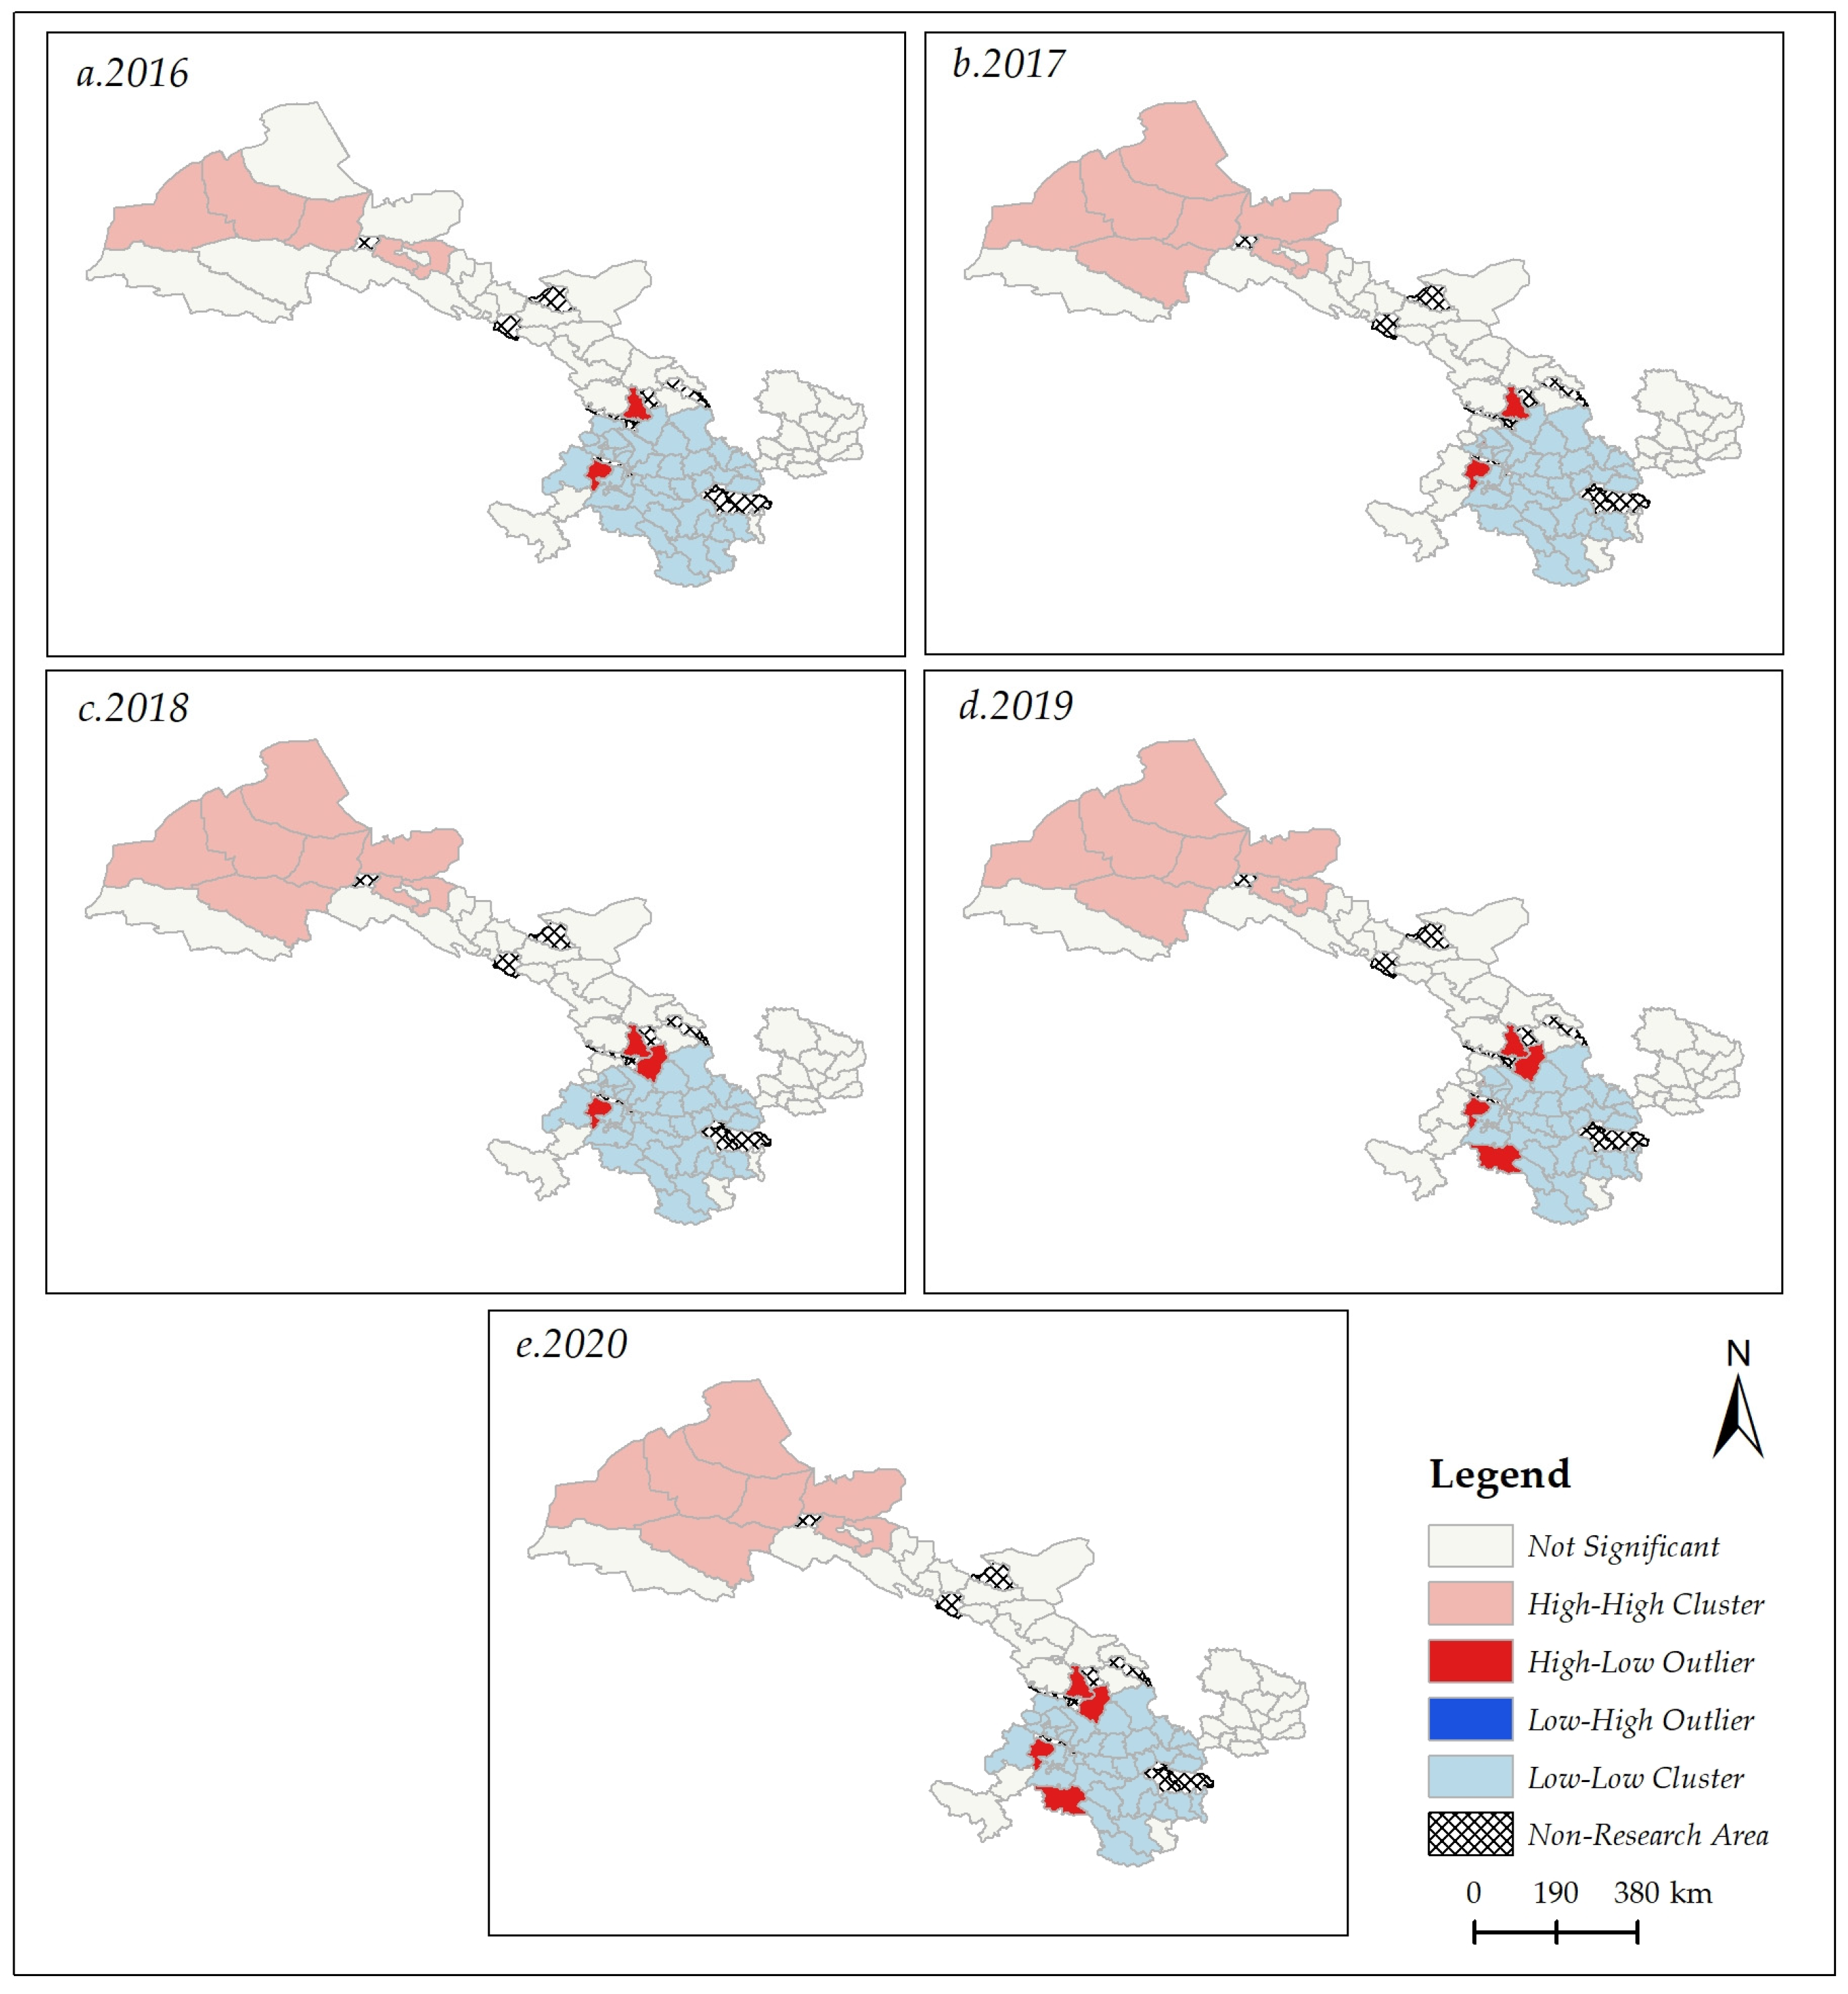
3.1.2. Analysis of Spatial Correlation Characteristics

5.
Global Moran’s Index
To characterize the spatial correlation characteristics of the counties’ per capita GDP in Gansu Province, this study utilized ArcGIS software to analyze the exploratory data of the counties’ per capita GDP from 2016 to 2020, resulting in the Moran’s index table of counties’ per capita GDP in Gansu Province (Table 3).
From the data results of Table 3, it is evident that the per capita GDPs of counties in Gansu Province exhibit significant positive spatial autocorrelation characteristics. Counties with high (low) per capita GDP levels are clustered in space rather than randomly distributed, thus rejecting the null hypothesis (i.e., the agglomeration of per capita GDP is not randomly distributed).
In terms of Moran’s I value, the 2016–2020 index demonstrates a trend of initially rising, then falling, and finally rising again. The Moran’s index value in 2020 is 1.20 times higher than that in 2016, indicating that this spatial agglomeration situation changed over time and gradually increased, reflecting dynamic changes.
6.
Local Moran’s Index
To further investigate the agglomeration distribution characteristics of per capita GDP in the counties of Gansu Province, the agglomeration types of per capita GDP in different counties were classified into five categories: high–high, high–low, low–high, low–low, and insignificant, and the results from 2016 to 2020 are visualized (Figure 3).
From the map, it is apparent that there is a high–high aggregation of per capita GDP in the western part of Gansu Province (Hexi Corridor region), while there is a low–low aggregation in the southern part of Gansu Province (Lanzhou economic circle, Longdongnan region). These spatial distribution characteristics are closely related to the mountainous areas in the southern part of Gansu Province.
Furthermore, around the low–low aggregation counties, there are high–low aggregation counties, namely Gaolan County, Yuzhong County, Hezuo City, and Diebu County. These counties exhibit a high per capita GDP level, indicating a substantial level difference compared to other, surrounding counties.

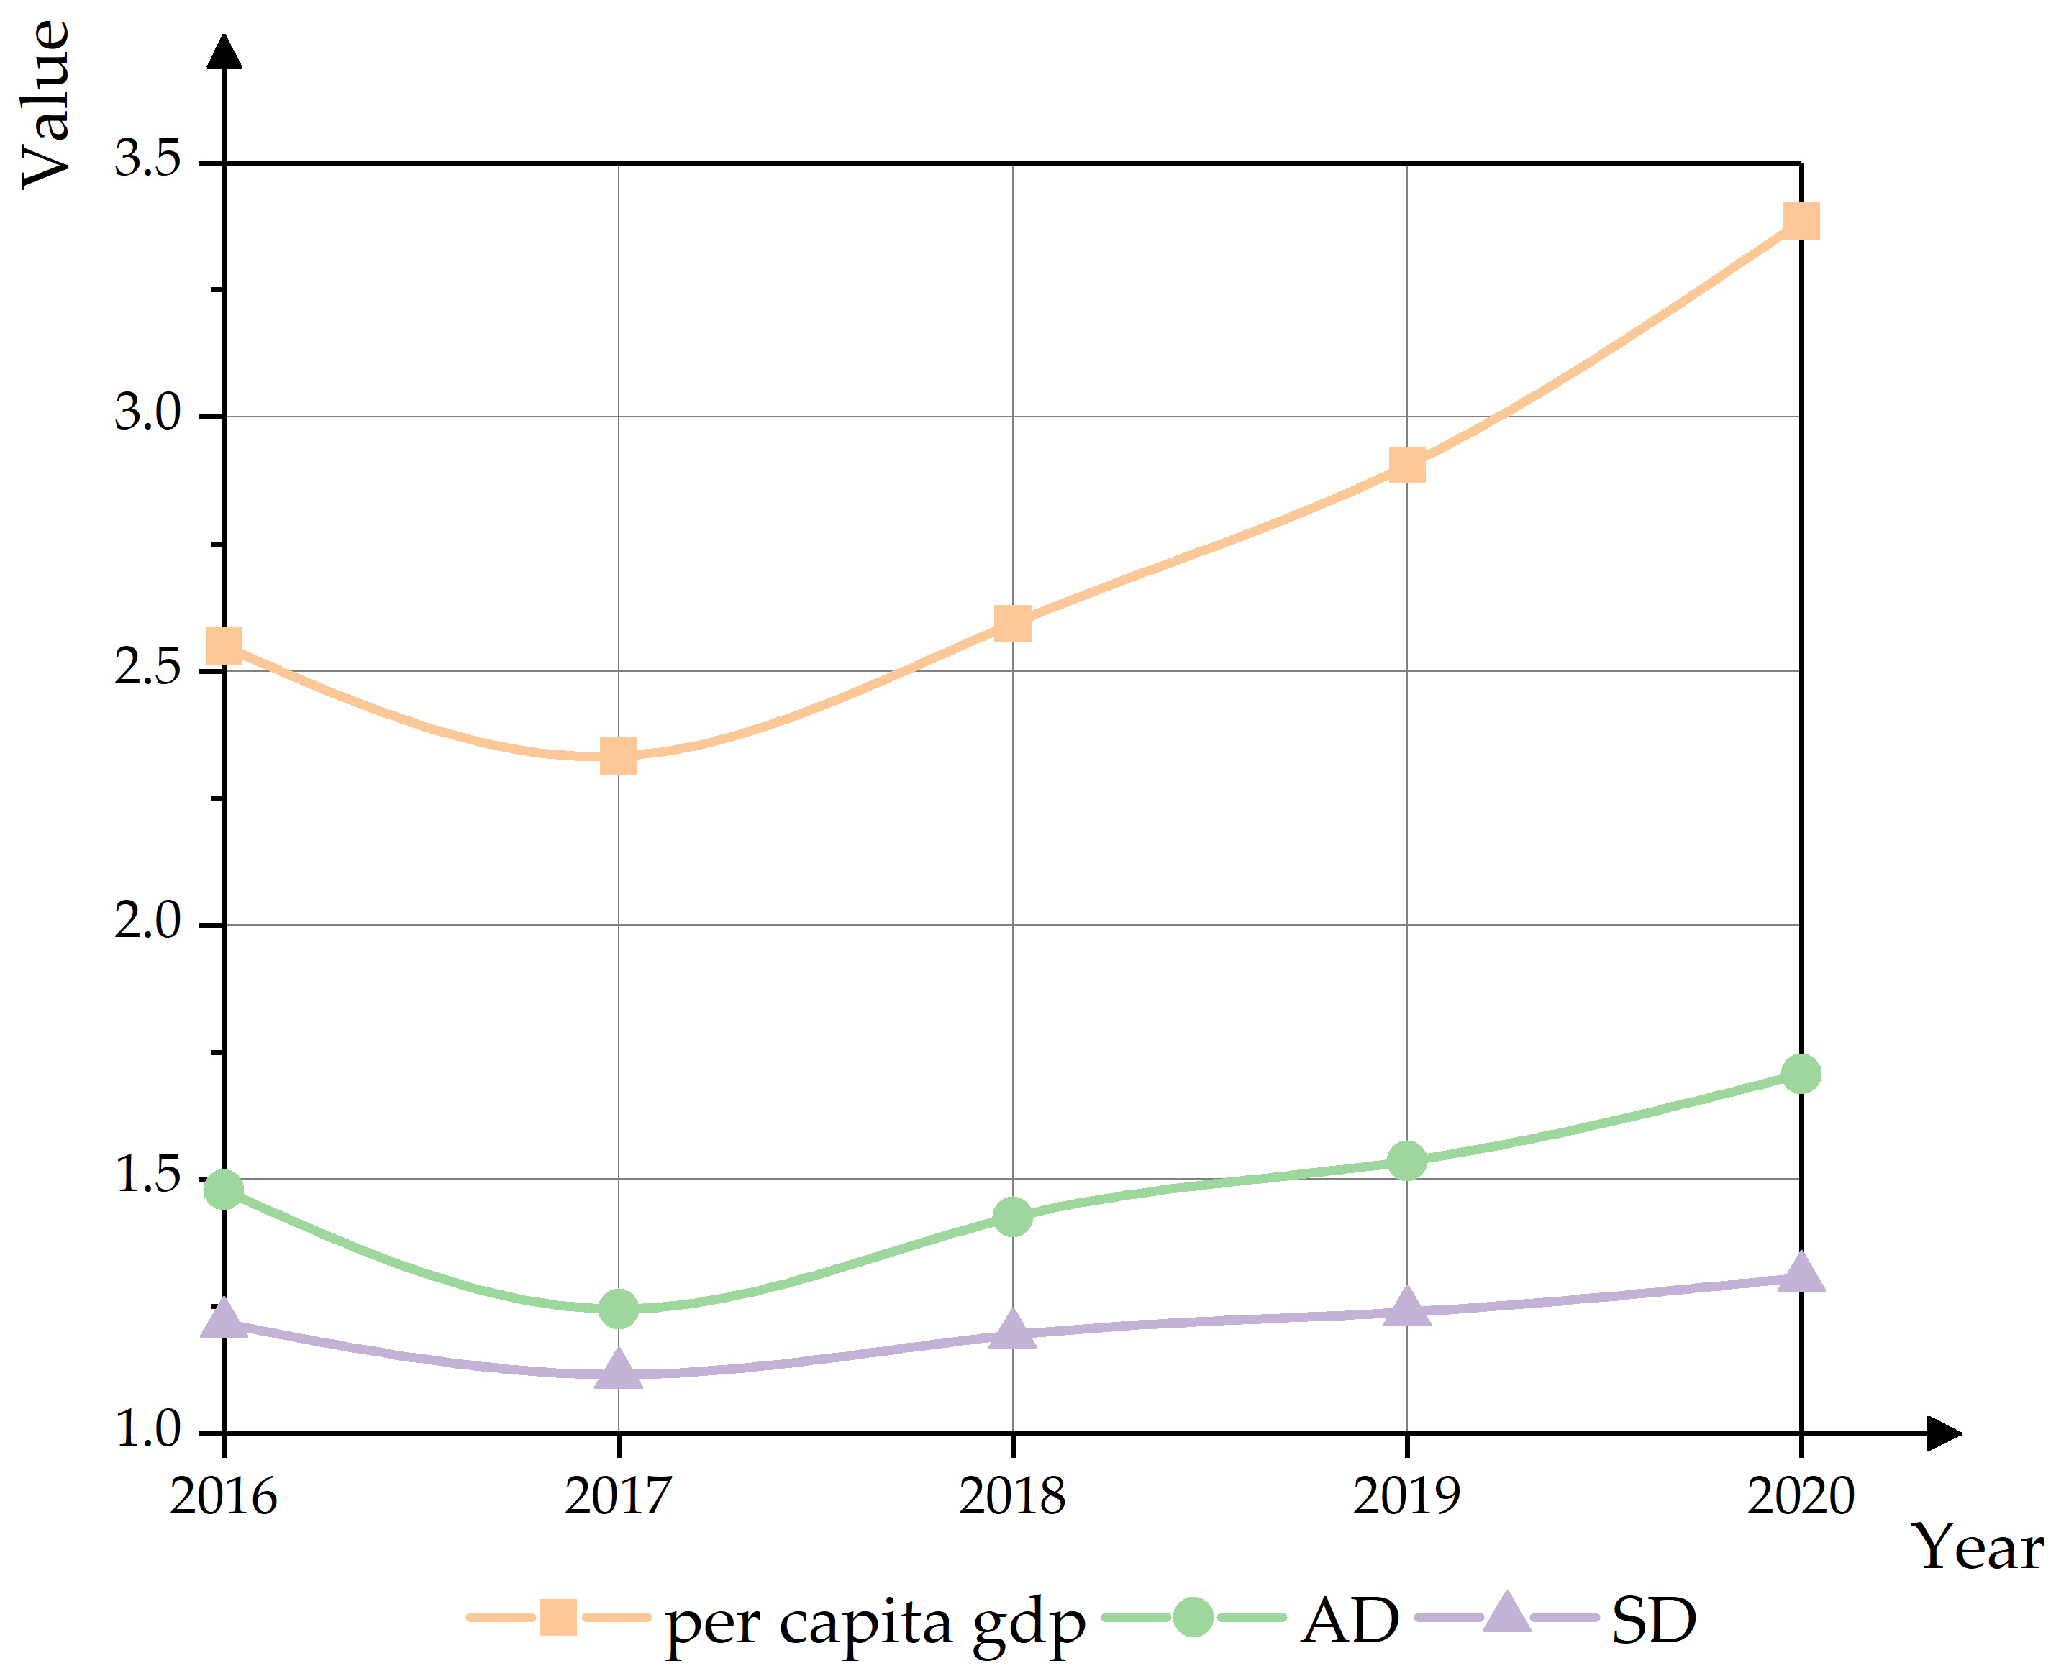
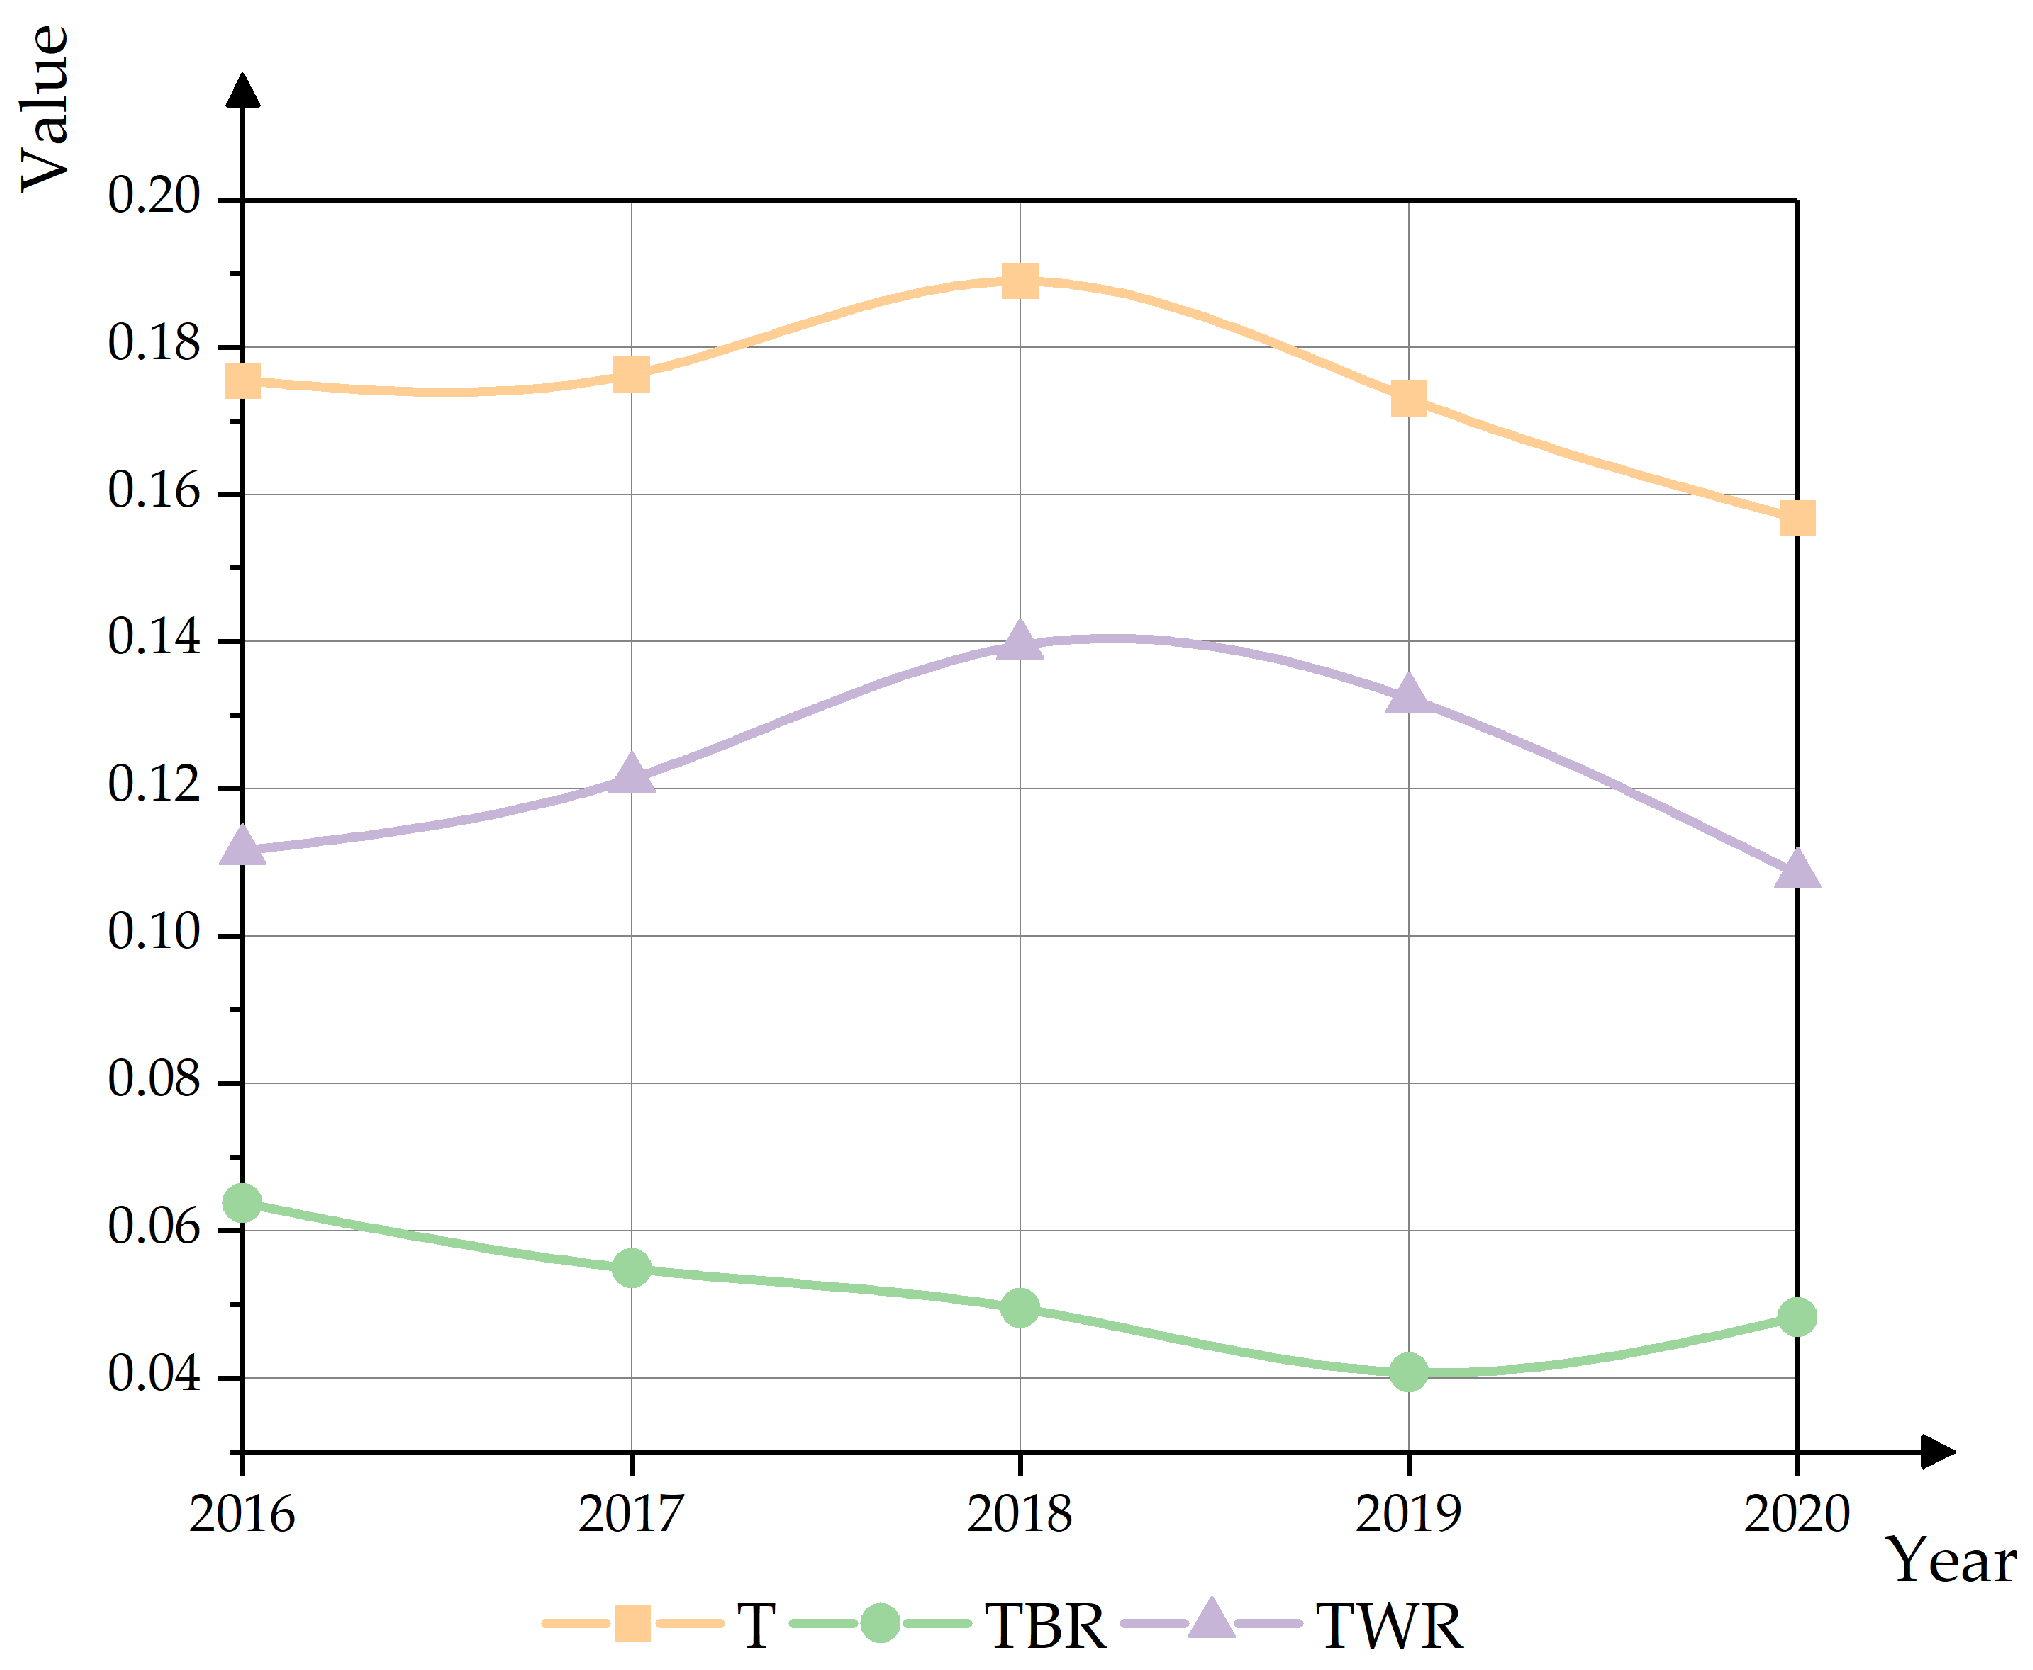
3.1.3. Analysis of Development Imbalance

7.
Absolute Index
As depicted in Figure 4, in 2017, the increase in the resident population outpaced the increase in GDP, leading to a slight decline in per capita GDP compared to 2016. Subsequently, after 2017, the per capita GDP of counties in Gansu Province experienced rapid growth, reaching approximately 1.45 times its value by 2020.
Furthermore, from 2016 to 2020, the average difference (AD) of county per capita GDPs in Gansu Province changed from 1.48 to 1.71, while the standard deviation (SD) changed from 1.22 to 1.31. These findings indicate a gradual improvement in the development level of the county economies in Gansu Province, accompanied by an increase in overall competitiveness.
However, it is worth noting that the absolute gap in county economic development has exhibited an upward trend. As of 2020, the county development gap in Gansu Province is slowly widening.
8.
Relative Index
Figure 5 illustrates that both the total Theil index and the regional Theil index of county GDP in Gansu Province exhibited a trend of initially increasing and then decreasing. Moreover, the total Theil index decreased annually from 2018 onwards, suggesting that the relative gap in the county economies of Gansu Province was gradually narrowing.
To further measure the county economic development gap in Gansu Province, this paper decomposes the total Theil index into intra-regional and inter-regional Theil indices based on the three major regions: the Lanzhou economic circle, the Hexi Corridor economic belt, and southeast Gansu. The results indicate that the intra-regional Theil index follows a similar trend to the total Theil index. Moreover, during the sample data period, the intra-regional gap’s contribution to the total Theil index exceeded 63%, surpassing the contribution rate of the inter-regional gap (Table 4). This underscores that differences in county economic development within the region are the primary drivers of the overall county economies’ gap in Gansu Province.
Additionally, analyzing the Theil index of the three regions reveals that the county economic development gap between the Lanzhou economic circle and the Longdongnan region is more significant compared to that of the Hexi Corridor economic belt. Concerning the inter-regional gap, it is evident that from 2016 to 2019, this gap was narrowing, but from 2019 to 2020, it began to show an upward trend.

3.2. Evaluation of Sustainable Development Potential

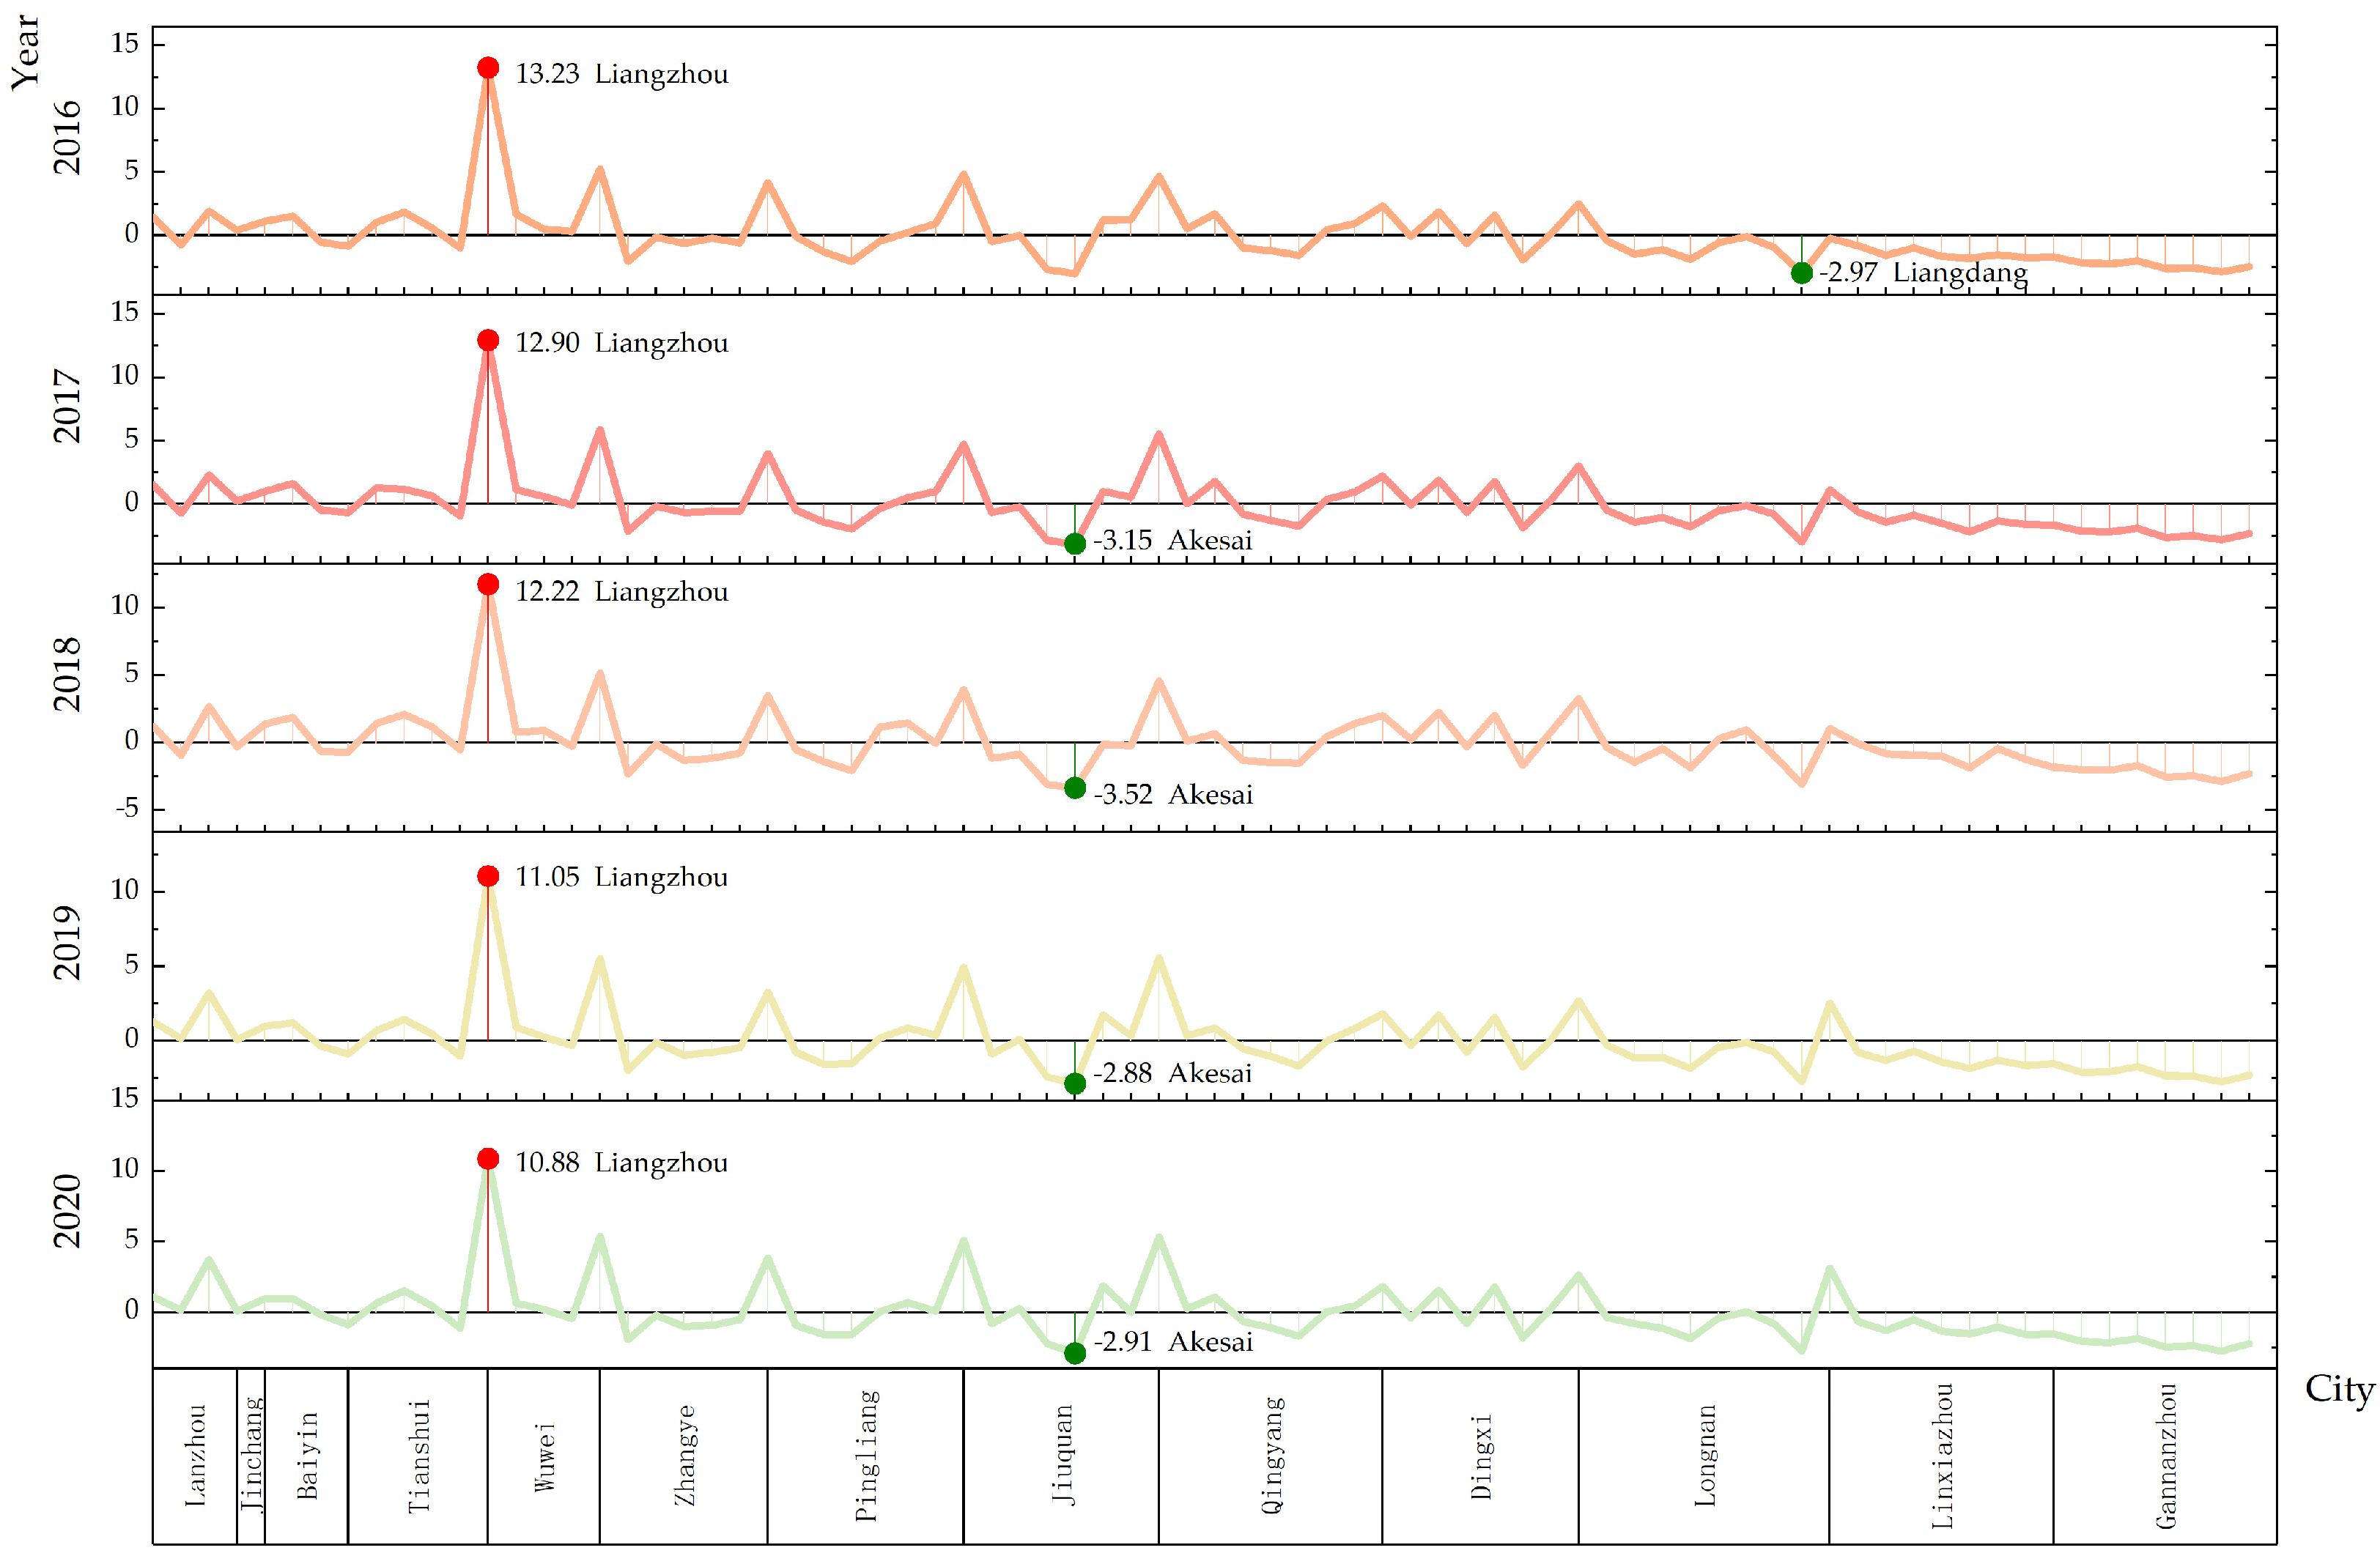
3.2.1. The Score Analysis of the Sustainable Development of the County Economies

When conducting principal component analysis using SPSS, it is necessary to perform the Kaiser–Meyer–Olkin (KMO) test and Bartlett’s sphericity test. A KMO value greater than 0.8 and a p-value less than 0.05 indicate that the data are highly suitable for principal component analysis. If the KMO value falls between 0.7 and 0.8, it is still suitable for principal component analysis. In this paper, the KMO test yielded values of 0.890 (2016), 0.876 (2017), 0.867 (2018), 0.832 (2019), and 0.835 (2020) for the data used in principal component analysis. All p-values were less than 0.05, and all KMO values exceeded 0.8, meeting the criteria for principal component analysis.
Two principal components were extracted based on characteristic roots greater than 1 for each year, with cumulative contribution rates of 81.697% (2016), 80.726% (2017), 83.547% (2018), 80.578% (2019), and 80.645% (2020), respectively. Component weights were calculated from the component matrix, and the principal component score for each county was derived by combining the original index data (see Table 5). Positive values indicate good economic sustainable development potential, while negative values suggest the opposite.
Table 5 reveals the intricate shifts in economic growth among Gansu’s counties from 2016 to 2020. Upon statistical scoring, it can be noted that in 2016, 14 counties boasted the highest score for sustainable county economic development, followed by 6 counties in 2017, 26 counties in 2018, 15 counties in 2019, and another 15 counties in 2020. Examining the peak values, the year 2018 witnessed a commendable state of sustainable county economic development in Gansu Province, primarily concentrated in Baiyin City (two counties), Tianshui City (four counties), Pingliang City (two counties), Qingyang City (two counties), Dingxi City (six counties), Longnan City (two counties), and Linxia Prefecture (five counties). Furthermore, the numbers of counties with the lowest economic sustainable development scores were 17 in 2016, 7 in 2017, 28 in 2018, 5 in 2019, and 19 in 2020. Specifically, in 2018, the lowest sustainable development scores were primarily observed in Lanzhou City (one county), Jinchang City (one county), Baiyin City (one county), Zhangye City (four counties), Pingliang City (two counties), Jiuquan City (seven counties), Qingyang City (three counties), Longnan City (four counties), Linxia Prefecture (one county), and Gannan Prefecture (four counties).
In 2020, the onslaught of the new coronavirus epidemic brought the nation to a standstill, halting social and economic development as if the pause button had been hit (Figure 6). However, since the second quarter of 2020, regions across the country have gradually resumed work and production, leading to a rebound in economic development across all counties and districts in Gansu. Notably, in 2020, 15 counties in Gansu achieved a new high in sustainable economic development over the five-year period (2016–2020), primarily concentrated in Lanzhou City (two counties), Baiyin City (one county), Zhangye City (one county), Jiuquan City (four counties), Longnan City (two counties), Linxia Prefecture (three counties), and Gannan Prefecture (two counties). Conversely, there were 19 counties that hit a new low score in sustainable economic development over the same period, mainly spread across Lanzhou City (one county), Baiyin City (two counties), Tianshui City (four counties), Wuwei City (four counties), Zhangye City (one county), Pingliang City (two counties), Qingyang City (one county), Dingxi City (three counties), Longnan City (one county), while the remaining counties experienced varying degrees of fluctuation.
In order to comprehend the fluctuations in county scores, 2018 is deemed pivotal, considering that the scores for sustainable economic development in counties generally peaked or plummeted during that year. Consequently, 2018 serves as the midpoint, dividing the analysis into two time frames: 2016–2018 and 2018–2020, to depict the ascension and descent of the counties’ economic sustainability. Upon computation, it is observed that seven counties witnessed a consistent rise in their economic sustainability scores, while eight counties experienced a consistent decline. Additionally, 30 counties initially saw a rise followed by a decline in their economic sustainability scores, whereas 31 counties witnessed an initial decline followed by a subsequent rise.
In summary, during the study period (2016–2020), there was a significant disparity in the sustainable development of the counties’ economies in Gansu Province in 2018. The counties with the highest and lowest scores accounted for 26 (34.21%) and 28 (36.84%), respectively. Furthermore, based on the annual scores of sustainable county economic development, the scores in Zhangye City, Jiuquan City, Dingxi City, Longnan City, Linxia Prefecture, and Gannan Prefecture are predominantly close to or below ‘0’, indicating poor sustainable development potential in these areas, except for the county where the municipal government is situated. Conversely, Lanzhou City, Jinchang City, Baiyin City, Tianshui City, Wuwei City, Pingliang City, and Qingyang City exhibit comparatively better economic sustainable development potential.

3.2.2. Comprehensive Score Ranking Analysis of Sustainable Development Potential of County Economies

From Table 6, it is difficult to clearly identify the sustainable development potential of the county economies in Gansu Province. Therefore, by calculating the arithmetic mean of the sustainable development score of each county’s economy over 5 years, the comprehensive score of sustainable development potential was derived and ranked accordingly (see Table 6). It is evident from Table 3 that there are 31 counties with positive comprehensive scores and 45 counties with negative comprehensive scores. Notably, Liangzhou District holds the top position in county economic development with a comprehensive score of 12.054, indicating a robust potential for sustainable development in that county’s economy.
To understand the spatial distribution characteristics of the sustainable development potential of the county economies, the natural break point method was employed for clustering, with the ‘0’ value serving as the boundary. Subsequently, the comprehensive scores of sustainable development for each county were spatially mapped (refer to Figure 7). The visualization in Figure 7 reveals that counties with positive values above ‘0’ are predominantly concentrated in the ‘Lanzhou-Baiyin metropolitan area’, ‘Tianshui metropolitan area’, the western entrance of the ‘Hexi Corridor economic belt’, and the Qingyang–Pingliang cluster. This spatial pattern demonstrates an agglomeration trend towards the middle and east.

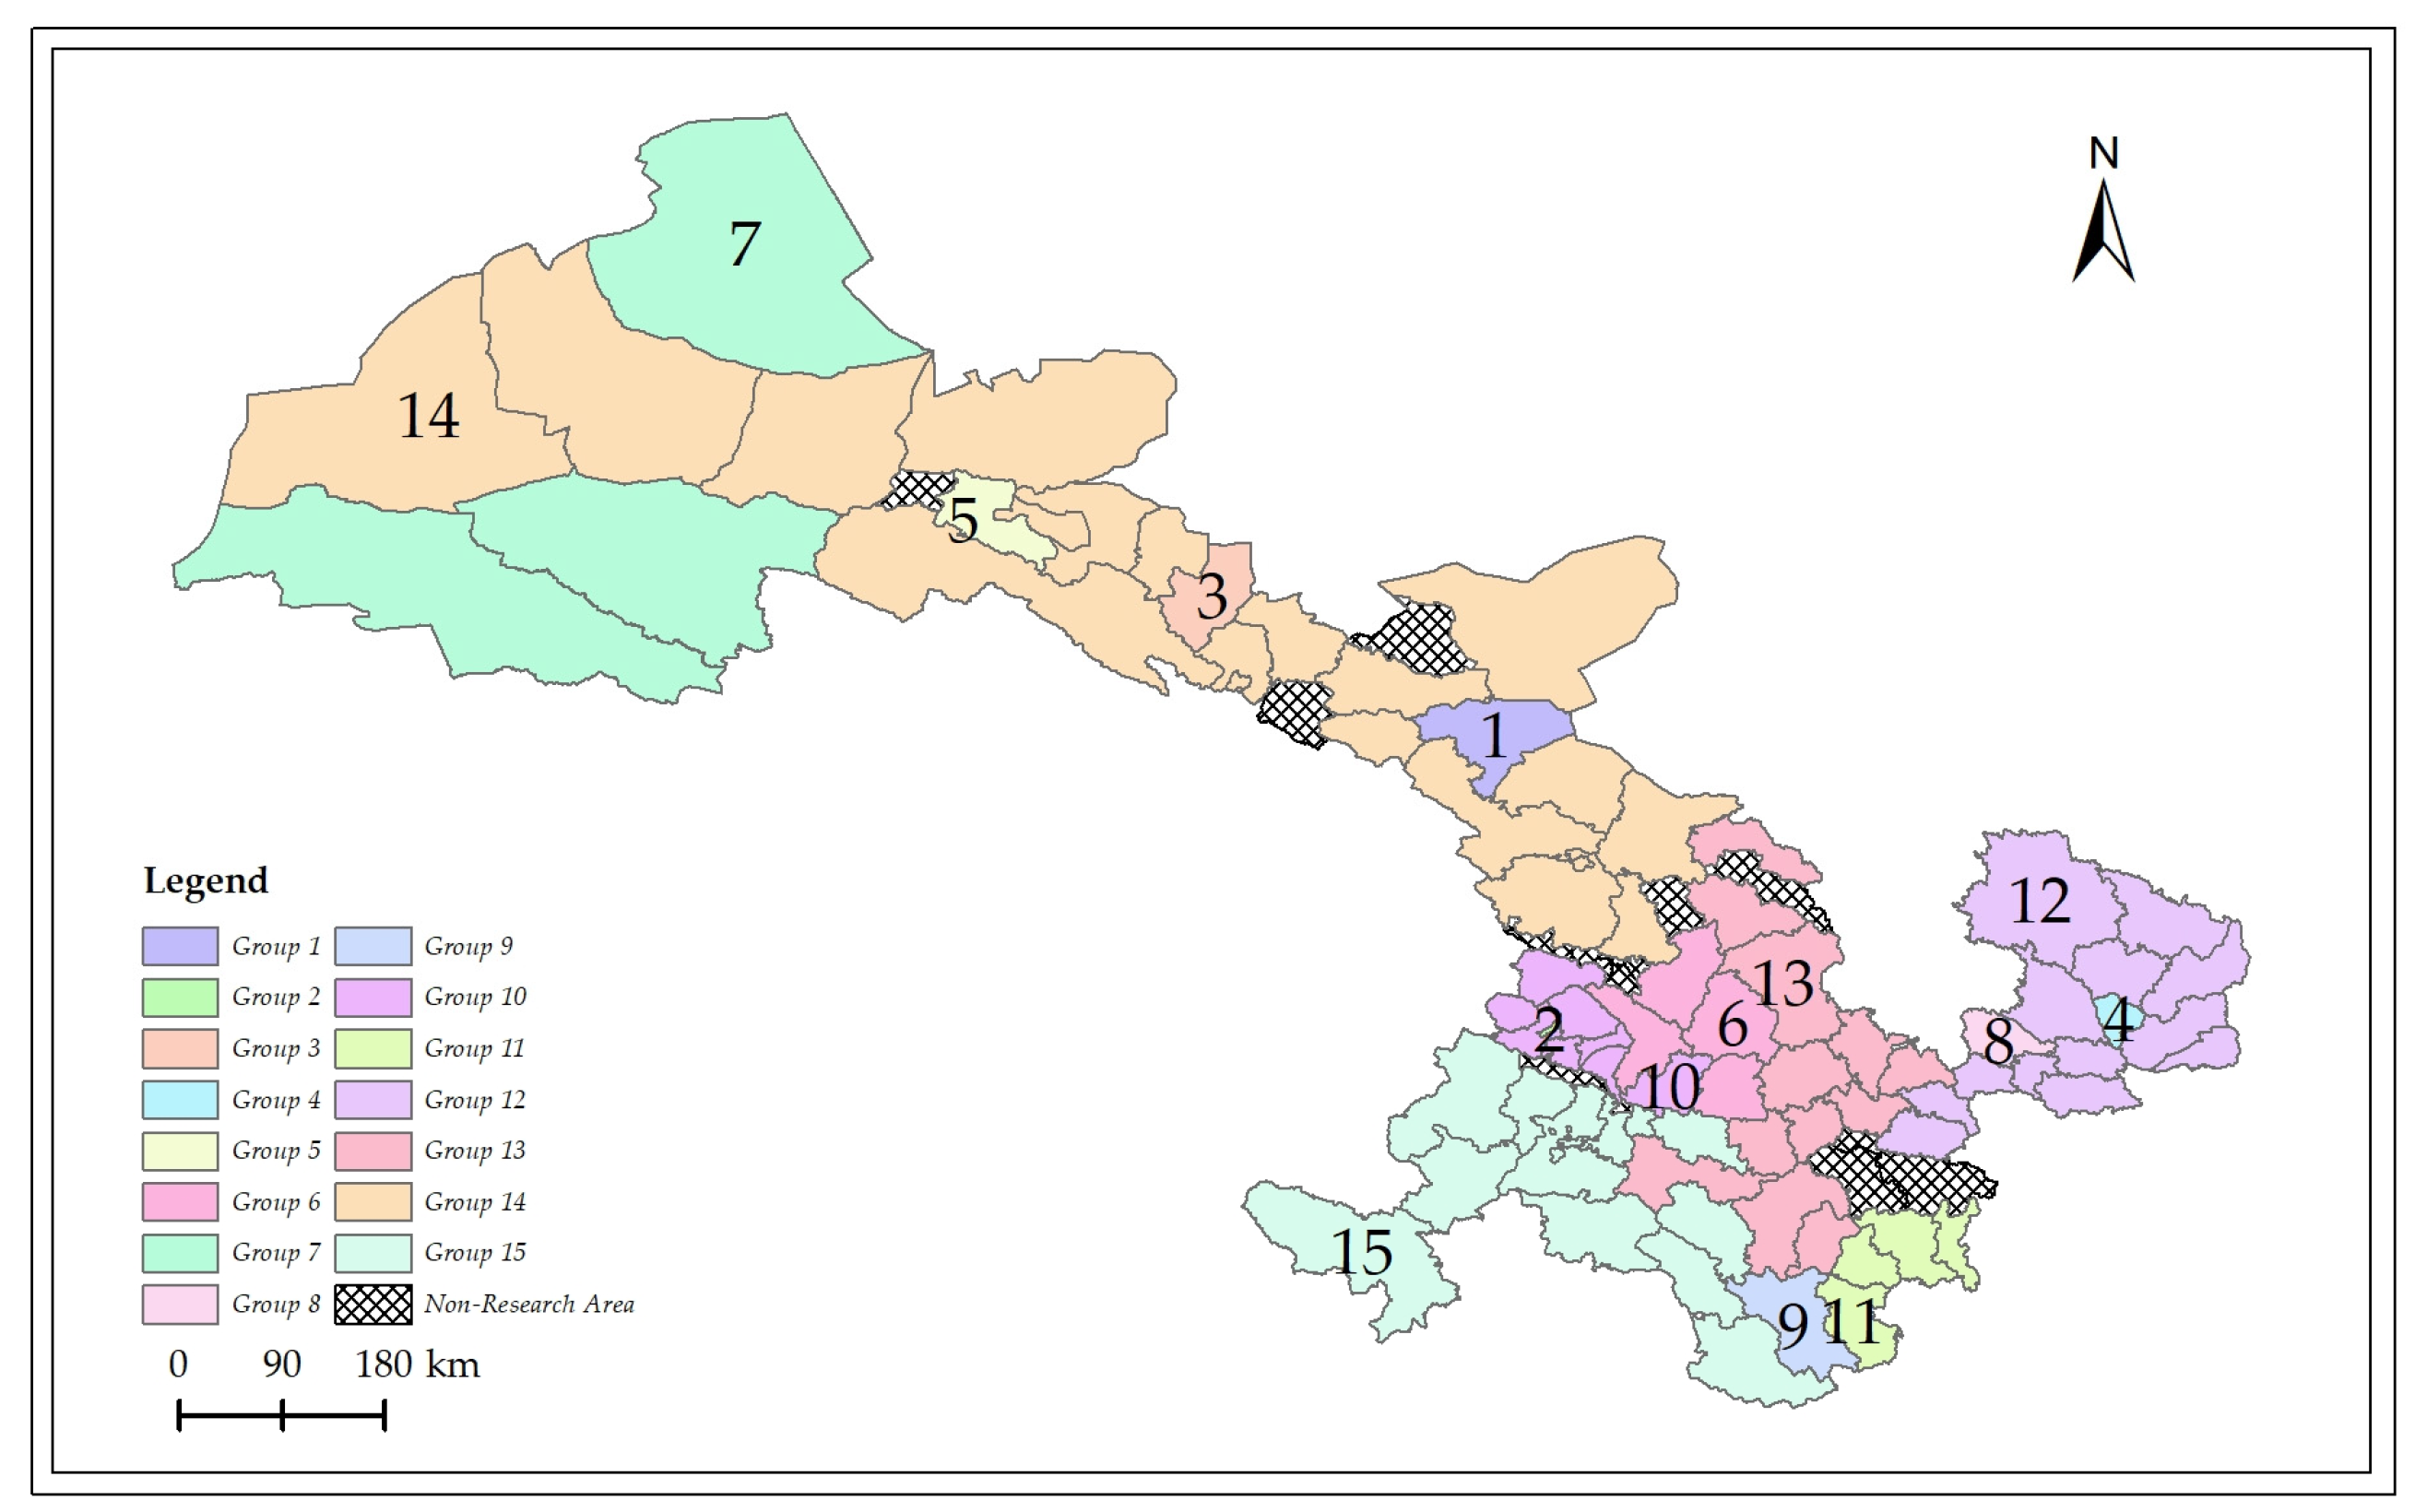
3.2.3. Cluster Analysis of Sustainable Development Potential of County Economies in Gansu Province

The classification and aggregation of counties enable the analysis of the sustainable development potential of each county in terms of spatial distribution. This paper utilizes the comprehensive score value of the sustainable development potential of the county economies and derives a total of 15 categories through calculation and classification (Figure 8). Employing unsupervised classification, counties with an average comprehensive score of the sustainable development potential of the county economy greater than or equal to 1.54 were delineated as a single group. Although the average value of the sixth group surpassed 1.54, it encompassed four counties, namely Yuzhong County, Anding County, Longxi County, and Lintao County. There are six groups where the average value of the comprehensive score of the sustainable development of the county economies was less than ‘0’. Specifically, the average comprehensive score of the sustainable development of the county economies in the 13th group was 0.65, encompassing a total of 11 counties, including Baiyin City, Dingxi City, Tianshui City, and Longnan City.

3.3. Discussion

3.3.1. Discussion on County Development in Different Dimensions

The level of GDP development is the endogenous driving force for the sustainable development of county economies. County governments can improve the quality and efficiency of GDP by promoting industrial upgrading, investing in science and technology innovation, and cultivating new industries. In addition, it is necessary to strengthen infrastructure construction, improve urban supporting services, and promote consumption upgrading within the counties to boost domestic demand and GDP growth. The government can also rely on the construction of China’s unified big market through foreign trade exchanges to promote the linked development of regionalization in counties and enhance cooperation and exchanges between counties.
The level of financial development is the support and guarantee for the sustainable development of county economies. The government should encourage the diversified development of financial institutions, increase the supply of services from financial institutions, promote new types of financial services such as green finance, Internet finance, and inclusive finance, and increase the penetration rate of financial services. At the same time, the government should promote sound growth in the asset size of financial institutions by optimizing the structure of the financial system and strengthening supervision and risk prevention. In addition, the government can support financial institutions to increase their support for the real economy, promote steady growth in loan balances, and improve the efficiency of financial resource allocation.
The level of fiscal development is a stable cornerstone of sustainable economic development in the county. The government should increase fiscal revenue by diversifying sources of fiscal revenue, improving the efficiency of tax collection and management, employing strict tax collection and management, and cracking down on tax violations. At the same time, it should encourage the development of new economic forms, expand fiscal revenue channels, and promote the transformation of economic structures. In addition, the government should rationally plan fiscal expenditures, optimize the expenditure structure, increase expenditures on education, medical care, social security, and other areas of people’s livelihood, and improve the level of public services. At the same time, fiscal supervision should be strengthened to prevent waste and the abuse of fiscal expenditures.
The level of industrial development is an inexhaustible driving force for the sustainable development of county economies. First, the government can increase the added value of the primary industry by promoting agricultural modernization, strengthening agricultural science and technology innovation, and improving agricultural production efficiency. It can support the industrialization of agriculture, develop green agriculture, increase the added value of agricultural products, and promote farmers’ income. Second, the government can support industrial enterprises in technological innovation, improve industrial added value, promote the transformation and upgrading of traditional industries, cultivate new industries, strengthen industrial agglomeration development, and increase the added value of the secondary industry. Third, the government can encourage enterprises to expand their scale, improve productivity, attract foreign investment to introduce advanced technology and management experience, and promote large-scale business operations. At the same time, it should support the development of small, medium-sized, and micro-enterprises, cultivate new types of industrial clusters, and increase the number of industrial enterprise units above the designated size.
The level of social development is the basis for the sustainable development of county economies. First, the government can promote reasonable population growth and structural optimization through measures such as controlling population size, guiding population movement, and optimizing population structure. At the same time, population censuses and statistics should be strengthened to provide a scientific basis for governmental decision-making. Secondly, the government should increase its investment in education, improve the efficiency of the allocation of educational resources, and ensure that students receive good educational resources. Schools are encouraged to carry out diversified educational and teaching activities to promote the all-around development of students. Thirdly, the government can increase its investment in healthcare, expand the scale of healthcare institutions, raise the level of medical services, increase the number of beds, and improve the supply of medical resources. At the same time, it should promote the standardization of medical and healthcare institutions and improve the quality and efficiency of their services.

3.3.2. Overall Development Discussion

The development of the county social economies holds significant implications for realizing rural revitalization. Alongside fostering county economies, it can expedite the new urbanization process, enhance the optimization and upgrading of county industries, facilitate the integration of urban and rural development, and gradually mitigate the disparity between urban and rural economic development [58,59]. In the forthcoming years, county development will inevitably transition towards a paradigm of county competition and cooperation, achieving a symbiotic relationship between county competition and cooperation [60]. However, owing to the intricate and dynamic geographical landscape with numerous mountains in Gansu Province, it is evident from the analysis that counties with negative scores for the sustainable development of their county’s economy are predominantly situated in regions with higher altitudes and latitudes. Concurrently, these areas exhibit a low–low agglomeration trend. Influenced by topography and climate, these regions harbor a lesser resident population and diminished county economic vitality.
Furthermore, the analysis of development reveals that the comprehensive score of sustainable economic development in the counties is positive, predominantly concentrated in the central and eastern regions of Gansu. In the Hexi area, only Wuwei City and Jinchang City exhibit concentrations, while the remaining parts of the region consist of only a few scattered counties. Through the elucidation of the Theil index and grouping classification outcomes, it can be observed that the sustainable development of the county economies in Gansu Province follows a pattern of multi-point flowering, albeit with weak communication and development with surrounding counties.
In the grouping classification, the counties were divided into 15 groups, with the distribution closely resembling the pattern of sustainable economic development in Gansu Province. Among these, groups 1, 3, 5, 7, and 14 are situated in the Hexi Corridor economic belt area, groups 2, 6, 10, and 13 are located in the Lanzhou economic circle area, and groups 4, 8, 9, 11, 12, and 15 are positioned in the southeastern Gansu development area. Considering the overall trajectory of future economic development in Gansu Province, initiatives should prioritize the sustainable development of the county economies. This can be achieved by leveraging the ‘acupuncture method’ to stimulate the county economies with promising development potential, thereby shaping an economic structure characterized by ‘point-to-axis, axis-to-plane’ dynamics. Furthermore, it is crucial to firmly grasp the open pattern of ‘land and sea linkage at home and abroad, with mutual assistance flowing in both east-west directions’.
In general, Gansu Province exhibits diverse models of county economic development, with significant regional disparities. The wide development gap between counties poses challenges to implementing a uniform development model. Therefore, achieving sustainable development in the county economies of Gansu Province necessitates a strategy grounded in local characteristics while also emphasizing overall coordination.
By considering each county as an economic development unit, efforts should focus on optimizing the industrial structure and refining the development model. Counties with substantial potential for sustainable economic development should serve as the focal point, while the development of neighboring counties with lesser potential should concurrently be fostered. This approach aims to establish a hierarchical ‘tree’ development structure, with development efforts extending like ‘capillaries’ to all counties. Through this comprehensive approach, the sustainable and prosperous development of the county economies in Gansu Province can be effectively promoted.

4. Conclusions, Recommendations, Policy Insights, and Future work

4.1. Conclusions

This paper utilizes a dataset encompassing the sustainable development index of county economies in Gansu Province spanning from 2016 to 2020. Employing methodologies such as the Theil index, spatial autocorrelation, principal component analysis, and cluster analysis, it tracks and assesses the evolution of sustainable county economic development in Gansu Province. The aim is to analyze trends and spatial distribution characteristics, and classify the potential for sustainable county economic development, proposing targeted strategies based on the distinctive economic development zones within Gansu Province.
The findings of this study are as follows:
  • The development of county economies in Gansu Province exhibits characteristics of scattered distribution and weak communication with surrounding counties, with a pattern of multi-point flowering.
  • Significant disparities exist in the economic development of Gansu Province’s counties, particularly evident in the year 2018.
  • Liangzhou District emerges as the top performer in county economic development in Gansu Province. Counties with robust economic development are primarily clustered in the ‘Lanzhou–Baiyin metropolitan area’, ‘Tianshui metropolitan area’, the western entrance of the ‘Hexi Corridor economic belt’, and the Qingyang–Pingliang region, displaying a spatial pattern of agglomeration towards the middle and east.
  • Southeastern Gansu shows promising potential for sustainable county economic development, with the emergence of a contiguous development pattern.

4.2. Recommendations and Policy Insights

First, Gansu Province should strengthen inter-regional exchanges and cooperation between counties and regions, encourage stronger exchanges and cooperation between different counties, and promote inter-regional resource sharing and synergistic development in order to promote the economic upgrading of the entire region. Second, Gansu Province should optimize policy support and formulate differentiated policy support for different counties to promote the sustainable development of each county’s economy. Third, it should actively promote the ‘continuous’ development of counties, and for the southeast Longdong region, which has greater development potential, it can further promote the ‘continuous’ development and synergistic development of the economy within the region. In conclusion, the development of the county economies requires the government and society to deploy and regulate policies from different dimensions, such as GDP development, financial development, industrial development, social development, etc., to complete the transformation of the sustainable development of the county economies.

4.3. Future Work

First, on the basis of the existing research work, further in-depth study should be undertaken of the internal mechanisms and influencing factors of the economic development of the counties. For example, the ecological impacts affecting the sustainable development of county economies have not been quantitatively analyzed, and this part will be analyzed and researched in detail in future research, so as to better guide policy formulation and development planning. At the same time, it will be beneficial to study and analyze which types of dimensional indicator factors have a greater impact on the sustainable development of county economies. Secondly, interdisciplinary cooperation and exchange should be organized, combining the knowledge of economics, geography, sociology, and other aspects to comprehensively analyze the complexity and diversity of the sustainable development of county economies. Finally, a monitoring and evaluation system should be established to regularly track the development of county economies and adjust policy measures in a timely manner to promote sustainable economic development.

Author Contributions

Conceptualization, Methodology, Writing—Original Draft Preparation, H.T.; Writing—Reviewing and Editing, P.C. All authors have read and agreed to the published version of the manuscript.

Funding

This study was funded by the Natural Science Foundation of the Gansu Provincial Department of Science and Technology (Project No. 23JRRA867).

Institutional Review Board Statement

Not applicable.

Informed Consent Statement

Not applicable.

Data Availability Statement

The data used in this study are derived from the statistical yearbook data of cities and states in Gansu Province, China and the seventh census data and other relevant statistical data. The administrative division data comes from the National Geographic Information Resource Directory Service System.

Acknowledgments

We are grateful for the basic data provided by the city and state statistical bureaus and the National Basic Geographic Information Center in Gansu Province of China.

Conflicts of Interest

The authors declare no conflicts of interest.

References

  1. Qiu, G.T.; Ge, J.L. On Social Development in the Post-Epidemic Era. J. Humanit. 2023, 2, 98–108. [Google Scholar]
  2. Wang, Y. Literature Review of China’s Economic Development in the “Post-epidemic” Era. Theor. Platf. Tibet. Dev. 2021, 3, 85–89. [Google Scholar]
  3. Feng, X.Y. The Evolution of China’s Sustainable Development Theory in the 40 Years of Reform and Opening Up. Mod. Manag. Sci. 2018, 6, 27–29. [Google Scholar]
  4. Sikos Tomay, T.; Szendi, D. Analysing economic and environmental sustainability in Hungary: How cities with county rights perform in SDGs. Urban. Izziv. 2023, 34, 87–97. [Google Scholar] [CrossRef]
  5. Sticking to Solving the ‘Three Rural Issues’ as the Top Priority of the Work of the Whole Party and the Whole Society to Promote Rural Revitalization. Available online: http://www.qstheory.cn/dukan/qs/2022-03/31/c_1128515304.htm (accessed on 6 December 2023).
  6. Gu, J.D. Urban-rural Interaction Promotes County Economic Development. Macroeconomics 2003, 4, 49–50+55. [Google Scholar]
  7. Zhou, M.L.; Wang, L.C. Does the Incremental Reform of Rural Finance Boost County-Level Economic Development? An Empirical Analysis of 1137 Village Banks. China Rural Surv. 2023, 6, 24–43. [Google Scholar]
  8. Zhang, X.L.; Zhou, Z.L.; Tang, X.Y. Several Theoretical Problems on Promoting High-quility Development of County Economy in China. Financ. Trade Res. 2023, 34, 1–8. [Google Scholar]
  9. Zhu, B.Q.; Li, T. Research on the impact of rural industrial integration development on county economic resilience. J. Agro-For. Econ. Manag. 2024, 4, 1–13. [Google Scholar]
  10. Chen, H.Y.; Zhang, Z.Y.; Du, H. The Path Choice of Structure Green Economy “Internal Cycle” facing “Double Cycle”: An Empirical Analysis of Carbon Emission Reduction Practise in GSCM of County Manufacturing Enterprises. Ecol. Econ. 2021, 37, 57–64. [Google Scholar]
  11. Jia, J.H.; Sun, Y.T. Policy logic and path of transition from poverty alleviation to rural revitalization. J. Zhengzhou Univ. Philos. Soc. Sci. Ed. 2022, 55, 23–28. [Google Scholar]
  12. Ji, Z.G.; Luo, Q.Q. The Development Context and Innovative Contribution of Xi Jinping’s Important Discussion on Rural Revitalization. Economist 2022, 4, 5–16. [Google Scholar]
  13. Wang, B.; Chen, Y. Research on the Development Strategy of the County Economy in Western China under the New Normal Economy. Shanghai J. Econ. 2016, 10, 76–83. [Google Scholar]
  14. Song, F.F.; Song, Y.P. Connotation, Characteristics and High-quality Development of County Economies--Taking Hubei as an Example. Hubei Soc. Sci. 2020, 2, 74–80. [Google Scholar]
  15. Dong, F. New ideas to support county economic development in the macroeconomic situation. Corp. Financ. 2022, 7, 59–60. [Google Scholar]
  16. Zeng, T.Y.; Jin, H.; Gang, X.; Luan, J.Y. County Economy, Population, Construction Land, and Carbon Intensity in a Shrinkage Scenario. Sustainability 2022, 14, 10523. [Google Scholar] [CrossRef]
  17. Li, T.L.; Li, D.Z.; Liang, D.; Huang, S.M. Coupling Coordination Degree of Ecological-Economic and Its Influencing Factors in the Counties of Yangtze River Economic Belt. Sustainability 2022, 14, 15467. [Google Scholar] [CrossRef]
  18. Ehlert, A. The socio-economic determinants of COVID-19: A spatial analysis of German county level data. Socio-Econ. Plan. Sci. 2021, 78, 101083. [Google Scholar] [CrossRef] [PubMed]
  19. Poudyal, R. COVID-19 impacts on energy systems in Nepal: Implications for SDGs. In Proceedings of the 6th SONEUK Conference, London, UK, 10 July 2021. [Google Scholar]
  20. Yuan, Q.W.; Chen, J.; Han, W.W.; Yang, X.J. Impact of Population Changes on County Economic Vulnerability in the Loess Plateau. Sci. Geogr. Sin. 2022, 42, 2006–2018. [Google Scholar]
  21. Chen, H.Z.; Zeng, B.; Guo, H. Spatial-temporal Pattern Evolution and Driving Factors of County Economy in the Yellow River Basin: Based on the Analysis of Night Light Data. Econ. Geogr. 2022, 42, 37–44. [Google Scholar]
  22. Liu, H.L.; Luo, N.X.; Hu, C.C. Detection of County Economic Development Using LJ1-01 Nighttime Light Imagery: A Comparison with NPP-VIIRS Data. Sensors 2020, 20, 6633. [Google Scholar] [CrossRef]
  23. Gibson, J.; Boe-Gibson, G. Nighttime Lights and County-Level Economic Activity in the United States: 2001 to 2019. Remote Sens. 2021, 13, 2741. [Google Scholar] [CrossRef]
  24. Liu, G.B.; Du, Y.H. Research on the Effects of Population Aging in Chinese County Economy. Popul. J. 2015, 37, 77–86. [Google Scholar]
  25. Liu, X.Y.; Ding, Z.W.; Huang, X.D.; Wang, M.; Wang, F.Z. Spatial Distribution Characteristics and Influence Factors of E-Commerce Development Level in China: Based on EDI of 1915 Counties. Econ. Geogr. 2018, 38, 11–21+38. [Google Scholar]
  26. He, S.W.; Liao, H.F.; Li, G.D. A spatiotemporal analysis of county economy and the multi-mechanism process of regional inequality in rural China. Appl. Geogr. 2019, 111, 102073. [Google Scholar] [CrossRef]
  27. Song, G.D.; Zhong, S.; Song, L.G. Spatial Pattern Evolution Characteristics and Influencing Factors in County Economic Resilience in China. Sustainability 2022, 14, 8703. [Google Scholar] [CrossRef]
  28. Li, Z.J.; Hu, M.J.; Wang, Z.Y. The space-time evolution and driving forces of county economic growth in China from 1998 to 2015. Growth Change 2020, 51, 1203–1223. [Google Scholar] [CrossRef]
  29. Ren, Y.; Gu, G.F. Temporal and Spatial Characteristics and Influencing Factors of County Economy in Northeast China. Areal Res. Dev. 2018, 37, 25–31. [Google Scholar]
  30. Li, Z.R.; Xu, D.Y.; Lei, S.Y.; Wang, R.Y. County economic disparity in Chengdu-Chongqing urban agglomeration. World Reg. Stud. 2018, 27, 76–85. [Google Scholar]
  31. Song, W. Research on the Coordinated Development of ‘Three Modernizations’ of County Economy in Central Region. Rural Econ. 2011, 5, 58–62. [Google Scholar]
  32. Feng, X.H.; Zhong, Y.X.; Chen, L.; Fu, Y. Evolution of Spatial Pattern of County Regional Economy in Yangtze River Economic Belt. Econ. Geogr. 2016, 36, 18–25. [Google Scholar]
  33. Hu, Y.; Zhang, J.X. Economic space evolution of Yangtze River Delta Group based on county scale. Econ. Geogr. 2010, 30, 1112–1117. [Google Scholar]
  34. Li, L.; Tian, C.H. Can the Integration of Rural Primary, Secondary and Tertiary lndustries Promote the Common Prosperity of County: Evidence from 579 Counties in the Yangtze River Economic Belt. J. Agrotech. Econ. 2024, 39, 59–75. [Google Scholar]
  35. Zhang, B.F.; Li, J.J.; Hu, Z.Q.; Wang, J.J.; Miao, C.H. The influence of natural endowment and political district type on the economic development of Chinese counties. Geogr. Res. 2021, 40, 2508–2525. [Google Scholar]
  36. Poudyal, R. Renewable Energy and Other Strategies for Mitigating the Energy Crisis in Nepal. 2021. Available online: https://cronfa.swan.ac.uk/Record/cronfa58990/Descripton (accessed on 20 January 2024).
  37. Oprisan, O.; Pirciog, S.; Ionascu, A.E.; Lincaru, C.; Grigorescu, A. Economic Resilience and Sustainable Finance Path to Development and Convergence in Romanian Counties. Sustainability 2023, 15, 14221. [Google Scholar] [CrossRef]
  38. Pan, Q.D. Research on the Mechanism of Digital Inclusive Finance to Promote the Development of County Economy. New Financ. 2023, 2, 46–55. [Google Scholar]
  39. Ming, L.; Yang, P.; Yang, S.G. Does County Financial Competitiveness Promote Economic Growth under the Background of High-quality Economic Development ? Rev. Investig. Stud. 2019, 38, 31–47. [Google Scholar]
  40. Feng, Y.Z.; Yin, Z.L.; Wang, L.G.; Mao, L.; Qiu, X.F.; Tao, Z.L.; Wu, C.X. The impacts of climate change and land use change on terrestrial ecosystem carbon storage of Gansu province from 1980 to 2020. J. Desert Res. 2023, 43, 168–179. [Google Scholar]
  41. Sun, J.F.; Ma, T.Y. Analysis of county economic growth and convergence under the perspective of regional coordinated development. Dongyue Trib. 2023, 12, 111–121. [Google Scholar]
  42. Huang, G.Q.; Zhang, S.M.; Shi, P.F. Regional Differences and Influencing Factors of the Tourism Economy in Chengdu-Chongqing Economic Circle under the Goal of Common Prosperity. J. Southwest Univ. Nat. Sci. Ed. 2023, 45, 110–122. [Google Scholar]
  43. Wang, Z.; Cheng, J.H.; Cheng, Z.H. Regional differences and influencing factors of tourism carbon equilibrium in China. Acta Ecol. Sin. 2021, 41, 8063–8075. [Google Scholar]
  44. Gedamu, W.T.; Plank-Wiedenbeck, U.; Wodajo, B.T. A spatial autocorrelation analysis of road traffic crash by severity using Moran’s I spatial statistics: A comparative study of Addis Ababa and Berlin cities. Accid. Anal. Prev. 2024, 200, 107535. [Google Scholar] [CrossRef]
  45. Meng, X.; Tian, M.H.; Du, L.; Ma, S. Measurement and its coordination of the development level of agricultural and rural modernization in China. Arid Land Geogr. 2024, 47, 137–146. [Google Scholar]
  46. Gao, H.X. Applied Multivariate Statistical Analysis; Peking University Press: Beijing, China, 2005. [Google Scholar]
  47. Li, B.X.; Zhang, Y.H. Comprehensive Evaluation of Urban Economic Development Potential in Hebei Province. Bus. Econ. 2022, 8, 16–18. [Google Scholar]
  48. Li, G.; Zhang, S.Y.; Kong, J.J. Study on influencing factors and prediction of economic development potential in Jiangsu province. J. Chang. Norm. Univ. 2020, 39, 74–81. [Google Scholar]
  49. Wang, Q.; Ding, Y.W.; Guo, X.M. Construction of the Indicator System of Economic High-quality Development of Counties in China. Soft Sci. 2021, 35, 115–119+133. [Google Scholar]
  50. Li, F.X.; Liu, D.F.; Kong, X.S.; Liu, Y.L. Multi-scenario Evaluation of County-scale Development Potential based on Shared Socioeconomic Pathways and Dynamic Simulation Approach. J. Geo-Inf. Sci. 2022, 24, 684–697. [Google Scholar]
  51. Yang, Z.; Zhang, X.L.; Lei, J.; Duan, Z.L.; Li, J.G. Spatio-temporal Pattern Characteristics of Relationship Between Urbanization and Economic Development at County Level in China. Chin. Geogr. Sci. 2019, 29, 553–567. [Google Scholar] [CrossRef]
  52. You, S.B.; Gao, Y. Construction Process and Prospect of China’s National Economic Accounting System. Stat. Decis. 2020, 36, 10–14. [Google Scholar]
  53. Liu, Y.C.; Liu, X.G.; Yan, Y. China ’s Macroeconomic Recovery under the Impact of Recurrent Epidemic and Structural Adjustment—China ’s Macroeconomic Report 2021–2022. Econ. Theory Bus. Manag. 2022, 42, 13–34. [Google Scholar]
  54. Zhang, L.; Jia, M.D. The Empirical Analysis of the Effects of Financial Expenditure and Revenue on Economic Growth. Forecasting 2009, 28, 71–76. [Google Scholar]
  55. Shalabi, L.A.; Shaaban, Z.; Kasasbeh, B. Data Mining: A Preprocessing Engine. J. Comput. Sci. 2006, 2, 735–739. [Google Scholar] [CrossRef]
  56. Zhan, D.S.; Zhang, W.Z.; Meng, B.; Dang, Y.X.; Liu, Q.Q. Spatial Structure of Urban Residence and Employment in Beijing. Sci. Geogr. Sin. 2017, 37, 356–366. [Google Scholar]
  57. Liao, K.H.; Chen, S.H. Identification of Spatial Development Types of Inter-City Border Towns in Guangdong Province, China. Trop. Geogr. 2022, 42, 431–443. [Google Scholar]
  58. Tan, M.F. Theoretical Analysis of the “High Quality Development” of County Society—Based on Sociological Perspective. Soc. Sci. Res. 2022, 6, 66–82. [Google Scholar]
  59. Liu, G.B.; Han, Y.T. Thoughts and Countermeasures for Realizing High-quality Development of County Economy in the New Era. Tax. Econ. 2019, 6, 55–61. [Google Scholar]
  60. Chen, J.S.; Ren, L. From County Competition to County Co-cooperation: The Strategic Choice of High-quality Development of County Economy. Reform 2022, 4, 88–98. [Google Scholar]
Figure 1. Topography of the study area.
Sustainability 16 04518 g001
Figure 2. Spatial distribution of per capita GDP of county economies in Gansu Province from 2016 to 2020.
Sustainability 16 04518 g002
Figure 3. LISA aggregation map of per capita GDP in counties of Gansu Province from 2016 to 2020.
Sustainability 16 04518 g003
Figure 4. Analysis of absolute gap in county economies of Gansu Province from 2006 to 2020.
Sustainability 16 04518 g004
Figure 5. Analysis of the Theil index of the county economies in Gansu Province from 2016 to 2020.
Sustainability 16 04518 g005
Figure 6. Gap analysis of sustainable development trends of county economies in Gansu Province.
Sustainability 16 04518 g006
Figure 7. Spatial distribution of comprehensive scores of sustainable development potential of county economies in Gansu Province.
Sustainability 16 04518 g007
Figure 8. Classification map of county groups in Gansu Province.
Sustainability 16 04518 g008
Table 1. Confidence of Z-score corresponding to p-value.
Z-Scorep-ValueConfidence (%)
<−1.65 or >+1.65<0.1090
<−1.96 or >+1.96<0.0595
<−2.58 or >+2.58<0.0199
Table 2. Index evaluation system.
DimensionIndexUnitCode/X
Level of GDP DevelopmentGross National ProductMillion CNY 1X1
Level of Financial DevelopmentHousehold Savings Deposit BalanceMillion CNYX2
Loan Balance of Financial InstitutionsMillion CNYX3
Level of Fiscal DevelopmentGeneral Public Budget RevenueMillion CNYX4
General Public Budget ExpenditureMillion CNYX5
Level of Industrial DevelopmentThe Added Value of the Primary IndustryMillion CNYX6
The Added Value of the Secondary IndustryMillion CNYX7
Number of Industrial Enterprises Above the Designated SizePCS 2X8
Level of Social DevelopmentPermanent Resident PopulationMillion PeopleX9
Number of Students in General Secondary SchoolsPeopleX10
Number of Pupils in Primary SchoolsPeopleX11
Number of Beds in Healthcare InstitutionsPCSX12
1 CNY (Chinese Yuan): this is the legal tender of the People’s Republic of China. 2 PCS (pieces): PCS indicates the number of units of a particular product.
Table 3. Moran’s index of per capita GDP of counties in Gansu province.
Year20162017201820192020
Moran’s Index0.2260.2680.2540.2290.272
Z-Score5.8786.5726.2205.6686.777
p-Value0.0000.0000.0000.0000.000
Table 4. Theil index of county economies in Gansu Province from 2016 to 2020.
YearTTBRTWRT
Lanzhou Economic Circle
T
Hexi Corridor Economic Belt
T
Longdongnan Region
CoefficientContribution RateCoefficientContribution Rate
20160.180.0636.36%0.1163.64%0.110.090.14
20170.180.0531.12%0.1268.88%0.120.080.16
20180.190.0526.19%0.1473.81%0.140.090.18
20190.170.0423.56%0.1376.44%0.140.090.16
20200.160.0530.81%0.1169.19%0.120.090.12
Table 5. The score table of the sustainable development of county economies in Gansu Province (2016–2020).
County20162017201820192020County20162017201820192020
Yongdeng1.51 1.54 1.28 1.31 1.08 Huanxian1.72 1.80 0.70 0.87 1.07
Gaolan−0.75 −0.72 −0.98 0.13 0.18 Huachi−0.95 −0.80 −1.36 −0.54 −0.66
Yuzhong1.93 2.33 2.77 3.25 3.76 Heshui−1.21 −1.27 −1.53 −1.02 −1.11
Yongchang0.42 0.23 −0.31 0.08 0.09 Zhengning−1.54 −1.75 −1.59 −1.69 −1.71
Jingyuan1.12 1.02 1.43 1.01 0.99 Ningxian0.45 0.37 0.48 0.02 0.02
Huining1.56 1.62 1.95 1.22 0.98 Zhenyuan0.94 0.95 1.49 0.84 0.43
Jingtai−0.52 −0.49 −0.69 −0.35 −0.16 Anding2.33 2.20 2.10 1.83 1.87
Qingshui−0.82 −0.67 −0.73 −0.88 −0.90 Tongwei−0.08 −0.08 0.26 −0.33 −0.42
Qinan1.07 1.29 1.49 0.70 0.63 Longxi1.89 1.90 2.35 1.75 1.58
Gangu1.84 1.19 2.19 1.46 1.52 Weiyuan−0.63 −0.65 −0.34 −0.75 −0.80
Wushan0.61 0.66 1.23 0.45 0.44 Lintao1.64 1.83 2.13 1.59 1.82
Zhangjiachuan−0.97 −0.91 −0.54 −1.03 −1.11 Zhangxian−1.92 −1.86 −1.76 −1.76 −1.80
Liangzhou13.23 12.90 12.22 11.05 10.88 Minxian0.12 0.27 0.83 0.05 0.23
Minqin1.66 1.16 0.82 0.93 0.65 Wudu2.55 3.04 3.39 2.70 2.65
Gulang0.51 0.62 0.95 0.28 0.20 Chengxian−0.39 −0.49 −0.37 −0.28 −0.37
Tianzhu0.32 −0.07 −0.27 −0.32 −0.45 Wenxian−1.46 −1.39 −1.52 −1.13 −0.82
Ganzhou5.28 5.90 5.38 5.54 5.39 Tanchang−1.09 −1.07 −0.48 −1.12 −1.15
Sunan−2.04 −2.14 −2.42 −1.98 −1.94 Kangxian−1.85 −1.79 −1.93 −1.85 −1.84
Minle−0.10 −0.15 −0.09 −0.08 −0.21 Xihe−0.56 −0.54 0.30 −0.42 −0.40
Linze−0.61 −0.67 −1.39 −0.96 −1.00 Lixian−0.07 −0.12 0.98 −0.10 0.04
Gaotai−0.19 −0.58 −1.19 −0.75 −0.91 Huixian−0.91 −0.81 −0.98 −0.74 −0.80
Shandan−0.55 −0.57 −0.82 −0.45 −0.53 Liangdang−2.97 −2.98 −3.24 −2.75 −2.73
Kongtong4.19 4.02 3.61 3.30 3.85 linxia−0.20 1.13 1.09 2.56 3.14
Jingchuan−0.06 −0.47 −0.55 −0.77 −0.94 linxia−0.78 −0.62 −0.08 −0.77 −0.63
Lingtai−1.27 −1.42 −1.49 −1.56 −1.58 Kangle−1.54 −1.42 −0.87 −1.30 −1.28
Chongxin−2.03 −1.96 −2.18 −1.51 −1.57 Yongjing−0.96 −0.89 −1.00 −0.70 −0.54
Huating−0.45 −0.36 1.19 0.18 0.06 Guanghe−1.63 −1.50 −1.01 −1.42 −1.32
Zhuanglang0.26 0.50 1.53 0.88 0.68 Hezheng−1.78 −2.19 −1.93 −1.82 −1.52
Jingning0.97 1.00 −0.07 0.39 0.07 Dongxiang−1.51 −1.33 −0.44 −1.31 −1.04
Suzhou4.89 4.72 4.11 4.96 5.12 Jishishan−1.73 −1.60 −1.30 −1.66 −1.58
Jinta−0.45 −0.64 −1.22 −0.89 −0.83 Hezuo−1.70 −1.64 −1.92 −1.53 −1.55
Guazhou0.01 −0.22 −0.90 0.12 0.26 Lintan−2.12 −2.14 −2.09 −2.11 −2.07
Subei−2.68 −2.87 −3.23 −2.39 −2.23 Zhuoni−2.24 −2.16 −2.15 −2.08 −2.13
Akesai−2.97 −3.15 −3.52 −2.88 −2.91 Zhouqu−1.98 −1.91 −1.76 −1.73 −1.84
Yumen1.21 1.00 −0.13 1.76 1.89 Diebu−2.59 −2.62 −2.64 −2.33 −2.45
Dunhuang1.26 0.56 −0.24 0.33 0.01 Maqu−2.54 −2.48 −2.56 −2.37 −2.38
Xifeng4.67 5.52 4.77 5.57 5.36 Luqu−2.87 −2.80 −3.00 −2.75 −2.75
Qingcheng0.54 0.00 0.13 0.33 0.25 Xiahe−2.45 −2.32 −2.38 −2.28 −2.22
Table 6. Comprehensive score ranking of sustainable development potential of county economies in Gansu Province.
CountyScoreRankingCountyScoreRankingCountyScoreRanking
Liangzhou12.0541Ningxian0.26827Dongxiang−1.12553
Ganzhou5.4972Qingcheng0.25028Heshui−1.22654
Xifeng5.1773Lixian0.14529Wenxian−1.26455
Suzhou4.7584Huating0.12530Kangle−1.28156
Kongtong3.7935Yongchang0.10131Guanghe−1.37757
Wudu2.8656Minle−0.12732Lingtai−1.46258
Yuzhong2.8097Tongwei−0.12933Jishishan−1.57159
Anding2.0658Guazhou−0.14434Zhengning−1.65660
Longxi1.8939Tianzhu−0.15635Hezuo−1.66861
Lintao1.80410Xihe−0.32336Zhangxian−1.81762
Gangu1.63911Chengxian−0.38037Zhouqu−1.84463
Linxia1.54212Gaolan−0.42838Hezheng−1.84864
Huining1.46713Jingtai−0.44239Chongxin−1.85165
Yongdeng1.34314Jingchuan−0.55740Kangxian−1.85166
Huanxian1.23115Linxia−0.57541Lintan−2.10367
Yumen1.14516Shandan−0.58342Sunan−2.10368
Jingyuan1.11117Weiyuan−0.63643Zhuoni−2.15069
Minqin1.04318Gaotai−0.72544Xiahe−2.32870
Qinan1.03619Qingshui−0.80045Maqu−2.46771
Zhenyuan0.93020Jinta−0.80546Diebu−2.52772
Zhuanglang0.76821Yongjing−0.81847Subei−2.67973
Wushan0.67622Huixian−0.84748Luqu−2.83374
Gulang0.51223Huachi−0.86349Liangdang−2.93675
Jingning0.47124Zhangjiachuan−0.90950Akesai−3.08376
Dunhuang0.38425Linze−0.92651
Minxian0.30026Tanchang−0.98152
Disclaimer/Publisher’s Note: The statements, opinions and data contained in all publications are solely those of the individual author(s) and contributor(s) and not of MDPI and/or the editor(s). MDPI and/or the editor(s) disclaim responsibility for any injury to people or property resulting from any ideas, methods, instructions or products referred to in the content.

