Essay

CFD-DEM Modeling of Cryogenic Hydrogen Flow and Heat Transfer in Packed Bed

School of Environment and Energy Engineering, Anhui Jianzhu University, Hefei 230009, China
*
Author to whom correspondence should be addressed.
Sustainability 2024, 16(11), 4522; https://doi.org/10.3390/su16114522
Submission received: 12 April 2024 / Revised: 9 May 2024 / Accepted: 24 May 2024 / Published: 26 May 2024
(This article belongs to the Special Issue Green and Clean Hydrogen Production)

Abstract

:
Hydrogen is an important component of renewable energy and is essential for sustainable development. The cryogenic energy storage system can solve the problem of hydrogen storage. A packed bed can be applied in a cryogenic energy storage system. It is crucial to understand the cryogenic energy discharging in a packed bed. In the present work, the CFD-DEM coupling method is used to investigate the pore-scale flow and heat transfer characteristics of cryogenic hydrogen flowing through the packed bed. To demonstrate the characteristics of the pore-scale heat transfer of the hydrogen flow in a packed bed, the local radial-averaged and axial-averaged temperatures and velocities are analyzed in detail, depending on the local porosity distribution. The pore-scale radial-averaged velocity distribution is proportional to the local radial porosity distribution, whereas the pore-scale radial-averaged temperature characteristics are inverse. Moreover, for the heat exchange of the cryogenic hydrogen flow in a packed bed, it can be found that the cryogenic hydrogen flow is fully heated at an axial distance of approximately 7 dp. Finally, considering that the thermo-physical properties of cryogenic hydrogen are sensitive to the temperature in a packed bed, the friction factor and Nusselt number in the packed bed are also analyzed under various operating parameters, which are in good agreement with certain classic empirical correlations.

1. Introduction

Currently, the utilization of fossil fuels has led to a global increase in carbon dioxide emissions, which in turn has precipitated the frequent occurrence of natural disasters, posing a threat to the Earth’s ecosystem. Hydrogen is a sustainable energy source that has a high energy value, and the byproduct of combustion is only water [1]. Hydrogen can be produced using various methods, including extraction from fossil fuels, electrolysis of water utilizing renewable sources such as solar and wind energy, and biomass gasification. Particularly, the process of water electrolysis powered by renewable energy sources is considered to be especially sustainable. Due to those advantages, hydrogen is considered a viable alternative to fossil fuels and is considered the energy of the future. Consequently, hydrogen is closely related to sustainable development and represents a crucial element in the transition towards a low-carbon economy.
Packed beds, typically formed within cylindrical containers, are filled in a randomized manner with a multitude of particles. Spherical particles can provide a more uniform fluid flow path and less flow resistance, and they are usually able to achieve higher filling densities and moderate porosity. Packed beds can be used to store energy [2], such as cryogenic energy storage (CES) [3]. There are several advantages to CES, including no geological limitations, high energy storage density, low capital cost per unit of energy, eco-friendliness, and long storage times [4]. The operational paradigm of this system encompasses two primary phases: charging and discharging. In the charging phase, cryogenic fluid is introduced atop the packed bed, whereas the discharging phase facilitates the fluid’s flow from the packed bed’s bottom to its top, and the fluid is heated by the packed bed. Consequently, the heated fluid exits from the upper section, earmarked for utilization in power generation stations or other operations [5]. The predominant heat transfer mechanism within the packed bed during these phases is identified as convection. The Nusselt number is a critical dimensionless entity that has been extensively leveraged in numerous experimental studies to derive correlations essential for determining the convective heat transfer coefficient within packed beds [6,7]. Investigating the discharge phase within packed bed energy storage systems can enhance the uniformity of the temperature distribution across the system. This detailed study also provides critical insights that can inform the design of the packed bed, ensuring it is optimally tailored to meet specific application requirements. This study is specifically focused on investigating the discharging phase of packed beds when utilizing hydrogen as the working fluid.
The Discrete Element Method (DEM) represents a common technique for the construction of packed bed models. Many investigations have employed DEM to form the packed bed [8,9]. In the modeling of packed beds, spherical particles are simulated to drop under the influence of gravity into a cylindrical container, thereby achieving randomized packing [10]. However, a notable limitation associated with DEM pertains to inter-particle contact. In the absence of processing, these contact points are prone to generating meshes of low quality, which can detrimentally impact the accuracy of simulation results. The CFD-DEM method solves the liquid phase under the Eulerian framework and tracks the dispersed particles under the Lagrangian framework, providing a promising tool for modeling dense gas–solid flow [11,12]. Recently, the CFD-DEM has been extended to integrate thermochemical sub-models and applied to study heat transfer [13], char combustion [14], biomass gasification [15], and chemical looping combustion [16] in fluidized beds, showing potential in unveiling the mechanism of dense gas–solid reactive flow in multi-scale chemical engineering systems. Bu et al. [17] used the bridge method and added a cylinder between two particles that are in contact with each other, while the experimental data of Yang et al. [18] show that the bridge method was suitable for pressure drops in different packing forms of packed beds. Meanwhile, the bridge method was also proven to be suitable for predicting the Nusselt numbers in packed beds. Additionally, the bridge method has been considered a reliable predictor for Nusselt numbers within packed bed systems.
The modeling of heat transfer in porous media has been rigorously implemented using two approaches: Local Thermal Equilibrium (LTE) [19] and Local Thermal Non-Equilibrium (LTNE) [20]. An LTE model assumes an identical temperature of the fluid phase and the solid phase at a local position inside the catalyst bed. In contrast, the LTNE model acknowledges a temperature difference between the fluid phase and the solid phase at the same local position so that heat convection occurs between the two phases. The LTNE model is used to study the heat transfer characteristics between a fluid and a solid [21]. The conventional LTNE model has been proven to be inappropriate by Cheng and Wong [22]. The porosities were shown to indeed affect the convection characteristics and need to be considered locally. Therefore, the study of flow and heat transfer characteristics in packed beds is of great significance.
Some studies have used homogeneous porous media to analyze heat transfer [23,24]. Homogeneous usually means describing a material or system that has the same properties at every point in the porous medium. However, in real situations, the wall effect prevents spheres from being tightly stacked when they are randomly packed in a container [25]. Studies by Mueller [26] showed that the internal porosity of the packed bed oscillates in the radial direction. The pore-scale model is another model used to assess the thermal performance of the packed bed. The pore-scale model can represent the internal porosity of the packed bed oscillating in the radial direction and heat transfer characteristics inside the packed bed. Some studies suggest that the radial porosity distribution of the packed bed will affect the fluid velocity inside the packed bed [27,28].
Numerical simulation is a common method to study heat transfer. For example, Fterich et al. [29] simulated the characterization of the heat transfer in a PV/T air collector prototype. When compared with the experimental results, they showed adequate agreement between the simulation and the experiment. Computational Fluid Dynamics (CFD) simulation combined with the Discrete Element Method (DEM) for random packing generation has achieved good results in some studies, such as Hoorijani et al. [30], who used the CFD-DEM method to simulate the heat transfer in spout-fluid beds. The heat transfer model was validated using existing experimental results. Guardo et al. [31] Simulated a number of different values of Re and selected the pressure drop and heat transfer parameters as reference values to be compared with the numerical results. The results show that the CFD method was useful for estimating wall-to-fluid heat transfer parameters and also for calculating the pressure drop in fixed-bed reactors. Oschmann et al. [32] investigated the verification of heat transfer characteristics inside a three-dimensional model of a packed bed using the DEM method, which proved to be a reliable method.
There have been some studies on cryogenic heat transfer. Jin et al. [33] focused on the transient process of pipe cooling using the internal flow of cryogenic fluid. Because of the effect of fluid properties on the cooling process, heat transfer correlations suitable for various cryogenic fluids are required. The heat transfer coefficient is very important in the process of heat transfer. Tan et al. [4] used numerical simulation to study the thermal performance of the cryogenic storage thermal system of the packed bed. The working fluid was nitrogen. Nitrogen’s property change with temperature was considered. Chai et al. [3] investigated the CES system and found that the transient temperature axial distribution exhibits a typical thermocline behavior at both low and high pressures. Lin et al. [34] analyzed the thermodynamics of cascaded CES and showed that the charge-pressure-to-flow-rate ratio and middle temperature can influence roundtrip efficiency. It is vital to study the pressure and temperature distribution of packed beds.
The above research does not involve hydrogen, and so far, the heat transfer of cryogenic hydrogen in packed beds has not been fully investigated. Therefore, this paper will build a three-dimensional packed bed model, compare the Radial-averaged porosity distribution with the experiment results and commonly used correlations, and investigate the flow and heat transfer characteristics of cryogenic hydrogen flowing through the packed bed at the pore-scale. Section 2 describes the physical modeling and computational method in detail. Section 3 presents the results of the simulation and compares these results with certain empirical correlations.

2. Physical Model and Computational Method

2.1. Governing Equations
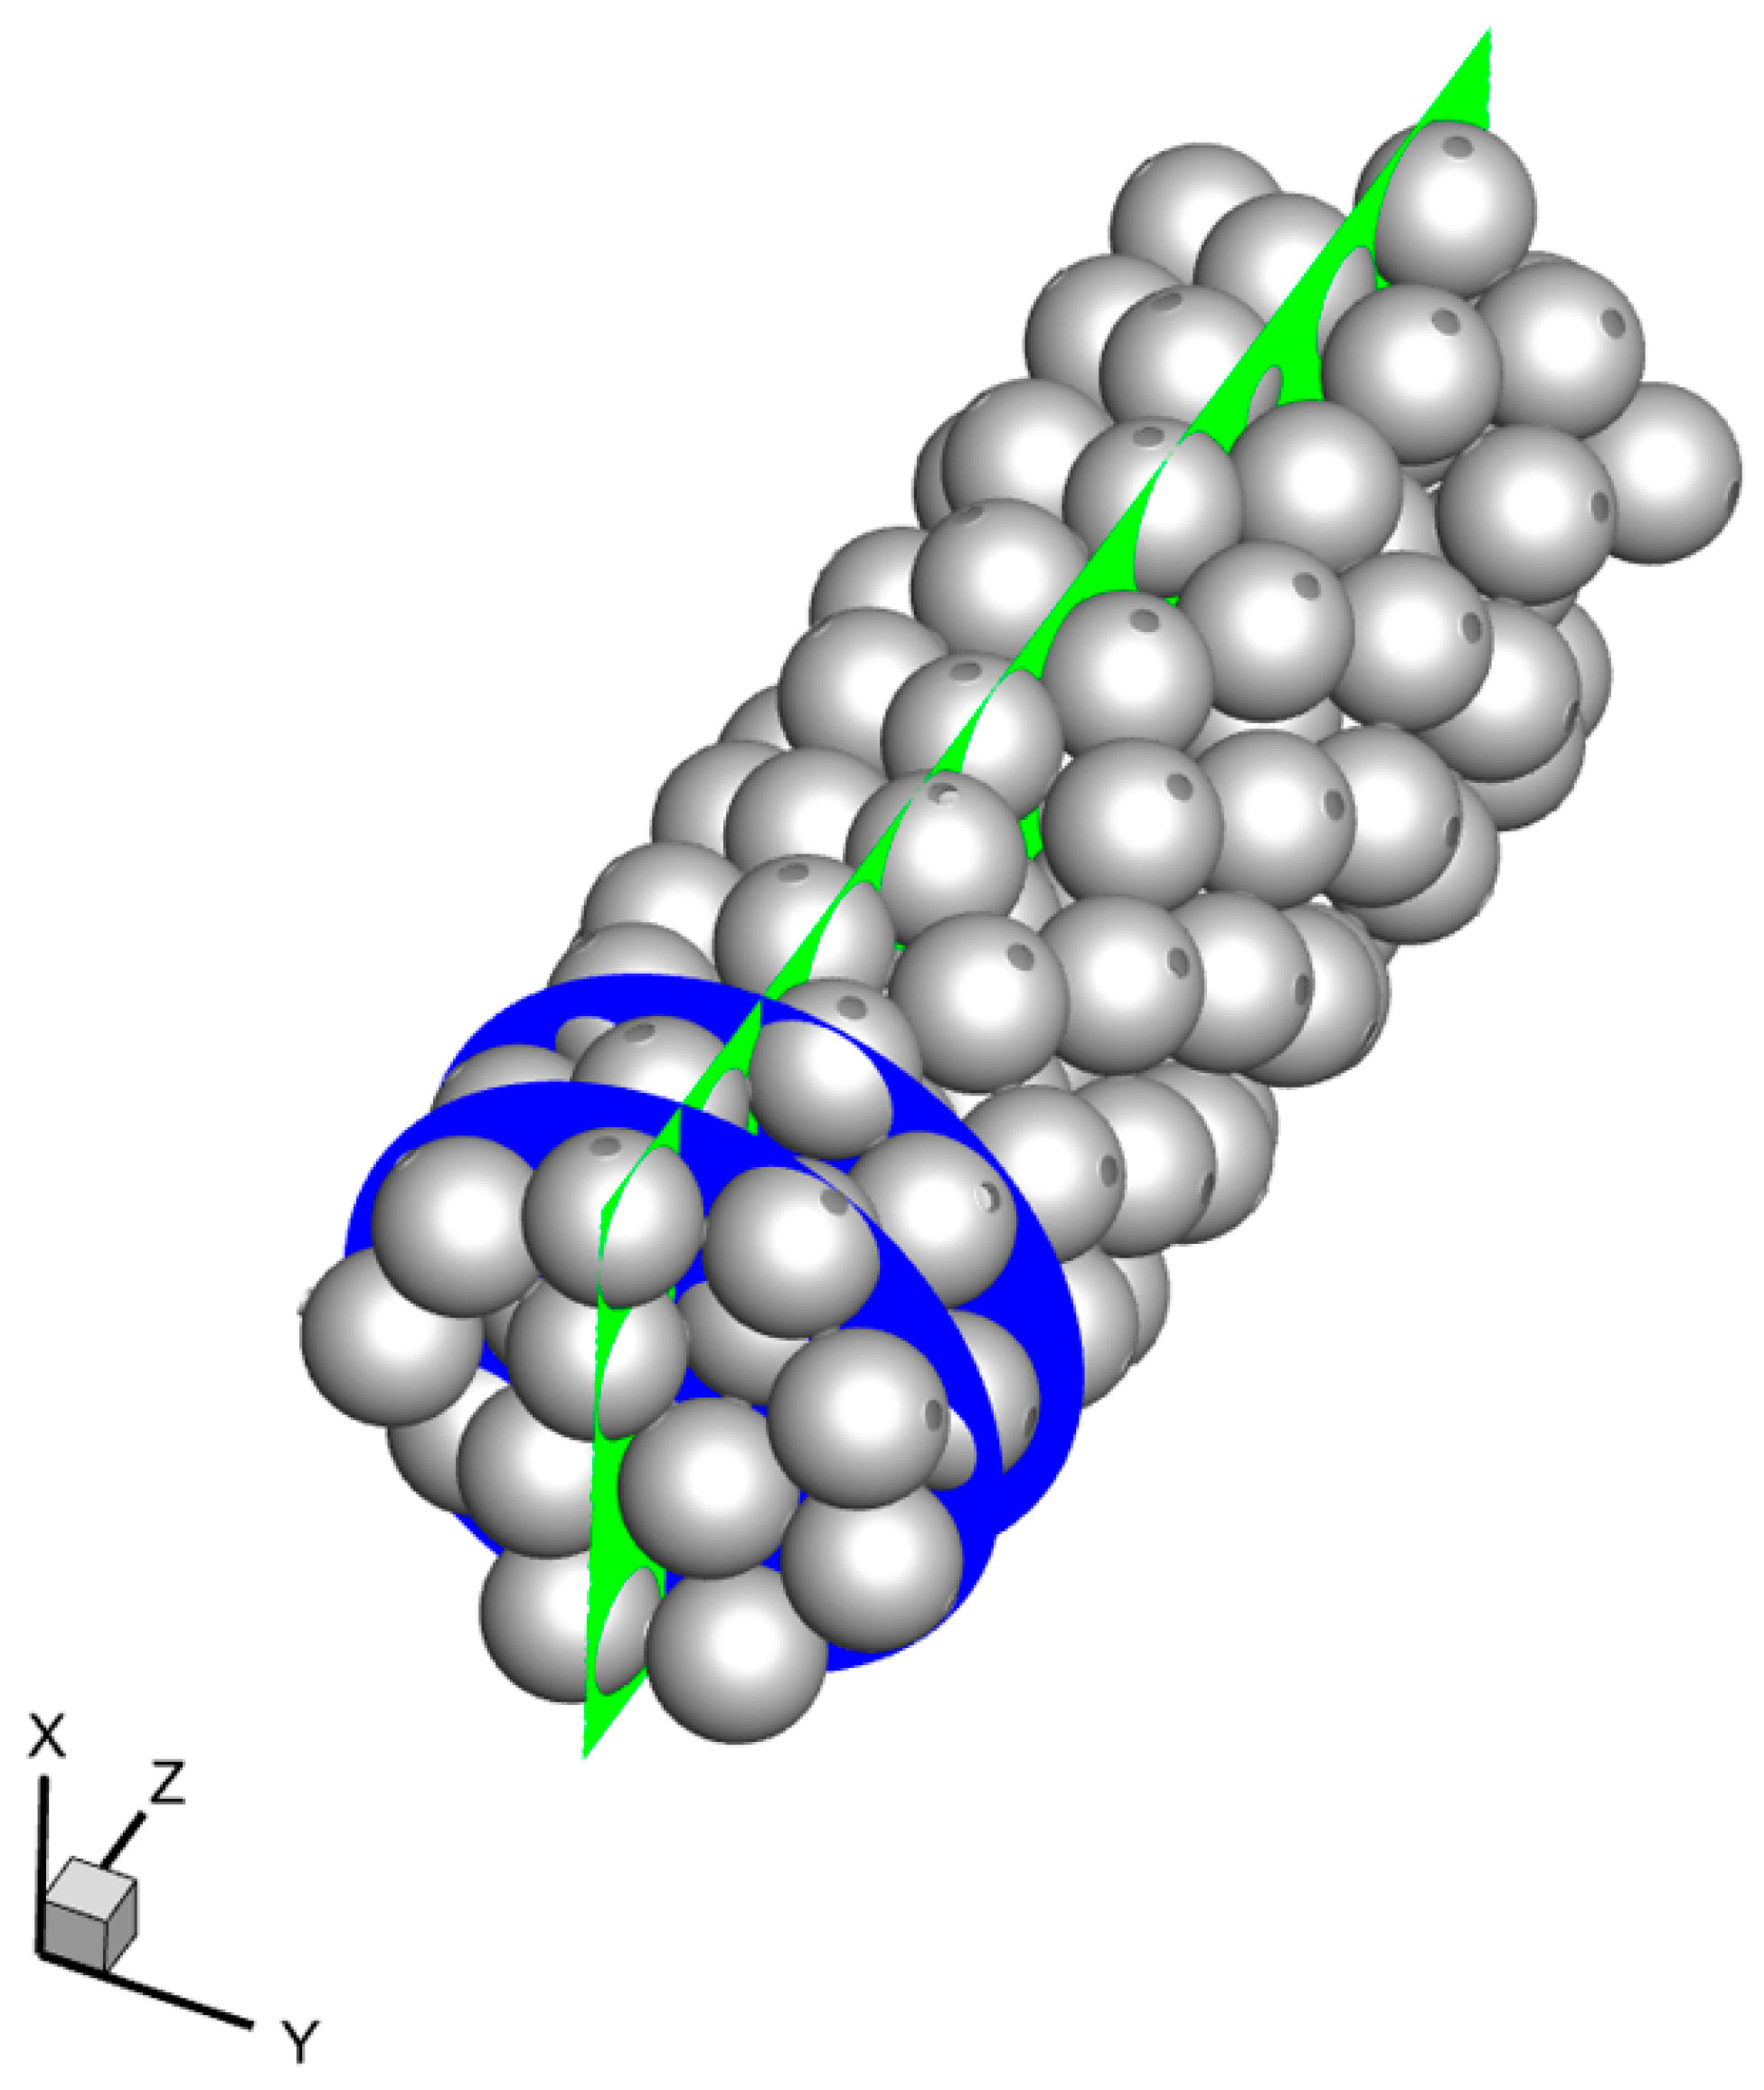
There is a large number of pore distributions inside the packed bed, resulting in complex internal fluid flow, and the heat exchange between fluid and particles occurs on the surface of the particles. The k-ε RNG model is more effective in dealing with near-wall turbulence, and it is suitable for the case of low Reynolds numbers. By improving the calculation of turbulent viscosity, it can better predict the pressure gradient and shear flow near the wall. Therefore, the steady-state RNG k-ε turbulence model is chosen for calculation. The heat transfer temperature is low and the radiation heat transfer is ignored. Therefore, the control equation can be written as follows [35]:
Continuity equation:
( ρ u i ) x i = 0
Momentum equation:
x j ( ρ u i u j ) = p x i + x j [ μ ( u i x j + u j x i 2 3 δ i j u i x j ) ( ρ u i u j ¯ ) ]
Energy equation:
x i ( ρ u i T ) = x i [ ( λ C + μ t σ T ) T x j ]
k-equation:
x i ( ρ k u i ) = x j [ ( μ + μ t σ k ) k x j ] + G k ρ ε
ε-equation:
x i ( ρ ε u i ) = x j [ ( μ + μ t σ ε ) ε x j ] + C 1 ε ε k G k C 2 ε ρ ε 2 k
where xi and xj are the distances in the i and j directions, ui and uj are the velocities of the fluid in the i and j directions, ui’ and uj’ are the fluctuating velocity of the fluid in the i and j directions, δij is the Kronecker delta, λ is the thermal conductivity of the fluid, C is the specific heat, k is the turbulent kinetic energy, ε is the turbulent dissipation rate, σT is the Plantl number in the energy equation, σε is the Plantl number in the turbulent flow energy equation, and C1 and C2 are two constants. Turbulent viscosity μt, the generation of turbulence kinetic energy Gk, and the additional term Rε are expressed as [36]:
μ t = ρ C μ k 2 ε
G k = μ t ( u i x j + u j x i ) u j x i
R ε = C μ ρ γ 3 ( 1 γ / γ 0 ) 1 + 0.012 γ 3 ε 2 0.012
γ = S k / ε , S = 2 S i j S i j , S i j = 1 2 ( u i x j + u j x i )
where Cμ is the model constant, γ is the turbulence model coefficient for RNG k-ε, γ0 is the turbulence model coefficient for RNG k-ε in the initial state, Sij is the deformation tensor, and S is the mean strain rate of the flow, where σT = 1.0, σk = σ = 0.72, Cμ = 0.0845, C1 = 1.42, C2 = 1.68, and γ0 = 4.38.

2.2. Physical Model

A cylindrical container with D = 40 mm and particles with d = 10 mm sizes was used for the packing generation. The generation of a packed bed is simulated using the DEM method. The falling process uses the Hertz–Mindlin model. A cylinder container with D = 80 mm and particles with d = 10 mm sizes was used for the packing generation. The ceramic particles are the selected alumina material. The physical parameters of the particles are shown in Table 1. The simulation assumes the particles are inserted randomly and dropped by gravity from the upper zone of the packed bed. After all the particles are inserted, the system’s kinetic energy is set to 10−9 J as a stopping criterion for the simulation. Figure 1 shows the model after the particle drop is completed. In order to eliminate the inlet effect, the inlet and outlet sections are extended somewhat and the hydrogen enters the packed bed from below and flows out from the upper outlet after heat exchange through the porous medium area.
Due to the physical properties of hydrogen change with temperature, the changes in the thermal properties of the hydrogen with temperature were determined using NIST PEFPROP [37], as listed in the following formula:
c p f = 1.30 × 10 7 T 4 + 2.61 × 10 4 T 3 0.19157 T 2 + 61.96289 T + 6970.13636
λ f = 3.57 × 10 7 T 2 + 6.92 × 10 4 T + 0.0112
μ f = 9.11 × 10 12 T 2 + 2.60 × 10 8 T + 1.94 × 10 6
Afterward, we used the DEM method to build this model. The contact between particles is referred to as point contact. Generating a mesh without processing results in a low-quality mesh, and the simulation result will be inaccurate. In order to eliminate this issue, current treatment methods to handle the contact between particles include overlaps, gaps, caps, and bridges [10,38,39,40]. The best results can be achieved by using the bridging method in the presence of heat exchange. As shown in Figure 1, we added a cylinder with a diameter of 1/6 dp between each particle and the next and between each particle and the wall.

2.3. Meshing

A polyhedral grid is used due to the complexity of the packed bed. Figure 2 shows a typical mesh distribution in this work, including whole and local images of the packed bed. Due to the low Reynolds number of the packed beds, we can obtain the satisfactory result of y+ < 5.

2.4. Model Validation

Porosity is the ratio of the volume of voids to the total volume. In the process of studying heat transfer inside packed beds, heat transfer in the radial direction is also noteworthy. The distribution of particles inside the packed bed will affect the porosity distribution in the radial direction, thereby affecting the heat transfer process in the radial direction inside the packed bed. In order to obtain porosity in the radial direction, we intercept some cylindrical surfaces above the cylinder in the radial direction and divide these cylindrical surfaces with the cylindrical area under the same diameter to obtain the porosity distribution in the radial direction.
ε V = V v o i d V
ε A = A v o i d A
In Figure 3 we compare the constructed packed bed with the experimental results of Mueller [26] and the fitting formula proposed by Mueller [41]. The fitting formula proposed by Mueller is expressed as Equations (15)–(19). The results show that the radial porosity of the constructed tube size particle size ratio of 4 shows an oscillation distribution and is more accurate. This verifies that the model is valid.
ε ( r ) = ε b + ( 1 ε b ) e b r * J 0 ( a r * )
where,
r * = r d [ 1.3 r d + ( 1.6 + 2.6 D / d ) 1 ] 1   if   r d 1 3 [ 1 ( 1.6 + 2.6 D / d ) 1 ] ,   else   r * = r d
a = 7.45 3.15 D / d
b = 0.315 0.735 D / d
ε b = ε + 0.225 D / d ,   ε = 0.369

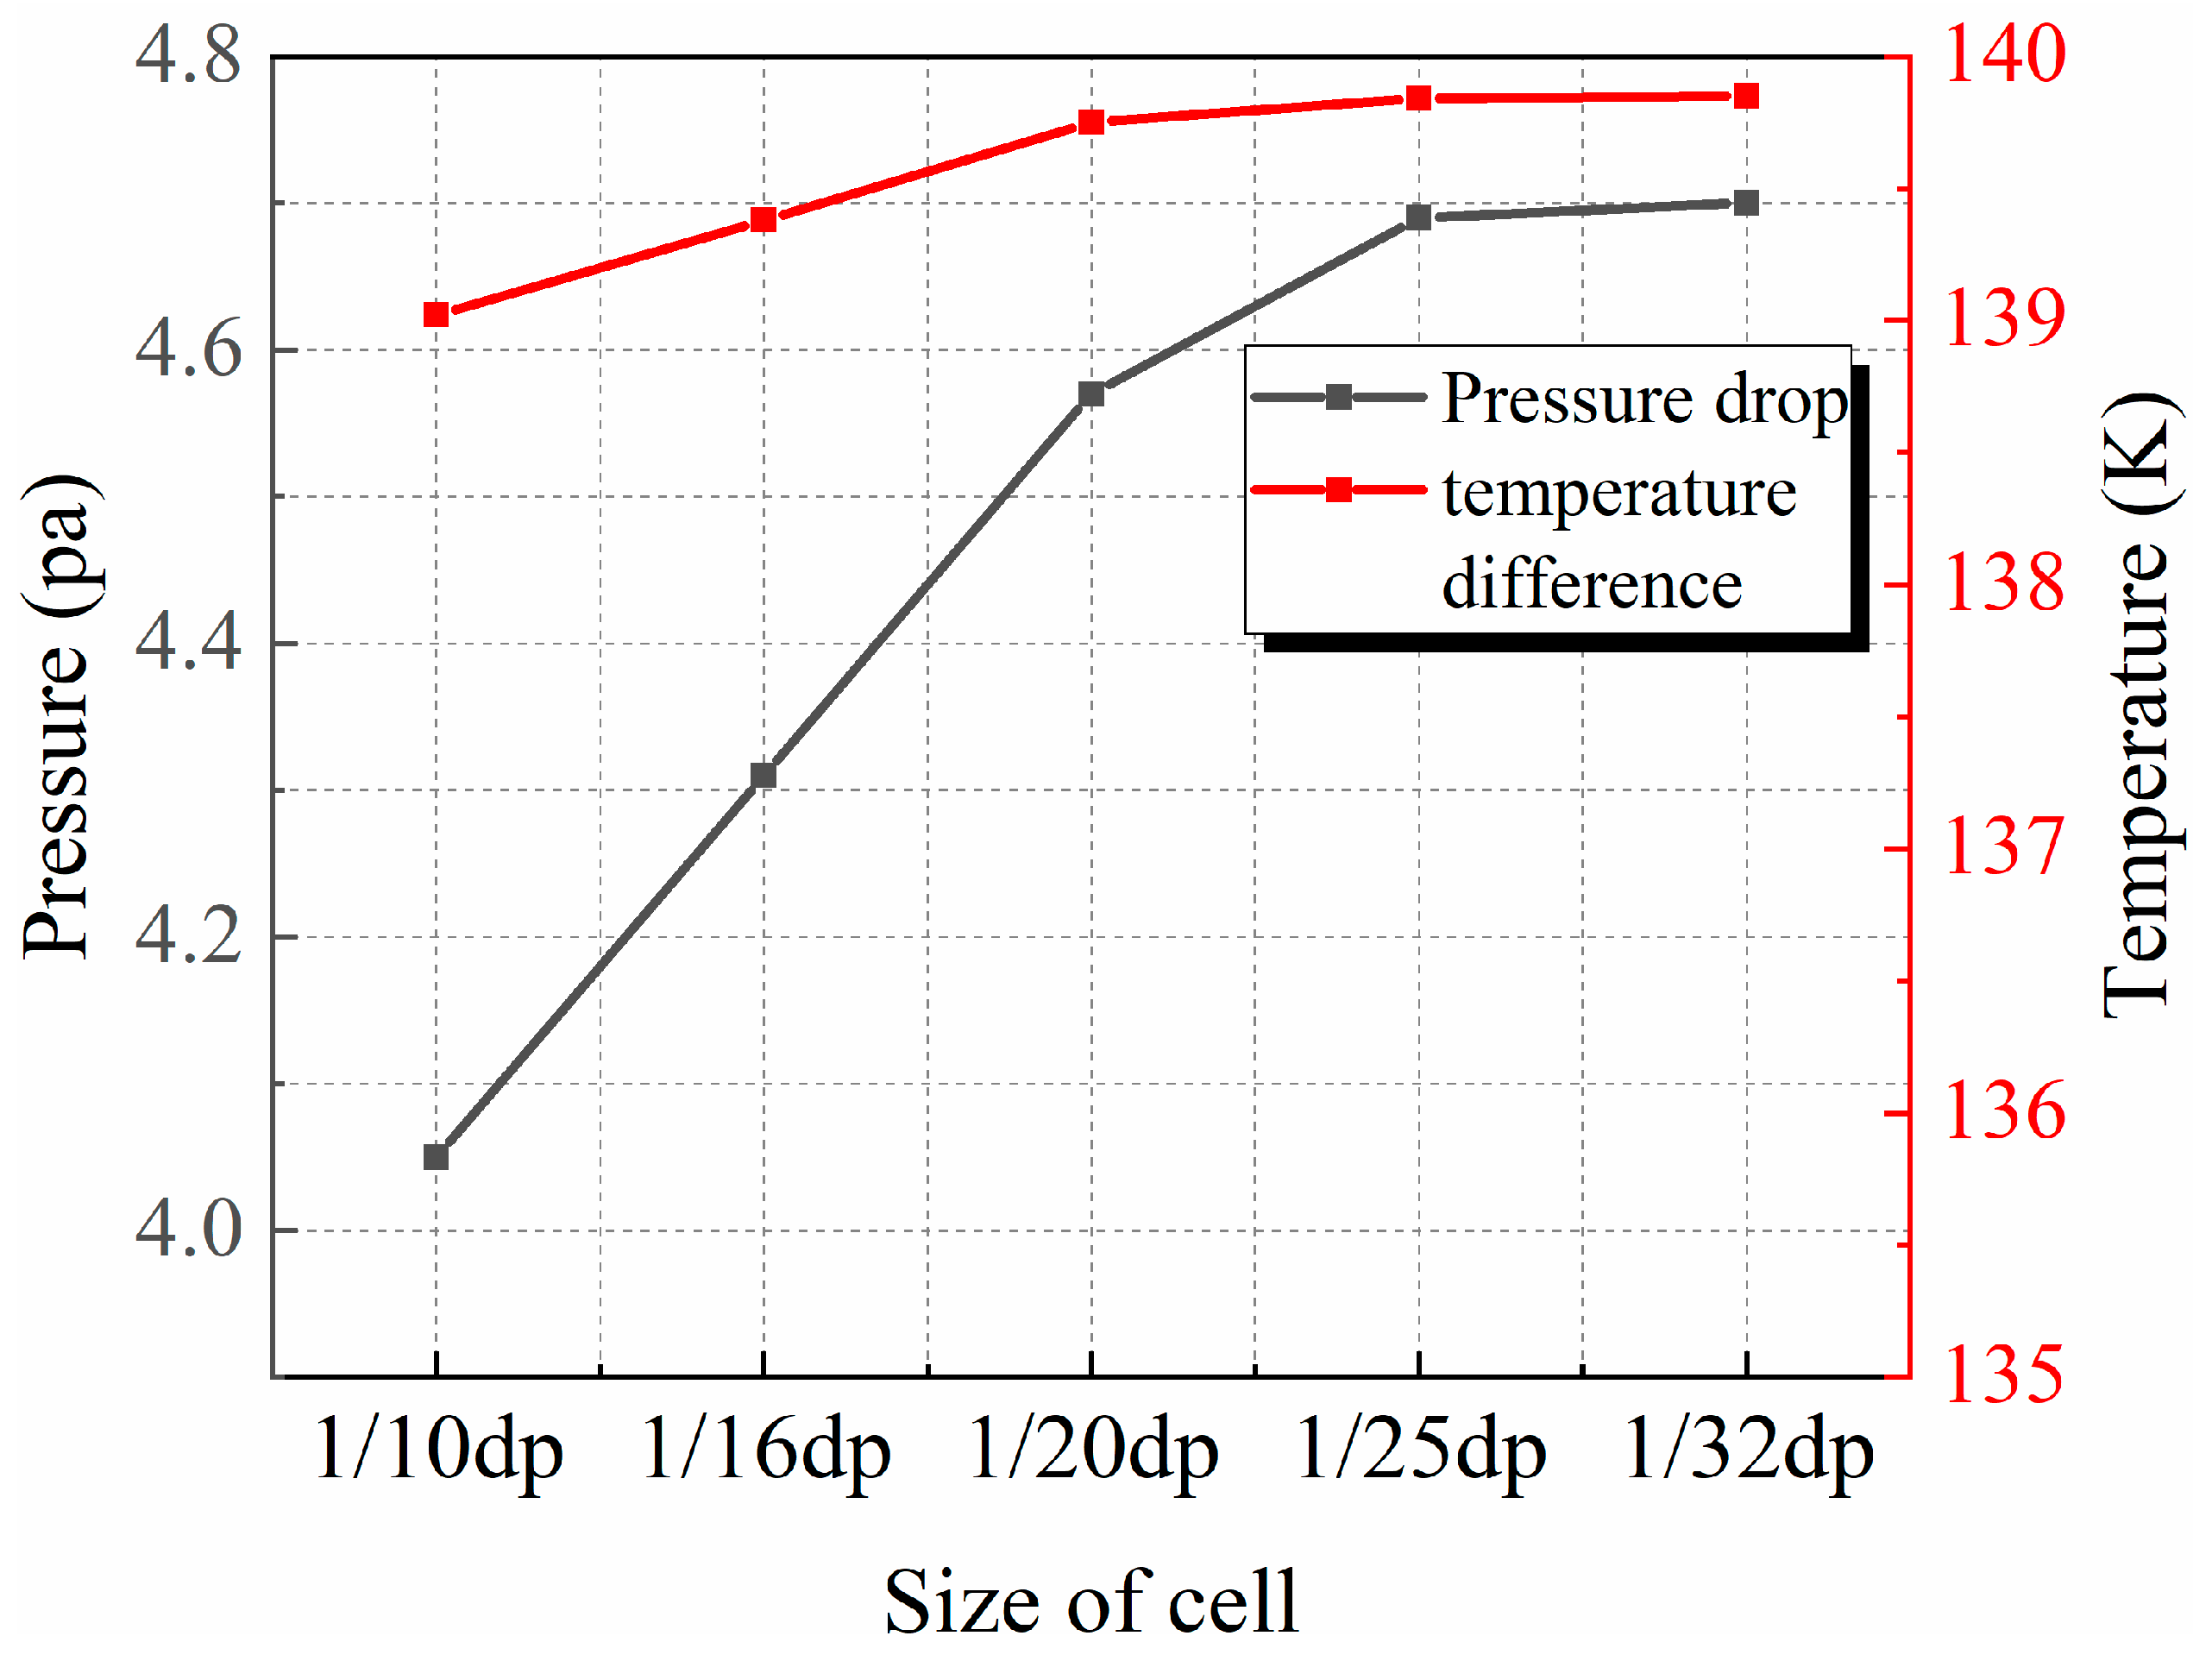
2.5. Grid Independence Validation

To ensure the accuracy of the simulation, a grid independence study was conducted under the conditions of an inlet temperature of T = 150 K and an inlet velocity of Ui = 0.4 m/s for the packed bed. Five different mesh sizes were selected to discretize the flow region of the packed bed, and the pressure drops at the inlet and outlet of the packed bed were calculated for each mesh size. As shown in Figure 4, the inlet and outlet pressure drops no longer change when the grid size is 1/25 dp. Therefore, a grid size of 1/25 dp is selected.

2.6. Data Processing

The calculation formulas for the pore Reynolds number, surface heat transfer coefficient, and Nusselt number are as follows [27,42]:
R e m = ρ u d μ = ρ μ u ε d ε V ( 1 ε V ) = ρ u d μ ( 1 ε V )
Δ P L = f k ρ ( 1 ε V ) ε V 3 u 2 d
h = Q A Δ T = m ( h e n , o u t h e n , i n ) A ( T p a r t i c l e T F l u i d )
N u m = h d λ = h d ε V λ ( 1 ε V )

2.7. Boundary Conditions

The current simulation involves hydrogen with inlet temperatures of 100 K, 150 K, and 200 K and inlet velocities of 0.3 m/s, 0.4 m/s, 0.5 m/s, and 0.6 m/s, respectively. The particle surface maintains a constant temperature of 290 K and is composed of alumina. The tube wall is defined as adiabatic.
The boundary conditions of the model equations are as follows:
z = z in ,   u = v = 0 ,   w = w 0
z = z out ,   u z = v z = 0
t s = 290   K , d t d r | r = R = 0
t f | z = 0 = 100   K ,   150   K ,   200   K u f | z = 0   =   0.3   m / s ,   0.4   m / s ,   0.5   m / s ,   0.6   m / s

3. Results and Discussion

3.1. Velocity and Temperature Contour of Packed Bed

This section will discuss the local fluid velocity and temperature distribution in the packed bed. A typical longitudinal section is selected and shown in Figure 5. The fluid velocity in the z-direction and the temperature distribution in this section are shown in Figure 6. The figure presents simulation contour lines for two different inlet velocities (ui = 0.3 m/s and 0.6 m/s). Fluid with higher velocity is more likely to occur where the void space has a larger axial dimension. Due to the special structure of the packed bed, in the center of the packed bed, a channel formed. This channel has high porosity. High-temperature and high-velocity fluid appears in the center area of the packed bed. The fluid velocity distribution is determined by local interactions between the fluid flow and packing structure. Fluid with a low velocity is present behind the particles, resulting in higher fluid temperatures compared to other areas. This phenomenon is the same as that observed in Guo’s [43] study. This phenomenon is more pronounced at lower inlet velocities. Both inlet velocities heat the fluid to the particle temperature eventually.

3.2. Radial-Averaged Distribution of Fluid Flow

To show the porosity distribution in the packed bed as well as the temperature and velocity variation of the hydrogen flow at different radial positions, the packed bed is cut into 80 hollow cylinder slices (80 hollow cylinders from (R-r)/d = 0 to (R-r)/d = 2 with regular intervals). We then determined the area, average temperature, and average velocity of each slice. The radial-averaged porosity distribution was determined by dividing the area of the hollow cylindrical slices by the area of the cylinder corresponding to the same radius.
The radial-averaged porosity and radial-averaged velocity of the packed bed show a regular oscillation distribution, as seen in Figure 7. The figure shows the simulated result at four different inlet velocities (ui = 0.3 m/s, 0.4 m/s, 0.5 m/s, and 0.6 m/s). The inlet temperature is 100 K. From Figure 7, it can be seen that the radial-averaged velocity profile shows a roughly proportional relationship with the radial-averaged porosity of the packed bed—faster velocity is present where the pores are smaller, and vice versa. Due to the wall viscosity, although the porosity is close to 1, the velocity is lower near the wall. Fluid with faster velocity appears in the central area of the packed bed. For the same porosity, the fluid’s velocity and temperature profiles are significantly influenced by its proximity to the wall. Closer to the wall, the fluid experiences higher resistance due to increased interaction with the solid boundaries, which tends to slow down the fluid flow and affect the heat transfer characteristics. The temperature distributions at four different inlet velocities show parallel oscillation distributions.
Considering the results of Liu’s [28] work, the velocity also decreases in the position near the wall and the velocity oscillates in the center, which reflects the consistency of our research results.
By comparing the radial velocity distribution curves under four different inlet velocities, it is observed that these temperature distribution curves exhibit a parallel arrangement. This observation underscores that the influence of the inlet velocity on the radial-averaged temperature distribution is primarily manifested in the absolute values of temperature, while the trend is predominantly dictated by the distribution of radial-averaged porosity.
The radial direction temperature is shown in Figure 8. The figure shows the simulated result at four different inlet velocities (ui = 0.3 m/s, 0.4 m/s, 0.5 m/s, and 0.6 m/s). The inlet temperature is 100 K. The radial-averaged temperature is lower in the area of large radial-averaged porosity. The radial-averaged temperature profile shows a roughly inverse proportional relationship with the radial-averaged porosity of the packed bed. When the velocity of fluid flow increases, the heat transfer between the fluid and the particles is insufficient, and the radial-averaged temperature increase in hydrogen is smaller. It shows that the radial-averaged porosity distribution affects the radial-averaged velocity, and the radial-averaged velocity affects the radial-averaged temperature. The temperature distributions at four different inlet velocities show parallel oscillation distributions.
The flow at the inlet of the packed bed is more complicated. The local fluid temperature distribution is now presented for further analysis. The two local temperature distributions in the packed bed are shown in Figure 8b (Z = 10 mm) and Figure 8c (Z = 20 mm). The local temperature curve is consistent with the radial-averaged temperature trend. Due to the proximity to the inlet, the temperature difference between the particles and the fluid is larger. This causes the temperature curve at z = 10 mm to vary greatly. As the flow develops, the particles continue the heat transfer process with the fluid. As shown in Figure 8c, Z = 20 mm has the same temperature trend as the radial-averaged temperature but the temperature curve is much flatter.

3.3. Axial-Averaged Distribution of Fluid Flow

In order to show the axial direction porosity distribution in packed beds and the fluid temperature and velocity variations at different axial positions, the packed bed is cut into 56 circle slices (from Z = 0 mm to Z = 110 mm with regular intervals). We determined the area, average temperature, and average velocity of each slice. The axial-averaged porosity distribution is obtained by dividing the area of slices by the area of the circle at the same radius.
The fluid at an inlet temperature of 100 K was chosen to simulate different inlet velocities. We then determined the temperature and velocity of each of the slices. The axial direction velocity and porosity distribution are presented in Figure 9. The axial direction axial-averaged temperature is presented in Figure 10. The axial-averaged velocity profile shows a roughly inverse proportional relationship with the axial-averaged porosity of the packed bed. In the axial direction, the region that has small pores has a slower velocity. This is different from the radial direction because the flux of the working fluid in the axial direction is constant. The axial-averaged velocity is faster when the axial-averaged porosity is larger. In general, in the radial direction, higher porosity in a medium implies a greater void space for fluid flow, which reduces the flow resistance. This reduction in resistance allows the fluid to move more freely through the medium, resulting in higher velocities. Conversely, a lower porosity indicates tighter packing of the solid particles, increasing the resistance for fluid flow and thus reducing the velocity of the fluid moving through the medium. However, in the axial direction, since the axial flow is constant, the velocity is slower where the porosity is higher.
The temperature of hydrogen continues to increase in the axial direction and reaches the particle temperature at Z = 70 mm. It is worth noting that the axial-averaged porosity distribution increases at Z = 10 mm (dp). The maxima of the fluid velocity profile occur at approximately the integer numbers of the particle diameter. This is the first layer of the particles. The oscillation of the porosity tends to be flat after Z = 10 mm. Furthermore, there is a temperature drop at Z = 10 mm because at Z = 10 mm, the porosity has increased. The velocity decrease causes the temperature to drop.

3.4. Friction Factor in Packed Bed

Figure 11 shows the characteristics of the friction factor in a packed bed according to different inlet temperatures. When the inlet temperature is 100 K, 150 K, and 200 K, the inlet velocity is 0.3 m/s to 0.6 m/s, according to Equation (20), and the Reynolds number is between 100 and 700. We then used Equations (20)–(23) to calculate the friction factor. Since the physical properties of hydrogen vary greatly with temperature, two different simulation results are presented in Figure 11. Figure 11a shows the friction factor curve of hydrogen with a constant property. The property of hydrogen does not change with temperature. Figure 11b shows the friction factor curve of hydrogen’s physical properties that change with temperature. It can be seen from the figure that the decreasing trend of the friction factor decreases with the increase in temperature. When the inlet temperature decreases, the curve of the friction factor with the Reynolds number becomes flat.
Since hydrogen’s physical properties vary with temperature, the friction factors at different inlet temperatures are shown as three different lines. When the inlet temperature is set at 100 K, accounting for the variations in physical properties with temperature, the friction factor increases by 38.5%. At an inlet temperature of 150 K, with the same considerations, the friction factor increases by 24.9%. When the inlet temperature reaches 200 K, the increase in the friction factor is observed to be 6.7%, under the influence of temperature-dependent changes in physical properties. From these observations, it can be inferred that the impact of physical properties on the friction factor is more pronounced at lower temperatures. Therefore, the changes in the physical properties of hydrogen with temperature will influence the simulation.

3.5. Nusselt Number in Packed Bed

Figure 12 shows the characteristics of the Nusselt number in a packed bed according to different inlet temperatures. Using Equations (20)–(23), we calculated the Nusselt numbers. Three different inlet temperatures were selected for the simulation. Figure 12a shows the Nusselt number curve of hydrogen with constant physical properties. The properties of hydrogen do not change with temperature. A comparison between two empirical correlations and the simulation result is shown in Table 2. The Nusselt numbers at different inlet temperatures roughly form the same line. This result is similar to Chen and Mueller’s empirical correlation [43]. The error is within 2%. Figure 12b shows the Nusselt number curve of hydrogen’s physical properties that change with temperature. The Nusselt number and Reynolds number relation curves at three different inlet temperatures are three different lines. The increasing trend becomes flat with an increase in the inlet temperature.
When the inlet temperature is set at 100 K, taking into account the variations in physical properties with temperature, the Nusselt number increases by 31.3%. At an inlet temperature of 150 K, with similar considerations, the Nusselt number increases by 21.4%. When the inlet temperature is increased to 200 K, the rise in the Nusselt number is noted to be 13.2%, reflecting the influence of temperature-dependent changes in physical properties. From these observations, it can be deduced that the impact of physical properties on the Nusselt number becomes more significant at lower temperatures.

4. Conclusions

In this paper, a three-dimensional computational fluid dynamics model of a packed bed is established, and the heat transfer characteristics of hydrogen flowing through the packed bed under low-temperature conditions are obtained through simulation; the main conclusions are as follows:
(1)
Cryogenic hydrogen flows through the packed bed with the heat transfer between the particles and hydrogen. The temperature and velocity distribution are related to the inlet temperature, inlet velocity, and porosity distribution. In the radial direction, the radial-averaged velocity is proportional to the radial-averaged porosity. Although the porosity at the wall is close to 1, the flow velocity is slow due to wall viscosity. The radial-averaged velocity is slow in the region with a small pore area. The radial-averaged velocity affects the radial-averaged temperature field distribution. When the velocity is high, the heat transfer time between the hydrogen and particles is insufficient, and it causes a reduction in the radial-averaged temperature.
(2)
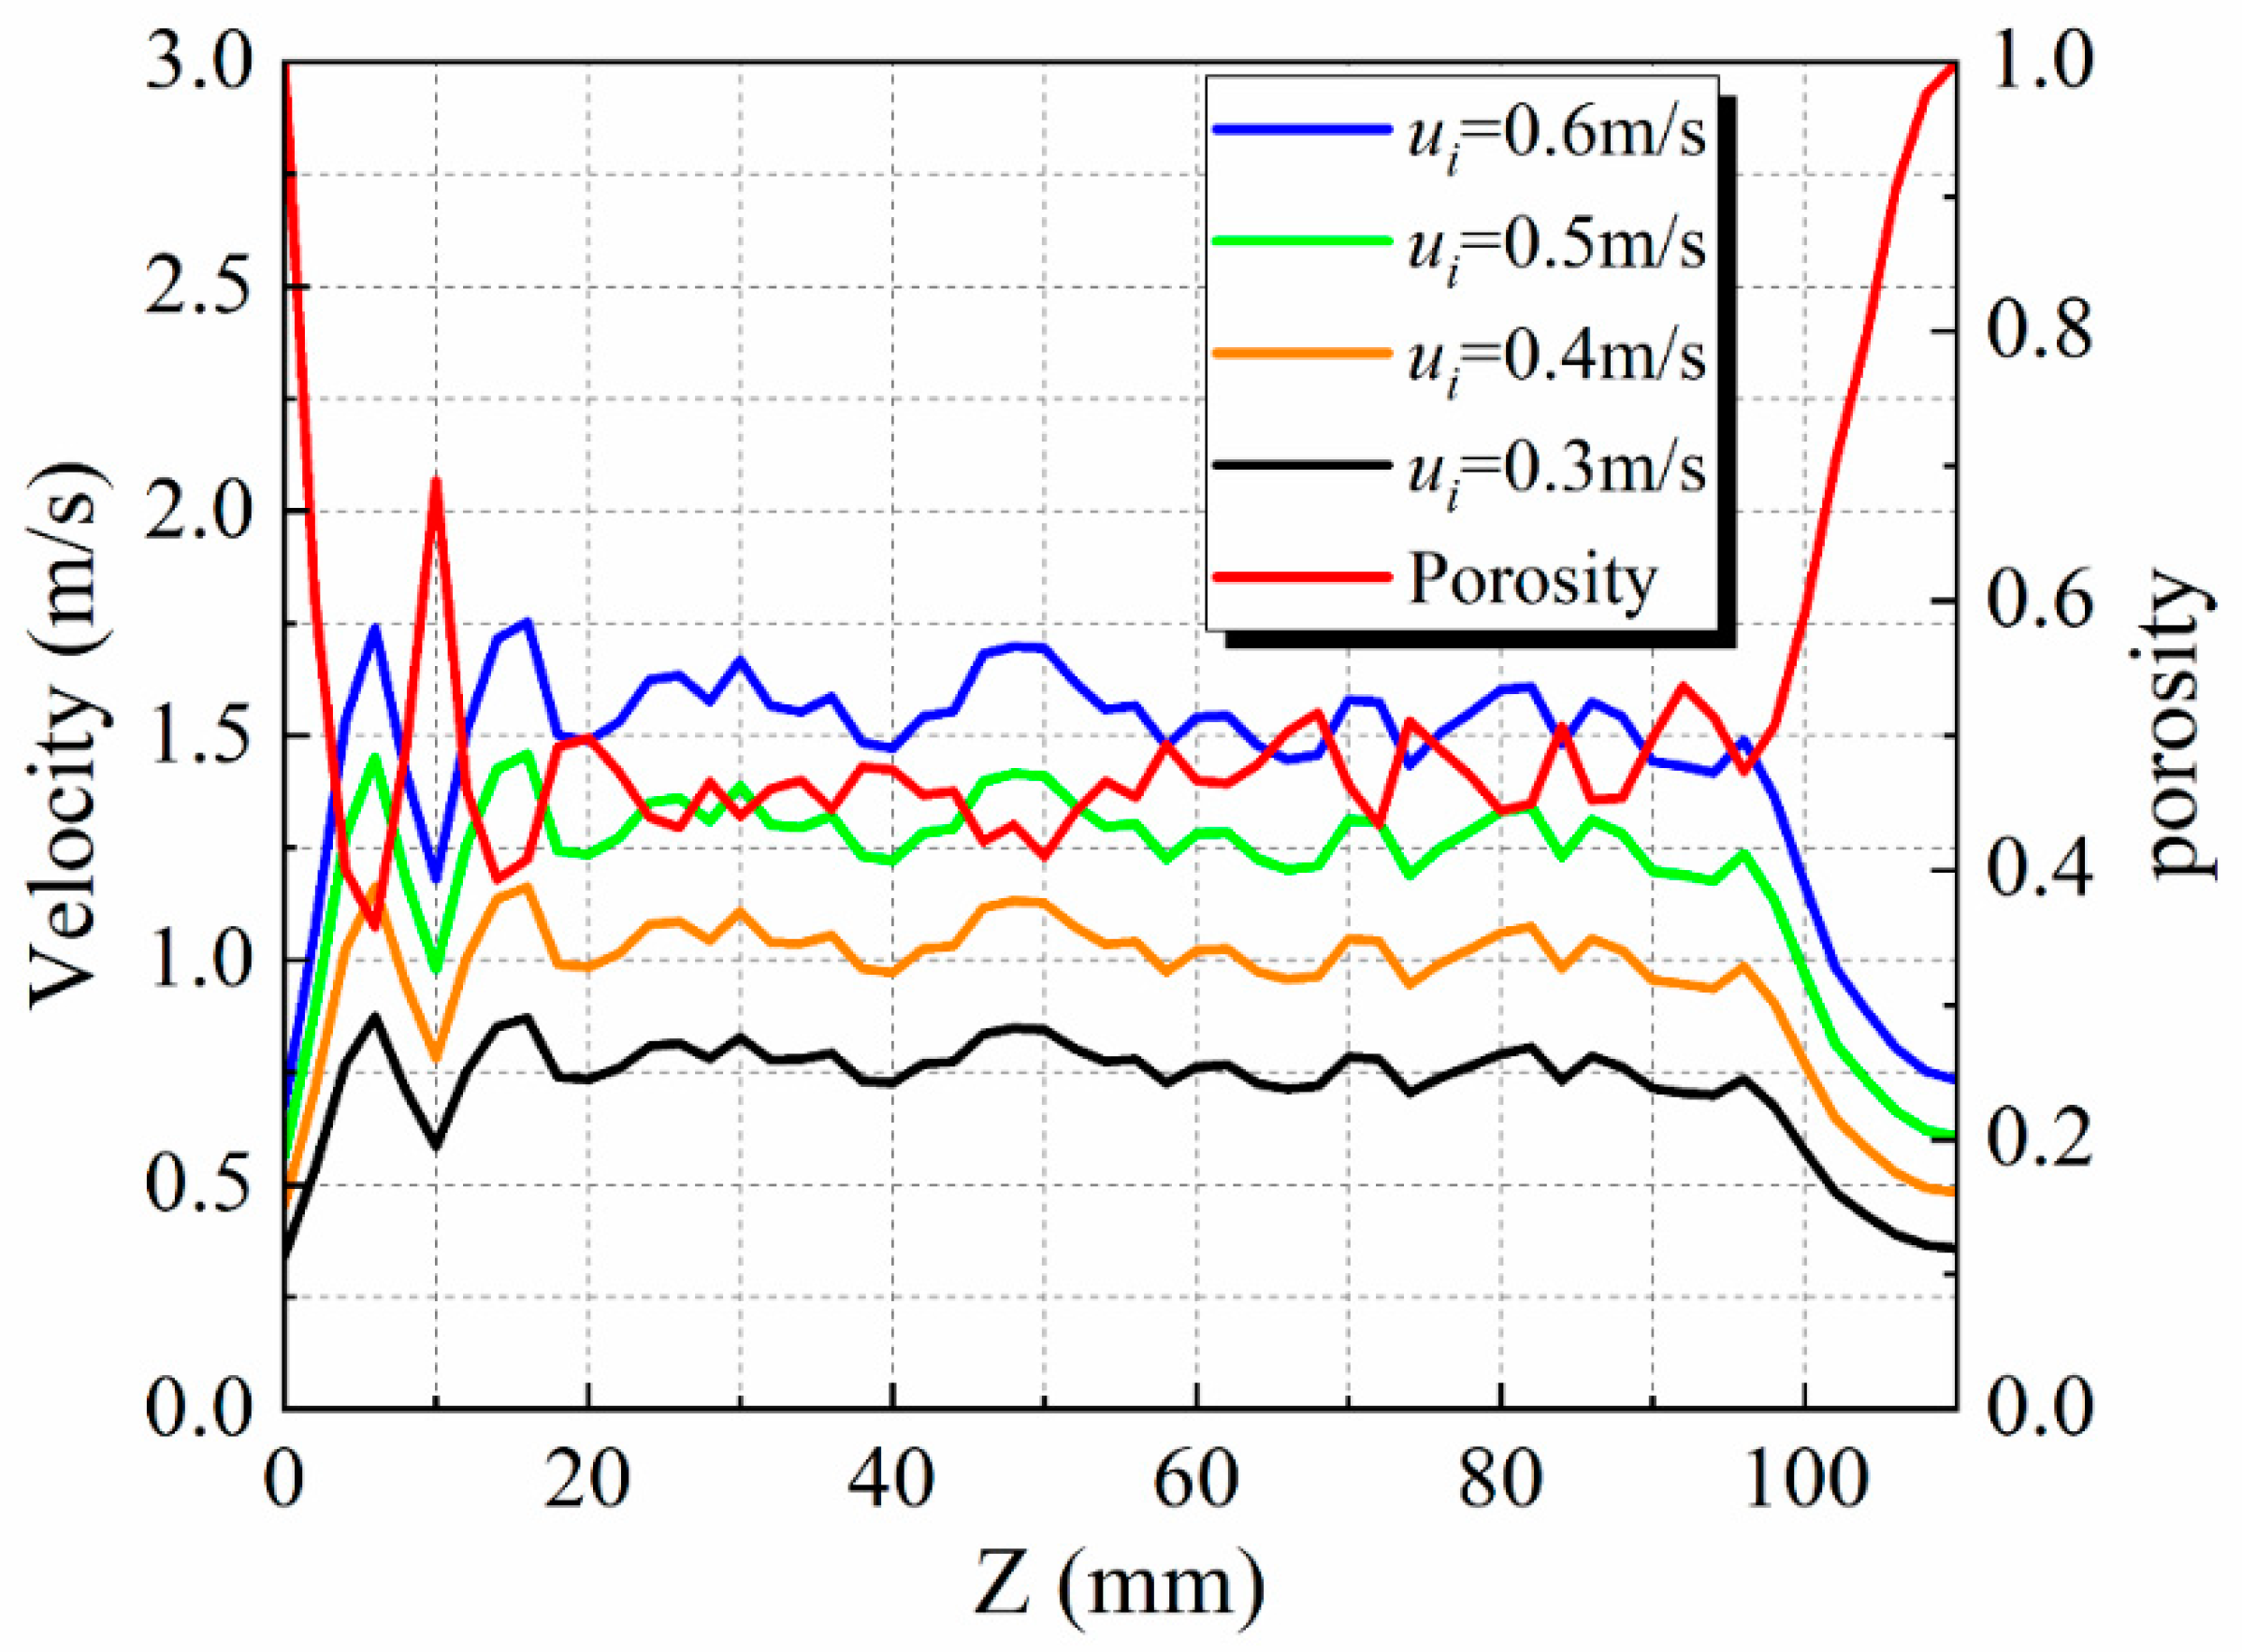
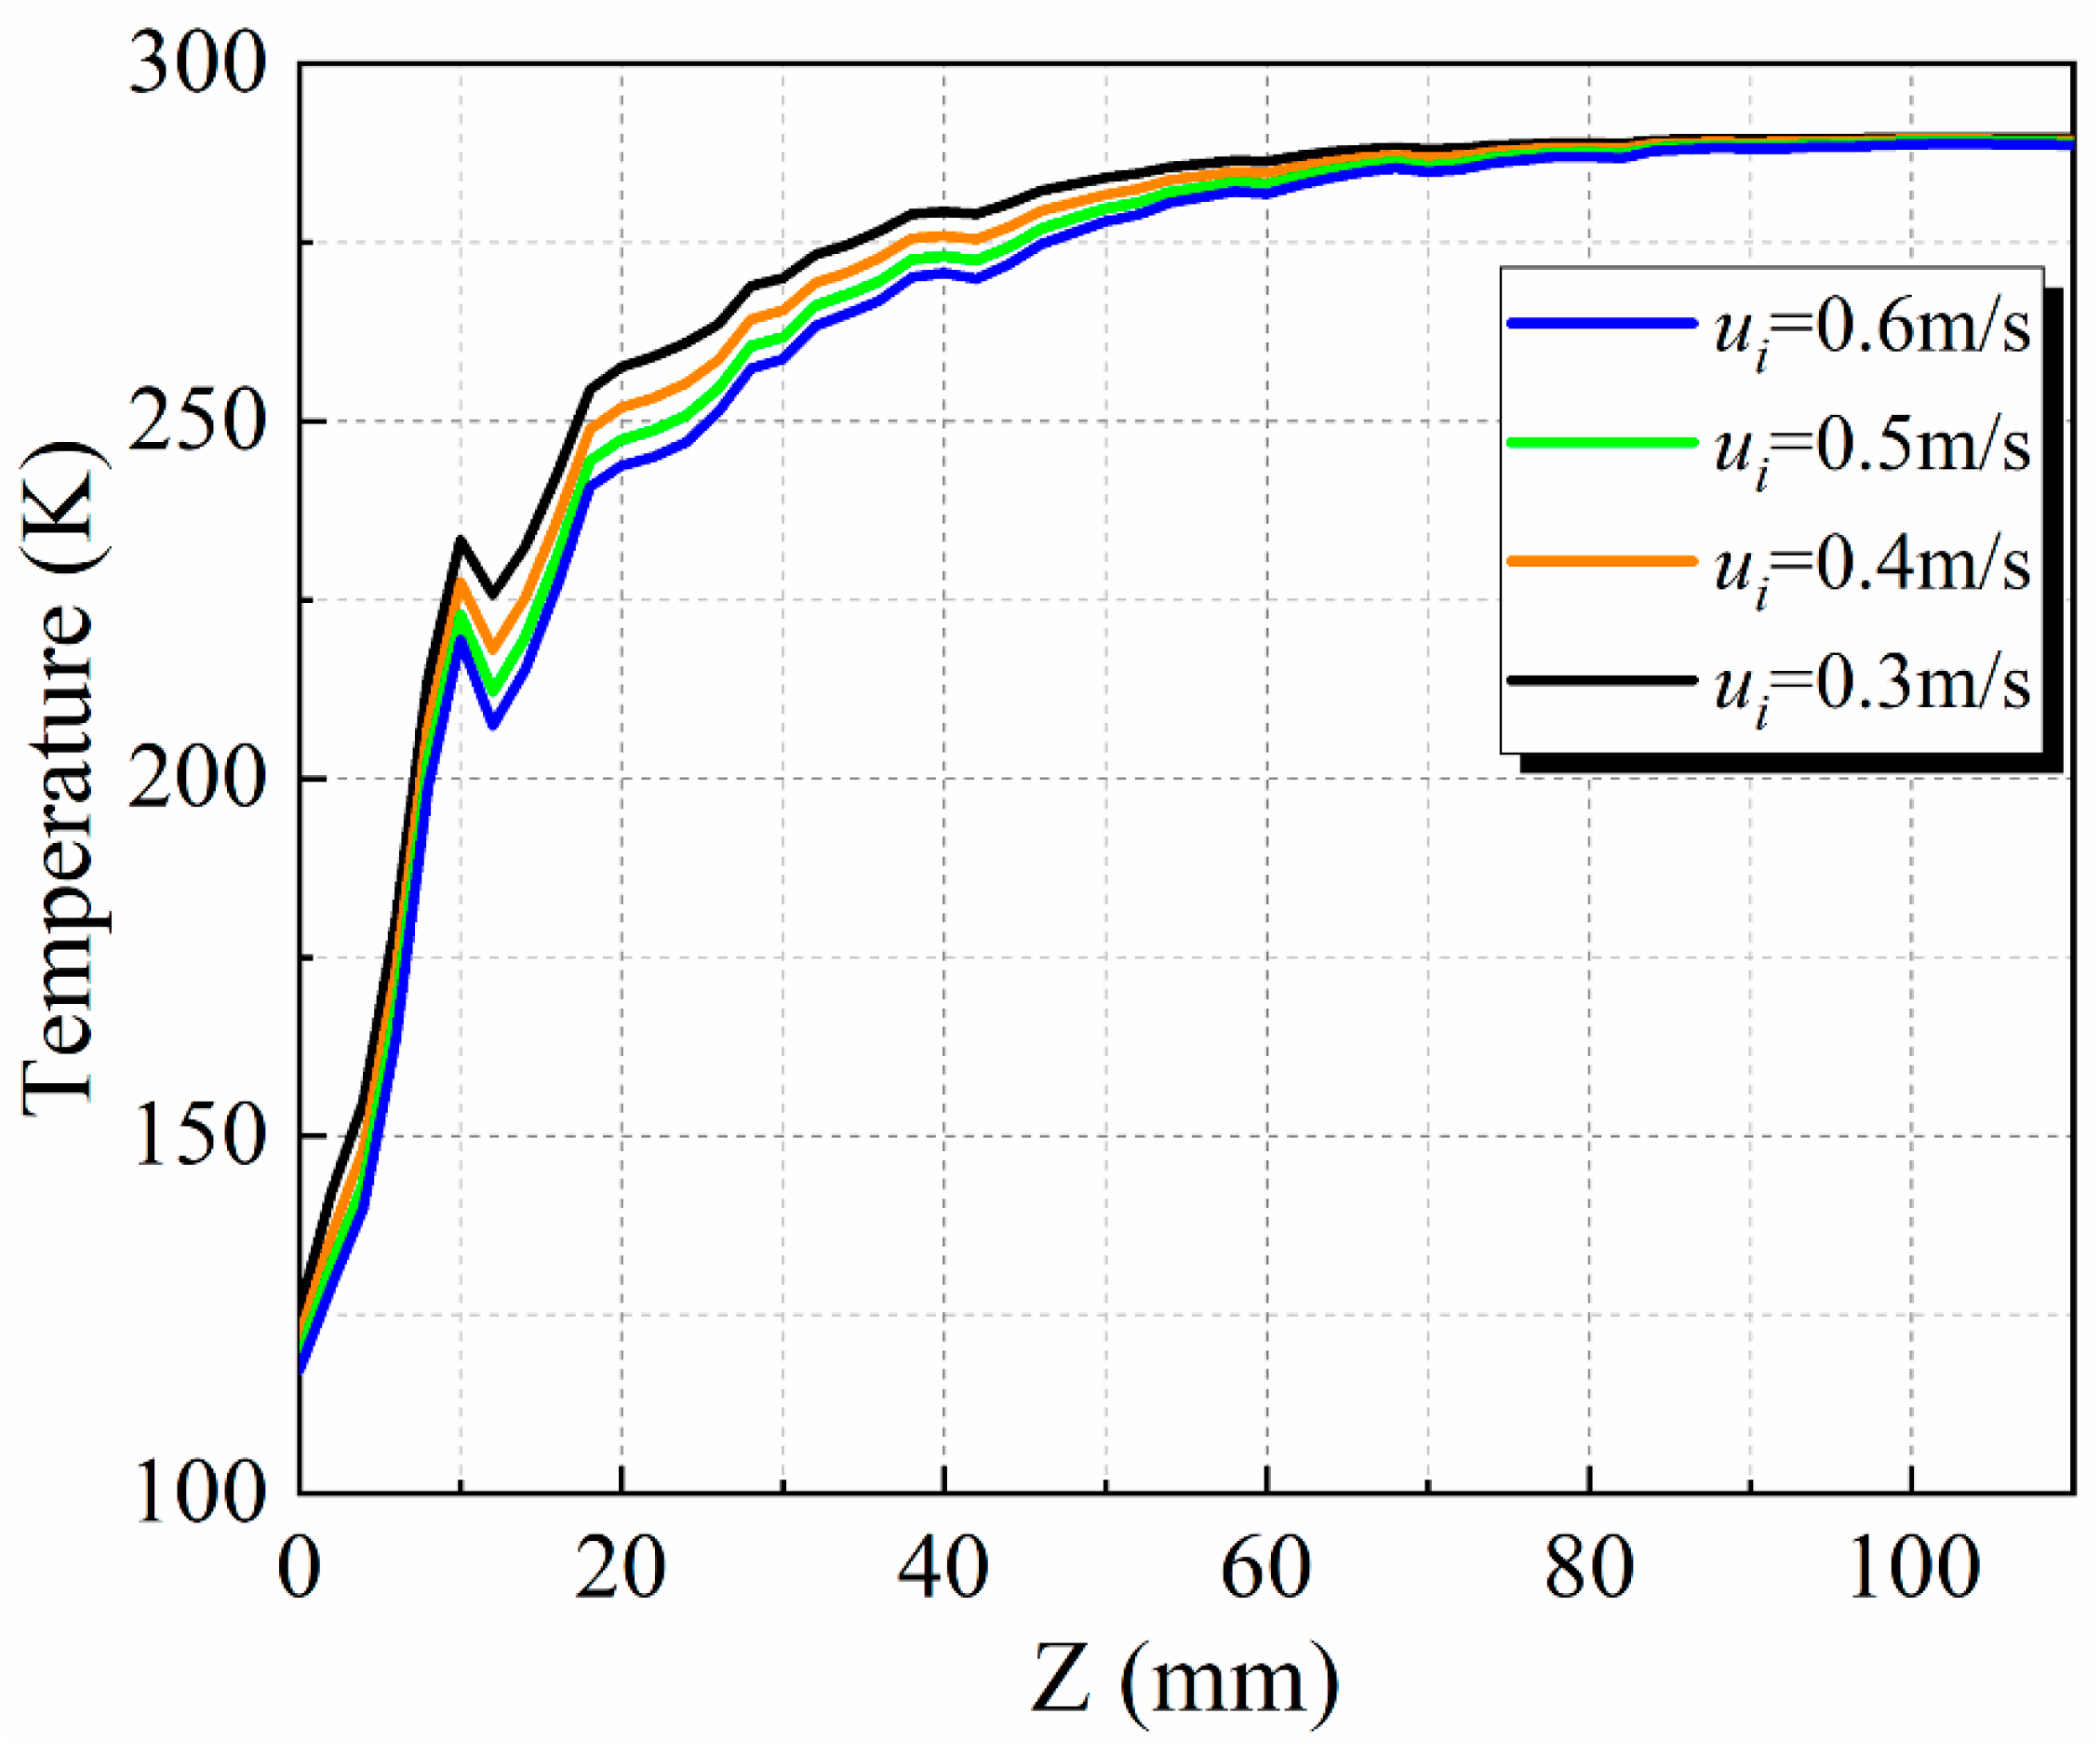
In the axial direction, the axial-averaged velocity is inversely proportional to the radial-averaged porosity in the packed bed. This is because the total flow of the fluid in the axial direction is constant. Larger pores have bigger fluid flow areas, so the velocity is slower. This is different from the radial direction. The temperature of hydrogen continues to increase in the axial direction and reaches the particle temperature at Z = 70 mm. The radial-averaged porosity shows a drop at Z = 10 mm. This occurs between the first layer (dp) and the second layer of the particle (2 dp). This drop causes the local decrease in temperature in the axial direction.
(3)
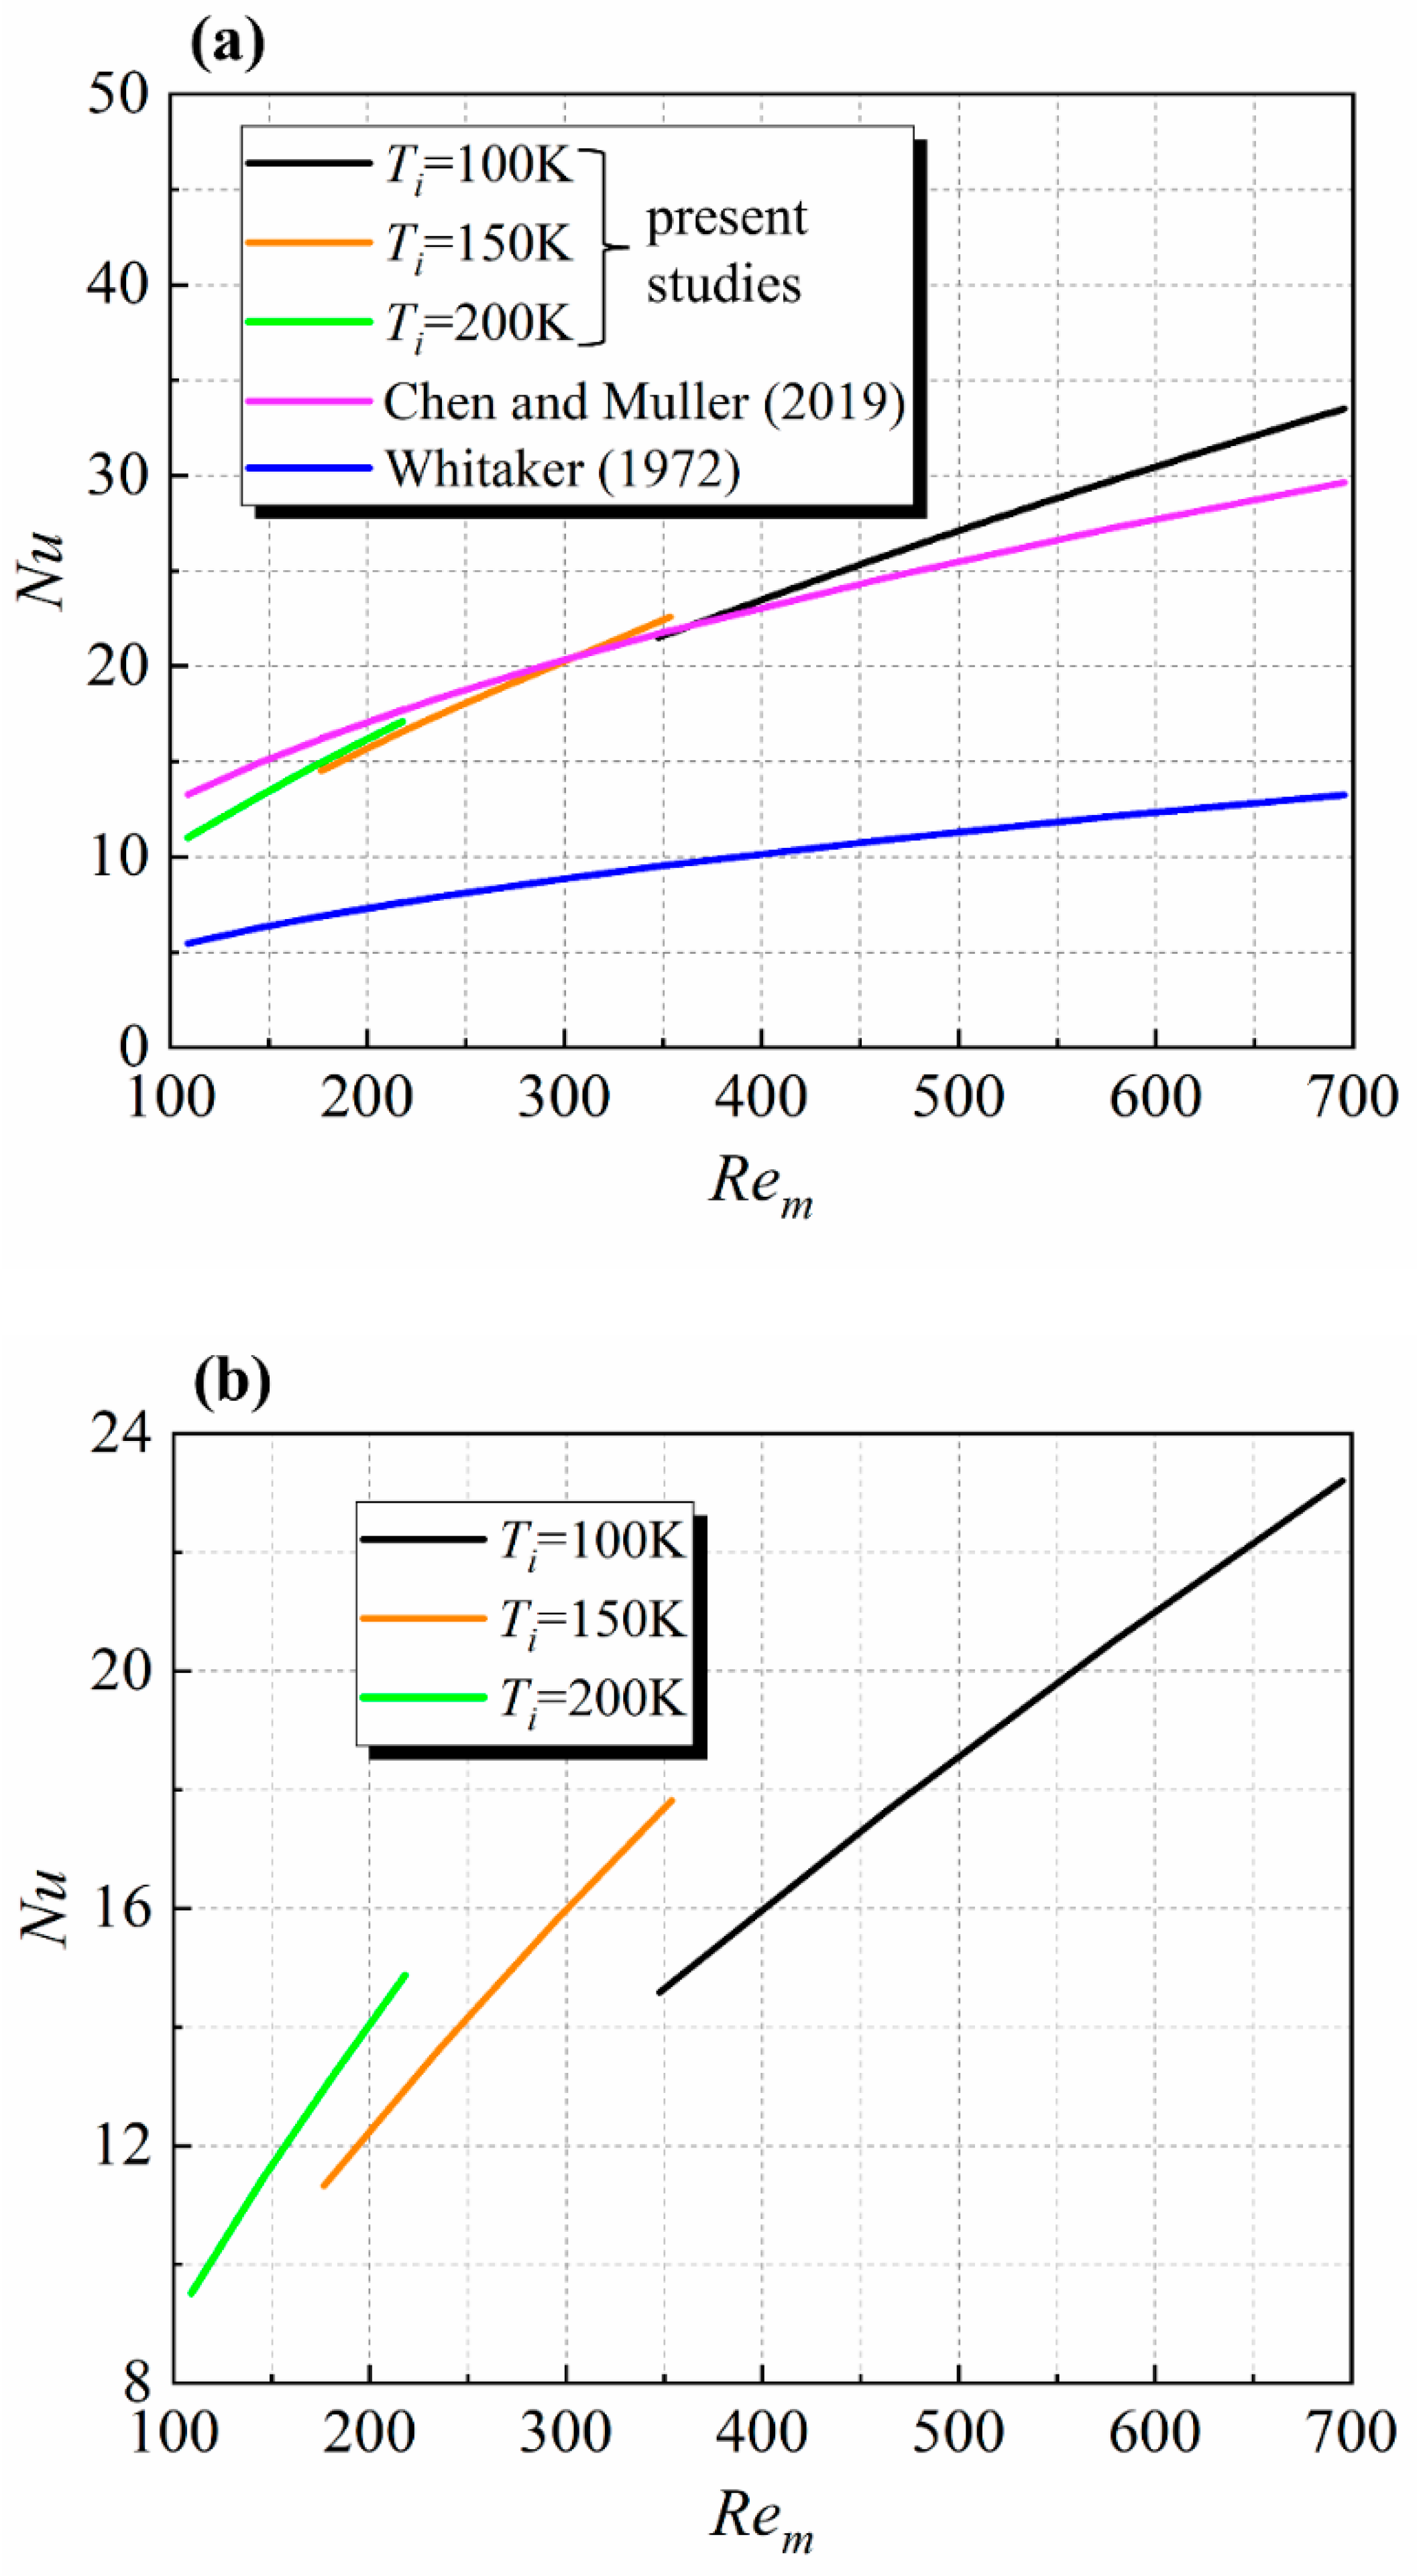
The physical properties of hydrogen, which vary with temperature, significantly affect its heat transfer and flow within a packed bed. In scenarios where hydrogen’s physical properties do not change with temperature, the curves representing the friction coefficient and Nusselt number at different inlet temperatures are determined solely by the Reynolds number. However, when the variation in hydrogen’s physical properties with temperature is taken into account, the friction coefficient and Nusselt number within the packed bed at different inlet temperatures are represented by three separate lines, each indicating values greater than those in the scenario where the physical properties remain constant. Thus, it is imperative to consider the temperature-dependent changes in hydrogen’s physical properties during simulation processes.
(4)
Variations in the inlet temperature and velocity significantly influence the friction coefficient and Nusselt number within a packed bed. The friction coefficient decreases as the velocity increases. A greater temperature difference between the particles and hydrogen correlates with a lower friction coefficient, concurrently leading to a more flattened curve of the friction coefficient. Conversely, the Nusselt number increases with an increase in inlet velocity. A larger temperature differential between the particles and hydrogen also results in a higher Nusselt number, manifesting in a flatter trend for the Nusselt number curve.

Author Contributions

X.Q.: conceptualization, validation, investigation, writing—original draft, preparation. Y.X.: supervision, conceptualization, analysis, funding acquisition, project administration, writing—review and editing. Q.Z.: visualization, analysis. All authors have read and agreed to the published version of the manuscript.

Funding

This study was supported by the Key Project of Anhui Provincial University Research and Development (CN) (Grant No. 2023AH050188) and the University Synergy Innovation Program of Anhui Province (Grant No. GXXT-2022-017).

Data Availability Statement

Data will be made available upon request.

Conflicts of Interest

The authors declare that they have no known competing financial interests or personal relationships that could have appeared to influence the work reported in this paper.

Nomenclature

Aareaεmean porosity of packed bed
Cspecific heat [J/(kg∙K)]λthermal conductivity of fluid [W/(m∙K)]
DPacked bed diameter [mm]μkinematic viscosity coefficient [Pa∙s]
dParticle diameter [mm]ρDensity (kg/m3)
fkFriction factorAbbreviations
hHeat transfer coefficient [W/m2∙K]CESCryogenic energy storage
hen, outFluid enthalpy at outlet [kJ/kg]CFDComputational Fluid Dynamics
hen, inFluid enthalpy at inlet [kJ/kg]DEMDiscrete Element Method
Lheight of packing [mm]HTFHeat transfer fluid
NNumber of inserted porous blocksLTELocal thermal equilibrium
NuNusselt numberLTNELocal thermal non-equilibrium
PrPrandtl numberREVRepresentative elementary volume
RRadius of packed bed Subscripts
rRadius of particlesffluid
ReReynolds number [ρud/μ]iinlet
Remmodified Reynolds number [ρud/μ(1-ε)]mmodified
TTemperature [K]pPore-scale
uVelocity [m/s]
Vvolume
Greek symbols
ΔPpressure drop of packed beds [Pa]
ΔTtemperature difference [K]

References

  1. Moradi, R.; Groth, K.M. Hydrogen storage and delivery: Review of the state of the art technologies and risk and reliability analysis. Int. J. Hydrogen Energy 2019, 44, 12254–12269. [Google Scholar] [CrossRef]
  2. Mohammed, A.A.; Sakr, R.Y. Numerical study of encapsulated nanoparticles enhanced phase change material in thermal energy cool storage packed bed system. J. Energy Storage 2023, 68, 107837. [Google Scholar]
  3. Chai, L.; Liu, J.; Wang, L.; Yue, L.; Yang, L.; Sheng, Y.; Chen, H.; Tan, C. Cryogenic energy storage characteristics of a packed bed at different pressures. Appl. Therm. Eng. 2014, 63, 439–446. [Google Scholar] [CrossRef]
  4. Tan, H.; Ding, Z.; Wen, N. Numerical study on the thermodynamic performance of a packed bed cryogenic energy storage system. Appl. Therm. Eng. 2022, 214, 118903. [Google Scholar] [CrossRef]
  5. Gaviño, D.; Cortés, E.; García, J.; Calderón-Vásquez, I.; Cardemil, J.; Estay, D.; Barraza, R. A discrete element approach to model packed bed thermal storage. Appl. Energy 2022, 325, 119821. [Google Scholar] [CrossRef]
  6. Li, J.; Mason, D.J. A computational investigation of transient heat transfer in pneumatic transport of granular particles. Powder Technol. 2000, 112, 273–282. [Google Scholar] [CrossRef]
  7. Zhao, Q.; Mao, B.; Zhao, J.; Li, H.; Wei, S.; Bai, X.; Zhang, X.; Zhang, Y. Experimental study on the forced convection heat transfer characteristics of airflow with variable thermophysical parameters in a circular tube. Case Stud. Therm. Eng. 2022, 40, 102495. [Google Scholar] [CrossRef]
  8. Chen, L.; Wang, C.; Moscardini, M.; Kamlah, M.; Liu, S. A DEM-based heat transfer model for the evaluation of effective thermal conductivity of packed beds filled with stagnant fluid: Thermal contact theory and numerical simulation. Int. J. Heat Mass Transf. 2019, 132, 331–346. [Google Scholar] [CrossRef]
  9. Govender, N.; Cleary, P.W.; Kiani-Oshtorjani, M.; Wilke, D.N.; Wu, C.Y.; Kureck, H. The effect of particle shape on the packed bed effective thermal conductivity based on DEM with polyhedral particles on the GPU. Chem. Eng. Sci. 2020, 219, 115584. [Google Scholar] [CrossRef]
  10. Ookawara, S.; Kuroki, M.; Street, D.; Ogawa, K. High-fidelity DEM-CFD modeling of packed bed reactors for process intensification. In Proceedings of the European Congress of Chemical Engineering (ECCE-6), Copenhagen, Denmark, 16–20 September 2007; pp. 16–20. [Google Scholar]
  11. Tsuji, Y.; Kawaguchi, T.; Tanaka, T. Discrete particle simulation of two-dimensional fluidized bed. Powder Technol. 1993, 77, 79–87. [Google Scholar] [CrossRef]
  12. Wang, S.; Luo, K.; Yang, S.; Hu, C.; Fan, J. Parallel LES-DEM simulation of dense flows in fluidized beds. Appl. Therm. Eng. 2017, 111, 1523–1535. [Google Scholar] [CrossRef]
  13. Wang, S.; Luo, K.; Hu, C.; Lin, J.; Fan, J. CFD-DEM simulation of heat transfer in fluidized beds: Model verification, validation, and application. Chem. Eng. Sci. 2019, 197, 280–295. [Google Scholar] [CrossRef]
  14. Wang, S.; Shen, Y. Particle-scale study of heat and mass transfer in a bubbling fluidised bed. Chem. Eng. Sci. 2021, 240, 116655. [Google Scholar] [CrossRef]
  15. Wang, S.; Luo, K.; Fan, J. CFD-DEM coupled with thermochemical sub-models for biomass gasification: Validation and sensitivity analysis. Chem. Eng. Sci. 2020, 217, 115550. [Google Scholar] [CrossRef]
  16. Yu, J.; Wang, S.; Kong, D.; Luo, K.; Fan, J. Coal-fueled chemical looping gasification: A CFD-DEM study. Fuel 2023, 345, 128119. [Google Scholar] [CrossRef]
  17. Bu, S.S.; Yang, J.; Zhou, M.; Li, S.Y.; Wang, Q.W.; Guo, Z.X. On contact point modifications for forced convective heat transfer analysis in a structured packed bed of spheres. Nucl. Eng. Des. 2014, 270, 21–33. [Google Scholar] [CrossRef]
  18. Yang, J.; Wang, J.; Bu, S.; Zeng, M.; Wang, Q.; Nakayama, A. Experimental analysis of forced convective heat transfer in novel structured packed beds of particles. Chem. Eng. Sci. 2012, 71, 126–137. [Google Scholar] [CrossRef]
  19. Alomar, O.R.; Abdulrazzaq, N.M.; Hamdoon, O.M.; Alwan, N.T. Local thermal equilibrium analysis of complete phase change process inside porous diffuser using NanoFluids. Appl. Therm. Eng. 2023, 231, 120911. [Google Scholar] [CrossRef]
  20. Mohammad, P.; Mohsen, T.; Ankur, J. Local thermal non-equilibrium (LTNE) model for developed flow in porous media with spatially-varying Biot number. Int. J. Heat Mass Transf. 2021, 164, 120538. [Google Scholar]
  21. Pati, S.; Borah, A.; Boruah, M.P.; Randive, P.R. Critical review on local thermal equilibrium and local thermal non-equilibrium approaches for the analysis of forced convective flow through porous media. Int. Commun. Heat Mass Transf. 2022, 132, 105889. [Google Scholar] [CrossRef]
  22. Cheng, L.C.; Wong, S.C. Pore-scale numerical simulation and LTNE analysis for fully-developed forced convective heat transfer in packed beds of mono-sized rough spheres covering near-wall and core regions. Int. J. Heat Mass Transf. 2023, 208, 124047. [Google Scholar] [CrossRef]
  23. Hooman, K.; Li, J.; Dahari, M. Thermal dispersion effects on forced convection in a porous-saturated pipe. Therm. Sci. Eng. Prog. 2017, 2, 64–70. [Google Scholar] [CrossRef]
  24. Hooman, K.; Ranjbar-Kani, A.A. A perturbation based analysis to investigate forced convection in a porous saturated tube. J. Comput. Appl. Math. 2004, 162, 411–419. [Google Scholar] [CrossRef]
  25. Mueller, G.E. Numerically packing spheres in cylinders. Powder Technol. 2005, 159, 105–110. [Google Scholar] [CrossRef]
  26. Mueller, G.E. Radial void fraction distributions in randomly packed fixed beds of uniformly sized spheres in cylindrical containers. Powder Technol. 1992, 72, 269–275. [Google Scholar] [CrossRef]
  27. Guo, Z.; Sun, Z.; Zhang, N.; Ding, M.; Zhou, Y. Influence of flow guiding conduit on pressure drop and convective heat transfer in packed beds. Int. J. Heat Mass Transf. 2019, 134, 489–502. [Google Scholar] [CrossRef]
  28. Liu, H.B.; Zhao, C.Y. Effect of Radial Porosity Oscillation on the Thermal Performance of Packed Bed Latent Heat Storage. Engineering 2021, 7, 515–525. [Google Scholar] [CrossRef]
  29. Fterich, M.; Chouikhi, H.; Sandoval-Torres, S.; Bentaher, H.; Elloumi, A.; Maalej, A. Numerical simulation and experimental characterization of the heat transfer in a PV/T air collector prototype. Case Stud. Therm. Eng. 2021, 27, 101209. [Google Scholar] [CrossRef]
  30. Hoorijani, H.; Esgandari, B.; Zarghami, R.; Sotudeh-Gharebagh, R.; Mostoufi, N. CFD-DEM simulation of heat transfer in spout-fluid beds. Chem. Eng. Res. Des. 2023, 200, 95–106. [Google Scholar] [CrossRef]
  31. Guardo, A.; Coussirat, M.; Larrayoz, M.; Recasens, F.; Egusquiza, E. Influence of the turbulence model in CFD modeling of wall-to-fluid heat transfer in packed beds. Chem. Eng. Sci. 2005, 60, 1733–1742. [Google Scholar] [CrossRef]
  32. Oschmann, T.; Schiemann, M.; Kruggel-Emden, H. Development and verification of a resolved 3D inner particle heat transfer model for the Discrete Element Method (DEM). Powder Technol. 2016, 291, 392–407. [Google Scholar] [CrossRef]
  33. Jin, L.; Lee, J.; Jeong, S. Investigation on heat transfer in line chill-down process with various cryogenic fluids. Int. J. Heat Mass Transf. 2020, 150, 119204. [Google Scholar] [CrossRef]
  34. Lin, X.; Wang, L.; Xie, N.; Li, G.; Chen, H. Thermodynamic analysis of the cascaded packed bed cryogenic storage based supercritical air energy storage system. Energy Procedia 2019, 158, 5079–5085. [Google Scholar] [CrossRef]
  35. Dixon, A.G.; Nijemeisland, M.; Stitt, E.H. Systematic mesh development for 3D CFD simulation of fixed beds: Contact points study. Comput. Chem. Eng. 2013, 48, 135–153. [Google Scholar] [CrossRef]
  36. Argyropoulos, C.D.; Markatos, N. Recent advances on the numerical modelling of turbulent flows. Appl. Math. Model. 2015, 39, 693–732. [Google Scholar] [CrossRef]
  37. Lemmon, E.W.; Bell, I.H.; Huber, M.L.; McLinden, M.O. NIST Standard Reference Database 23: Reference Fluid Thermodynamic and Transport Properties-REFPROP, Version 10.0; National Institute of Standards and Technology, Standard Reference Data Program: Gaithersburg, MD, USA, 2018.
  38. Calis, H.; Nijenhuis, J.; Paikert, B.; Dautzenberg, F.; Bleek, C.v.D. CFD modelling and experimental validation of pressure drop and flow profile in a novel structured catalytic reactor packing. Chem. Eng. Sci. 2001, 56, 1713–1720. [Google Scholar] [CrossRef]
  39. Eppinger, T.; Seidler, K.; Kraume, M. DEM-CFD simulations of fixed bed reactors with small tube to particle diameter ratios. Chem. Eng. J. 2011, 166, 324–331. [Google Scholar] [CrossRef]
  40. Guardo, A.; Coussirat, M.; Larrayoz, M.A.; Recasens, F.; Egusquiza, E. CFD flow and heat transfer in nonregular packings for fixed bed equipment design. Ind. Eng. Chem. Res. 2004, 43, 7049–7056. [Google Scholar] [CrossRef]
  41. Mueller, G.E. A modified packed bed radial porosity correlation. Powder Technol. 2019, 342, 607–612. [Google Scholar] [CrossRef]
  42. Guo, Z.; Sun, Z.; Zhang, N.; Ding, M. Influence of confining wall on pressure drop and particle-to-fluid heat transfer in packed beds with small D/d ratios under high Reynolds number. Chem. Eng. Sci. 2019, 209, 115200. [Google Scholar] [CrossRef]
  43. Chen, Y.; Müller, C.R. Lattice Boltzmann simulation of gas-solid heat transfer in random assemblies of spheres: The effect of solids volume fraction on the average Nusselt number for Re ≤ 100. Chem. Eng. J. 2019, 361, 1392–1399. [Google Scholar] [CrossRef]
  44. Whitaker, S. Forced convection heat transfer correlations for flow in pipes, past flat plates, single cylinders, single spheres, and for flow in packed beds and tube bundles. AIChE J. 1972, 18, 361–371. [Google Scholar] [CrossRef]
Figure 1. Schematic model of packed bed in this study.
Sustainability 16 04522 g001
Figure 2. Typical meshing scheme.
Sustainability 16 04522 g002
Figure 3. Comparison of DEM simulation results with experimental data by Mueller (1992) [26] and a correlation by Mueller (2019) [41].
Sustainability 16 04522 g003
Figure 4. Variations in pressure drop between inlet and outlet in ui = 0.4 m/s Ti = 150 K, with different sized cells.
Sustainability 16 04522 g004
Figure 5. Illustration of selected longitudinal and lateral sections.
Sustainability 16 04522 g005
Figure 6. Velocity and temperature contour: (a) ui = 0.3 m/s, (b) ui = 0.6 m/s.
Sustainability 16 04522 g006
Figure 7. Radial-averaged porosity profile and the packed bed radial-averaged velocity under different inlet velocities.
Sustainability 16 04522 g007
Figure 8. Radial-averaged porosity profile and temperature under different inlet velocities: (a) Radial-averaged, (b) Z = 10 mm, and (c) Z = 20 mm.
Sustainability 16 04522 g008
Figure 9. Axial-averaged porosity profile and packed bed axial-averaged velocity under different inlet velocities.
Sustainability 16 04522 g009
Figure 10. Axial-averaged temperature in packed bed.
Sustainability 16 04522 g010
Figure 11. Characteristics of friction factor in packed bed at various inlet temperatures: (a) properties that do not change with temperature, (b) properties that change with temperature.
Sustainability 16 04522 g011
Figure 12. Characteristics of Nusselt number in packed bed at various inlet temperatures: (a) properties that do not change with temperature [43,44], (b) properties that change with temperature.
Sustainability 16 04522 g012
Table 1. Particle properties used for DEM simulation.
Property ParameterUnitValue
Particle diameterm0.01
Poisson ratio-0.24
Solids Densitykg/m33750
Shear ModulusPa1.37 × 109
Coefficient of Restitution-0.5
Coefficient of Static Friction-0.154
Coefficient of Rolling Friction-0.1
specific heatJ/(kg∙K)780
Thermal conductivityW/(m∙K)30
Table 2. Empirical correlations for convective heat transfer in packed beds.
ResearchersCorrelations
Chen and Mueller (2019) [43] N u p = 2 + 0.77 ε + 0.64 ε 2 + ( 0.6 + 1.1 ε ) R e 0.5 P r 1 / 3
Whitaker (1972) [44] N u p = 0.5 R e m 0.75 P r 1 / 3 + 0.2 R e m 1 / 3 P r 1 / 3
Disclaimer/Publisher’s Note: The statements, opinions and data contained in all publications are solely those of the individual author(s) and contributor(s) and not of MDPI and/or the editor(s). MDPI and/or the editor(s) disclaim responsibility for any injury to people or property resulting from any ideas, methods, instructions or products referred to in the content.

