Article

Coupling and Coordination Analysis of Digital Economy and Green Agricultural Development: Evidence from Major Grain Producing Areas in China

1
Research Centre for Modern Agricultural Development, Northeast Agricultural University, Harbin 150030, China
2
College of Economics and Management, Northeast Agricultural University, Harbin 150030, China
*
Author to whom correspondence should be addressed.
Sustainability 2024, 16(11), 4533; https://doi.org/10.3390/su16114533
Submission received: 26 April 2024 / Revised: 23 May 2024 / Accepted: 24 May 2024 / Published: 27 May 2024

Abstract

:
Analyzing the coupled coordination of the digital economy (DE) and agricultural green development (AGD) and exploring the main influencing factors affecting their coupled coordination are key to achieving high-quality and sustainable development in agriculture. These measures are also crucial for achieving the United Nations’ Sustainable Development Goals (SDGs). In this study, we constructed a comprehensive evaluation system including two subsystems, DE and AGD, and firstly measured the development of DE and AGD and their trends in 13 provinces in China’s main grain-producing areas during the decade from 2012 to 2021 using EW-TOPSIS. Secondly, the coupling coordination development (CCD) model was used to analyze the static results and dynamic evolution process of CCD of the DE and AGD subsystems in the study area. Finally, the gray correlation degree (GCD) model was used to identify the main influencing factors in the interaction between the two systems in 2012 and 2021. The results show the following: (1) The development levels of DE and AGD generally rose during the study period, but the development level gap between regions was obvious, and the development of DE relatively lagged behind. (2) The level of CCD increased year by year, and the overall process changed from “uncoordinated” to “coordinated”. (3) At the beginning of the study period, the development achievements of DE had a great impact on the process of AGD. The application of advanced agricultural technology in the AGD system and the process of agricultural industry upgrading had a profound impact on the development of DE. However, a decade later, the main factors had changed. This paper analyzes the results of the above empirical study in time and space, aiming to provide policymakers with new working ideas to achieve the SDGs.

1. Introduction

In June 2020, the United Nations released a briefing on the impact of the novel coronavirus (COVID-19) on the global food system. This briefing highlighted the negative effects of various factors, including geographical conflicts, environmental degradation, and resource scarcity, on the food system. It also projected that 49 million people worldwide will fall into extreme poverty and experience severe food shortages in the next few years. Agriculture is the primary industry responsible for ensuring food security and economic development [1]. However, agricultural development also results in significant carbon emissions [2], which contribute to the deterioration of the global environment and climate change [3]. Currently, environmental issues are gaining increasing global attention [4]. Many countries and regions are facing the challenge of balancing economic development and environmental protection [5]. In this context, the emergence of the green development model is considered a fundamental solution to balance ecological and environmental problems and maintain the normal operation of society [6].
The incompatibility between the actions of humanity, the advancement of society, and the natural environment mainly comes from inappropriate modes of production. The solution to this contradiction lies in the scientific adjustment of humans’ utilization of natural resources [7]. This implies that a reasonable mode of production (such as green production) is not only conducive to solving the problem of environmental degradation but is also the basis of long-term socio-economic good [8]. In essence, the concept of “agricultural green development” represents a model of green development that seeks to achieve the coordination of the agricultural economy, society, and the ecological environment through the transformation of all agricultural links to green and sustainable development [4]. The advancement of sustainable agricultural practices represents a pivotal aspect of attaining the United Nations Sustainable Development Goals [9]. Consequently, although the promotion of green and high-quality agricultural development is in line with the prevailing global trend in agricultural development [10], the challenge for policymakers is to allocate production factors in a more scientific and reasonable manner, improving agricultural production efficiency while ensuring the rational utilization of resources and the environment [11].
The emergence and rapid popularization of the digital economy may be able to solve this challenge [12]. The digital economy is a series of economic activities with data as production factors and information and communication technologies (ICT) and artificial intelligence as carriers [13]. It is characterized by a reduction in environmental pollution in production activities through the innovation of sustainable production technology [14]. Furthermore, it provides efficient guidance for the rapid and rational allocation of resources, thus enabling high-quality economic development [15]. The digital economy, as an advanced and sustainable economic form [16], has had a considerable impact on the development of the real economy [17]. The in-depth integration of the two has provided a new impetus for achieving sustainable development [18].
The existing research shows that the digital economy primarily facilitates the advancement and utilization of digital technology to positively impact the sustainable development of agriculture [19]. This is because digital technology can significantly assist farmers with addressing the issue of information asymmetry, expediting the dissemination of agricultural knowledge, reducing the complexity of understanding agricultural knowledge, and enabling farmers to more rationally allocate the production materials in their possession [20]. The production and management mode of agriculture in the process of sustainable transformation and greening will also address the obstacles to the development of the digital economy from the resource, environmental, social, and other perspectives, promoting the development of the digital economy [4,21]. Thanks to the coupled and coordinated development of the two, China’s “Internet + modern agriculture” campaign has not only achieved remarkable results in improving agricultural total factor productivity, increasing rural residents’ income, improving the rural living environment, and other aspects, but also provided support for promoting the integration of primary, secondary, and tertiary industries and providing support for the stable development of the social economy. According to system theory, when the elements of a system display scientific, orderly arrangement and combination, the system will display a ‘1 + 1 > 2’ effect [22]—that is, the coordinated development of the two plays a role in promoting the development of the national economy and industry which is greater than the role of each system alone.
Therefore, the emergence of the digital economy has provided new ideas for each country to realize green sustainable development, and the interaction between the digital economy and agricultural green development has received more and more attention. This study utilizes panel data from 13 provinces in China’s major grain-producing areas from 2012 to 2021. It first discusses the mechanism of their interaction, drawing on existing literature studies, and then reorganizes and classifies the index dimensions and specific variables selected by previous scholars when studying the two subsystems of the digital economy and agricultural green development. A comprehensive evaluation system consisting of two subsystems is established. Secondly, the development level of the comprehensive evaluation system is quantified using the EW-TOPSIS evaluation method. The static results and dynamic evolution process of the coupled and coordinated development of the two systems are explored using the CCD model. The results of the CCD are analyzed from the perspective of system theory. Thirdly, the grey correlation model (GCD) is used to explore the main influencing factors in the interaction between the digital economy and agricultural green development and the changes in the main influencing factors. Finally, the results of this study are presented and discussed (Figure 1).
Specifically, this study intends to answer the following three questions:
1. What is the level and trend of the digital economy and agricultural green development in China’s main grain-producing areas?
2. How did the degree of coupling and coordination between the two subsystems of the digital economy and agricultural green development in China’s main grain-producing areas change during the decade from 2012 to 2021?
3. What are the main influencing factors of the interaction between the digital economy and agricultural green development, and have the main influencing factors changed over time?

2. Literature Review and Mechanism Analysis

2.1. The Impact of Digital Economy on Green Agricultural Development

The first is the development of the Internet brought about by the digital economy, which enables farmers to access a wider range of fertilizers, technical information, and other resources, thereby facilitating precision fertilization and reducing the use of pesticides and chemical fertilizers [23]. This has the effect of significantly improving agricultural green total factor productivity [10].
The second factor is the innovation of production technology brought about by the digital economy. This has enabled the precise control of all aspects of agricultural production through the development of drones, the Internet of Things, and facility agriculture [20]. The advent of innovative production technology has facilitated communication and collaboration among various industries engaged in agricultural production [24], while simultaneously enhancing the efficiency of land output in a manner that is both environmentally responsible and technologically advanced.
The third factor is the development of e-commerce, which has been enabled by the digital economy. E-commerce platforms can provide real-time market information, simplify the supply chain of agricultural products [25], and provide a basis for optimizing the structure of the agricultural industry [26], and its supporting logistics network reduces the cost of agricultural product distribution [27]. On the one hand, it reduces the waste of resources due to information asymmetry in all aspects of agricultural operations. On the other hand, it promotes the development of the agricultural economy and increases farmers’ incomes.
Finally, there is the digitalization of the financial sector brought about by the digital economy. Since green agricultural production methods often require higher investment costs and longer payback periods [28], and farmers are subject to more credit constraints in their access to finance, the traditional financial services model will inhibit farmers from adopting green agricultural production methods [29]. Digital finance thus emerges with its advantage of low financing cost, solving previous issues such as the difficulty of financing farmers and the high cost of financing, which hindered providing financial assistance to green agricultural production, broadening the service scope of the financial industry, and providing long-term financial support for the transformation of agricultural production methods in rural areas [30].
Nevertheless, a small number of scholars maintain that the digital economy will enhance purchasing power, thereby expanding the scale of consumption of commodities. This, in turn, will intensify environmental pollution in multiple areas of production, storage, logistics, etc. [31,32], thus hindering the process of green development of agriculture.

2.2. The Impact of Green Agricultural Development on the Digital Economy

Firstly, in terms of the improvement of the resource environment brought about by the green development of agriculture, a good ecological environment is a prerequisite for the development of various industries, including the digital information industry [33]. Sufficient natural resources can positively affect the development of the digital economy through their positive impact on technological innovation [34].
Secondly, in terms of the impact of green agricultural development on scientific and technological innovation, it can be observed that the deterioration of the living environment brought about by the rough and disorderly development of agriculture will widen the gap between the rich and the poor in the region [35], reduce the well-being of residents [36], and increase the probability of illegal and criminal activities [37]. The aforementioned consequences will directly affect the migration and retention of high-level skilled personnel in the region. It is evident that high-level skilled personnel play a crucial role in the development of high-tech industries, including the digital economy [38]. On the other hand, the deterioration of the living environment will result in the migration of labor and financial resources to the field of environmental governance. This will lead to a lack of human and financial resources for the application and popularization of advanced science and technology in infrastructure construction, thus limiting the development of the digital economy [39].
Finally, the economic benefits of green development in agriculture are as follows. On the one hand, climate change and air pollution caused by agricultural development not only have a negative impact on the quality of human life but also on the efficiency of agricultural production in the future. This leads to a decline in overall social productivity [40], and the deterioration of economic benefits will naturally limit the development of the digital economy. On the other hand, when agricultural producers see that with the development of the digital economy, green financial services [41] are being more and more widely used to promote the development of environmentally friendly agricultural production methods and have achieved certain results, the willingness of farmers to use green financial services will further increase, and the demand for the digital economy will also rise, thus promoting the development of the digital economy [42].
Nevertheless, a small number of scholars have posited that the green development model of agriculture may diminish agricultural production efficiency, potentially impeding the smooth operation of the social economy in the short term [43], thereby constraining the growth of the digital economy.

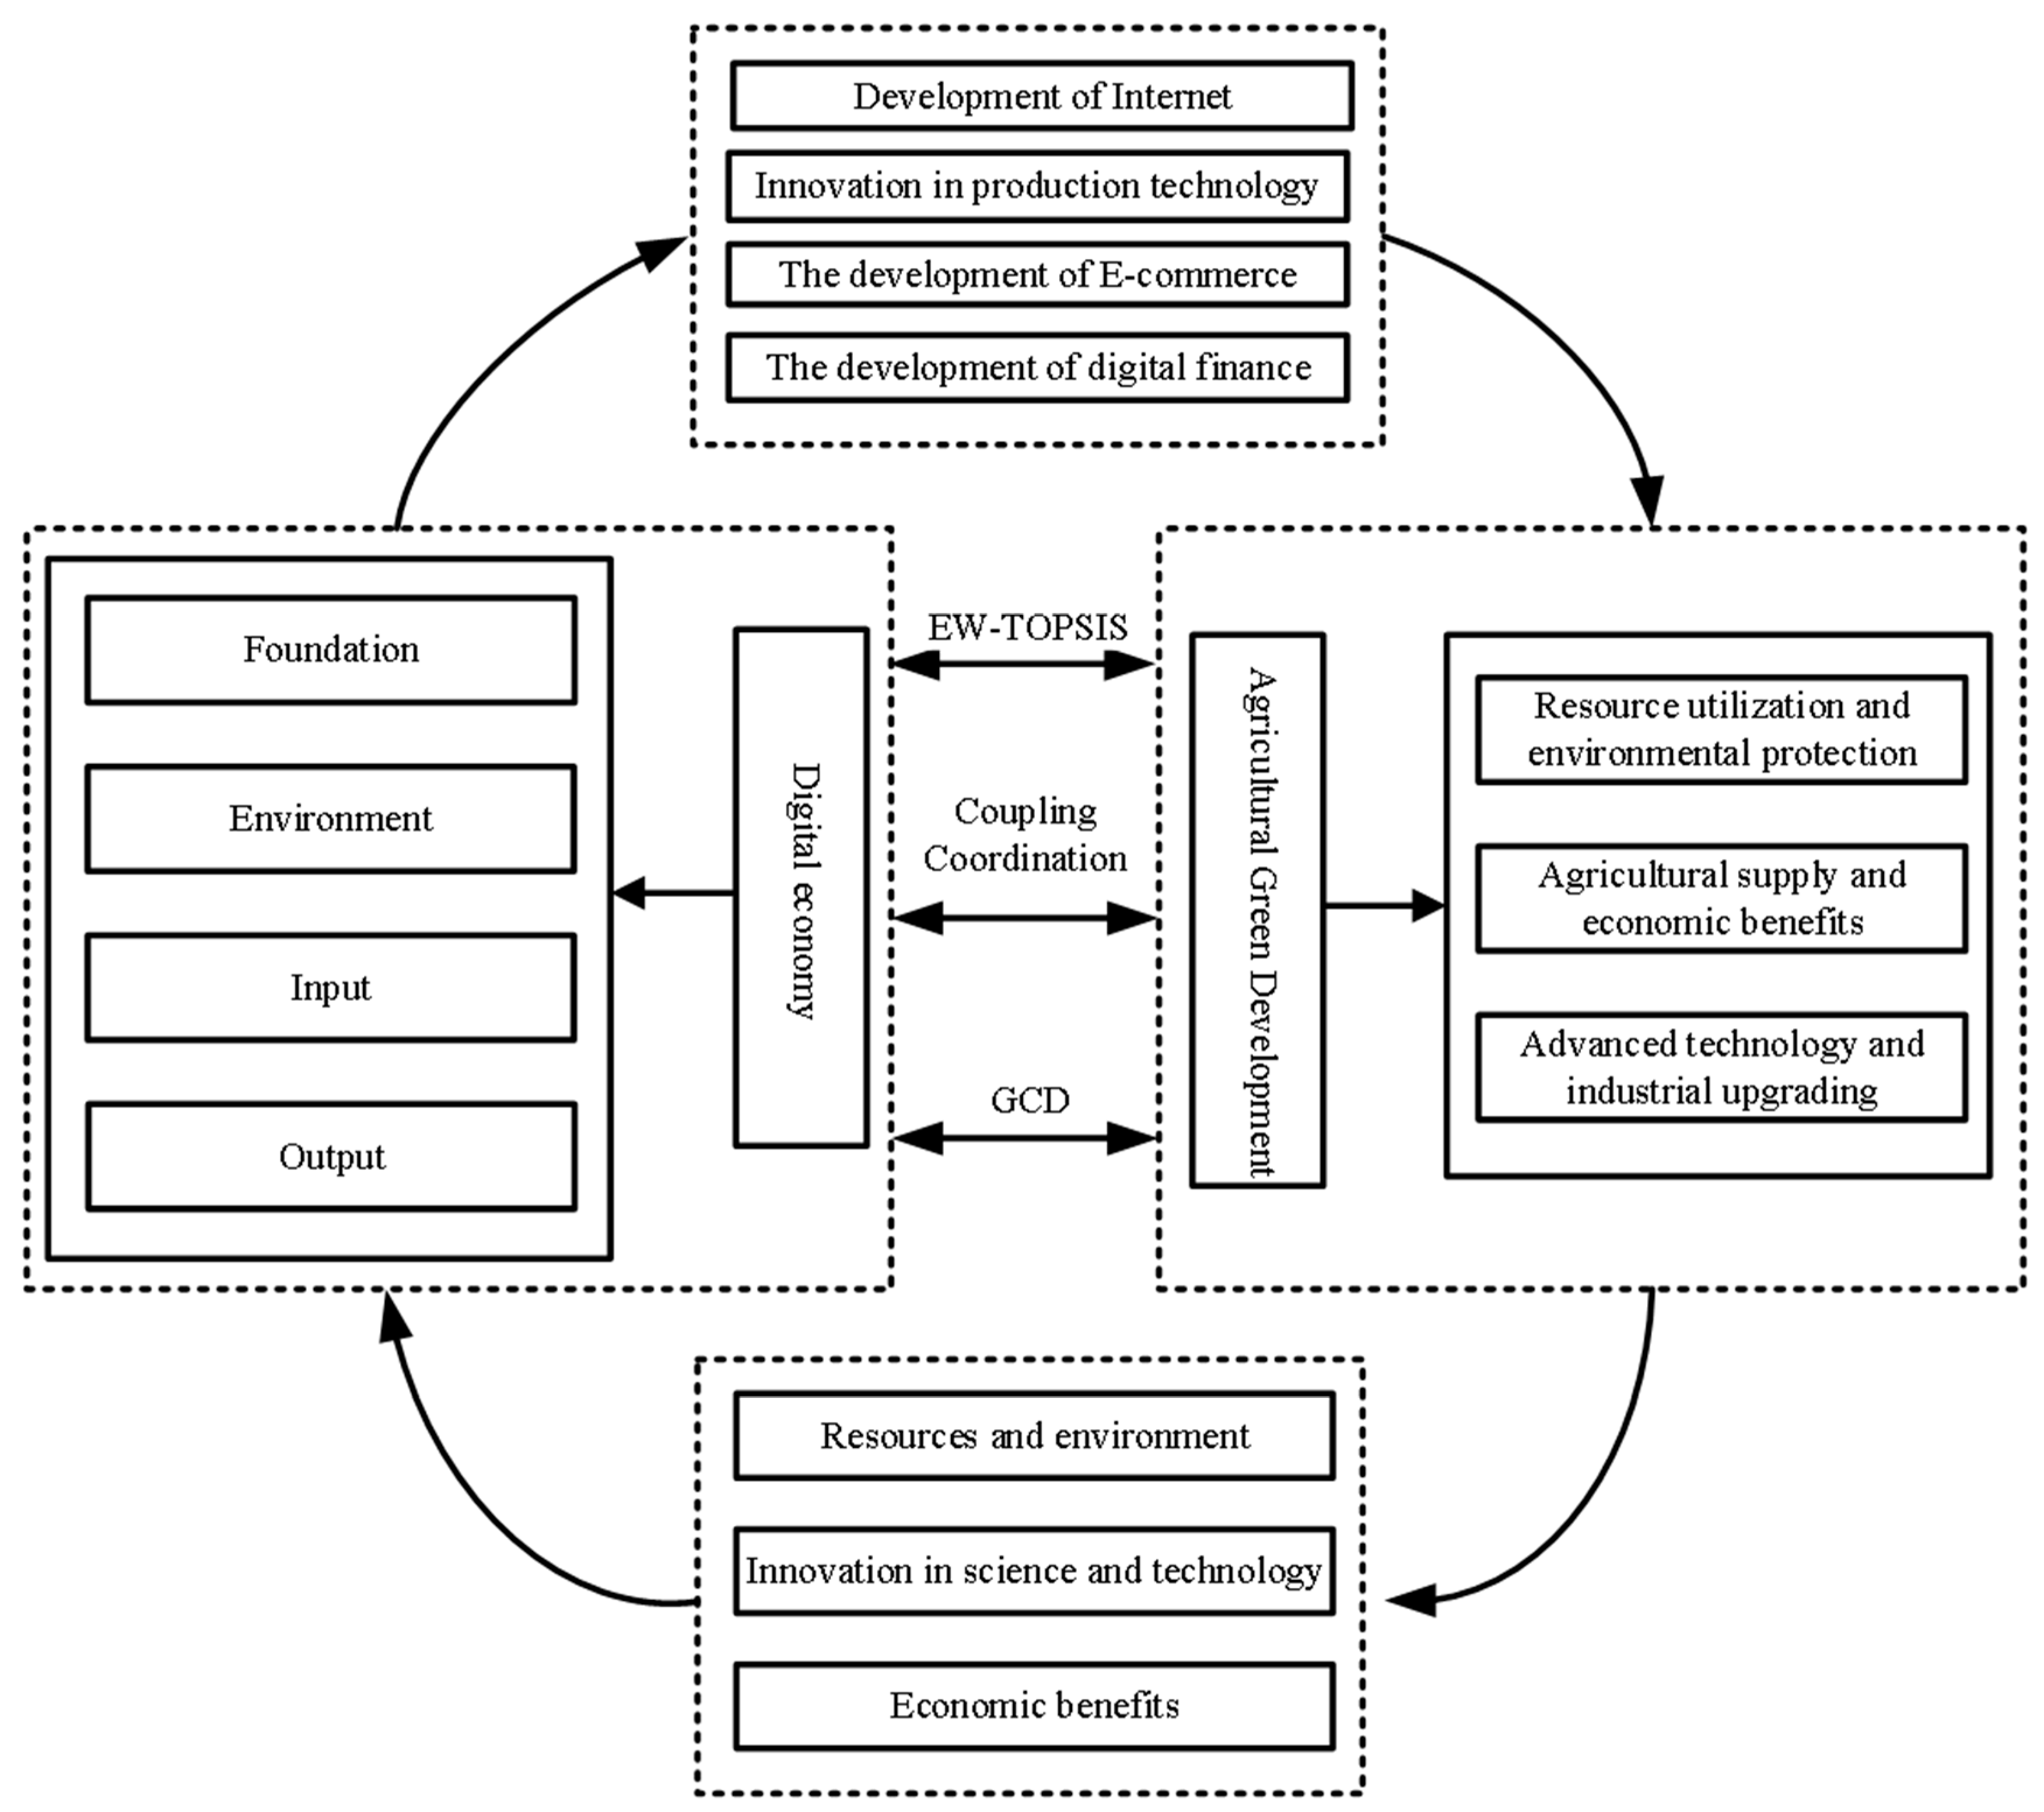
2.3. The Interaction Mechanism of the Two and the Method of Studying the Interaction

A review of the existing literature reveals that the digital economy can affect the green development of agriculture in numerous ways, while the green development of agriculture will also have an impact on the development of the digital economy in numerous ways. In other words, the digital economy and agricultural green development are interconnected and interact with each other. The coordinated development of these two factors plays a driving role in the development of the national economy and society, but the mechanisms of this role are not yet clear. Therefore, if we only study the unidirectional driving role of the digital economy in the green development of agriculture or only explore the role of the green development of agriculture in digital economic development, it is evident that the overall consideration of the system will be lacking. Consequently, it is essential to investigate the reciprocal relationship between the digital economy and green development in agriculture. This entails examining the manner in which the two systems interact, the factors that influence this interaction, and the measures that can be employed to coordinate and balance the interaction and shared development of the two systems.
In terms of research methods for studying the interaction between two systems, the coupled coordination model has been demonstrated to be an effective research method [44]. This method has the capacity to not only report the static situation of the coupling coordination development of the two subsystems through the coupling coordination degree score but also to demonstrate the evolution process from disorder to ordered coordination through the interaction and mutual influence of the internal variables of the system, as evidenced by the change in the coupling coordination degree (CCD) [45,46]. The current research focus is mainly on theoretical research on the correlation or causation between the digital economy and agricultural green development. The dynamic coupling coordination process and interaction relationship of the two subsystems are quantitatively analyzed based on time and space, and there are few studies on the main influencing factors in the interaction between the two subsystems and the changes in the main influencing factors over time. Therefore, this study takes the digital economy system and the agricultural green development system as two subsystems, constructs the coupled coordination evaluation index system, compares the time and space changes relating to the coupled coordination degree (CCD) of the two through the actual measurement results, identifies the main influencing factors at different times, and discusses the improvement of the coordinated development level of the two based on the empirical results.

3. Evaluation System Establishment, Research Scope, and Data Sources

3.1. Evaluation System Establishment

3.1.1. Digital Economy (DE)

At present, the academic community has not reached a complete consensus on the comprehensive evaluation method for the digital economy [47], but it is generally recognized that the necessary condition for the development of the digital economy is to ensure a solid infrastructure [48] and to create a good environment for the development of the digital economy by combining development with traditional industries [49].
From a macro perspective, the development level of the digital economy can be evaluated by integrating the development level of Internet technology and digital inclusive finance [50]. At the micro level, the first indicator is the promotion of the “new infrastructure strategy” to provide basic guarantees for the “digital age”, namely “digital infrastructure construction” [51]; the second is the process of digital transformation and upgrading of traditional industries, namely “industrial digitalization” [52]; and the third is the medium of advanced science and technology in the application process, namely “digital industrialization” [53]. The above three indicators classify specific variables such as “Internet users”, “mobile phone penetration rate”, “digital industry employment number”, “post and telecommunications business scale”, “high-tech industry income”, “digital financial coverage”, and “R&D investment of industrial enterprises above designated size” [54,55,56].
The specific variables included in previous studies have been able to comprehensively cover all aspects of measuring the development level of the digital economy, but different scholars have demonstrated great differences in the specific variables included in the index of “industrial digitalization” and “digital industrialization”, and their research results are also different. In order to perform a more comprehensive and clear measurement of the development level of the digital economy and take into account the availability and reliability of data, this research reorganizes all of the specific variables according to the classification method by Yuqing Geng [57]. These variables are classified according to the four indicators of “digital economy infrastructure”, “digital economy development environment”, “digital economy input”, and “digital economy output”. After eliminating the multicollinearity among the indicators, 12 specific variables were selected to construct the digital economy evaluation index system (the first half of Table 1).

3.1.2. Agricultural Green Development (AGD)

The evaluation index system of agricultural green development mainly includes the following three aspects: first, the main problem that agricultural green development aims to solve, namely “resources and environment” [58]; the second is the goal of agricultural green development, namely “supply of agricultural products” [59] and “agricultural economic benefits” [60]; and the third is the main measure of green agricultural development, namely “advanced technology application” [61].
Specifically, the specific variables of the ecological environment and natural resources mainly include “sowing area” [62], “water resources consumption” [63], “agricultural fertilizer” [64], “application of pesticides” [65], and “use of agricultural mulch” [66]. The specific variables of the agricultural product supply dimension mainly include “grain output” [67], “green innovation of agricultural enterprises”, “green agricultural product supply” [68], and other related variables. The specific variables of the application dimension of agricultural advanced technology are “the number of agricultural patented technologies” [69], “agricultural technology training”, and “financial support for sustainable agricultural development” [70].
Like the index system of the digital economy, scholars have performed a comprehensive selection of specific variables, but there are still large differences in how scholars classify different variables. In order to more comprehensively and accurately evaluate the level of green agricultural development in the study area, based on the specific variables selected in the above evaluation system, this study refers to the definition of sustainable agriculture provided by the Food and Agriculture Organization of the United Nations, which refers to “technically appropriate, economically feasible, socially acceptable and environmentally non-degrading agricultural activities” [71]. The specific variables of the agricultural green development subsystem were classified into three dimensions—“Resource utilization and environmental protection”, “Agricultural supply and economic benefits”, and “Advanced technology and industrial upgrading”—and a total of 14 specific variables were selected to construct the evaluation index system of agricultural green development (the second half of Table 1).

3.1.3. Abbreviations of Key Variables

Since there are many variables involved in this study and their names are long, the abbreviations or numbers of variables will be used to replace their variable names in the following studies. Specifically, the two subsystems “Digital economy” and “Agricultural Green Development” are abbreviated as “DE” and “AGD”. The names of indicators in the DE subsystem are abbreviated as “DE-1”–“DE-4”, and the names of specific variables in all indicators are abbreviated as “DE-11”–“DE-43”. The names of indicators in the AGD subsystem are abbreviated as “AGD-1”–“AGD-3”, and the names of specific variables in each indicator are abbreviated as “AGD-11”–“AGD-34”.

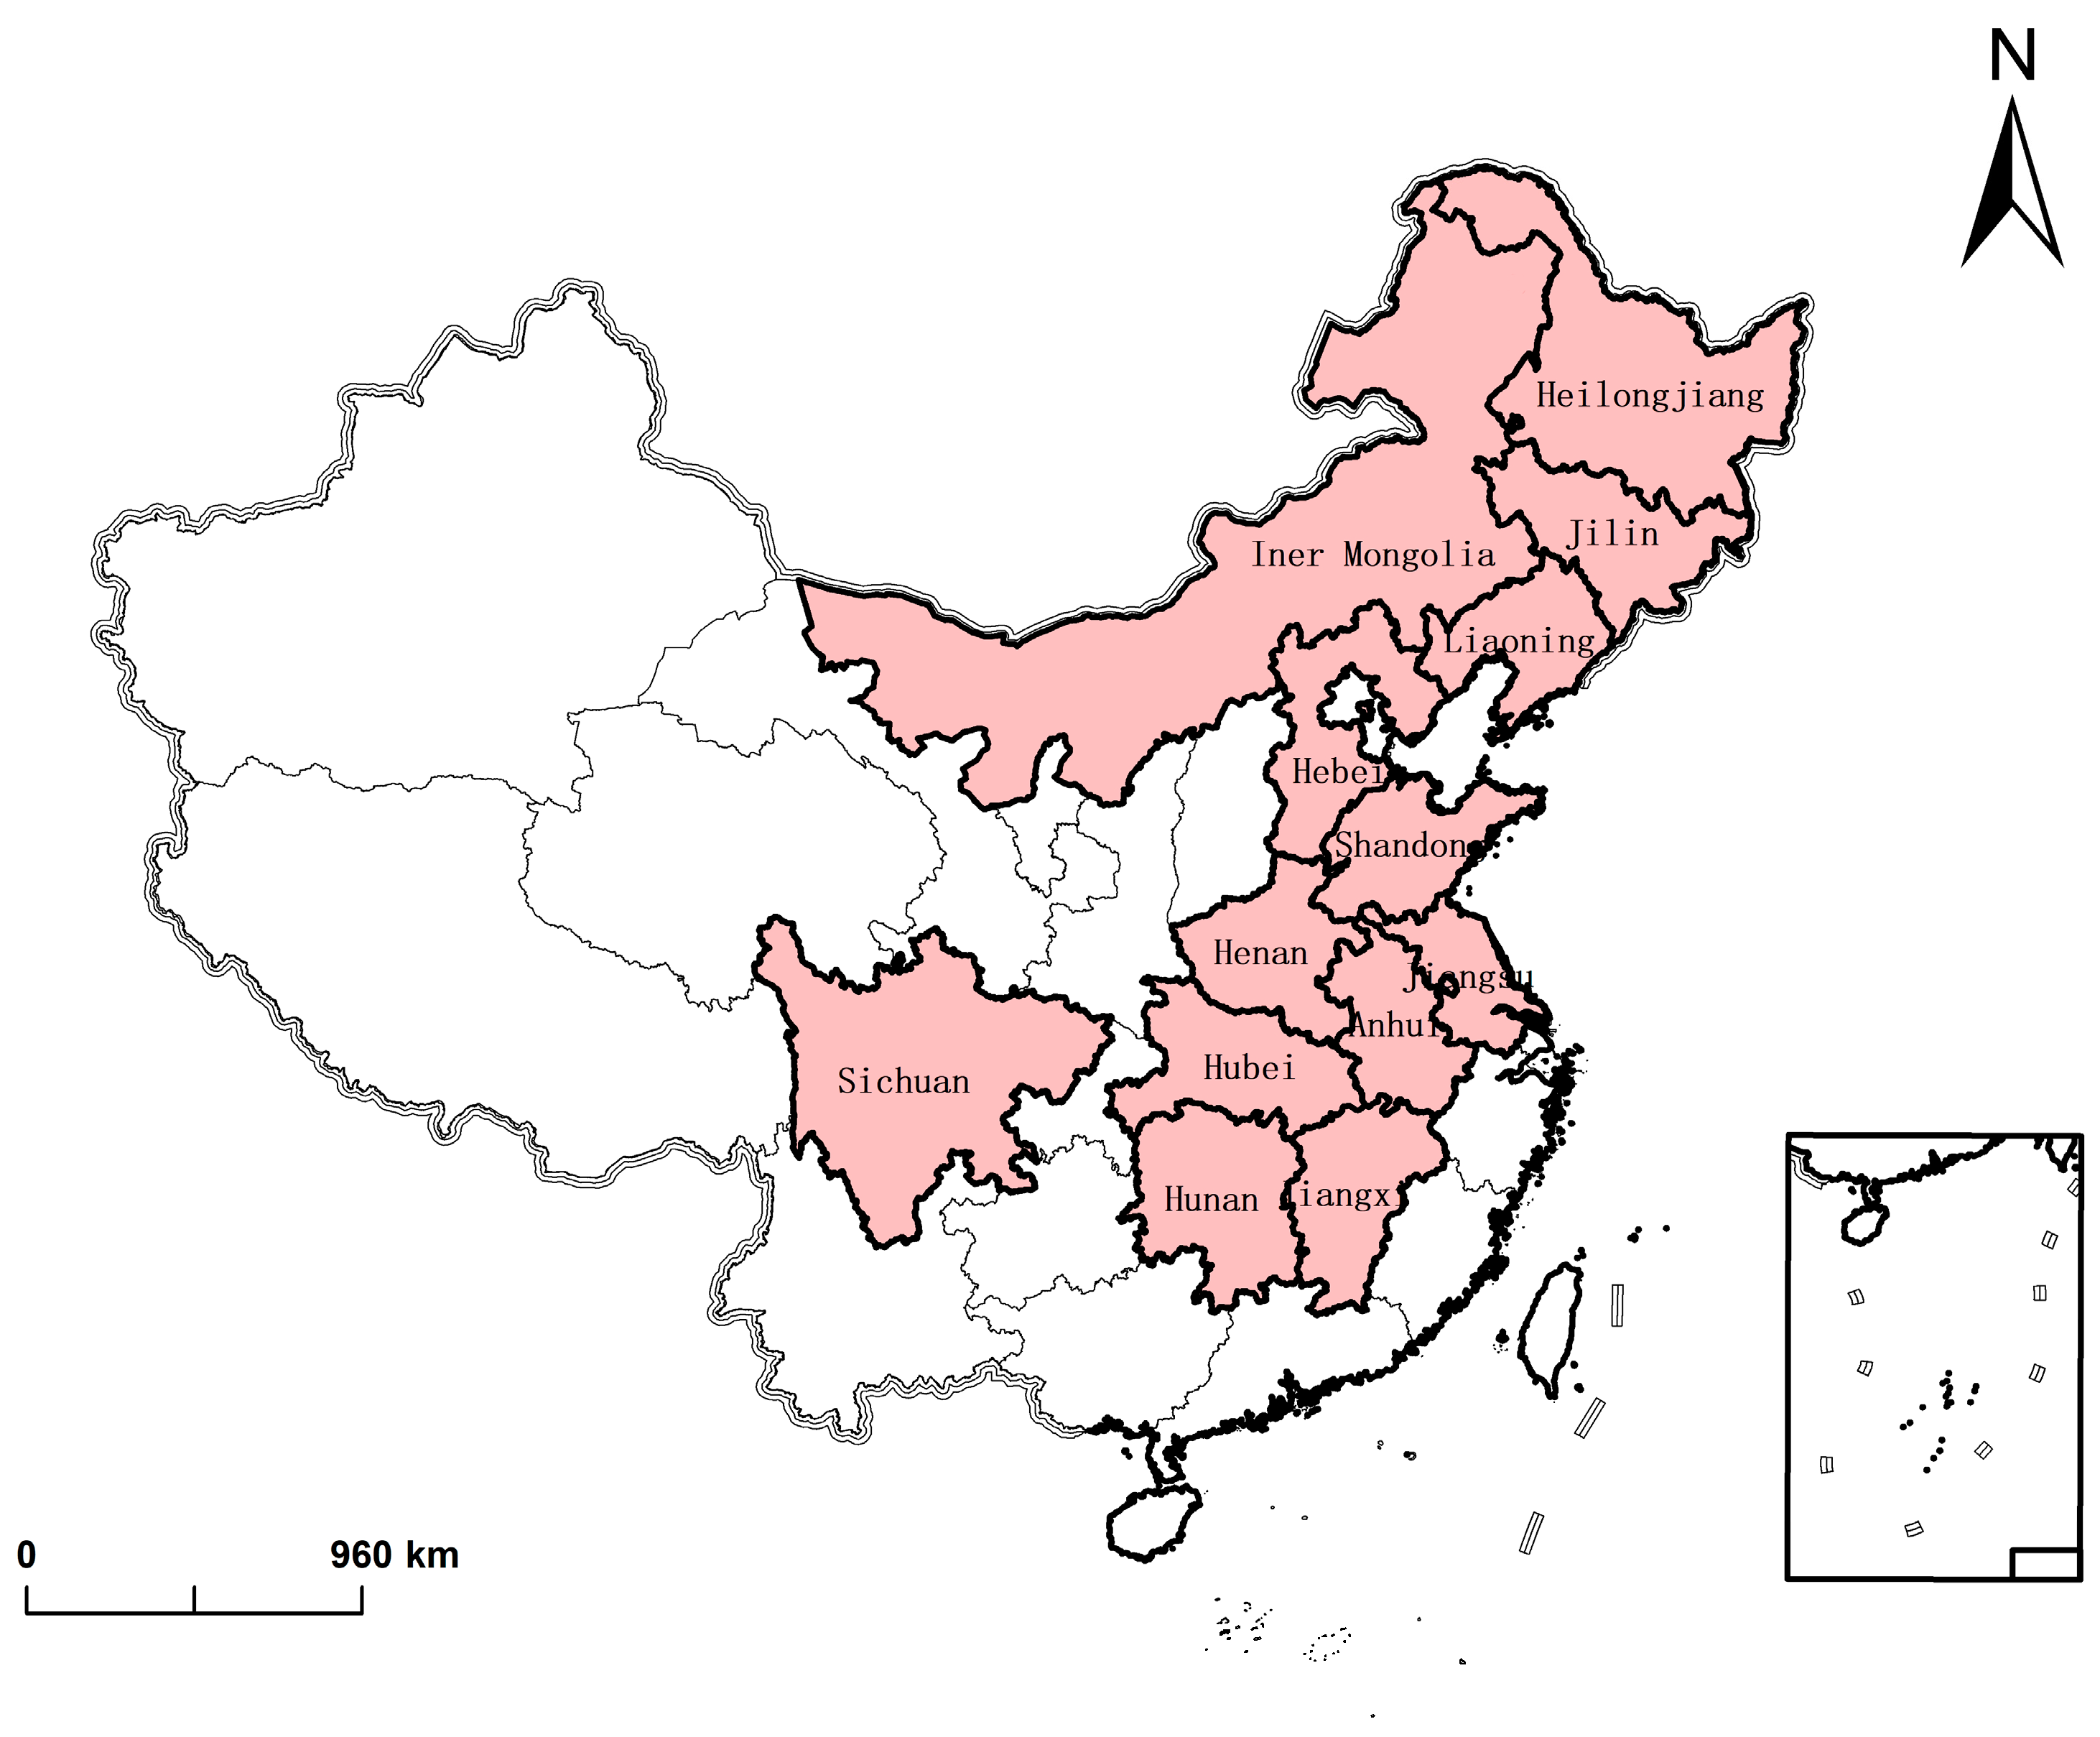
3.2. Research Scope and Data Sources

China produces a quarter of the world’s food with less than a tenth of the world’s arable land, feeding 1.4 billion people [72]. However, the uneven distribution of water resources, the excessive use of agricultural chemicals, and the degradation of land resources have had a profound impact on China’s agricultural development [73]. The rapid consumption of resources and the continuous deterioration of the environment are seriously hindering the development of various industries [22]. In order to change this situation as soon as possible, in the Paris Agreement, China clearly put forward a “dual carbon” goal—that is, a “carbon peak” by 2030 and “carbon neutrality” by 2060. In this context, China urgently needs to transform its agricultural development mode to achieve green and sustainable development [9].
China is the world’s largest grain producer [74]. China’s current grain production layout was established in 2003–2004, and 13 provinces (autonomous regions)—Hebei, Inner Mongolia, Jilin, Heilongjiang, Liaoning, Jiangsu, Anhui, Jiangxi, Shandong, Henan, Hubei, Hunan, and Sichuan (13 provincial-level units)—were identified as major grain-producing regions based on indicators of grain production, per capita consumption, and commercial grain stocks. The total grain output of the 13 provinces in China’s main grain-producing areas accounts for more than 78 percent of the country’s total grain output, playing a crucial role in ensuring national food security. With the continuous promotion of China’s “digital countryside” strategy, the digital economy has gradually become the driving force for the transformation of the agricultural production mode to achieve green and sustainable development [75] and has played a positive role in the green and sustainable development of China’s agriculture [76]. However, according to the Research Report on ’China’s Digital Economy Development’, in 2022, the penetration rate of the digital economy in China’s agricultural industry was only 10.5%, which was far lower than that of the secondary and tertiary industries, indicating that there is still much room for improvement in the participation of digital economy in agricultural production. Therefore, the research on the interaction between the digital economy and agricultural green development conducted in China’s major grain-producing areas is representative, and the research results have certain reference significance for achieving the overall balanced development of the DE and AGD in China and even in the world.
The 13 major grain-producing areas of China (Figure 2) geographically cover the eastern, central, northern, and western parts of the country. The eastern region, including Jiangsu and Anhui Provinces, has a humid climate and abundant water resources. The central region includes Henan, Hubei, Hunan, and Jiangxi Provinces. The land in this region is fertile and it is a traditional agricultural area. The northern region, which includes Heilongjiang, Jilin, Liaoning, Inner Mongolia, Hebei, and Shandong Provinces, has vast plains and fertile black land. It is an important grain production and animal husbandry base in China. The western region of Sichuan Province, with its unique geographical and climatic conditions, is an important area for rice production. This study selected panel data from 2012 to 2021 to conduct a series of studies on the development status, coupling coordination degree, and main influencing factors of the DE and AGD in the major grain-producing areas of China. The data in this study mainly came from the China Statistical Yearbook (https://www.stats.gov.cn/sj/ndsj/, accessed on 11 November 2023), the China Rural Statistical Yearbook (https://kns.cnki.net/knavi/yearbooks/YMCTJ/detail?uniplatform=NZKPT, accessed on 15 November 2023), the China Environmental Statistical Yearbook (https://kns.cnki.net/knavi/yearbooks/YHJSD/detail?uniplatform=NZKPT, accessed on 22 November 2023), the China Urban and Rural Construction Statistical Yearbook (https://kns.cnki.net/knavi/yearbooks/YCXTJ/detail?uniplatform=NZKPT, accessed on 22 November 2023), the China Digital Economy Development Research Report (http://www.caict.ac.cn/kxyj/qwfb/bps/, accessed on 29 November 2023), provincial statistical yearbooks, and the website for China Green Food Development Center. The digitalization degree of inclusive finance was measured according to the Digital Financial Inclusion Index jointly compiled by the Digital Finance Research Center of Peking University and the Ant Technology Group Research Institute [77]. The data sources were all national or industry authorities, ensuring the accuracy of empirical results. The linear interpolation method was used to complete missing data in a specific time or region.

4. Methodology and Calculation Process

4.1. EW-TOPSIS

Entropy weighting is a mathematical method used to determine the weight of each index in a system by evaluating the degree of dispersion of the index, which is widely used and scientifically researched for its objectivity and comprehensiveness [78]. TOPSIS (Technique for Order Preference by Similarity to Ideal Solution) can make full use of raw data. TOPSIS is a scientific and effective comprehensive evaluation method that calculates and ranks the comprehensive distance of each solution set from the best to the worst solution [79]. The EW-TOPSIS method combines these two methods while retaining the objectivity, comprehensiveness, and accuracy of the results [80]. Based on existing research paradigms [21,81], the calculation process of EW-TOPSIS in this study was as follows:
(1)
Data standardization: The first step requires dimensionless processing of the original data to make the different indicators comparable. In this study, the “Extreme Value” method was used to process the positive indicators, as shown in (1), and the processing method for the negative indicators is shown in (2), where Xab represents the a-th variable in the b region of the index system and xab is the original value:
P o s i t i v e   i n d i c a t o r s : X a b = x a b min   x a b max   x a b min   x a b ( a = 1 , 2 , , n b = 1 , 2 , , n )
N e g a t i v e   i n d i c a t o r s : X j i = max x i j x i j max x i j min x i j ( i = 1 , 2 , , n j = 1 , 2 , , n )
(2)
Calculate the coefficient of variation, entropy, and weight: Entropy E with coefficient of variation V can more accurately reflect the degree of dispersion among indicator data. Therefore, the second step needed to calculate the coefficient of variation (such as Formula (3)), the entropy value of each index (such as Formula (4)), and the final weight (such as Formula (5)). The final weight W obtained represents the importance degree of the index in the comprehensive evaluation system, which prepares for the following TOPSIS calculation.
V ab = X a b b = 1 m X a b ( a = 1 , 2 , n b = 1 , 2 , n )
E ab = 1 ln m ( j = b m V a b ln V a b ) ( a = 1 , 2 , n b = 1 , 2 , n )
W ab = 1 E ab b = 1 n ( 1 E ab ) ( a = 1 , 2 , n b = 1 , 2 , n )
(3)
TOPSIS is actually based on the original data matrix after standardization, and the cosine method is used to find out the optimal and worst schemes (represented by vectors) among all the schemes. Then, the distance (Euclidean distance) between each evaluation object and the optimal scheme and the worst scheme is calculated, respectively, and the ranking is established according to the distance, which is used as the basis for the evaluation of superiority and inferiority. So, for the calculation of TOPSIS, the positive and negative ideal solutions should be specified first (6), and then the Euclidean distance should be calculated (7).
f ab = W a b × X a b ( a = 1 , 2 , , n b = 1 , 2 , , n )
f b + = max f a b f b = min f ab
The positive ideal and negative ideal are interpreted as:
f + = ( f 1 + , f 2 + , f 3 + , f m + ) f = ( f 1 , f 2 , f 3 , f m )
Therefore, the positive ideal and negative ideal solution’s European distances are represented as:
S b + = b = 1 n ( f a b f b + ) 2 ( a = 1 , 2 , n b = 1 , 2 , n ) S b - = b = 1 m ( f a b f b ) 2 ( a = 1 , 2 , n b = 1 , 2 , n )
(4)
Calculate the final score D of the final index and variable (0 ≤ D ≤ 1)
D b = S b S b + S b + ( a = 1 , 2 , , n b = 1 , 2 , , n )

4.2. Coupling Coordination Development (CCD)

The coupling coordination degree model can be used to evaluate the degree of coordination development and its dynamic evolution between two subsystems or system elements [82]. Based on the existing research paradigm, the coupling degree model of the digital economy and agricultural green development system was constructed in this study as follows [83]:
(1)
Calculate the coupling degree C of the two systems. The first step of the coupling coordination degree model was to evaluate the coupling size of the data with the concept of “coupling”, with a larger value indicating a stronger interaction strength between the systems. In Formula (9), D1 and D2 are the EW-TOPSIS scores of the digital economy and the agricultural green development system, respectively.
C = { D 1 × D 2 ( ( D 1 + D 2 ) 2 ) 2 } 1 2
(2)
Calculate the coupling coordination degree (CCD) of the two systems: The second step was to calculate the coupling coordination degree between the DE and AGD. λ and γ are the coefficients, considering that the two subsystems of the digital economy and agricultural green development are of the same importance, so set λ = γ = 0.5
C C D = C × ( λ D 1 + γ D 2 )

4.3. Study on Influencing Factors (Gray Correlation Degree)

Based on the grey system theory, grey correlation degree analysis determines whether the reference sequence and the comparison sequence are closely related according to the similarity of their geometric shapes. It is mainly used to analyze the correlation between various factors in the two systems [84]. The grey correlation degree method can be used to explore unknown correlations under limited known data. This method has been successfully applied to research on major influencing factors in many fields [85,86]. The calculation process for the grey correlation degree in this study was as follows:
(1)
Determine the reference sequence and comparison sequence: In order to calculate the grey correlation degree between the two subsystems of DE and AGD, the index or variable of AGD was set as the comparison sequence Sx, and the index or variable of the DE was set as the reference sequence Sy.
S x = ( s x ( 1 ) , s x ( 2 ) , s x ( 3 ) , s x ( n ) ) . x = 1 , 2 , 3 , , a
S y = ( s y ( 1 ) , s y ( 2 ) , s y ( 3 ) , s y ( n ) ) . y = 1 , 2 , 3 , , b
(2)
Calculate the correlation coefficient of the two sequences ϛyx (t), where ρ is defined as 0.5
ζ y x ( t ) = min min | s y ( t ) s x ( t ) | + ρ max max | s y ( t ) s x ( t ) | | s y ( t ) s x ( t ) | + ρ max max | s y ( t ) s x ( t ) |
(3)
Calculate the gray correlation degree of the two sequences.
r y x = 1 n t = 1 n ζ y x ( t )
(4)
Organize GCD into matrix form.
R = [ r 11   r 12 r 1 x r 21   r 22 r 2 x r y 1   r y 2 r y x ]

5. Results and Discussion

In order to more clearly summarize and analyze the level of digital economic development and agricultural green development in the 13 studied provinces in the past 10 years, this paper divides the measurement results of development level D into five levels [87] by referring to existing studies. The measurement results of CCD are divided into eight grades [88]. The specific division is shown in Table 2 and Table 3.

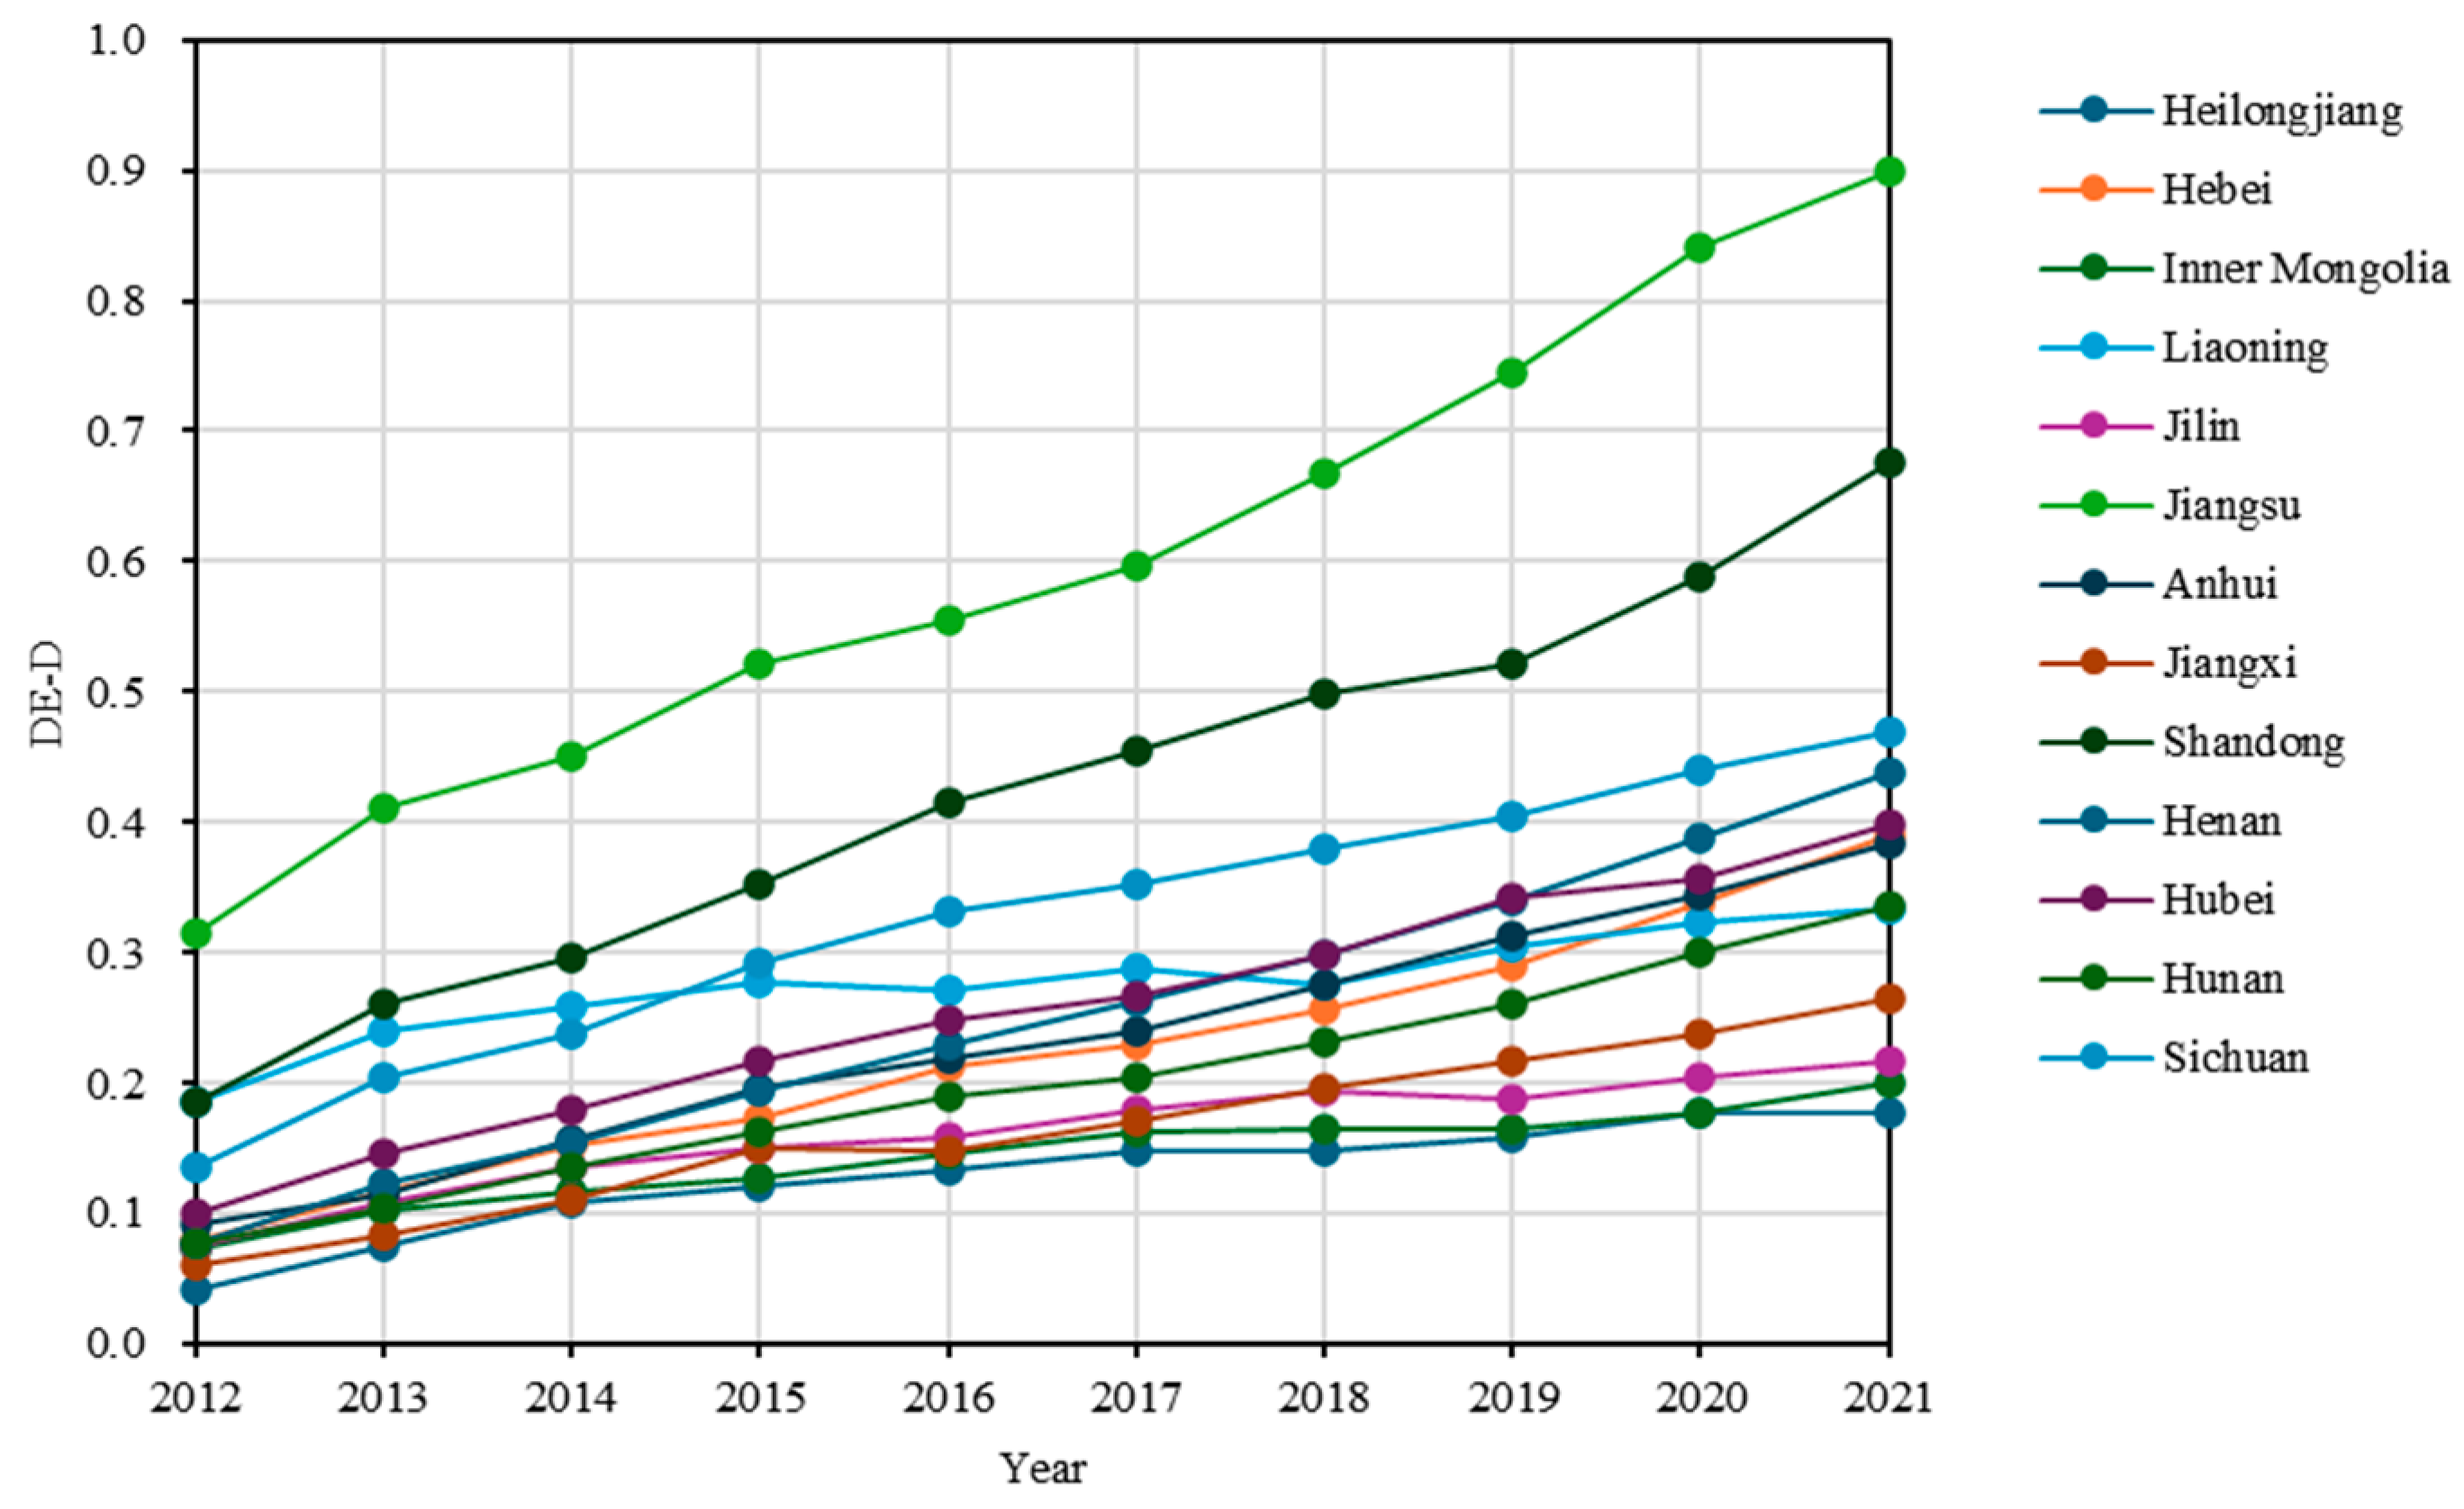
5.1. Development Level of the Digital Economy

5.1.1. The Level of Development Varies over Time

Changes in the level of digital economic development over time in China’s main grain-producing regions are shown in Table 4 and Figure 3. From a macro point of view, the digital economic development levels of the 13 provinces in China’s main grain-producing regions all improved during the period of 2012–2021. However, the best and the worst span five levels, and the overall development gap is very significant, and this development gap gradually became larger in this 10-year period, with no obvious tendency for narrowing.
Specifically, with regard to the level of digital economic development, 92.3 percent of the regions were outside of the lowest rank by 2021. Four provinces—Jiangsu, Shandong, Henan, and Sichuan—have scores in the top four in terms of their digital economic development level, and these four provinces are also in the top four in terms of their GDP rankings among the 13 provinces. This indicates that the economic development of these four regions is in a better condition, and the local governments may have more abundant financial revenues to support the development of the digital economy and have indeed achieved some results. In Hebei, Inner Mongolia, Liaoning, Jilin, Anhui, Jiangxi, Hubei, and Hunan, the level of development of the digital economy displayed relatively less satisfactory results, at the “Average” level. Local governments can consider increasing their attention on the development of the digital economy so that the scale and quality of the region’s digital economic development can be improved. Although the digital economy of Heilongjiang Province has not made a leap in terms of its rating, it has increased fourfold compared to its 2012 rating. Considering the actual situation of economic development and the foundation of digital economic development in Heilongjiang Province, it can be seen that the local government has implemented a lot of effective measures to improve the development level of the digital economy in the region, despite the fact that the financial income is not great.

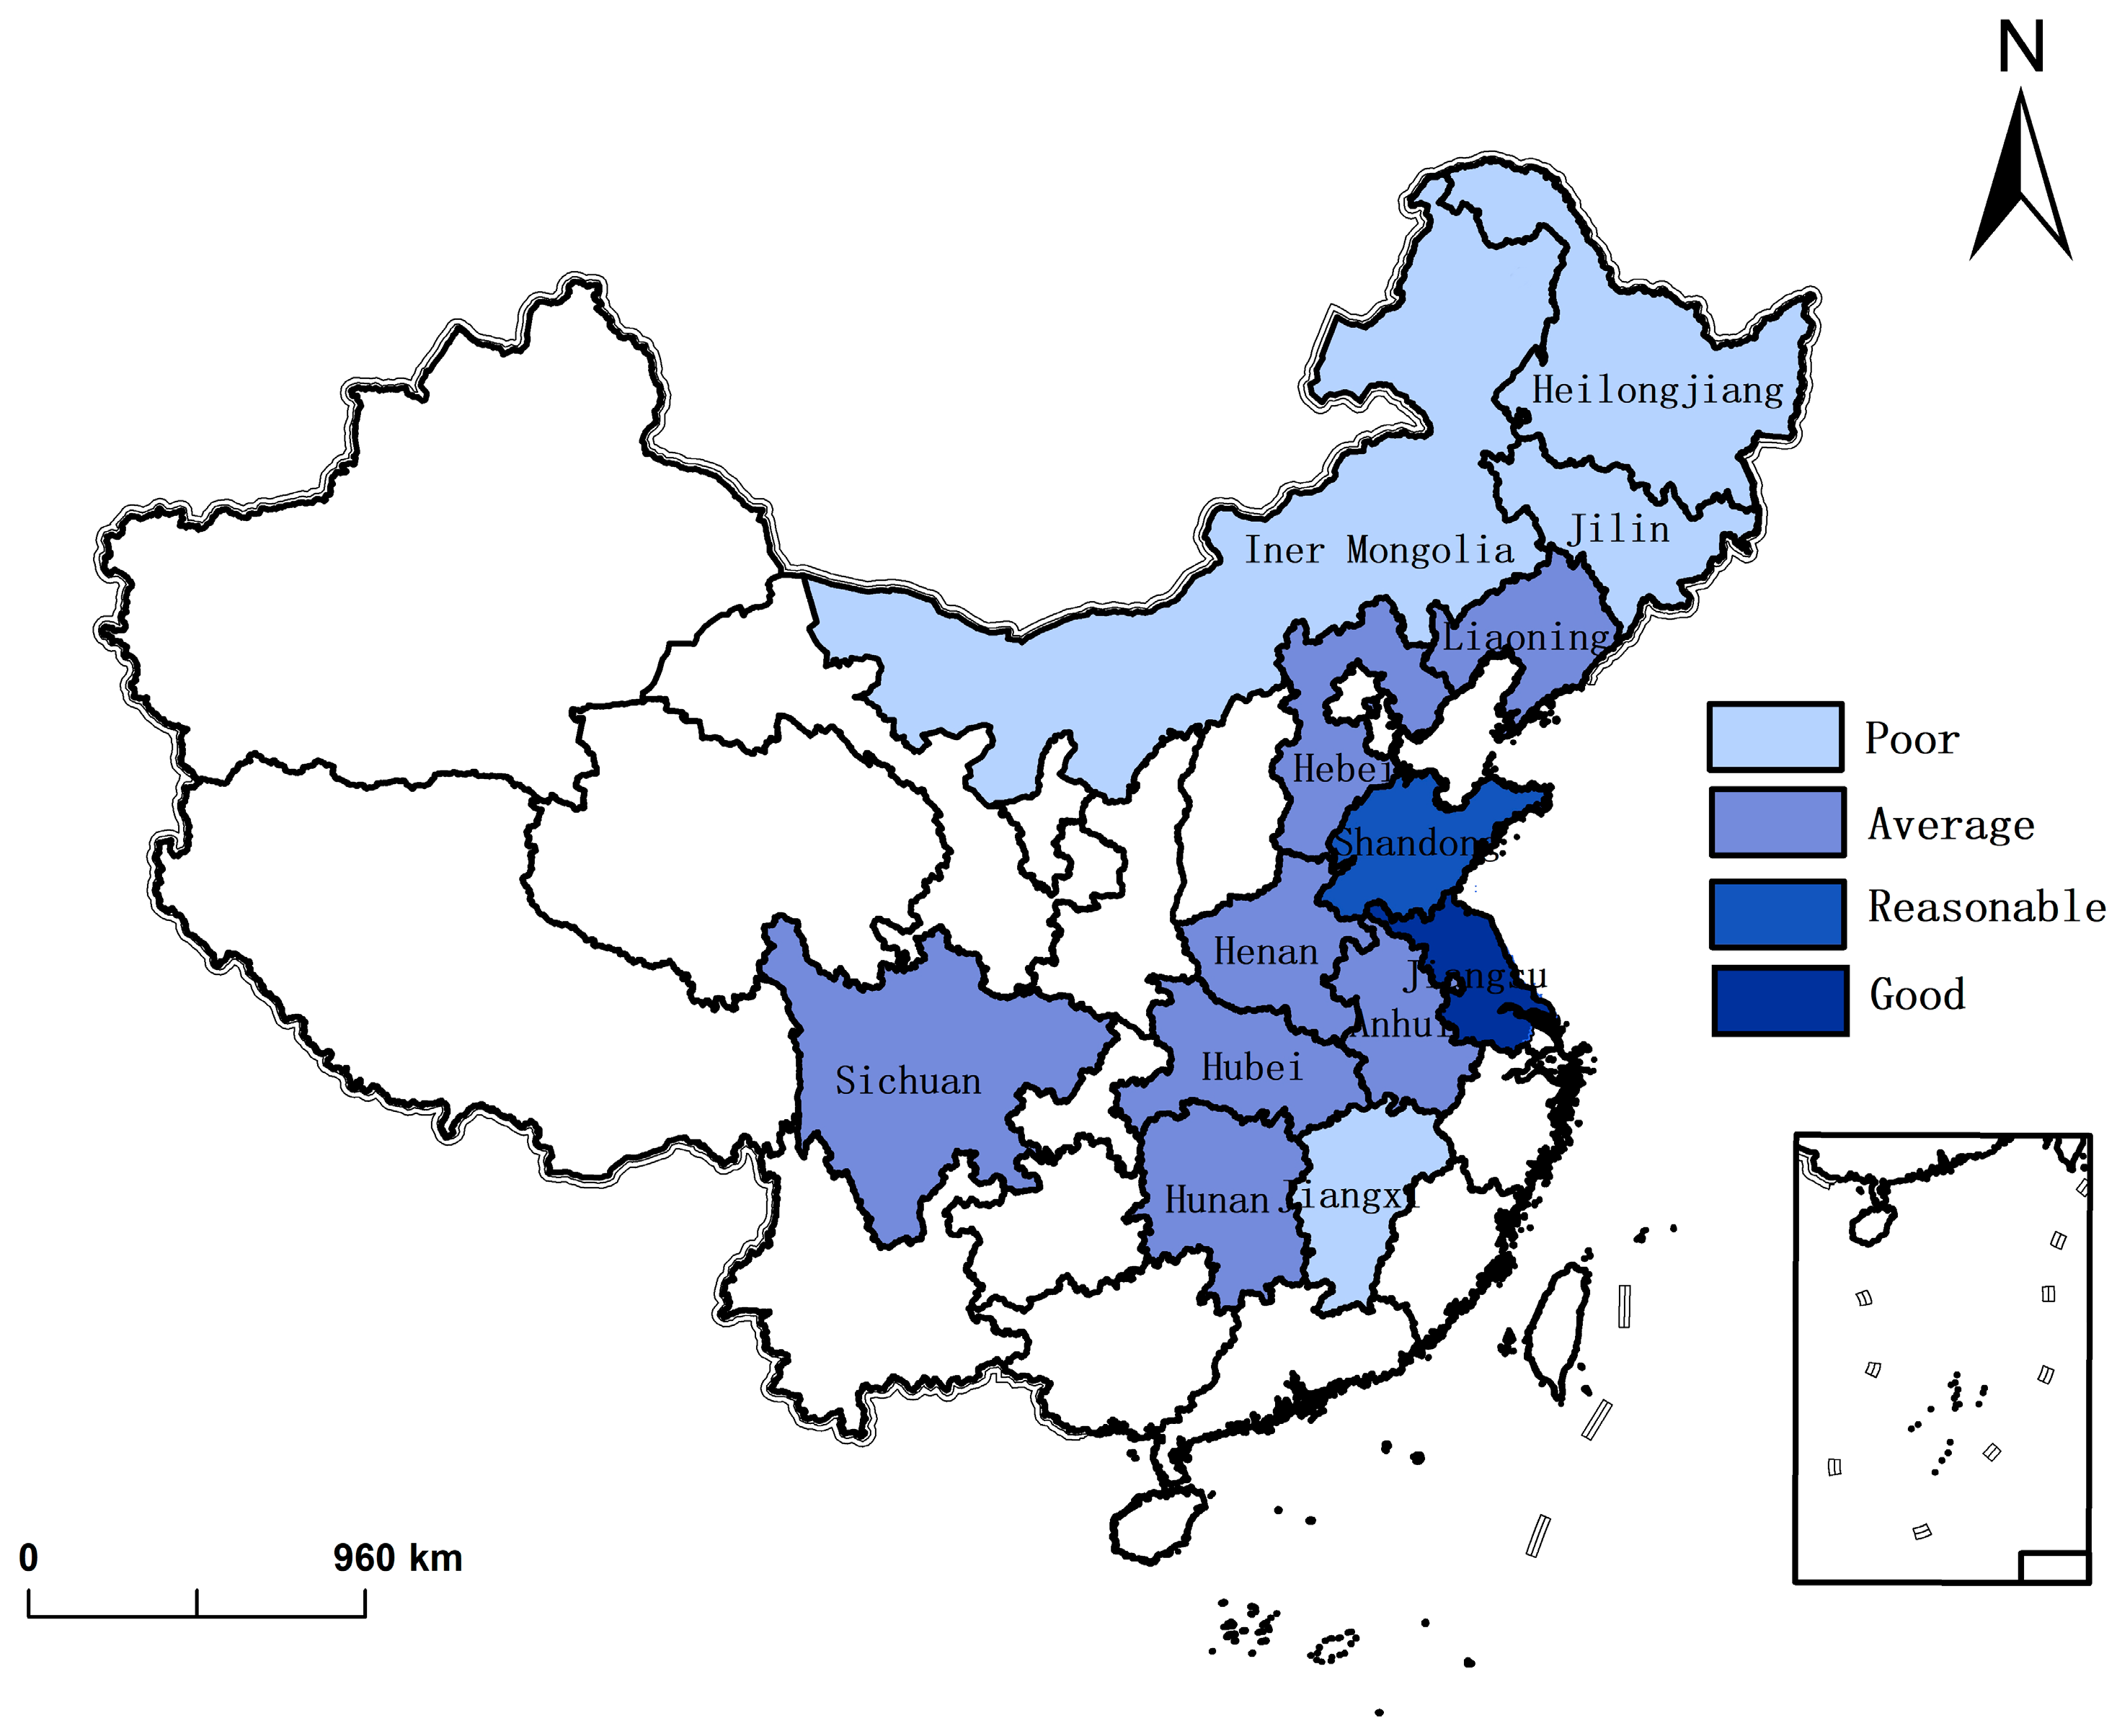
5.1.2. Spatial Distribution of Development Levels of the Digital Economy

Figure 4 shows the spatial distribution of the 10-year overall level of digital economic development in 13 provinces in China’s main grain-producing areas, in which it can be more intuitively seen that the development of the digital economy is not balanced, and the level of development of the digital economy in the southeastern coastal region is significantly better than that in the north.
Jiangsu Province, which has the best digital economy, is an important part of the Yangtze River Delta region, bordering Zhejiang and Shanghai. Zhejiang Province is home to Alibaba, one of China’s largest Internet companies, and Shanghai is one of China’s economic, financial, and trade centers, both of which have strong economic power and science and innovation capabilities. Therefore, Jiangsu Province is uniquely positioned geographically to develop the digital economy.
Heilongjiang Province, with the worst digital economic development, is geographically unique in that it is located in the most northeastern corner of China and is geographically remote. The population density is less than 70 people per square kilometer, which is one-tenth of the population density of Jiangsu Province, and the GDP has also been at the bottom of the rankings in recent years. As a traditional agricultural province, its main industries are based on large-scale agricultural production, and its industrial structure is relatively homogeneous. Various factors have led to the development of its digital economy and the environment requiring much further optimization. It is worth noting that, in the recently closed Development of Intelligent Agriculture Conference in Heilongjiang Province, 23 leading digital economy enterprises, colleges and universities, scientific research institutions, and intelligent agriculture service enterprises reached a consensus on strategic cooperation aimed at utilizing local conditions, digital technology, and the agricultural industry to further increase the depth of integration and development. Combined with the more optimistic development momentum of the digital economy in the region, this initiative will certainly bring about new opportunities for the development of the digital economy in Heilongjiang Province.

5.2. Development Level of Agricultural Green Development

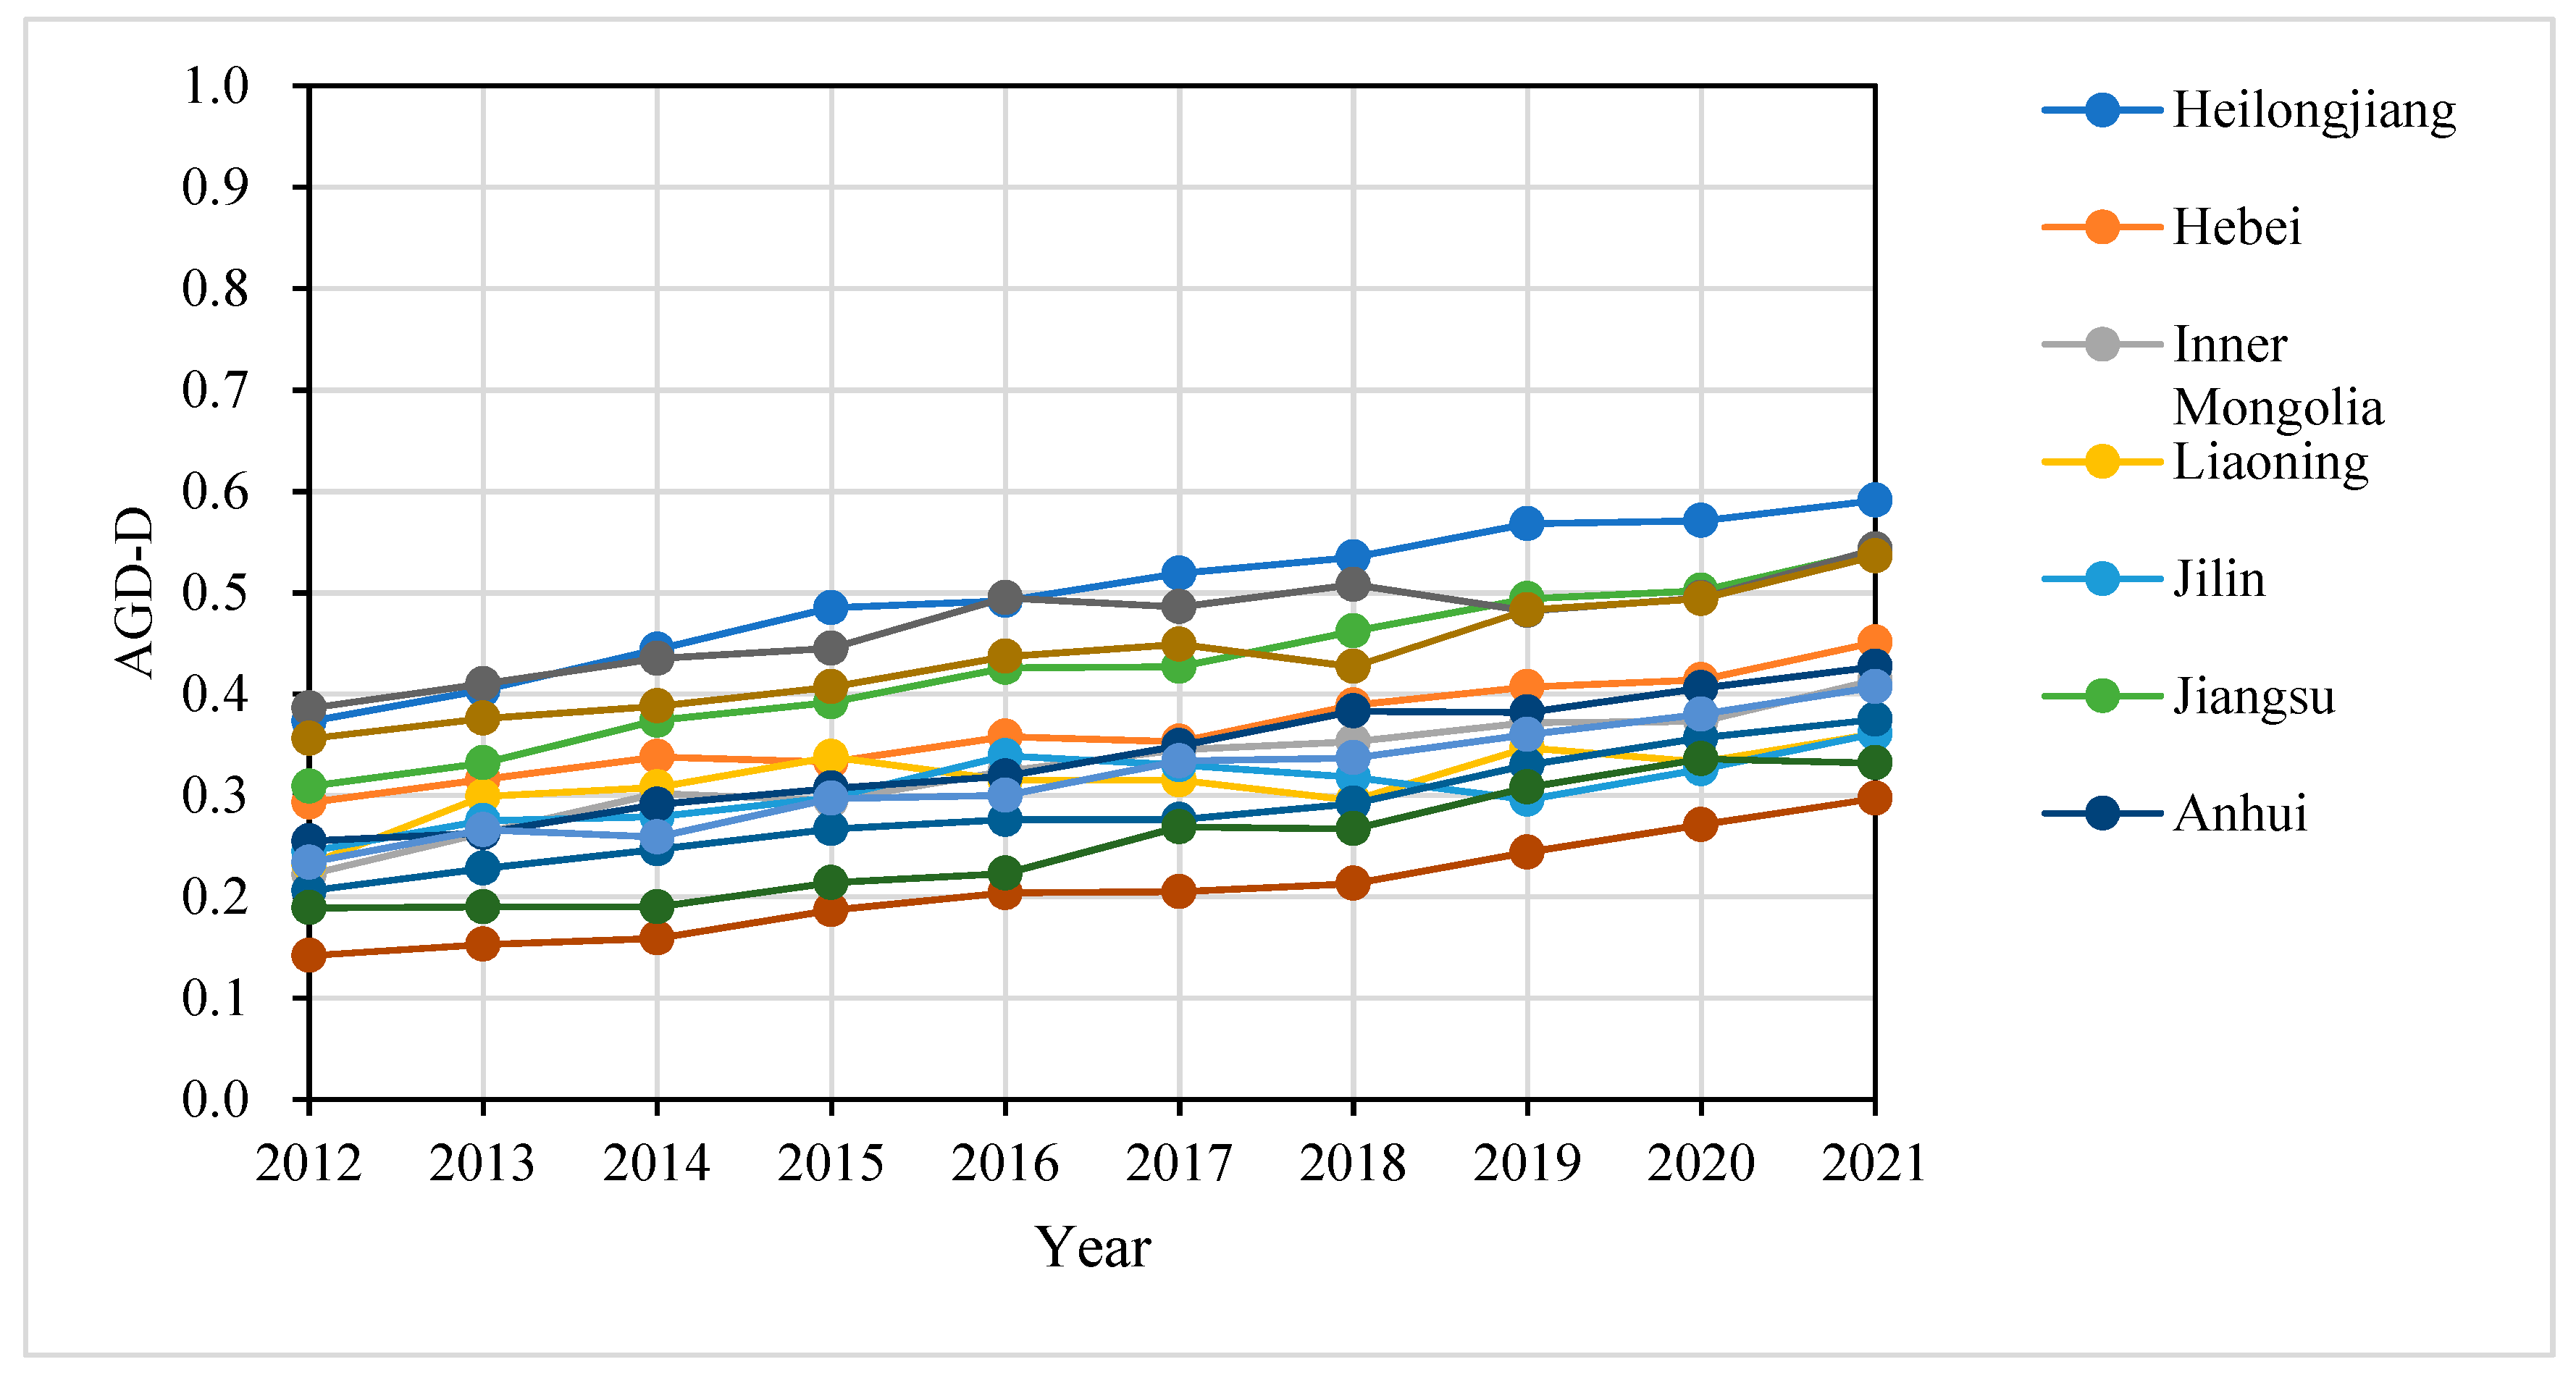
5.2.1. The Level of Development Varies over Time

Changes over time in the level of green development of agriculture in China’s main grain-producing regions are shown in Table 5 and Figure 5. Overall, the level of green agricultural development in the 13 provinces had different degrees of improvement between 2012 and 2021, but the overall degree of change was not as large as that in the level of digital economic development.
Specifically, Heilongjiang, Jiangsu, Shandong, Henan, Hebei, Inner Mongolia, Anhui, and Sichuan are the eight provinces that achieved a “Reasonable” level of green agricultural development in 2021. Within this level, four provinces, Heilongjiang, Jiangsu, Shandong, and Henan, scored higher. Liaoning, Jilin, Jiangxi, Hunan, and Hubei are the five provinces with poor agricultural green development levels, only reaching the “Average” level, with Jiangxi ranking last.
It is worth paying attention to Heilongjiang Province because of its superior agricultural green development score compared to all the other provinces. In the 10-year study period, in only one year, 2016, was it slightly behind Shandong Province; in the other nine years, it remained first. This shows that Heilongjiang Province has a relatively strong foundation for the green development of agriculture. On the one hand, it constantly adheres to the innovation and promotion of agricultural science and technology (at present, the province has more than 6000 monitoring points for crop pests and epidemics, 19,000 sets of supporting monitoring equipment, and 31,000 plant protection drones, which is the highest number in the country). On the other hand, it continues to promote the reduction in fertilizer and pesticide application (there are more than 70 demonstration projects of green prevention and control technologies in the province). There have been many initiatives to protect black soil arable land resources and to achieve the green development of agriculture in this province, also leading to the spread of advanced ideas about the green development of agriculture to other provinces.
Another province of note is Jiangsu Province, which has achieved similar results despite having less arable land resources than Heilongjiang Province. The reason for this can be attributed to various factors. On the one hand, the fact that Jiangsu Province has a relatively rich array of green financial instruments helps in its agricultural development. The Bank of Jiangsu is the country’s second equatorial bank, and the Bank of Nanjing (Nanjing is the capital of Jiangsu) set up a green finance working group as early as 2014. The number of green insurance businesses, such as those in the fields of environmental pollution liability insurance, agricultural catastrophe insurance, and ship pollution liability insurance, is quite high. On the other hand, the reformation of the certification system for pollution-free agricultural products and the construction of green and high-quality agricultural product bases in Jiangsu Province were both carried out very early. Jiangsu Province is the largest province in China in terms of the number of green food enterprises, with a total of 2484 green food enterprises, 145 organic agricultural enterprises, and the implementation of 64 geographical indications of agricultural products protection projects. The huge economic aggregation and the continuous optimization of the industrial structure have provided strong support for the green development of agriculture.
The lowest score is displayed by Jiangxi Province. On the one hand, its total area of arable land is the lowest among the 13 grain-producing areas; on the other hand, according to the statistics of Jiangxi Province Agricultural and Rural Affairs Department over the years, the average annual level of land output in Jiangxi Province is only 70% of the national average, indicating that the effectiveness of the use of land is not sufficient. Jiangxi Province is an economically underdeveloped province, with less financial support, and the green development of agriculture faces greater constraints in terms of resources and economic benefits. However, what is encouraging is that its agricultural green development score rose from 0.142 in 2012 to 0.294 in 2021, with a percentage increase of more than 100 percent, which is the highest among all the provinces within the scope of this study, indicating that a series of green development policy initiatives have begun to bear fruit, and the gap in the level of green development in agriculture is expected to become smaller and smaller.

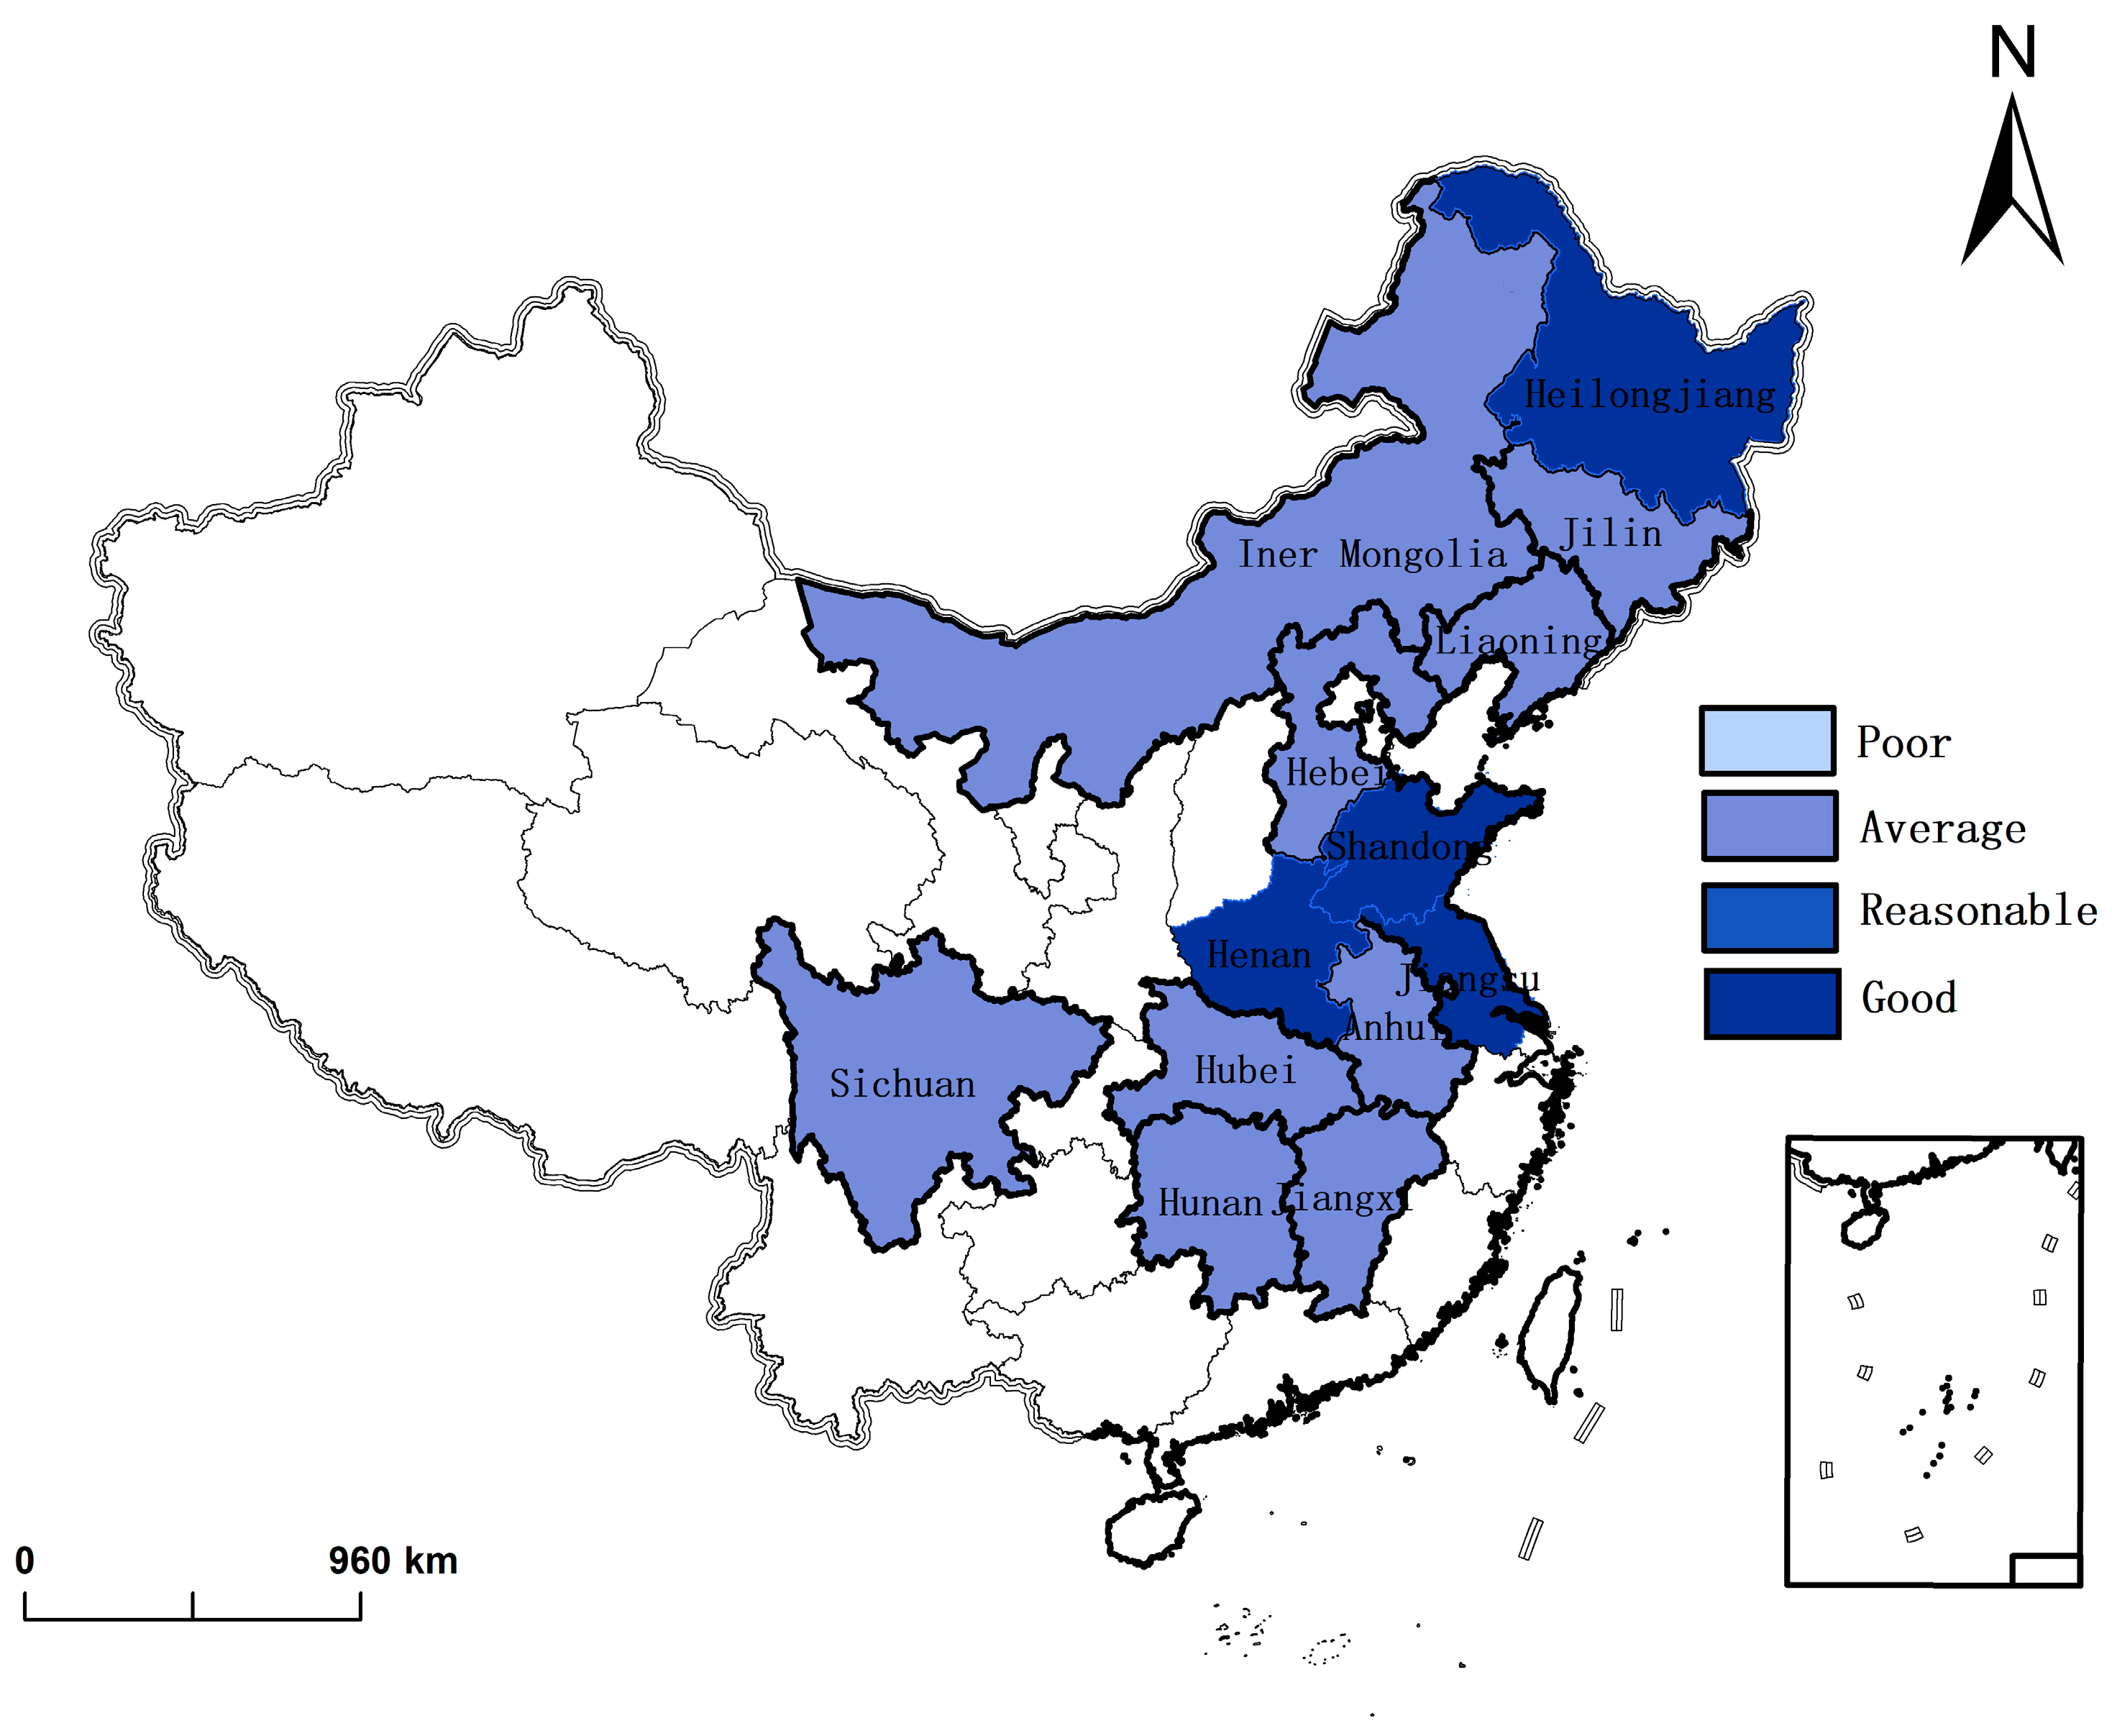
5.2.2. Spatial Distribution of the Development Level of Agricultural Green Development

Figure 6 shows the spatial distribution of the overall level of agricultural green development in 13 provinces in China’s main grain-producing areas over the past 10 years. In the map in Figure 6, it can be seen that the four provinces of Heilongjiang, Jiangsu, Shandong, and Henan, which have the highest level of agricultural green development among China’s main grain-producing areas, are geographically located mainly in the Northeast Plain, the Lower Yangtze River Plain, and the North China Plain. Heilongjiang, Henan, and Shandong Provinces rank among the top three provinces in China with regard to arable land. Although the arable land area of Jiangsu Province is not as large as the others, the plains in this province account for about 87% of the province’s area, and there are many lakes, and the proportion of both plains and water areas ranks first among all provinces in the country. Therefore, outstanding achievements in agricultural green development need to have the corresponding support of agricultural resources to a certain extent.
Geographically, the worst level of green development of agriculture can be seen in Jiangxi Province; its terrain is mainly mountainous and hilly, limiting large-scale agricultural development and mechanization development, thus affecting production efficiency. However, Sichuan Province also has topographical problems, with nearly 80% of the province’s arable land being located in hilly and mountainous areas, and there are many slopes greater than 6°, representing “slope arable land”. Although the arable land environment in Sichuan Province is complex, the green development of agriculture in this province can still achieve much better results than in Jiangxi Province, which may be attributed to reducing the use of continuous agricultural enhancements such as fertilizers and pesticides, reducing the impact on the environment. More than 50 percent of this province’s arable land has been built to a high standard of dry and flood-proof farmland, the effective use coefficient of farmland irrigation water has reached 0.57, the use of fertilizers and pesticides has been growing negatively for six consecutive years, and the utilization rate of livestock and poultry manure has exceeded 76 percent, while the utilization rate of crop stalks has exceeded 88 percent.
It can be seen that the richness of arable land resources can indeed limit the level of green agricultural development, but the backwardness of arable land resources is not enough to lead to the worst level of green agricultural development.

5.3. Comparison of the Two Systems

In this study, in order to investigate whether the development levels of the two subsystems, the digital economy and agricultural green development, are synchronized in the development process over time, the score of the development level of the digital economy (D1) is compared with the score of the level of green development of agriculture (D2), and the difference between D1 and D2 in each province from 2012 to 2021 is organized over time, as shown in Figure 7.
From the perspective of the change in the score gap between the two systems in each province, 77% of provinces displayed a decrease in the score gap between the two systems of the digital economy and agricultural green development during the period of 2012–2021 (the closer the value is to 0, the more the gap decreases), and only three provinces displayed an increase in the score gap. Therefore, in order to carry out a more detailed analysis, this study classified the regions with a score difference between the digital economy and agricultural green development systems higher than 0.1 or lower than −0.1 as displaying unbalanced development of the two systems. According to the classification rule, it can be seen that in 2012, 10 out of 13 provinces had uneven development between the two systems, accounting for 77%. By 2021, only 6 of the 13 provinces had unbalanced development of the two systems, accounting for 46%, a reduction of more than 40% in a decade. According to this development trend, a reasonable conclusion can be established: as time goes on, information will become smoother, resource allocation will become more reasonable, agricultural production will become more sustainable, rural living standards will be further improved, and eventually all provinces will achieve balanced development of the two systems.
Regarding the overall gap between the two systems in the provinces over the 10-year study period, it can be seen that the score difference between the two systems in most provinces is negative. This indicates that as far as the two subsystems of this study are concerned, most regions are still in a relatively backward state of digital economic development, and only one province, Jiangsu Province, displays development of the digital economic system that is ahead of the agricultural green development system. Therefore, in order to truly achieve the goal of balanced development of the two systems, local governments should focus on improving the coordination ability of infrastructure construction, service environment, talent teams, and other aspects of the digital economy in their future development plans so that the digital economy can be combined with the regional comparative advantages of the agricultural industry in accordance with local conditions so as to obtain the best development benefits of the digital economy, further narrowing the development gap between the two systems.

5.4. Development Level of CCD

5.4.1. Change in CCD over Time

Figure 8 depicts the CCD results of the two systems of the digital economy and agricultural green development over time in 13 provinces in China’s main grain-producing areas. The core idea of “system theory” can be summarized as follows: any system is an indivisible whole formed by the interconnections and interactions between its constituent elements. In addition, the system, as an organic whole, performs functions that cannot be performed by the constituent elements in isolation. In short, “system theory” emphasizes not only the importance of the whole but also the importance of the optimal combination of the constituent elements of a system. The above core concepts are in line with the actual situation described in this paper. Therefore, if the results of CCD are analyzed from the perspective of “systems theory”, they can demonstrate the following:
(1) The principles of wholeness, openness, and dynamics emphasized in “system theory” reveal that the components of a system will interact with each other to achieve the transition from disordered to orderly and coordinated development. In this study, China’s main grain-producing areas achieved different degrees of CCD increases over the ten-year study period, generally transforming the two subsystems from “uncoordinated” to “coordinated”. This shows that the digital economy promoted the transition of agricultural development to greening through the innovation of digital technology, and the green development of agriculture provided a broader application space for the development of the digital economy through the improvement of the environment and other means. This causes the initial penetration and coordinated development between the two relatively independent subsystems through interaction.
(2) The principles of self-organization, feedback, and hierarchical structures in systems theory combine to show that systems develop a stable and sustainable developmental structure due to the presence of multiple feedback mechanisms between the various elements over time. In this study, the CCD scores continue to rise after reaching the “coordinated” level, which confirms the above viewpoint of system theory. Specifically, new science and technology brought by the development of the digital economy will directly improve the level of the “advanced technology and industrial upgrading” indicator of agricultural green development, which will in turn promote the development of the whole agricultural green development system. The effectiveness of agricultural green development will in turn provide new development opportunities regarding the “Environment” indicator of the digital economy, thus promoting the development of the entire digital economic system. It is the establishment of a virtuous circle such as the above that causes the interaction between these two subsystems to continue to increase, prompting the coupling degree of coordination to continue to rise, leading to the self-optimization and development of the system.

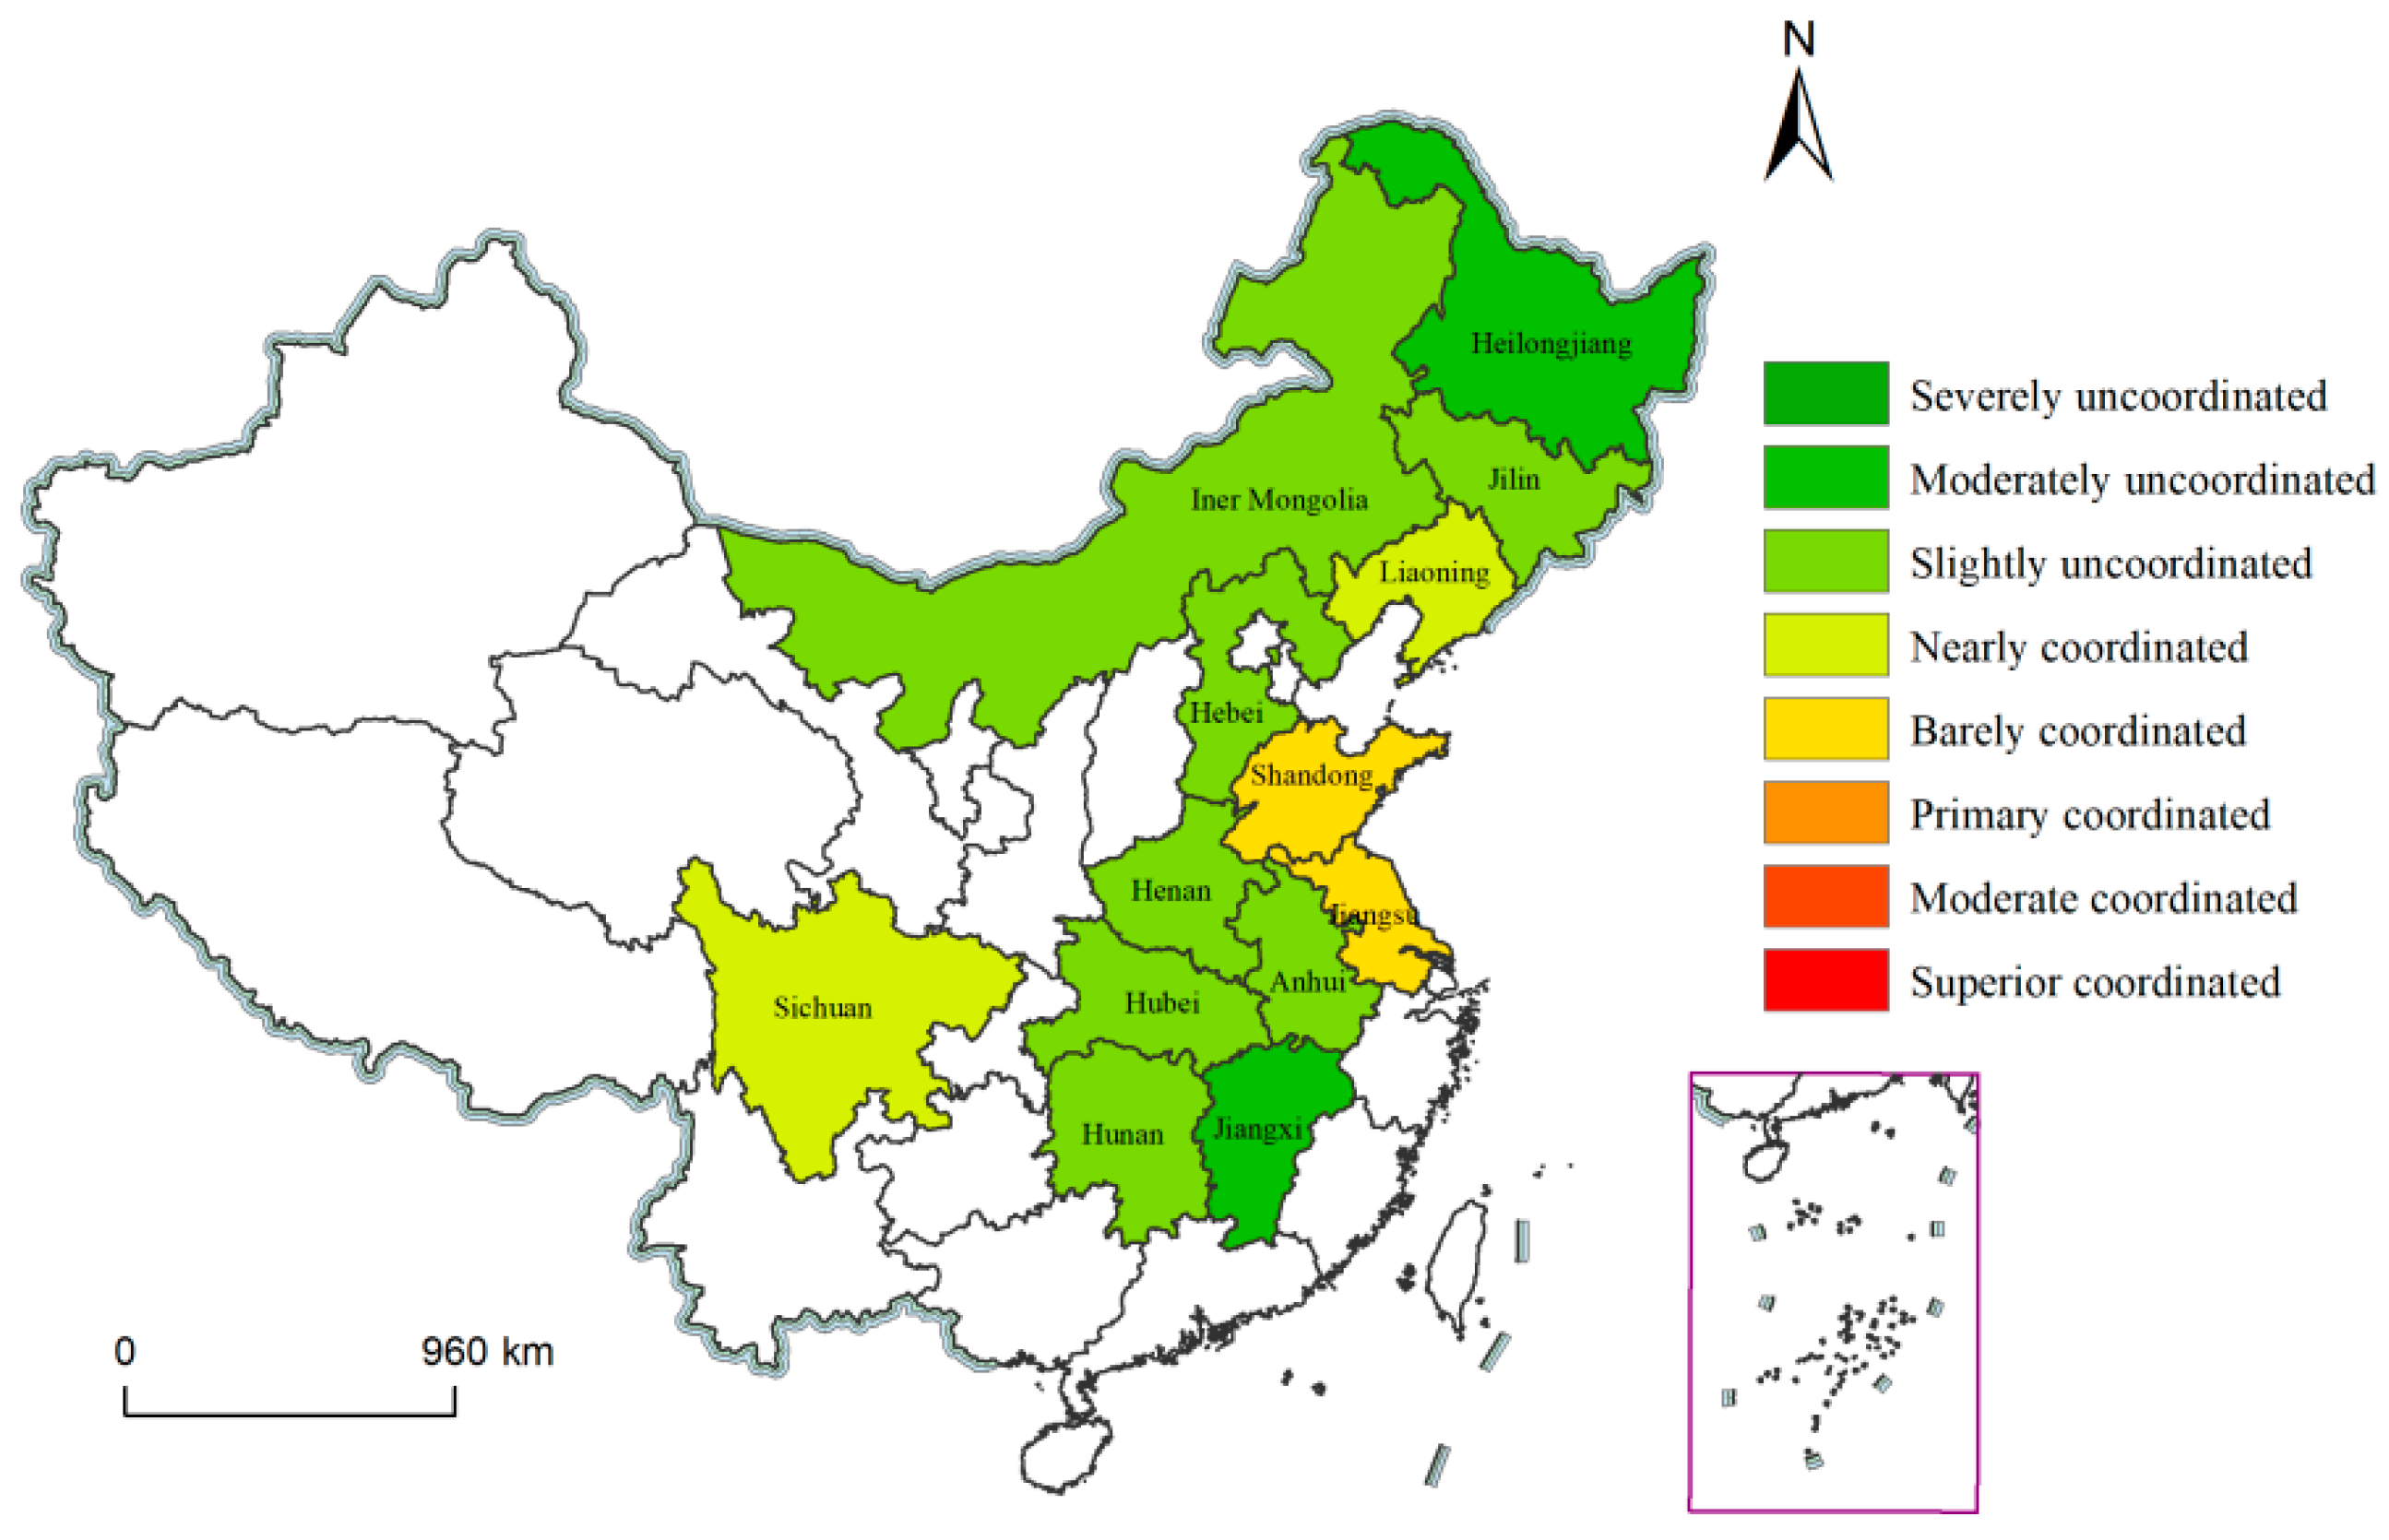
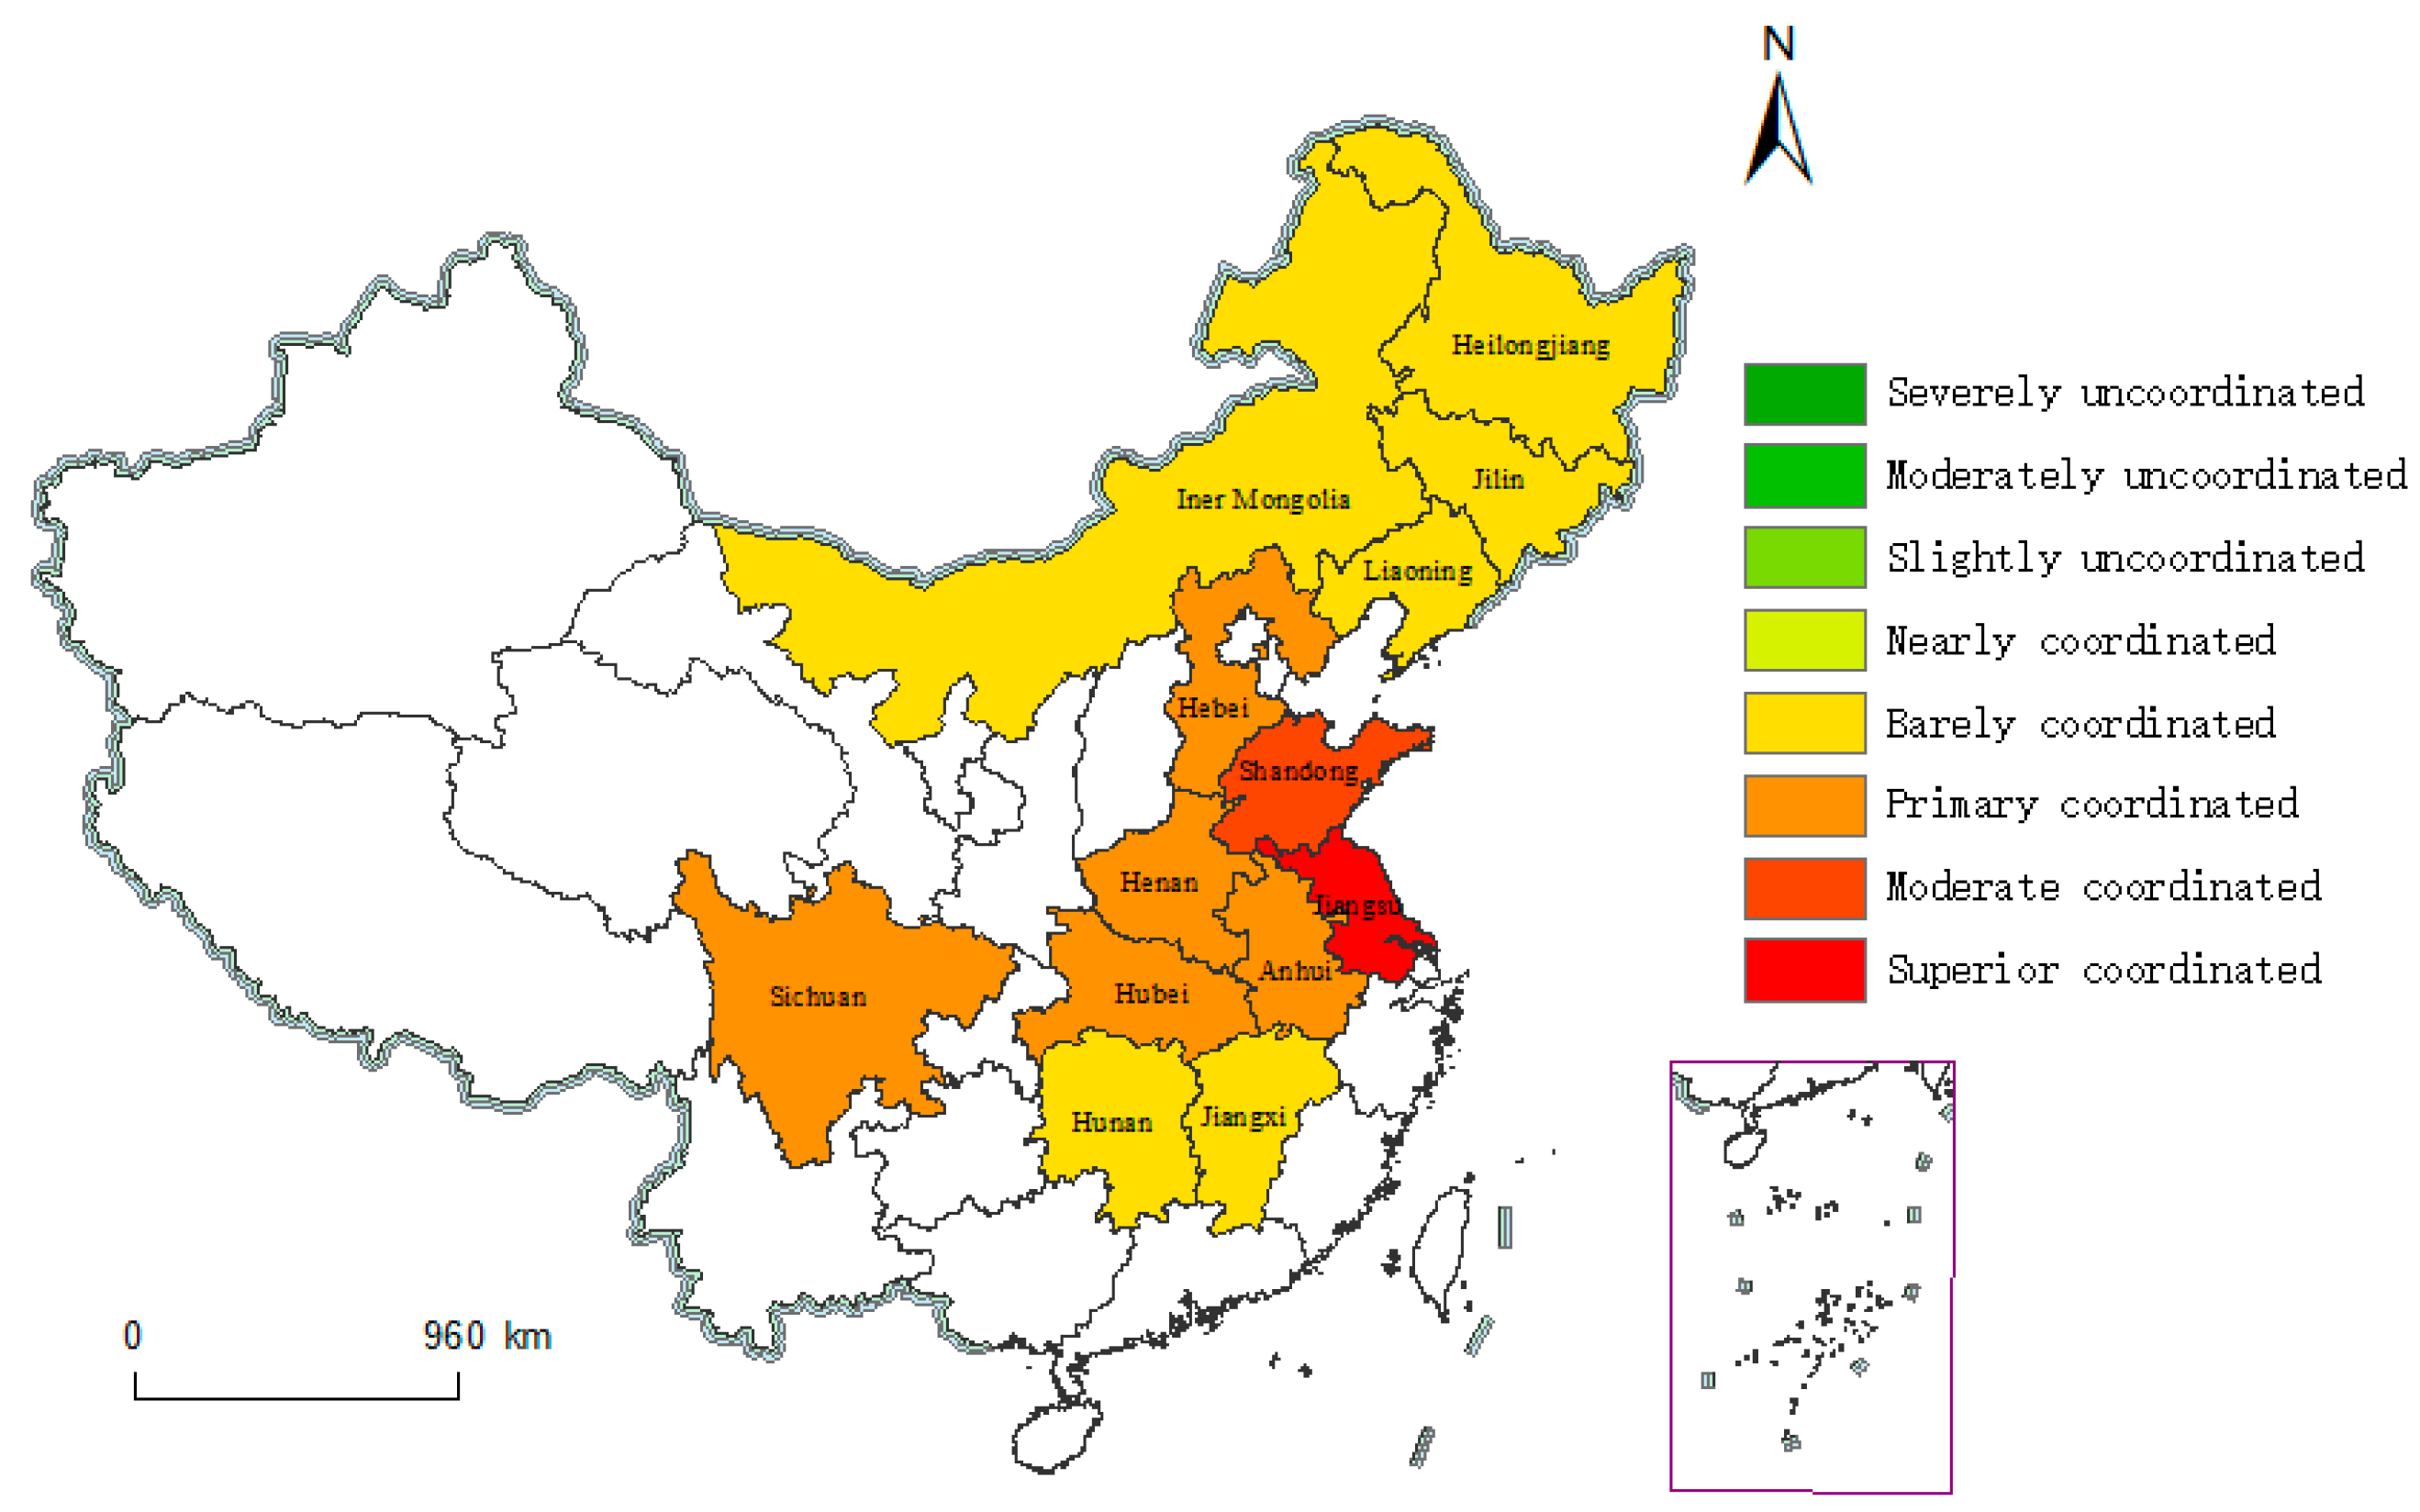
5.4.2. Spatial Evolution of CCD

The scores of CCD in the first and last years within the scope of this study are compared in space (Figure 9 and Figure 10). It can be seen more intuitively that CCD improved in every region during the study period, and the coupling and coordinated development of the digital economy and agricultural green development in China’s major grain-producing areas have already provided initial results. However, the amplitude of CCD improvement varies greatly among different regions, and the results of provinces located in coastal areas are obviously better than those in Northeast China.
A representative coastal area is Jiangsu Province, whose CCD developed from “Barely coordinated” to “Superior coordinated”, which is the best CCD result among all provinces in this study scope. This result can also be confirmed in the results of the previous sections of this study. In other words, Jiangsu Province displays the best development of the digital economy, while its agricultural green development performance is also among the best, and the scores of the two systems do not show significant lag in the horizontal comparison of the 13 provinces.
Heilongjiang Province is a representative of the unsatisfactory CCD results in Northeast China. Its score can also be seen in previous sections. While its score for the digital economy system ranks at the bottom in the whole research scope, its score for the agricultural green development system ranks first in the research scope; the development of these two systems appears extremely unbalanced and there is an extreme lagging phenomenon in the horizontal comparison of the 13 provinces.
In addition to the great difference between the highest score and the lowest score, the score span of CCD among other provinces in the study area is quite broad. This shows that even though the digital economy and agricultural green development both display a “technology spillover effect”, it still takes some time or corresponding measures to promote communication and cooperation among provinces in major grain-producing areas such as resource sharing, information exchange, and system construction. In this way, we can give full play to the positive role of “positive externalities” for neighboring provinces, prevent “technology spillover” from being wasted, narrow the CCD score gap between regions, and jointly promote the coupling and coordinated development of the digital economy and the agricultural industry.

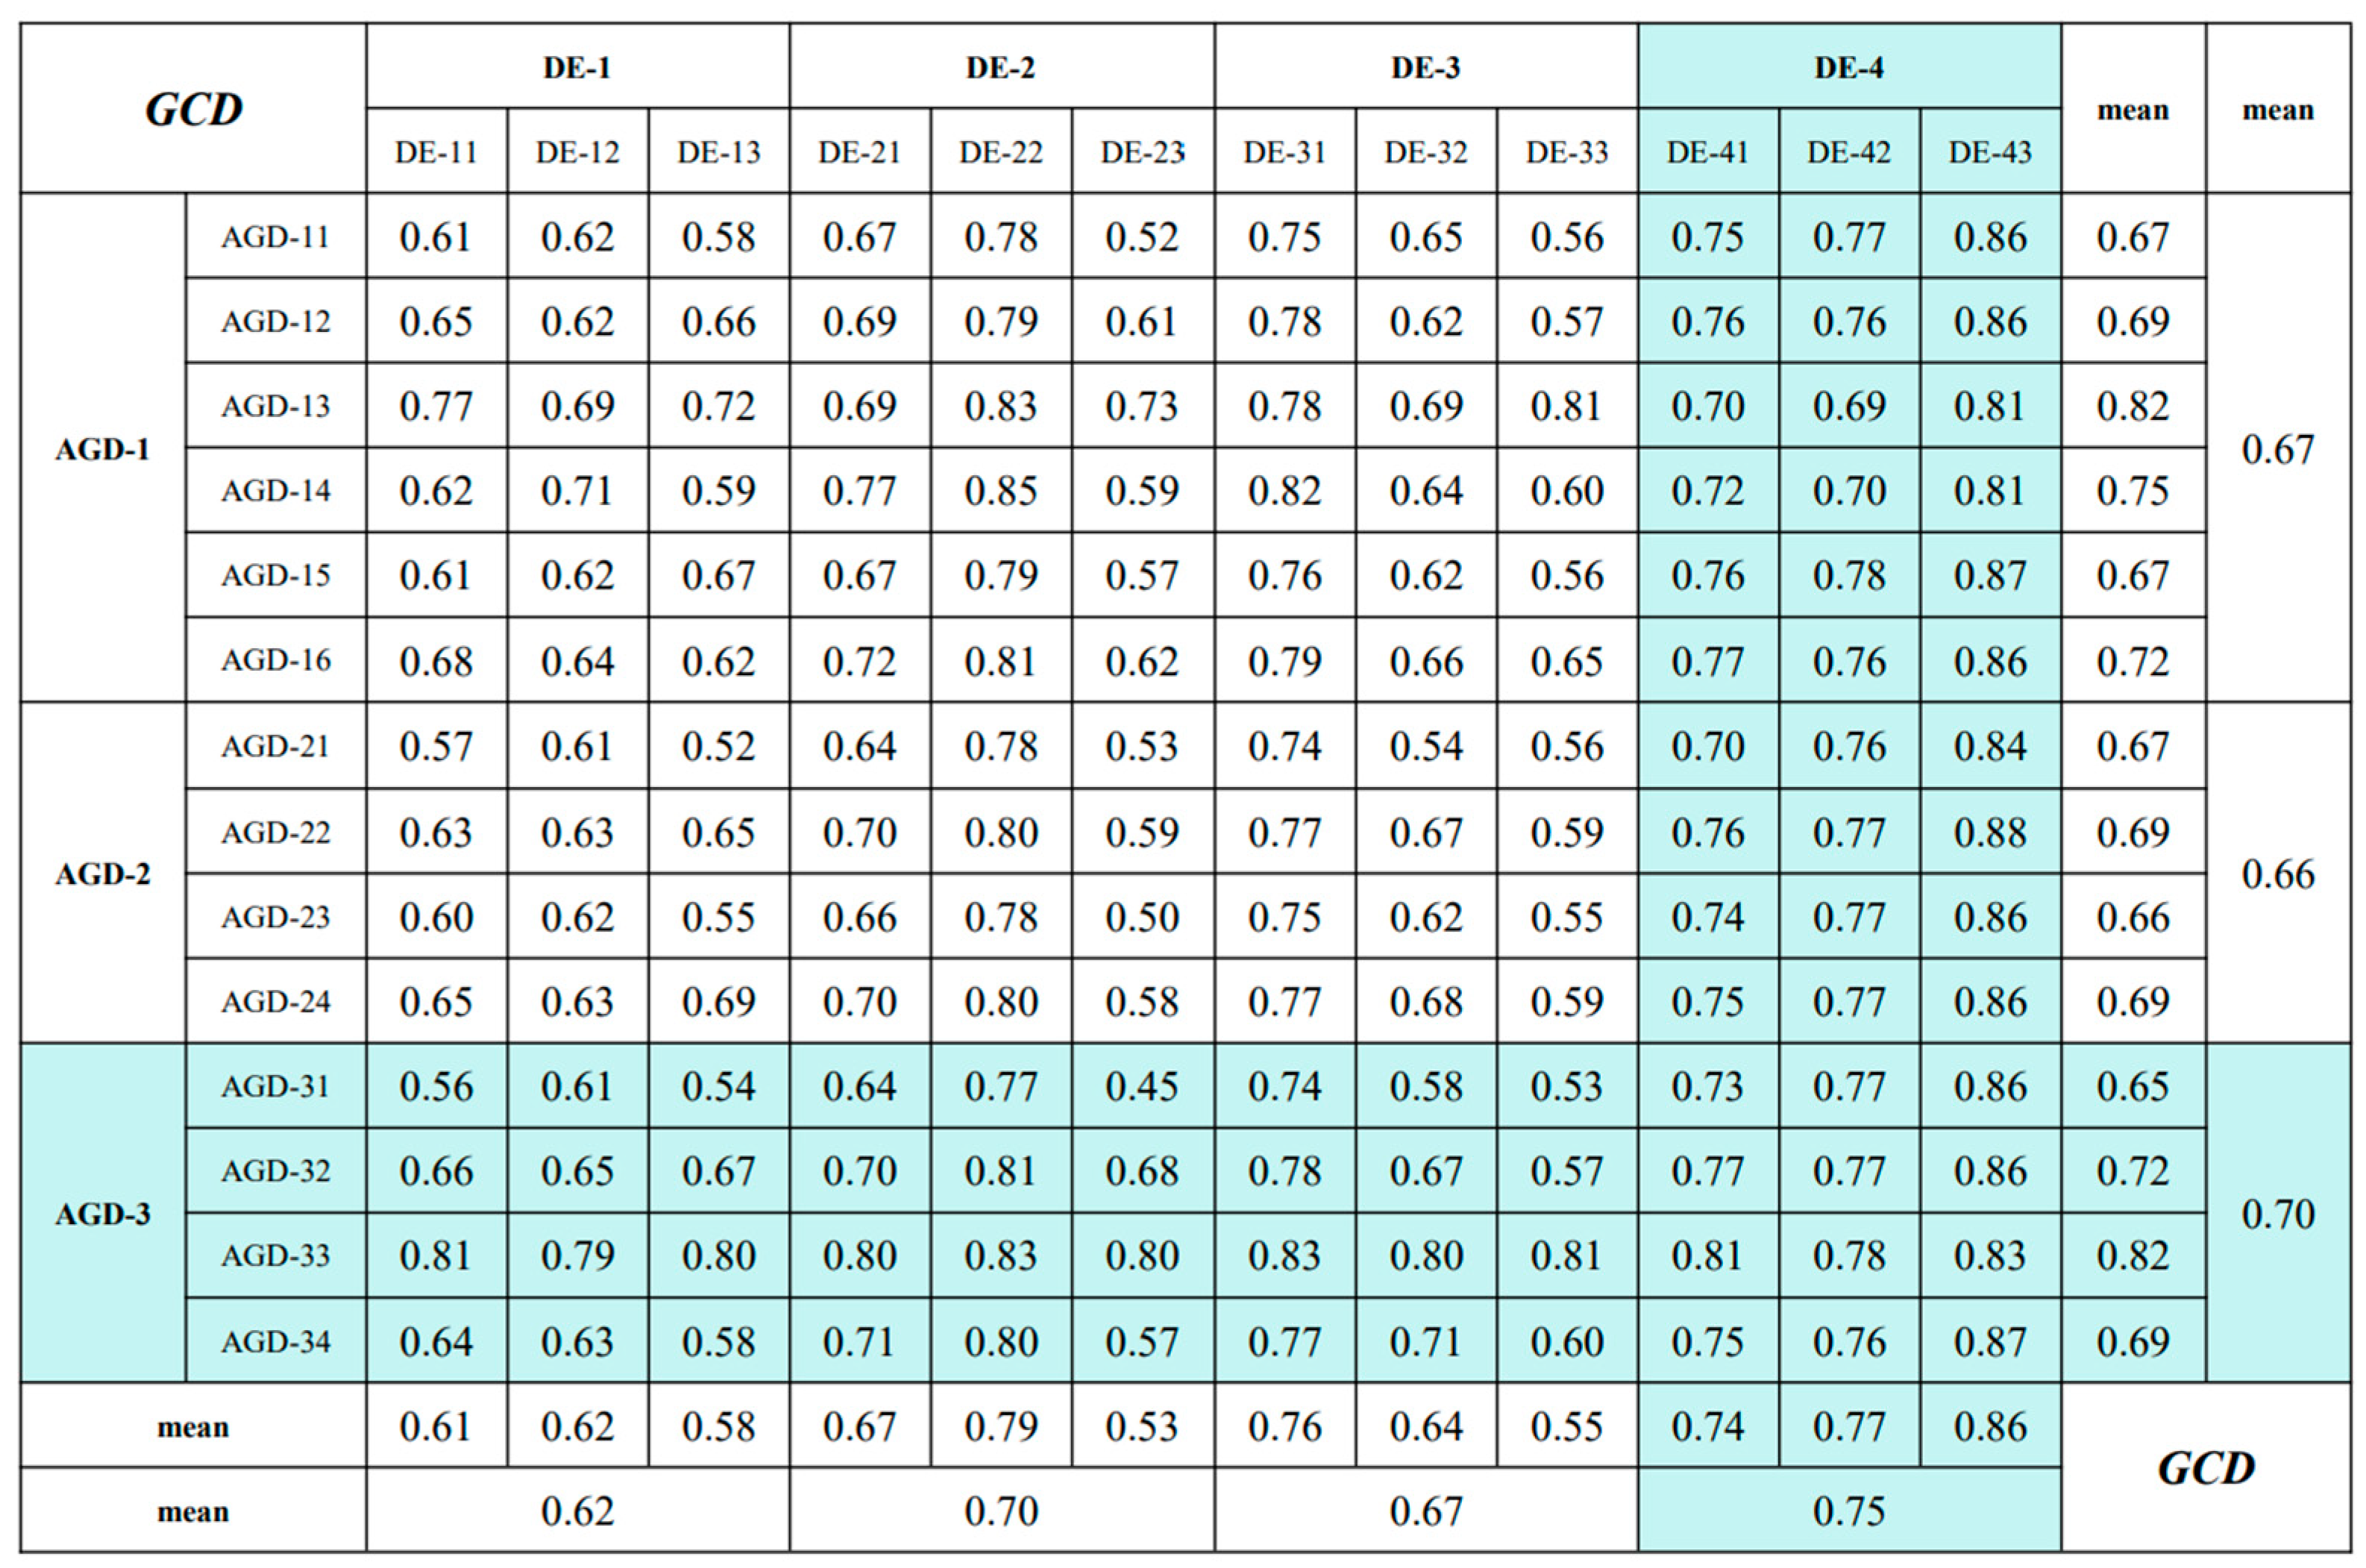
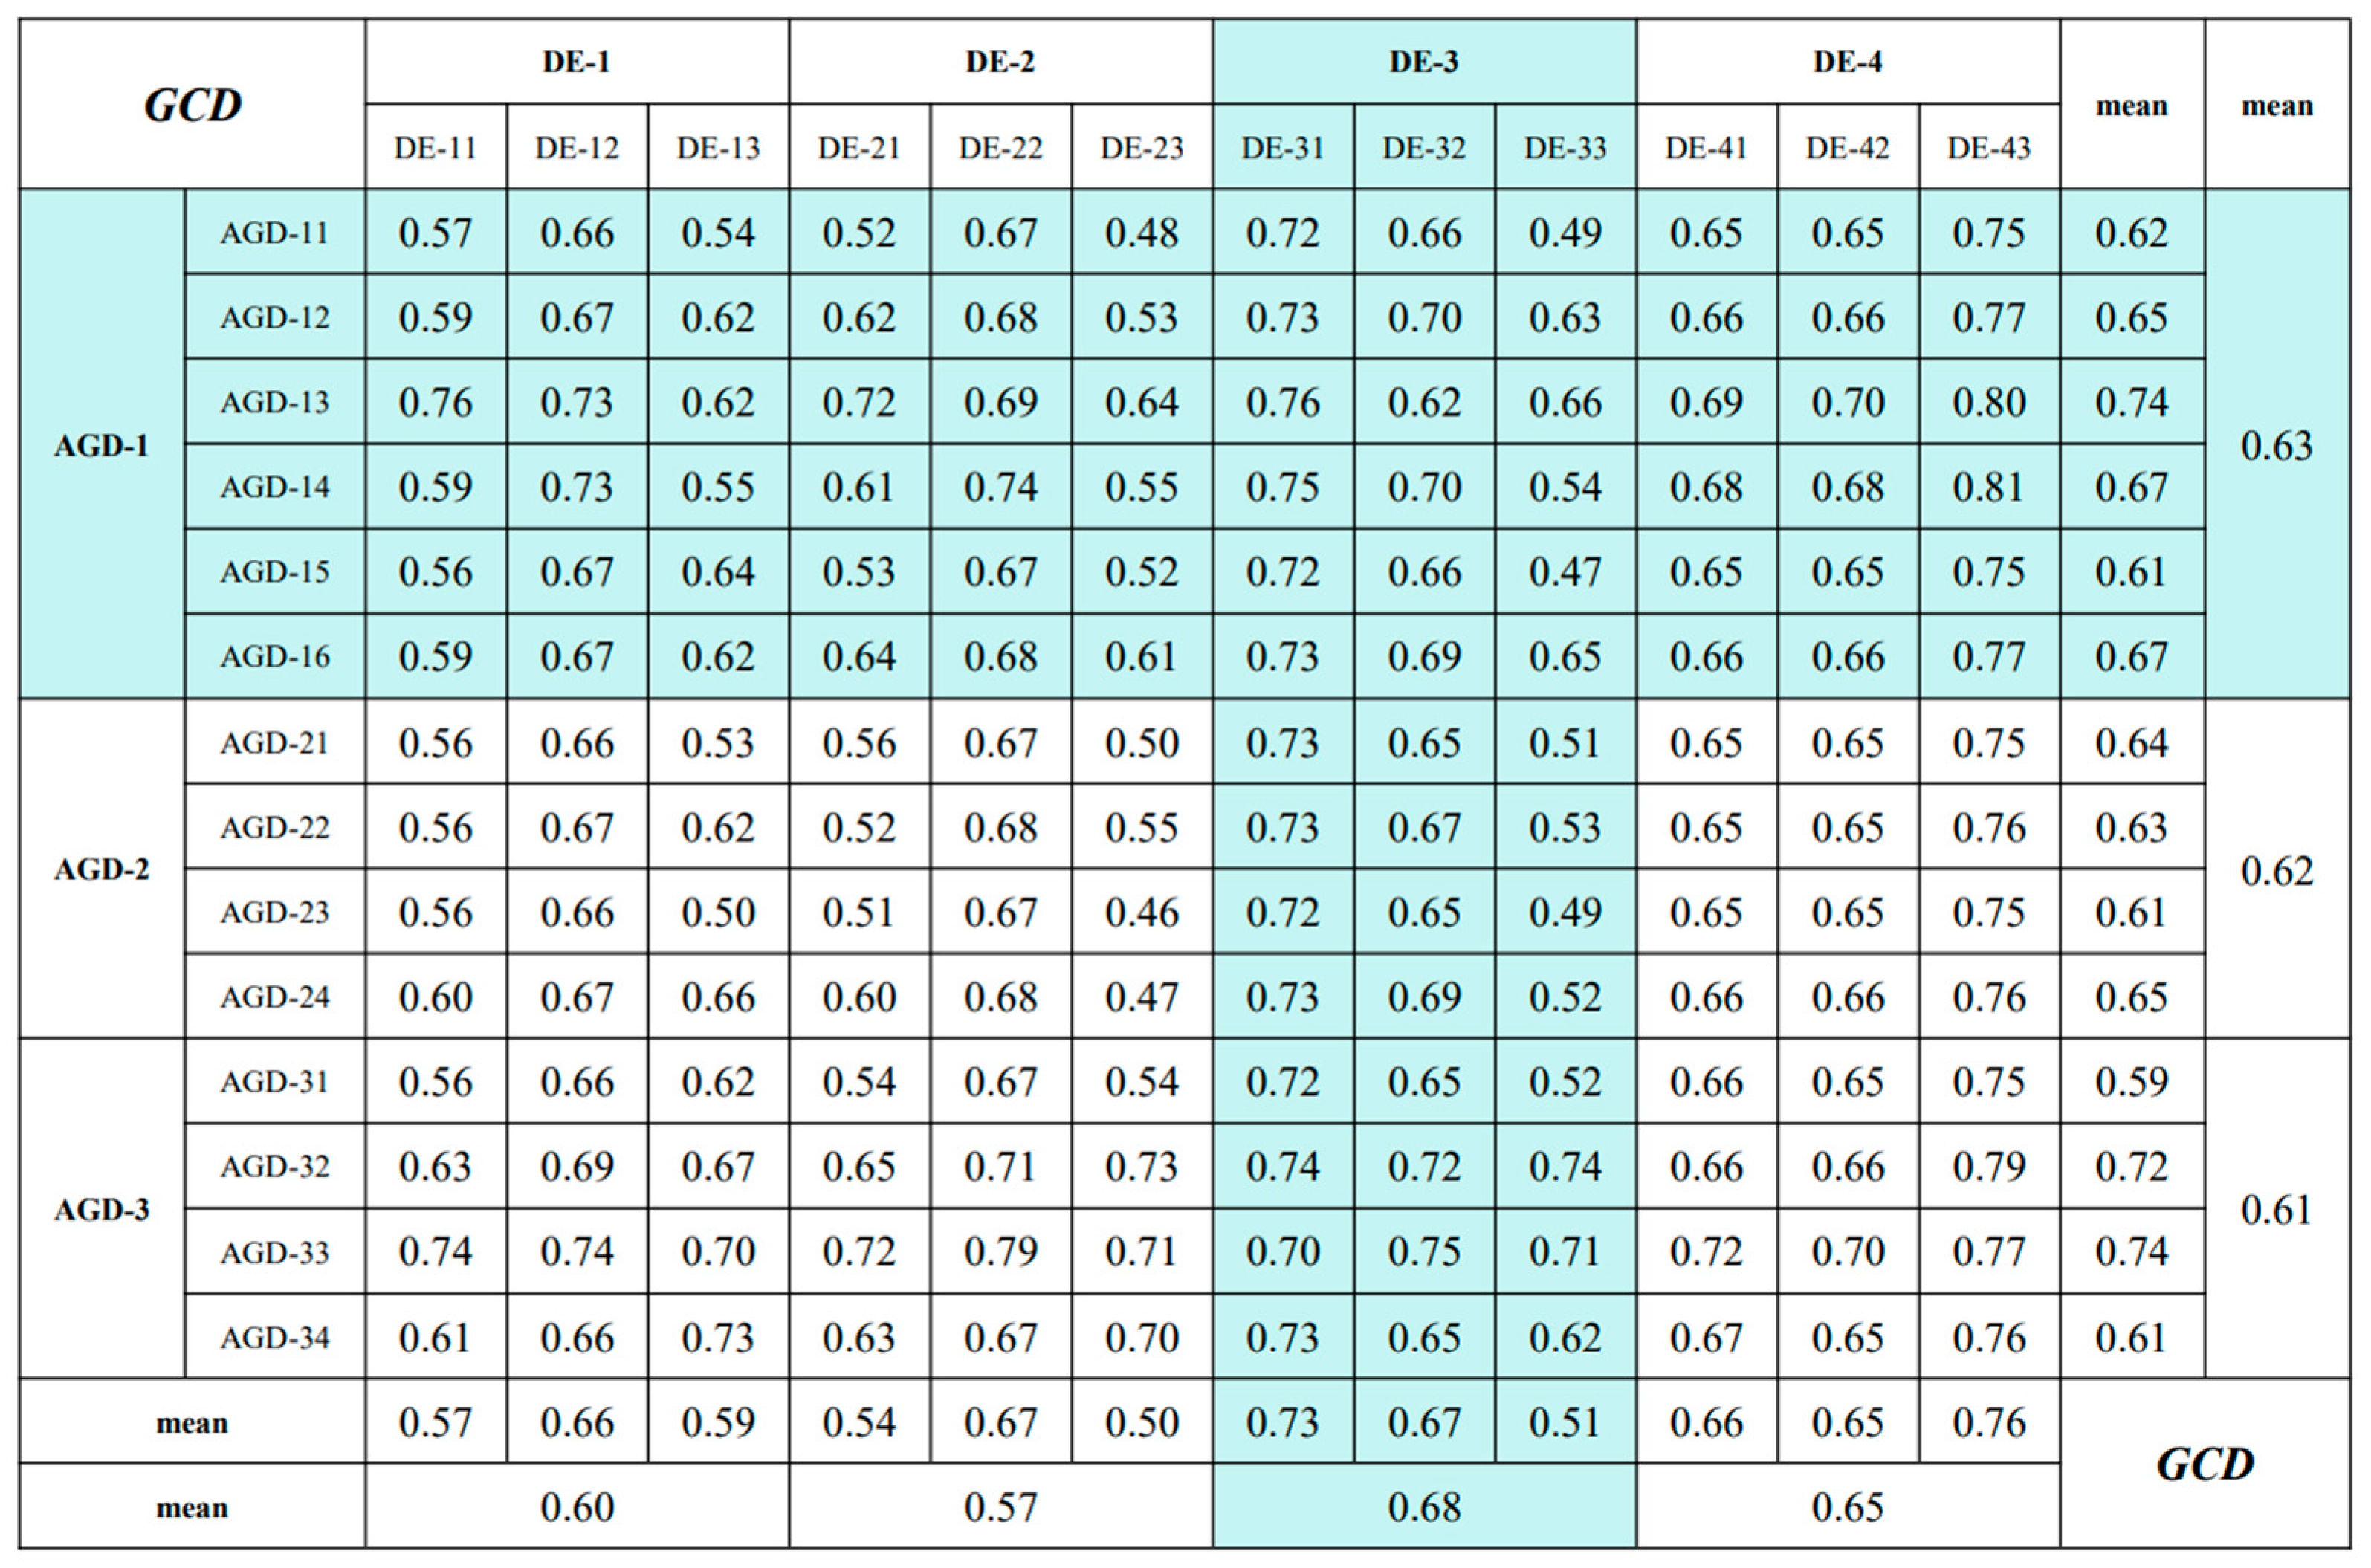
5.5. Gray Correlation Degree (GCD)

In order to conduct a deeper analysis of the CCD results calculated in the above section, the gray correlation degree (GCD) method is further used in this study to identify the major influencing factors between the two systems. The grey correlation degree matrix for 2012 (Figure 11) and 2021 (Figure 12) is obtained as follows: the larger the GCD score of each indicator or variable is, the more obvious the interaction relationship and the correlation are. The main influencing factors are highlighted by color.

5.5.1. Influencing Factors of the Digital Economy on Agricultural Green Development

In 2012, the main influence of the digital economy on the greening of agriculture was the “Output (DE-4)” indicator of the digital economy system, which describes the results of the development of the digital economy. In this indicator, the variable “Number of invention patent applications (granted) (DE-43)” has a GCD of 0.86, which is the highest GCD value among the three variables of the “Output (DE-4)” indicator. This variable can relatively intuitively reflect the level of innovative science and technology development and transformation in the region in that year. This shows that in 2012, the improvement in science and technology brought about by the development of the digital economy was the main way in which the digital economy influenced the green development of agriculture. In addition, although the variable “Number of postal and express parcels (ten thousand pieces) (DE-22)” is not included in the “Output” indicator, its GCD is as high as 0.79. This variable can be a more intuitive response to the degree of public use of e-commerce in the region, which is an important channel for the integration of the digital economy and the traditional real industry and is an important part of the environment for the development of the digital economy. This shows that, in 2012, the change in the degree of public adoption of this newly emerging economic model can influence the effect of the digital economy to empower the green development of agriculture.
In 2021, the indicator with the highest GCD score among the four indicators of the digital economy system was the “Input (DE-3)” indicator. This means that, after ten years of development, the existing digital technology had been rapidly popularized and applied to all aspects of agricultural green development following the development of the digital economy. Therefore, by 2021, the existing scientific and technological achievements of the digital economy could not meet the increasingly strong demand for digital technology in agricultural green development. Thus, the input strength of the digital economy becomes a new important influencing factor affecting the green development of agriculture. In terms of specific variables, “R&D expenditure of industrial enterprises above designated size (DE-31)” has the highest GCD score among the three variables included in the “Input (DE-3)” indicator. This variable can reflect the intensity of these industrial enterprises’ investment in exploring new science and technology such as efficient agricultural machinery and equipment, environmentally friendly agricultural production methods, intelligent agricultural management systems, etc., and even indirectly reflect the importance of society as a whole to scientific innovation. This further confirms that financial support for scientific and technological innovation and research is particularly important in the process of the digital economy affecting the green development of agriculture innovation.

5.5.2. Influencing Factors of Agricultural Green Development on the Digital Economy

In 2012, the indicator “advanced technology and industrial upgrading (AGD-3)” in the agricultural green development system had the highest GCD score. It can be seen that the urgent demand for advanced technology and industrial upgrading in agricultural green development is the main influencing factor promoting the development of the digital economy, because this indicator can comprehensively reflect the degree of application of environmentally friendly science and technology in all aspects of agricultural production and the rationality and scientificity of the current agricultural industrial structure. It is a central indicator in the green development of agriculture. Specifically, the GCD score of the variable “the proportion of facility agriculture (AGD-33)” is higher than the GCD scores of the other three specific variables in the indicator, and even the highest GCD score of almost all variables in the whole agricultural green development system in that year. This variable refers to a new production technology system that is highly dependent on advanced industrial production methods. Thanks to its ability to efficiently utilize clean energy sources such as solar and wind, it is able to meet the diversified and multi-level demands of the agricultural market without burdening the sustainable development of agriculture. The fact that this variable has the highest correlation with the digital economy system further confirms that the process of transforming agricultural production methods to sustainable ones will provide more application scenarios for the digital economy, thus promoting its development.
After 10 years of development, the indicator with the highest impact factor was “resource utilization and environmental protection (AGD-1)”. This indicator reflects the main issues to be addressed in the process of transforming agricultural production in a sustainable way. It shows that in the process of green development of agriculture, whether resources can be utilized scientifically and rationally and whether the environment can be effectively protected and improved will provide a particularly important foundation and guarantee for the development of the digital economy in the future.
In a nutshell, the changes in the main influencing factors in the ten-year study period reveal that the sustainable development of agriculture relies heavily on the scientific and technological development brought about by the development of the digital economy. At the same time, the strengthening of resource utilization and environmental protection should be prioritized so that the development of the digital economy can be empowered more effectively through the green development of agriculture, in order to achieve the future development of the two subsystems with efficient mutual promotion and efficient synergistic development, and ultimately achieve a high level of sustainable agricultural development.

5.6. Discussion

This chapter discusses and explains the research results of this paper and presents several new discussion topics in order to provide new working ideas for policymakers.
(1) The three provinces with the least favorable CCD are all located in the northeast, a result that reflects the serious imbalance in development between the two subsystems (the level of green development in agriculture is significantly better than the level of development of the digital economy). This serious imbalance reveals that the challenges faced by these regions in promoting the digital transformation of agriculture will be exceptionally difficult. Therefore, policymakers in these regions should focus their efforts on strengthening the digital economy’s infrastructure, improving digital economy-related policies and systems, and building a professional and large-scale digital workforce to make up for the shortcomings that hinder the development of the digital economy. In this way, not only will the social benefits of the digital economy rise dramatically, but the coordinated development of the digital economy and agricultural green development of the two systems will also expand, adding a new impetus to the development of the regional agricultural economy and providing strong support for the sustainable development of the social economy.
(2) The CCD level is highest in Jiangsu Province, where pesticide and chemical fertilizer application is quite high (in 2020, Jiangsu’s arable land fertilizer application was higher than the national average by nearly 57%, and its pesticide application was higher than the national average by nearly 51%); however, in the evaluation of the green development of agriculture, the results are still excellent due to the green development of agriculture through the region’s digital economy, with very high positive externalities. This has enabled this region to achieve better scores in other indicators of the agricultural green development subsystem, such as green finance and agricultural science and technology innovation, which more than compensate for the negative impact of pesticide and fertilizer use on its agricultural green development scores. Therefore, if the policymakers in these regions can pay more attention to the management of agricultural surface pollution in their future development planning, this will not only help to promote their own agricultural green development, but also further improve the coordination between the digital economy and agricultural green development in the region, and even inject new impetus for the development of the agricultural economy in other regions outside the region.
(3) By analyzing the provinces with medium to high CCD ratings, it can be seen that these regions are generally characterized by the synchronized and balanced development of the two subsystems of the digital economy and agricultural green development, and the development level of one subsystem alone is neither outstanding nor lagging behind. On the one hand, this further illustrates that if we want to realize mutual complementarity and mutual promotion through the coupled and coordinated development of various subsystems within the system, the two subsystems should complement each other in terms of the development trend and make progress together. On the other hand, it is recognized that the digital economy has a “threshold effect”, and if the development of the digital economy system in the region has not yet “crossed the threshold”, and there is no obvious “technological spillover” [31], the degree of coupling coordination will naturally be low. Therefore, the above conclusion can be generalized by combining the “wholeness” emphasized in system theory: a high level of coupled and coordinated development is needed to satisfy the conditions of “no absolute shortcomings” and a “common progress trend” at the same time. The good coupling and coordination of the elements within the system will bring about the optimization and enhancement of the function of the whole system, and this optimization and enhancement often exceeds the effect of the two systems acting individually, i.e., the system has the effect of ’1 + 1 > 2’.
(4) According to the change in the calculation results of CCD and the change in the overall level of grey correlation degree in this study, it can be seen that in the transition from uncoordinated to coordinated CCD, not only do the main influencing factors of the two systems change, but the overall correlation degree of the two systems also shows a downward trend. However, this is not a contradiction, and the phenomenon may be better understood by means of physics: in the stage of coupling coordination from scratch, a strong correlation needs to be established between the two systems to ensure cooperative operation. This is like when a car starts without considering air resistance—it needs to overcome static friction, and it needs more “power” (that is correlation) to establish and maintain this coordination relationship. However, as the coupling coordination degree rises, the collaborative operation between the two systems gradually becomes smoother, and the connection between variables may no longer need to be as close as in the initial stage. This is like when the car enters a running state, where rolling friction replaces static friction, which is usually greater than sliding friction, so the engine needs to provide less power—that is, the correlation between the variables will be weakened. In addition, from the “systems theory” perspective, the overall decrease in the degree of relatedness can be attributed to the obvious role of the feedback principle in systems theory. That is, in the process of increasing the coordination of the system, certain negative feedback may have occurred, leading to a decrease in the degree of inter-system correlation. For example, over-coordination may lead to too much dependence between systems, where a small fluctuation in one variable may have a large impact on another system, which in turn affects the correlation of the whole system.

6. Conclusions

In this study, the evaluation index system for the digital economy and agricultural green development was constructed after first theoretically analyzing the mechanism of the role between the two systems of the digital economy and agricultural green development. Then, with panel data from China’s main grain-producing areas, EW-TOPSIS was used to provide a comprehensive score for the two systems and compare their development trends over time and the development gap between regions. On this basis, a coupled coordination model was constructed to explore the dynamic evolution of the coordinated development of the two systems. After that, the grey correlation reading method was used to explore the main influencing factors of the interaction between the two systems in depth, and suggestions to improve the level of coupling coordination development when discussing the noteworthy phenomena were put forward. The main findings are as follows:
  • The level of digital economy and agricultural green development in China’s main grain-producing areas generally displayed an upward trend over the decade from 2012 to 2021. The number of provinces lagging behind in the development of the digital economy was greater than the number of provinces lagging behind in the development of the agricultural industry, so the overall development of the digital economy relatively lagged behind. The development level of both subsystems showed a clear gap between different regions, and the northeast region should address the shortcomings in its digital economic development as soon as possible, while the economically developed coastal regions should work on their sustainable agricultural production methods.
  • The degree of coupling and coordination between the digital economy and agricultural green development systems in China’s major grain-producing regions was generally on an upward trend in the decade from 2012 to 2021, with all provinces eventually having a “coordinated development” rating. Different regions displayed different rates of increase in CCD, and the gap between the first- and last-ranked CCD scores was very obvious. Therefore, policymakers should work on promoting synergistic development among different regions so that regions that have already achieved a high level of coordination can help regions with a lower level of coordination through “technological spillovers” and so on, in order to achieve common prosperity.
  • In 2012, the digital economy influenced the greening of agriculture mainly through its outputs. The green development of agriculture mainly affected the development of the digital economy through the application of advanced agricultural technology and the process of upgrading the agricultural industry. This shows that, in 2012, the output results of the existing inputs in the digital economy had an obvious positive effect on the green development of agriculture, and the green development of agriculture was positively affected by the “technological spillover” effect of the digital economy.
  • In 2021, the main influencing factor of the digital economy system on the agricultural green development system became the “Input” indicator of the digital economy system. The main influence of the agricultural green development system on the digital economy system became the indicator “Resource utilization and environmental protection” in the agricultural green development system. This proves that, after 10 years of development, there is still a need for more targeted investment in science and technology applicable to agriculture in order to meet the demand for new science and technology for the greening of agriculture. As for the green development of agriculture, it is necessary to pay more attention to the effectiveness of environmental protection and the rationality and scientificity of resource utilization in order to make the digital economy in China’s main grain-producing areas and the green development of agriculture more coordinated.

Author Contributions

H.Y., Framework design, data collection, acquisition of funds, and project supervision.; X.X., Software use, data measurement, writing and editing, production of figures and tables, and partial financial support. All authors have read and agreed to the published version of the manuscript.

Funding

This research was funded by the horizontal project “Heilongjiang Province Agricultural Digital Transformation Scheme Design” of the School of Economics and Management, Northeast Agricultural University.

Institutional Review Board Statement

Not applicable.

Informed Consent Statement

Not applicable.

Data Availability Statement

The data analyzed in this study are available from the first author, Hui Yang, upon reasonable request.

Conflicts of Interest

The authors declare no conflicts of interest.

References

  1. Dhillon, B.S.; Kataria, P.; Dhillon, P.K. National food security vis-à-vis sustainability of agriculture in high crop productivity regions. Curr. Sci. 2010, 98, 33–36. [Google Scholar]
  2. Rosenzweig, C.; Mbow, C.; Barioni, L.G.; Benton, T.G.; Herrero, M.; Krishnapillai, M.; Liwenga, E.T.; Pradhan, P.; Rivera-Ferre, M.G.; Sapkota, T.; et al. Climate change responses benefit from a global food system approach. Nat. Food 2020, 1, 94–97. [Google Scholar] [CrossRef] [PubMed]
  3. Gebresamuel, G.; Opazo-Salazar, D.; Corral-Nunez, G.; van Beek, C.; Elias, E.; Okolo, C.C. Nutrient Balance of Farming Systems in Tigray, Northern Ethiopia. J. Soil. Sci. Plant Nutr. 2021, 21, 315–328. [Google Scholar] [CrossRef]
  4. Liu, Y.; Sun, D.; Wang, H.; Wang, X.; Yu, G.; Zhao, X. An evaluation of China’s agricultural green production: 1978–2017. J. Clean. Prod. 2020, 243, 118483. [Google Scholar] [CrossRef]
  5. Adejumo, O.O. Environmental quality vs. economic growth in a developing economy: Complements or conflicts. Environ. Sci. Pollut. Res. 2020, 27, 6163–6179. [Google Scholar] [CrossRef] [PubMed]
  6. Ali, E.B.; Anufriev, V.P.; Amfo, B. Green economy implementation in Ghana as a road map for a sustainable development drive:are view. Sci. Afr. 2021, 12, e00756. [Google Scholar]
  7. Marxist. Capital; People’s Publishing House: Beijing, China, 2004; Volume 3, p. 919. (In Chinese) [Google Scholar]
  8. Zhang, Q.; Qu, Y.; Zhan, L. Great transition and new pattern: Agriculture and rural area green development and its coordinated relationship with economic growth in China. J. Environ. Manag. 2023, 344, 118563. [Google Scholar] [CrossRef] [PubMed]
  9. Chen, Z.; Sarkar, A.; Rahman, A.; Li, X.J.; Xia, X.L. Exploring the drivers of green agricultural development (GAD) in China: A spatial association network structure approach. Land Use Policy 2021, 112, 105827. [Google Scholar] [CrossRef]
  10. Wang, J.; Yang, G.; Zhou, C. Does internet use promote agricultural green development? Evidence from China. Int. Rev. Econ. Financ. 2024, 93, 98–111. [Google Scholar] [CrossRef]
  11. Järnberg, L.; Enfors Kautsky, E.; Dagerskog, L.; Olsson, P. Green niche actors navigating an opaque opportunity context: Prospects for a sustainable transformation of Ethiopian agriculture. Land Use Policy 2018, 71, 409–421. [Google Scholar] [CrossRef]
  12. Jiang, H.; Elahi, E.; Gao, M.; Huang, Y.; Liu, X. Digital economyto encourage sustainable consumption and reduce carbon emissions. J. Clean. Prod. 2024, 443, 140867. [Google Scholar] [CrossRef]
  13. Brynjolfsson, E.; Collis, A.; Diewert, W.E.; Eggers, F.; Fox, K.J. Accounting for the Value of New and Free Goods in the Digital Economy; NBER Working Papers; No. 25695; National Bureau of Economic Research: Cambridge, MA, USA, 2019. [Google Scholar]
  14. Feng, G.; Shang-guang, Y.; Yi, R. Digital economy, Green technology innovatio and carbon emission: Empirical evidence from urban level in China. J. Shanxi Normal Univ. (Philos. Soc. Sci. Ed.) 2022, 51, 45–60. [Google Scholar]
  15. OECD. Measuring the Digital Economy: A New Perspective; OECD Publishing: Paris, France, 2014. [Google Scholar]
  16. Cong, L.W.; Xie, D.; Zhang, L. Knowledge accumulation, privacy, and growth in a data economy. Manag. Sci. 2021, 67, 6480–6492. [Google Scholar] [CrossRef]
  17. Jing, W.; Sun, B. Digital economy promotes sustainable economic development: A theoretical analysis framework. J. Econom. 2019, 242, 66–73. [Google Scholar]
  18. Ma, X.; Feng, X.; Fu, D.; Tong, J.; Ji, M. How does the digital economy impact sustainable development?—An empirical study from China. J. Clean. Prod. 2024, 434, 140079. [Google Scholar] [CrossRef]
  19. Sparrow, R.; Howard, M. Robots in agriculture: Prospects, impacts, ethics, and policy. Precis. Agric. 2021, 22, 818–833. [Google Scholar] [CrossRef]
  20. Harou, A.P.; Madajewicz, M.; Michelson, H.; Palm, C.A.; Amuri, N.; Magomba, C.; Semoka, J.M.; Tschirhart, K.; Weil, R. The joint effects of information and financing constraints on technology adoption: Evidence from a field experiment in rural Tanzania. J. Dev. Econ. 2022, 155, 102707. [Google Scholar] [CrossRef]
  21. Yang, L.; Lin, Y.; Zhu, J.; Yang, K. Dynamic coupling coordination and spatial–temporal analysis of digital economy and carbon environment governance from provinces in China. Ecol. Indic. 2023, 156, 111091. [Google Scholar] [CrossRef]
  22. Wang, Z. On the Systematization and Complexity of Society and Marx’s Idea of a Community of Individuals. J. Syst. Sci. 2020, 28, 7–11. (In Chinese) [Google Scholar]
  23. Deng, X.; Xu, D.D.; Zeng, M.; Qi, Y.B. Does Internet use help reduce rural cropland abandonment? Evidence from China. Land Use Policy 2019, 89, 104243. [Google Scholar] [CrossRef]
  24. Ding, L. Digital economy, industrial agglomeration and regional economic resilience. J. Mod. Manag. Sci. 2023, 340, 132–140. [Google Scholar]
  25. Wang, J.; Song, L.; Zhang, X. Digital Economy, industrial agglomeration and innovation efficiency of regional e-commerce. J. Explor. Econ. Issues 2021, 470, 156–165. [Google Scholar]
  26. Li, X.K.; Guo, H.D.; Jin, S.Q.; Ma, W.L.; Zeng, Y.W. Do farmers gain internet dividends from E-commerce adoption? Evidence from China. Food Policy 2021, 101, 102024. [Google Scholar] [CrossRef]
  27. Ji, X.; Xu, J.; Zhang, H. Environmental effects of rural E-commerce: A case study of chemical fertilizer reduction in China. J. Environ. Manag. 2023, 326, 116713. [Google Scholar] [CrossRef] [PubMed]
  28. Cafer, A.M.; Rikoon, J.S. Adoption of new technologies by smallholder farmers: The contributions of extension, research institutes, cooperatives, and access to cash for improving tef production in Ethiopia. Agric. Hum. Values 2018, 35, 685–699. [Google Scholar] [CrossRef]
  29. Sieber, S.; Graef, F.; Amjath-Babu, T.S.; Mutabazi, K.D.; Tumbo, S.D.; Faße, A.; Gomezy Paloma, S.; Rybak, C.; Lana, M.A.; Ndah, H.T.; et al. Trans-SEC’s food security research in Tanzania: From constraints to adoption for out-andupscaling of agricultural innovations. Food Secur. 2018, 10, 775–783. [Google Scholar] [CrossRef]
  30. Zhao, P.P.; Zhang, W.; Cai, W.C.; Liu, T.J. The impact of digital finance use on sustainable agricultural practices adoption among smallholder farmers: An evidence from rural China. Environ. Sci. Pollut. Res. 2022, 29, 39281–39294. [Google Scholar] [CrossRef] [PubMed]
  31. Zha, J.; Dai, J.; Ma, S.; Chen, Y.; Wang, X. How to decouple tourism growth from carbon emissions? A case study of Chengdu, China. Tour. Manag. Perspect. 2021, 39, 100849. [Google Scholar] [CrossRef]
  32. Khan, Z.; Ali, S.; Dong, K.; Li, R.Y.M. How does fiscal decentralization affect CO2 emissions? The roles of institutions and human capital. Energy Econ. 2021, 94, 105060. [Google Scholar] [CrossRef]
  33. Khan, M.K.; Babar, S.F.; Oryani, B.; Dagar, V.; Rehman, A.; Zakari, A.; Khan, M.O. Role of financial development, environmental-related technologies, research and development, energy intensity, natural resource depletion, and temperature in sustainable environment in Canada. Environ. Sci. Pollut. Res. 2022, 29, 622–638. [Google Scholar] [CrossRef] [PubMed]
  34. Lin, S.Y. Bringing resource management back into the environmental governance agenda: Eco-state restructuring in China. Environ. Dev. Sustain. 2021, 23, 12272–12301. [Google Scholar] [CrossRef]
  35. Downey, L.; Dubois, S.; Hawkins, B.; Walker, M. Environmental Inequality in Metropolitan America. Organ. Environ. 2008, 21, 270–294. [Google Scholar] [CrossRef] [PubMed]
  36. Rehdanz, K.; Maddison, D. Local environmental quality and life-satisfaction in Germany. Ecol. Econ. 2008, 64, 787–797. [Google Scholar] [CrossRef]
  37. Marques, S.; Lima, M.L. Living in grey areas: Industrial activity and psychological health. J. Environ. Psychol. 2011, 31, 314–322. [Google Scholar] [CrossRef]
  38. Chang, C.F.; Wang, P.; Liu, J.T. Knowledge spillovers, human capital and productivity. J. Macroecon. 2016, 47, 14–232. [Google Scholar] [CrossRef]
  39. Chen, S.; Oliva, P.; Zhang, P. The effect of air pollution on migration: Evidence from China. J. Dev. Econ. 2022, 156, 102833. [Google Scholar] [CrossRef]
  40. Wang, L.; Dai, Y.; Xie, X.; Kong, D. Air Pollution and Firm Employee Mobility. Edit. Off. J. Financ. Econ. 2020, 46, 93–106. [Google Scholar]
  41. Han, X.; Wang, Y.; Yu, W.; Xia, X. Coupling and coordination between green finance and agricultural green development: Evidence from China. Financ. Res. Lett. 2023, 58, 104221. [Google Scholar] [CrossRef]
  42. Liberalesso, T.; Cruz, C.O.; Silva, C.M.; Manso, M. Green infrastructure and public policies: An international review of green roofs and green walls incentives. Land Use Policy 2020, 96, 104693. [Google Scholar] [CrossRef]
  43. Koohafkan, P.; Altieri, M.A.; Gimenez, E.H. Green agriculture: Foundations for biodiverse, resilient and productive agricultural systems. Int. J. Agric. Sustain. 2012, 10, 61–75. [Google Scholar] [CrossRef]
  44. Liu, L.; Gu, T.T.; Wang, H. The Coupling Coordination between Digital Economy and Industrial Green High-Quality Development: Spatio-Temporal Characteristics, Differences and Convergence. Sustainability 2022, 14, 16260. [Google Scholar] [CrossRef]
  45. Wang, R.; Cheng, J.H.; Zhu, Y.L.; Lu, P.X. Evaluation on the coupling coordination of resources and environment carrying capacity in Chinese mining economic zones. Resour. Policy 2017, 53, 20–25. [Google Scholar] [CrossRef]
  46. Ye, S.; Ge, Y.J.; Xu, S.Y.; Ma, X.F. Measurement and Prediction of Coupling Coordination Level of Economic Development, Social Stability and Ecological Environment in Qinghai-Thoughts on Sustainable Societal Safety. Sustainability 2022, 14, 10515. [Google Scholar] [CrossRef]
  47. Dong, F.; Hu, M.; Gao, Y.; Liu, Y.; Zhu, J.; Pan, Y. How does digital economy affect carbon emissions? Evidence from global 60 countries. Sci. Total Environ. 2022, 852, 158401. [Google Scholar] [CrossRef]
  48. Zoppelletto, A.; Orlandi, L.B. Cultural and digital collaboration infrastructures as sustainability enhancing factors: A configurational approach. Technol. Forecast. Soc. Chang. 2022, 179, 121645. [Google Scholar] [CrossRef]
  49. Lioutas, E.D.; Charatsari, C.; De Rosa, M. Digitalization of agriculture: A way to solve the food problem or a trolley dilemma? Technol. Soc. 2021, 67, 101744. [Google Scholar] [CrossRef]
  50. Tian, G.; Chen, F. Digital economy, industrial agglomeration and high-quality development of manufacturing industry in the yellow river basin. J. Stat. Decis. 2022, 38, 10–14. [Google Scholar]
  51. Ma, D.; Zhu, Q. Innovation in emerging economies: Research on the digital economy driving high-quality green development. J. Bus. Res. 2022, 145, 801–813. [Google Scholar] [CrossRef]
  52. Sultana, S.; Akter, S.; Kyriazis, E.; Wamba, S.F. Architecting and developing big data-driven innovation (DDI) in the digital economy. J. Glob. Inf. Manag. (JGIM) 2021, 29, 165–187. [Google Scholar] [CrossRef]
  53. Teece, D.J. Profiting from innovation in the digital economy: Enabling technologies, standards, and licensing models in the wireless world. Res. Policy 2018, 47, 1367–1387. [Google Scholar] [CrossRef]
  54. Zhang, L.; Mu, R.; Zhan, Y.; Yu, J.; Liu, L.; Yu, Y.; Zhang, J. Digital economy, energy efficiency, and carbon emissions: Evidence from provincial panel data in China. Sci. Total Environ. 2022, 852, 158403. [Google Scholar] [CrossRef] [PubMed]
  55. Jun, W.; Jie, Z.; Xi, L. Research on the Measurement of China’s Digital Economy Development and the Characteristics. Quant. Econ. Tech. Econ. 2020, 38, 26–42. (In Chinese) [Google Scholar] [CrossRef]
  56. Zhang, X.; Wu, X.; Zhou, W.; Fu, N. Research on the green innovation effect of digital economy network—Empirical evidence from the manufacturing industry in the Yangtze River Delta. Environ. Technol. Innov. 2024, 34, 103595. [Google Scholar]
  57. Geng, Y.; Chen, L.; Li, J.; Iqbal, K. Higher education and digital Economy: Analysis of their coupling coordination with the Yangtze River economic Belt in China as the example. Ecol. Indic. 2023, 154, 110510. [Google Scholar] [CrossRef]
  58. Tang, M.; Cao, A.; Guo, L.; Li, H. Improving agricultural green total factorproductivity in China: Do environmental governance and green low-carbon policies matter? Environ. Sci. Pollut. Res. 2023, 30, 52906–52922. [Google Scholar] [CrossRef] [PubMed]
  59. Yang, H.; Wang, X.; Bin, P. Agriculture carbon-emission reduction and changing factors behind agricultural eco-efficiency growth in China. J. Clean. Prod. 2022, 334, 130193. [Google Scholar] [CrossRef]
  60. Zhang, N.; Li, Z.; Zhao, H.; Han, Y.; Duan, Y. Construction and application of evaluation index system for agricultural green development. Ecol. Econ. 2018, 11, 21–44. [Google Scholar]
  61. Yu, S.; Zhang, J. The Calculation and convergence analysis of provincial green total factor productivity in the Yangtze river economic belt. Reform 2021, 4, 68–77. [Google Scholar]
  62. Chen, L.M.; Zheng, Q.Y.; Zhou, N. Comprehensive evaluation and constraints of green development in Chinese agriculture and rural areas: Based on TOPSIS and hindering degree modeling. J. Hebei Agric. Univ. (Soc. Sci.) 2022, 24, 106–114. [Google Scholar]
  63. Zou, Y.; Cheng, Q.; Jin, H.; Pu, X. Evaluation of green agricultural development and its influencing factors under the framework of sustainable development goals: Case study of lincang city, an underdeveloped mountainous region of China. Sustainability 2023, 15, 11918. [Google Scholar] [CrossRef]
  64. Cheng, L.; Gao, Y.; Dai, X. Spatiotemporal comprehensive measurement of China’s agricultural green development level and associated influencing factors. PLoS ONE 2023, 18, e0288599. [Google Scholar] [CrossRef] [PubMed]
  65. Ma, G.; Lv, D.; Luo, Y.; Jiang, T. Environmental regulation, urban-rural income gap andagricultural green total factor productivity. Sustainability 2022, 14, 8995. [Google Scholar] [CrossRef]
  66. Jiang, Q.; Li, J.; Si, H.; Su, Y. The impact of the digital economy on agricultural greendevelopment: Evidence from China. Agriculture 2022, 12, 1107. [Google Scholar] [CrossRef]
  67. Martin-Guay, M.O.; Paquette, A.; Dupras, J.; Rivest, D. The new Green Revolution: Sustainable intensification of agriculture by intercropping. Sci. Total Environ. 2018, 615, 767–772. [Google Scholar] [CrossRef]
  68. Pan, C.; Jiang, Y.; Wang, M.; Xu, S.; Xu, M.; Dong, Y. How can agricultural corporate build sustainable competitive advantage through green intellectual capital? A new environmental management approach to green agriculture. Int. J. Environ. Res. Public Health 2021, 18, 7900. [Google Scholar] [CrossRef] [PubMed]
  69. He, W.C.; Li, E.L.; Cui, Z.Z. Evaluation and influence factor of green efficiency of China’s agricultural innovation from the perspective of technical transformation. Chin. Geogr. Sci. 2021, 31, 313–328. (In Chinese) [Google Scholar] [CrossRef]
  70. Piao, R.S.; Silva, V.L.; del Aguila, I.N.; de Burgos Jiménez, J. Green growth and agriculture in Brazil. Sustain. Times 2021, 13, 1162. [Google Scholar] [CrossRef]
  71. FAO. SDG Indicator 2.4.1 Metadata. 2022. Available online: https://unstats.un.org/sdgs/metadata/files/Metadata-02-04-01.pdf (accessed on 6 June 2022).
  72. Hu, L.X.; Zhang, X.H.; Zhou, Y.H. Farm size and fertilizer sustainable use: An empirical study in Jiangsu, China. J. Integr. Agric. 2019, 18, 2898–2909. [Google Scholar] [CrossRef]
  73. Yu, J.; Wu, J. The sustainability of agricultural development in china: The agriculture–environment nexus. Sustainability 2018, 10, 1776. [Google Scholar] [CrossRef]
  74. Lee, C.-C.; Zeng, M.; Luo, K. Food security and digital economy in China: A pathway towards sustainable development. Econ. Anal. Policy 2023, 78, 1106–1125. [Google Scholar] [CrossRef]
  75. Yang, C.; Ji, X.; Cheng, C.; Liao, S.; Obuobi, B.; Zhang, Y. Digital economy empowers sustainable agriculture: Implications for farmers’ adoption of ecological agricultural technologies. Ecol. Indic. 2024, 159, 111723. [Google Scholar] [CrossRef]
  76. Shen, Z.Y.; Wang, S.K.; Boussemart, J.; Hao, Y. Digital transition and green growth in Chinese agriculture. Technol. Forecast. Soc. Chang. 2022, 181, 121742. [Google Scholar] [CrossRef]
  77. Chen, X.; Hu, D.; Cao, W.; Linag, W.; Xu, X.; Tang, X.; Wang, Y. Path of digital technology promoting realization of carbon neutrality goal in China’s energy industry. Bull. Chin. Acad. Sci. 2021, 36, 1019–1029. [Google Scholar]
  78. Li, W.; Wang, Y.; Xie, S.; Cheng, X. Coupling coordination analysis and spatiotemporal heterogeneity between urbanization and ecosystem health in Chongqing municipality, China. Sci. Total Environ. 2021, 791, 148311. [Google Scholar] [CrossRef] [PubMed]
  79. Zhang, Y.; Zhang, Y.; Zhang, H.; Zhang, Y. Evaluation on new first-tier smart cities in China based on entropy method and TOPSIS. Ecol. Indic. 2022, 145, 109616. [Google Scholar] [CrossRef]
  80. Lin, B.; Zhou, Y. Measuring the green economic growth in China: Influencing factors and policy perspectives. Energy 2022, 241, 122518. [Google Scholar] [CrossRef]
  81. Geng, Y.Q.; Zhu, R.J.; Maimaituerxun, M. Bibliometric review of carbon neutrality with CiteSpace: Evolution, trends, and framework. Environ. Sci. Pollut. Res. 2022, 29, 76668–76686. [Google Scholar] [CrossRef] [PubMed]
  82. Shi, T.; Yang, S.Y.; Zhang, W.; Zhou, Q. Coupling and coordination degree measurement and spatiotemporal heterogeneity between economic development and ecological environment: Empirical evidence from tropical and subtropical regions of China. J. Clean. Prod. 2020, 244, 118739. [Google Scholar] [CrossRef]
  83. Dong, F.G.; Li, W.Y. Research on the coupling coordination degree of “upstream-midstream-downstream” of China’s wind power industry chain. J. Clean. Prod. 2021, 283, 124633. [Google Scholar] [CrossRef]
  84. Shen, A.; Lin, S.; Guo, Y.; He, T.; Lyu, Z. Relationship between flexural strength and pore structure of pavement concrete under fatigue loads and Freeze-thaw interaction in seasonal frozen regions, Construct. Build. Mater. 2018, 174, 684–692. [Google Scholar] [CrossRef]
  85. Prusty, J.K.; Pradhan, B. Multi-response optimization using Taguchi-Grey relational analysis for composition of fly ash-ground granulated blast furnace slag based geopolymer concrete, Construct. Build. Mater. 2020, 241, 118049. [Google Scholar] [CrossRef]
  86. Arıcı, E.; Keleştemur, O. Optimization of mortars containing steel scale using Taguchi based grey relational analysis method. Construct. Build. Mater. 2019, 214, 232–241. [Google Scholar] [CrossRef]
  87. Geng, Y.; Yan, Y. Higher Education and Science Popularization: Can they Achieve Coordinated Growth? PLoS ONE 2021, 16, e0256612. [Google Scholar] [CrossRef] [PubMed]
  88. Huang, Z.; Wei, W.; Han, Y.; Ding, S.; Tang, K. The coupling coordination evolutionary analysis of tourism-ecological environment-public service for the Yellow River Basin of China. Int. J. Environ. Res. Public Health 2022, 19, 9315. [Google Scholar] [CrossRef] [PubMed]
Figure 1. The evaluation framework of the DE and AGD.
Sustainability 16 04533 g001
Figure 2. Study area.
Sustainability 16 04533 g002
Figure 3. DE-D’s temporal changes.
Sustainability 16 04533 g003
Figure 4. Spatial distribution of the development level of DE.
Sustainability 16 04533 g004
Figure 5. AGD-D’s temporal changes.
Sustainability 16 04533 g005
Figure 6. Spatial distribution of the development level of AGD.
Sustainability 16 04533 g006
Figure 7. Comparison of the two systems.
Sustainability 16 04533 g007
Figure 8. CCD levels by province from 2012 to 2021.
Sustainability 16 04533 g008
Figure 9. CCD spatial distribution in 2012.
Sustainability 16 04533 g009
Figure 10. CCD spatial distribution in 2021.
Sustainability 16 04533 g010
Figure 11. Grey correlation degree matrix of the DE and AGD in 2012.
Sustainability 16 04533 g011
Figure 12. Grey correlation degree matrix of the DE and AGD in 2021.
Sustainability 16 04533 g012
Table 1. Comprehensive evaluation system.
SystemIndicatorVariablesType
Digital economy
(DE)
Foundation
(DE-1)
Number of broadband access users (ten thousand households)
(DE-11)
+
Mobile phone base station density (1/km2)
(DE-12)
+
Mobile phones per 100 people
(DE-13)
+
Environment
(DE-2)
Proportion of e-commerce transaction activities of enterprises
(DE-21)
+
Number of postal and express parcels (ten thousand pieces)
(DE-22)
+
The Digital Financial Inclusion Index
(DE-23)
+
Input
(DE-3)
R&D expenditure of industrial enterprises above the designated size
(DE-31)
+
Number of employees in the information service industry (ten thousand people)
(DE-32)
+
The number of websites per 100 enterprises
(DE-33)
+
Output
(DE-4)
Enterprise e-commerce transaction volume (RMB 100 million yuan)
(DE-41)
+
Revenue from software and information technology services as a proportion of GDP
(DE-42)
+
Number of invention patent applications (granted)
(DE-43)
+
Agricultural Green Development
(AGD)
Resource utilization and
environmental protection
(AGD-1)
Total sown area of crops (thousand hectares)
(AGD-11)
+
The proportion of the effective irrigated area
(AGD-12)
+
Amount of agricultural plastic film used (tons)/total sown area of crops (thousand hectares)
(AGD-13)
The amount of chemical fertilizer and pesticide used per unit sown area
(AGD-14)
Utilization rate of livestock and poultry manure
(AGD-15)
+
Investment in environmental pollution control (100 million yuan)
(AGD-16)
+
Agricultural supply and economic benefits
(AGD-2)
There are several professional cooperatives per 10,000 people in rural areas
(AGD-21)
+
Total value of farm output
(AGD-22)
+
Total grain output
(AGD-23)
+
The per capita disposable income ratio of rural and urban residents
(AGD-24)
+
Advanced technology and industrial upgrading
(AGD-3)
That year, the new green, organic food certification and geographical indication of agricultural products registration number
(AGD-31)
+
Development of agricultural products processing industry (proportion)
(AGD-32)
+
The proportion of facility agriculture
(AGD-33)
+
Number of environmental and agrometeorological observation stations
(AGD-34)
+
Table 2. Grade division of D.
GradeValue
Excellent(0.8–1)
Good(0.6–0.8)
Reasonable(0.4–0.6)
Average(0.2–0.4)
Poor(0–0.2)
Table 3. Classification of CCD.
GradeValueGradeValue
Superiorly coordinated(0.8, 1)Nearly coordinated(0.4, 0.5)
Slightly uncoordinated(0.3, 0.4)
Moderately coordinated(0.7, 0.8)Moderately uncoordinated(0.2, 0.3)
Primarily coordinated(0.6, 0.7)Severely uncoordinated(0, 0.2)
Barely coordinated (0.5, 0.6)
Table 4. DE development level of each province from 2012 to 2021.
2012201320142015201620172018201920202021Mean
Heilongjiang0.0410.0760.1080.1220.1340.1490.1490.1590.1780.1780.129
Hebei0.0790.1160.1530.1730.2130.2300.2570.2900.3390.3910.224
Iner Mongolia0.0730.1020.1160.1280.1460.1620.1650.1650.1770.2000.143
Liaoning0.1850.2390.2590.2770.2710.2880.2750.3050.3240.3340.276
Jilin0.0760.1090.1350.1510.1590.1800.1950.1880.2050.2180.162
Jiangsu0.3160.4120.4510.5220.5550.5960.6670.7450.8410.8990.600
Anhui0.0920.1140.1560.1970.2190.2390.2750.3120.3440.3840.233
Jiangxi0.0610.0830.1110.1510.1480.1720.1970.2160.2380.2650.164
Shandong0.1860.2610.2960.3520.4160.4550.4980.5210.5880.6750.425
Henan0.0770.1230.1540.1950.2300.2630.2980.3410.3890.4390.251
Hubei0.1000.1460.1790.2160.2490.2680.2980.3420.3570.3990.255
Hunan0.0770.1050.1350.1620.1890.2050.2320.2610.3000.3350200
Sichuan0.1360.2040.2370.2920.3310.3530.3800.4050.4400.4700.325
Table 5. AGD development level of each province from 2012 to 2021.
2012201320142015201620172018201920202021Mean
Heilongjiang0.3730.4040.4440.4850.4920.5190.5350.5680.5710.5910.499
Hebei0.2930.3160.3380.3330.3580.3530.3890.4070.4140.4510.365
Inner Mongolia0.2220.2630.3020.2950.3240.3450.3530.3720.3730.4140.326
Liaoning0.2320.2990.3080.3380.3150.3150.2950.3470.3330.3610.314
Jilin0.2450.2750.2790.2980.3390.3300.3180.2960.3260.3610.307
Jiangsu0.3090.3320.3740.3920.4260.4270.4620.4940.5020.5410.426
Anhui0.2550.2630.2910.3070.3190.3490.3830.3820.4060.4270.338
Jiangxi0.1420.1530.1590.1870.2040.2050.2130.2440.2710.2970.208
Shandong0.3860.4100.4350.4450.4950.4860.5080.4820.4950.5430.469
Henan0.3560.3760.3880.4070.4370.4490.4270.4830.4940.5360.435
Hubei0.2060.2280.2470.2670.2760.2760.2920.3300.3570.3750.285
Hunan0.1890.1900.1900.2140.2230.2690.2670.3080.3360.3320.252
Sichuan0.2340.2660.2590.2970.3000.3340.3370.3600.3800.4070.317
Disclaimer/Publisher’s Note: The statements, opinions and data contained in all publications are solely those of the individual author(s) and contributor(s) and not of MDPI and/or the editor(s). MDPI and/or the editor(s) disclaim responsibility for any injury to people or property resulting from any ideas, methods, instructions or products referred to in the content.

