

Microplastic Evaluation in Water and Sediments of a Dam Reservoir–Riverine System in the Eastern Carpathians, Romania

 ,
,
Abstract

1. Introduction
2. Materials and Methods
2.1. Study Area
2.2. Sampling Strategy
2.3. Sample Preparation and Analytical Methods
2.4. Microscopic Evaluation
2.5. Fourier Transform Infrared Spectroscopy (FT-iR)
2.6. Quality Assurance and Storage
3. Results and Discussion
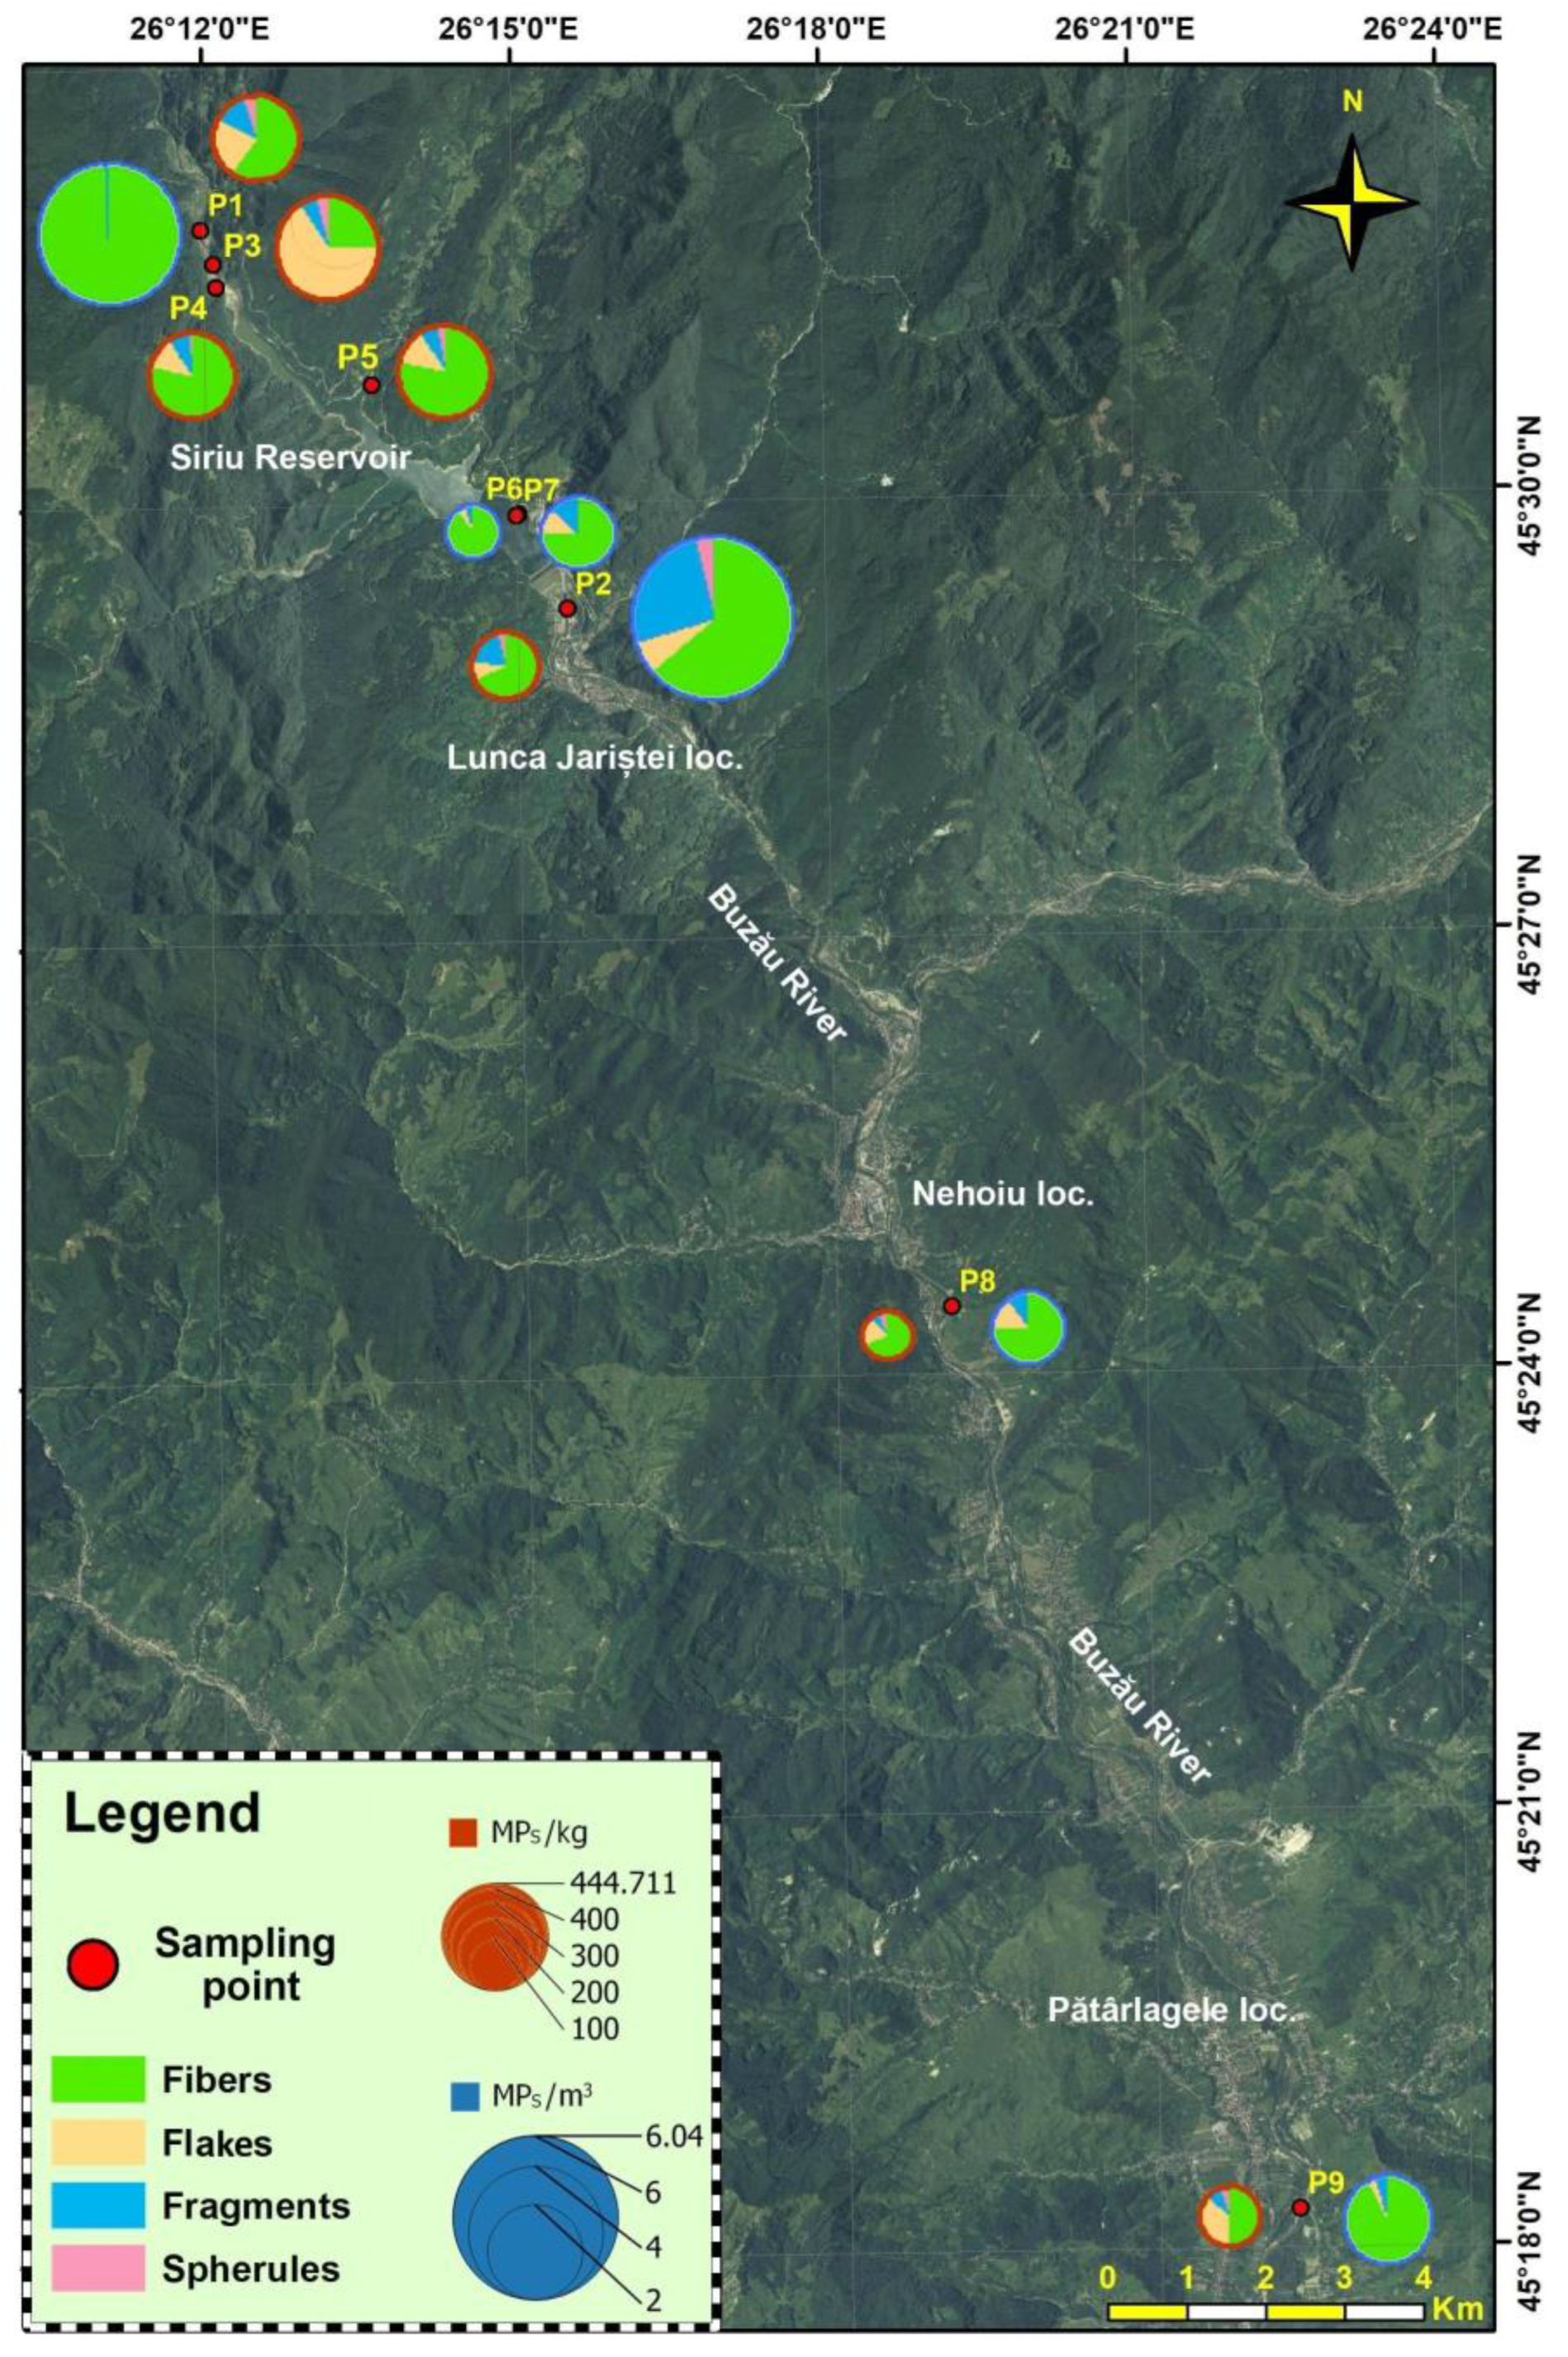
3.1. Surface Water Layer
3.2. Surface Sediments
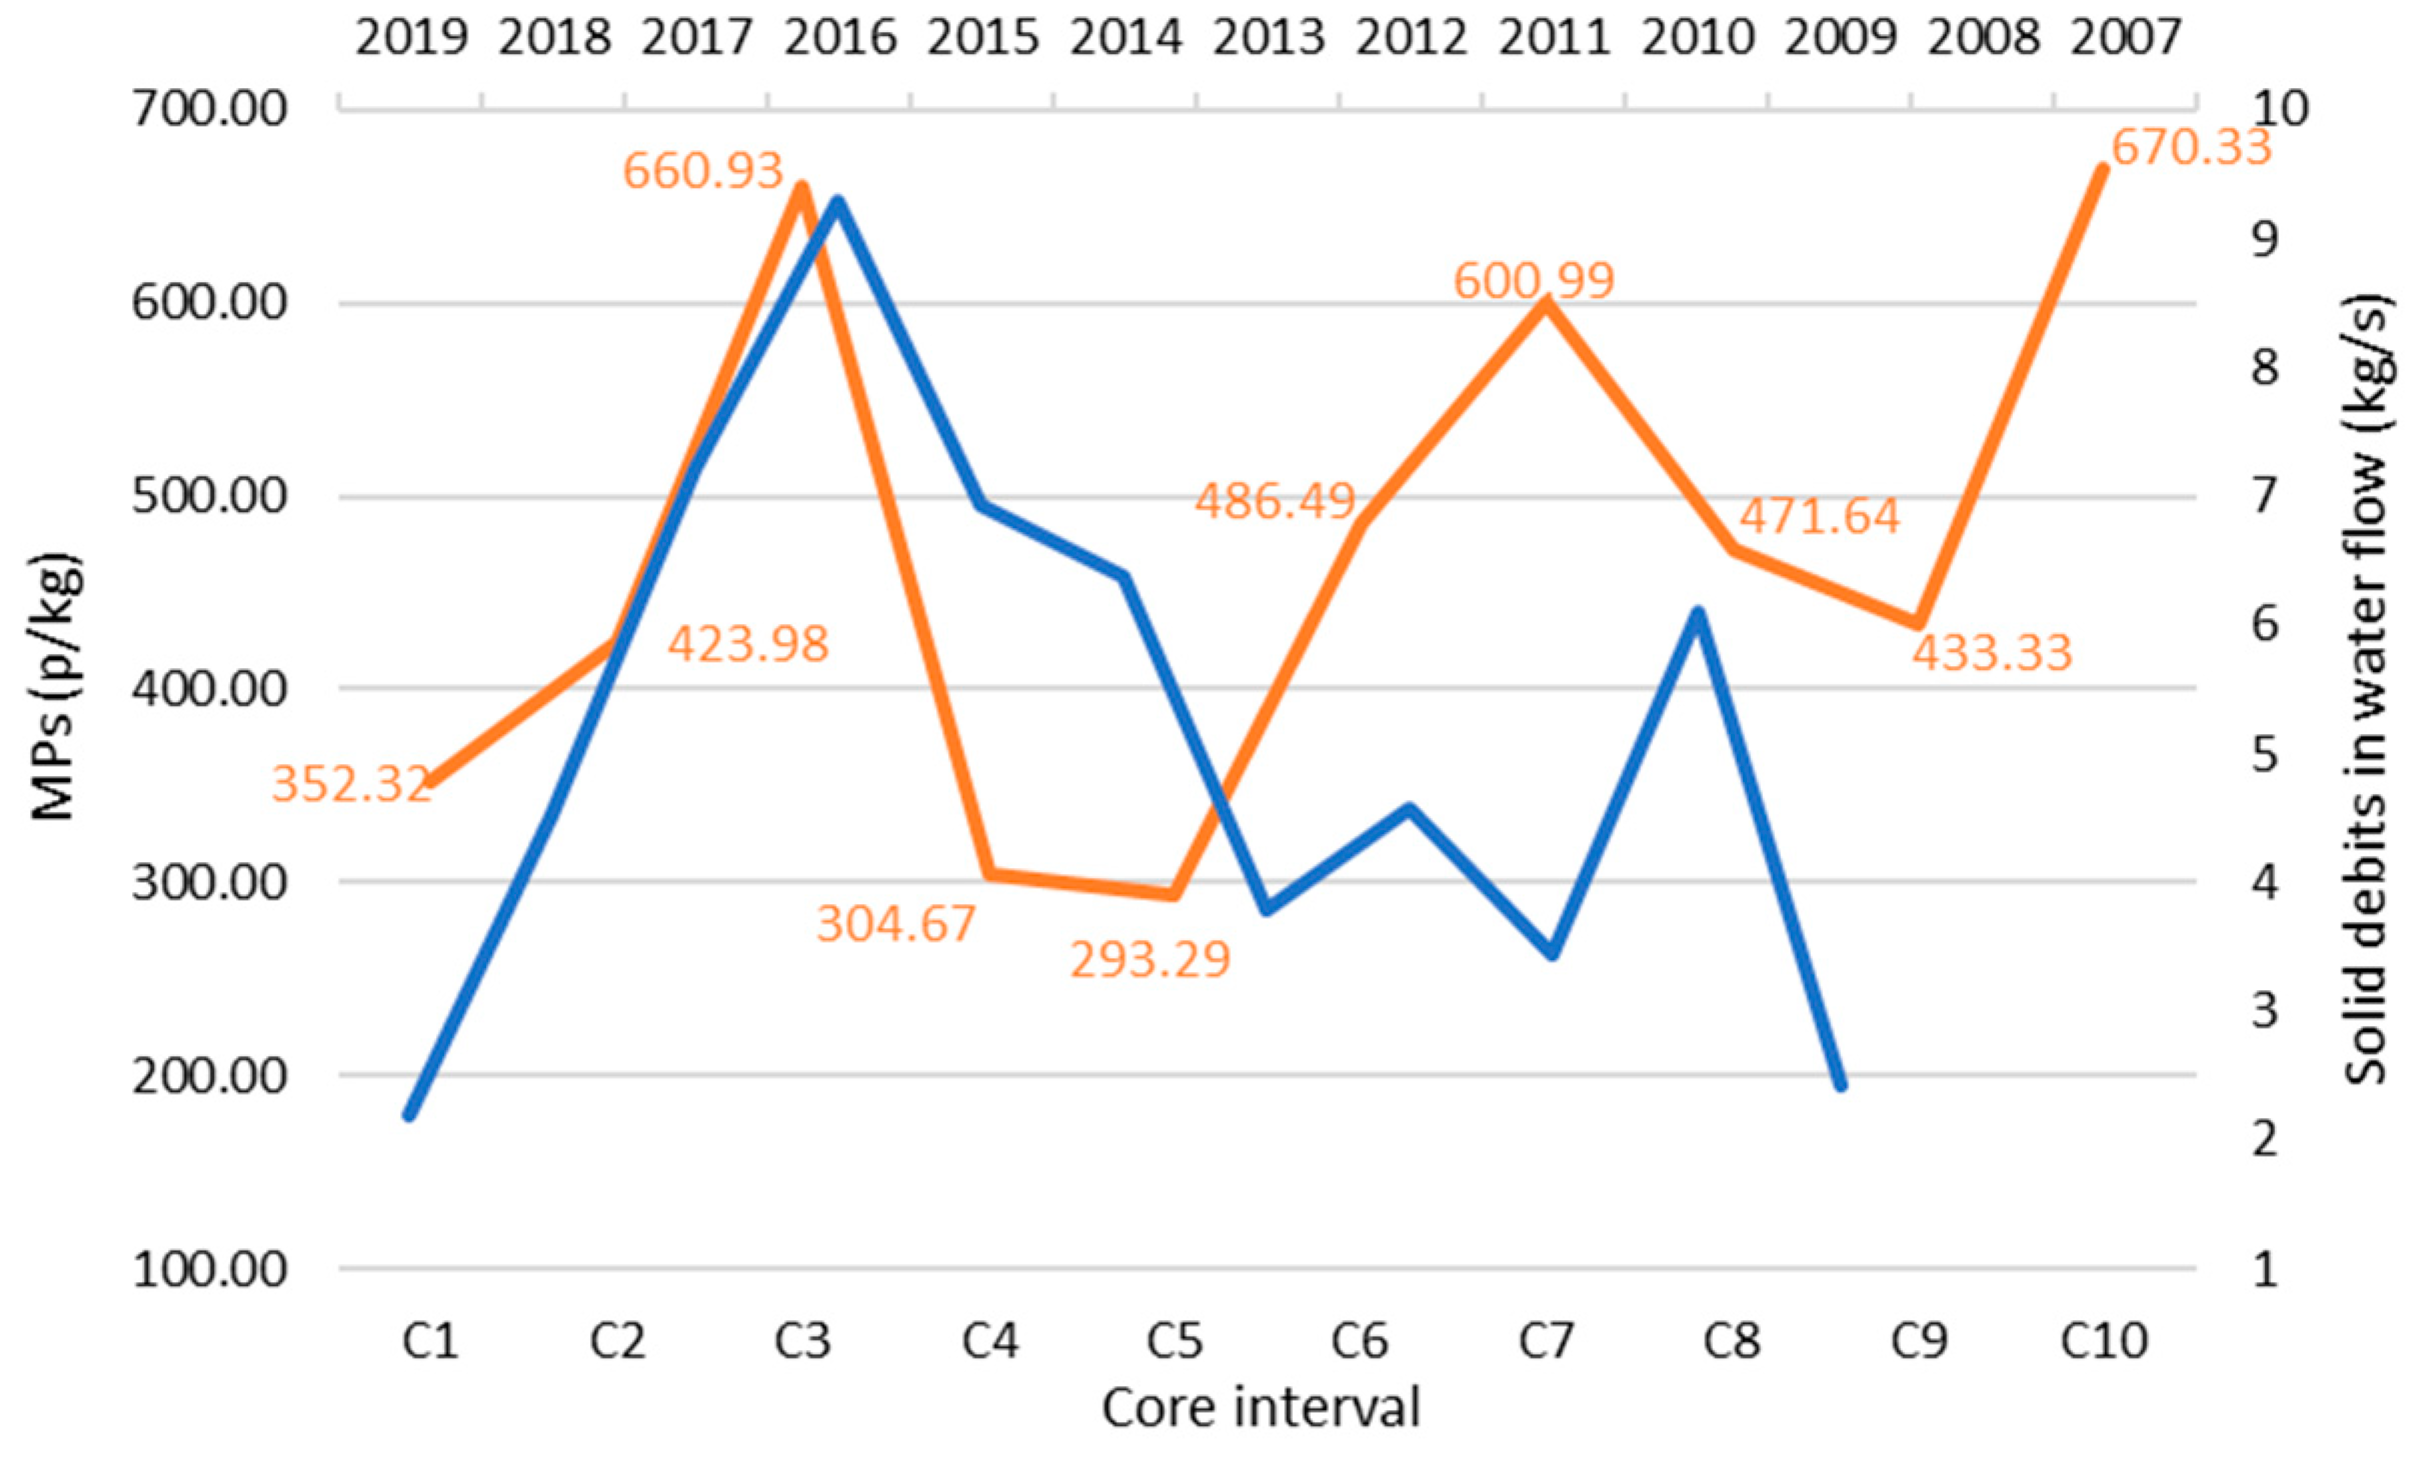
3.3. Sediment Core
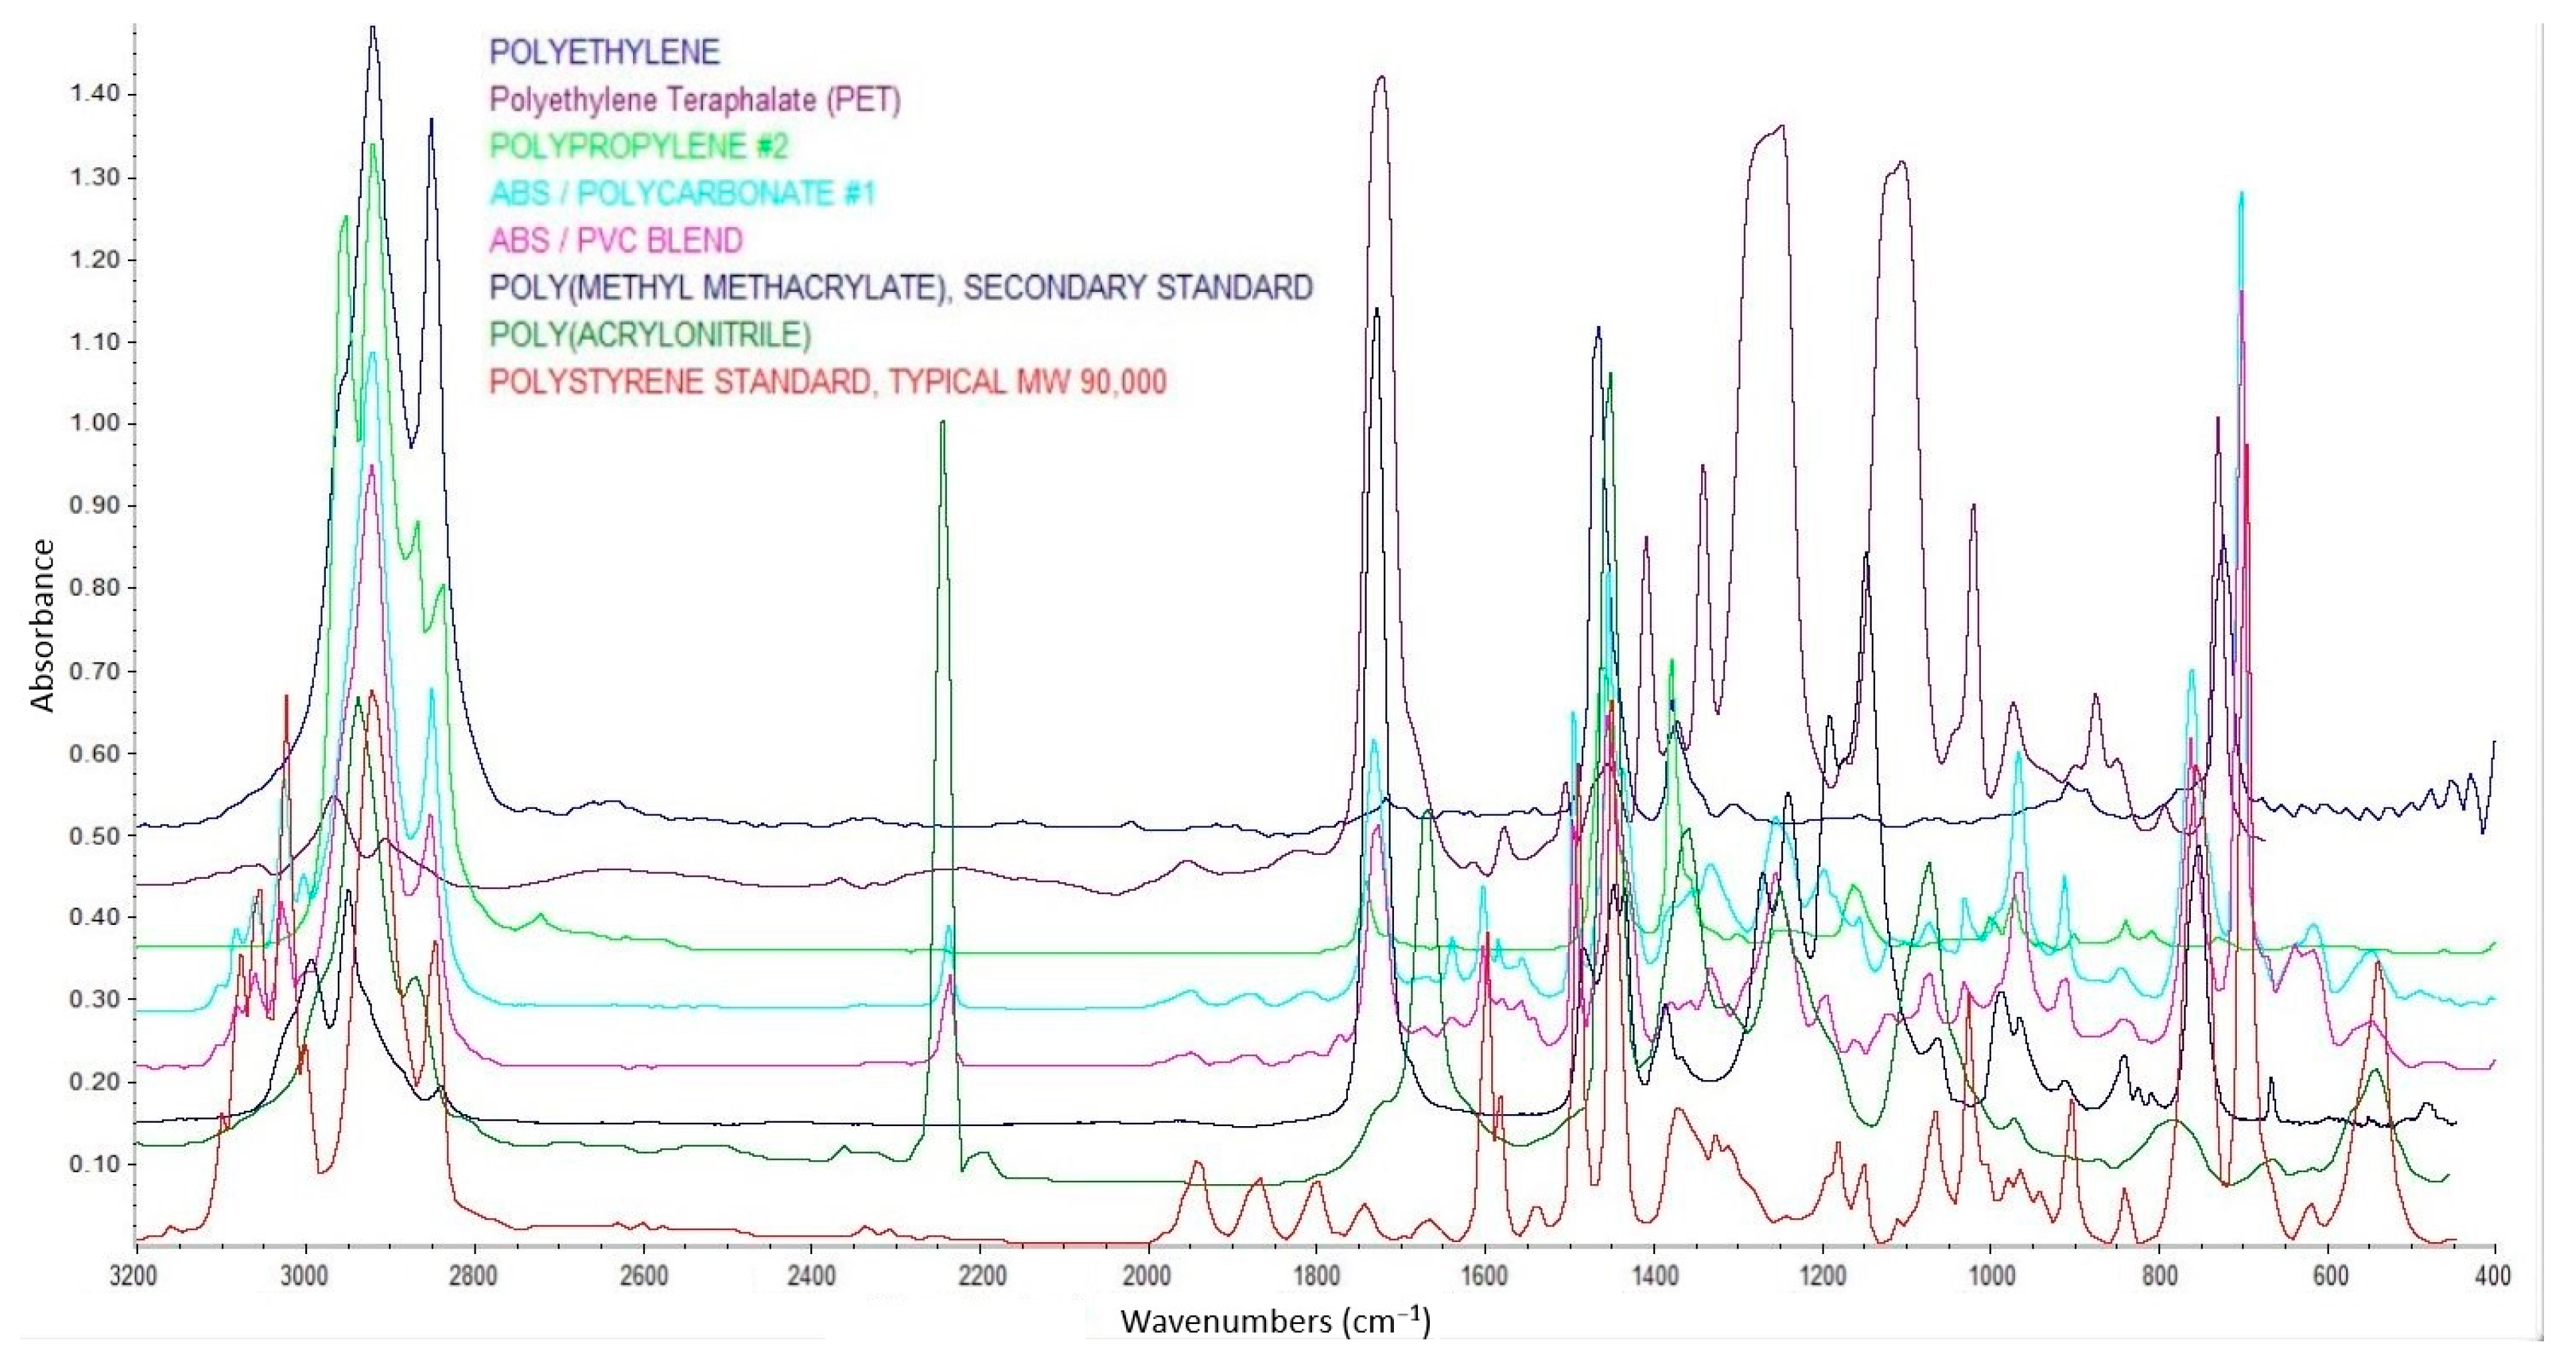
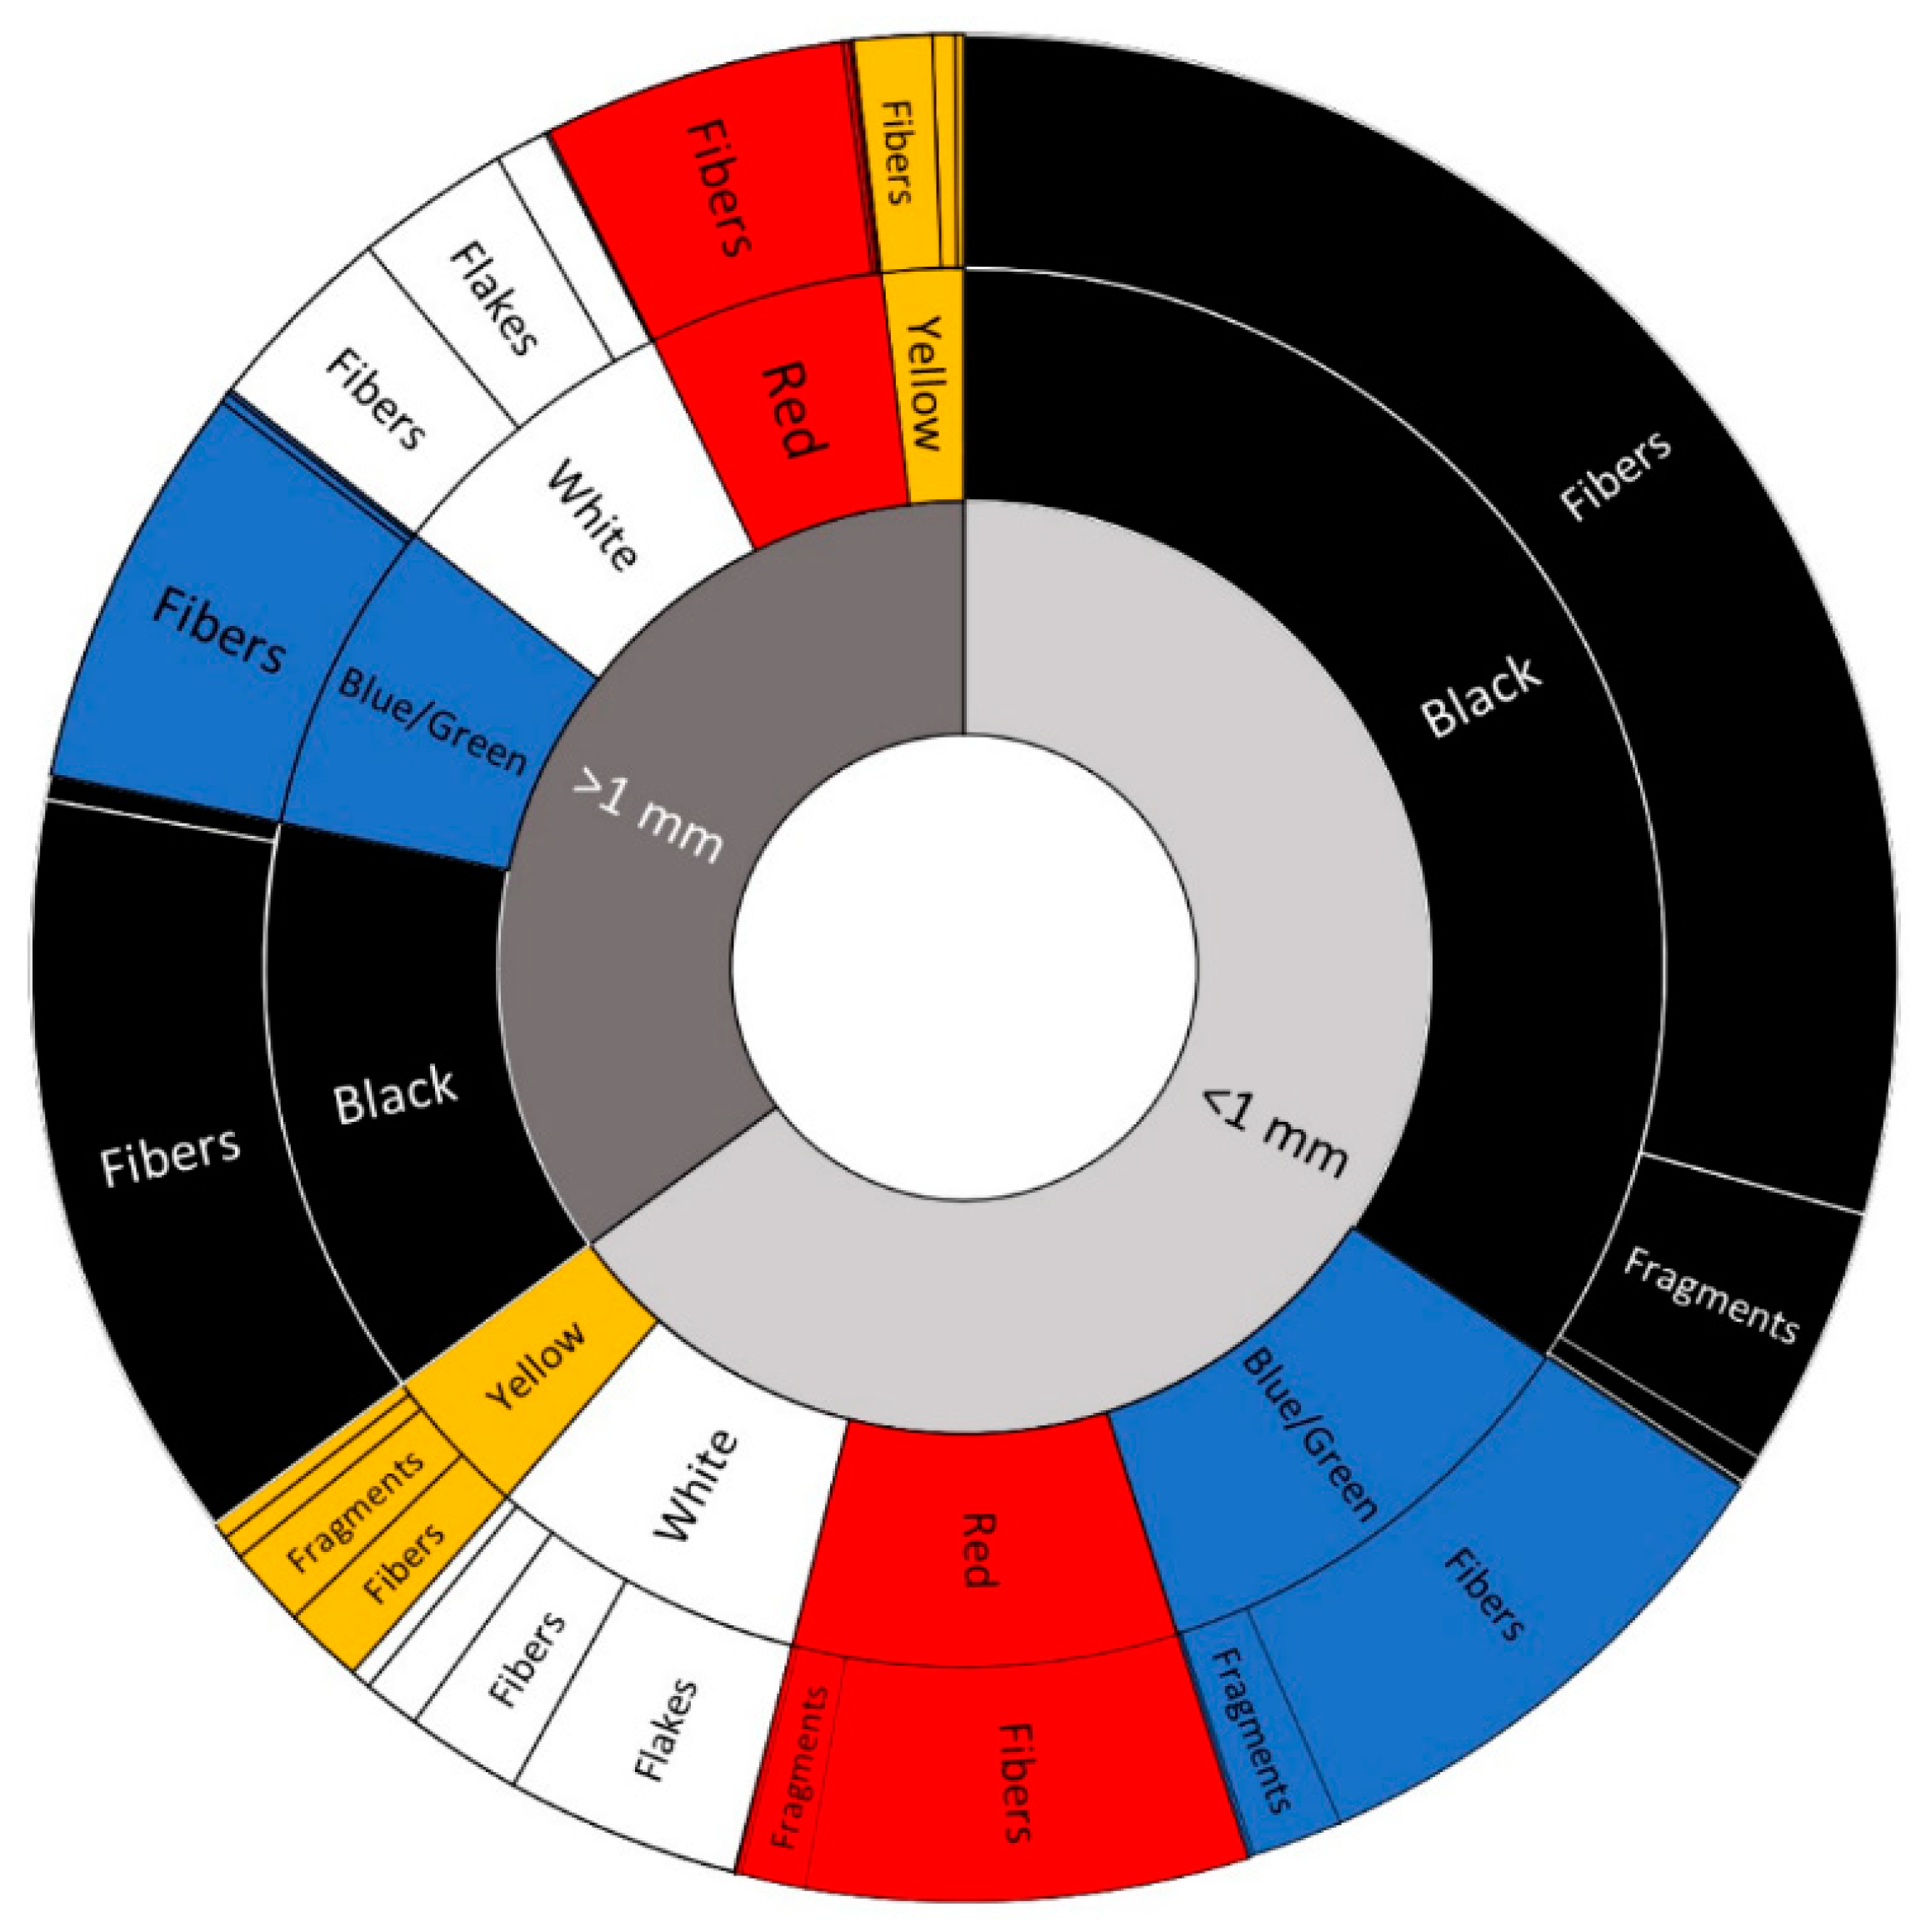
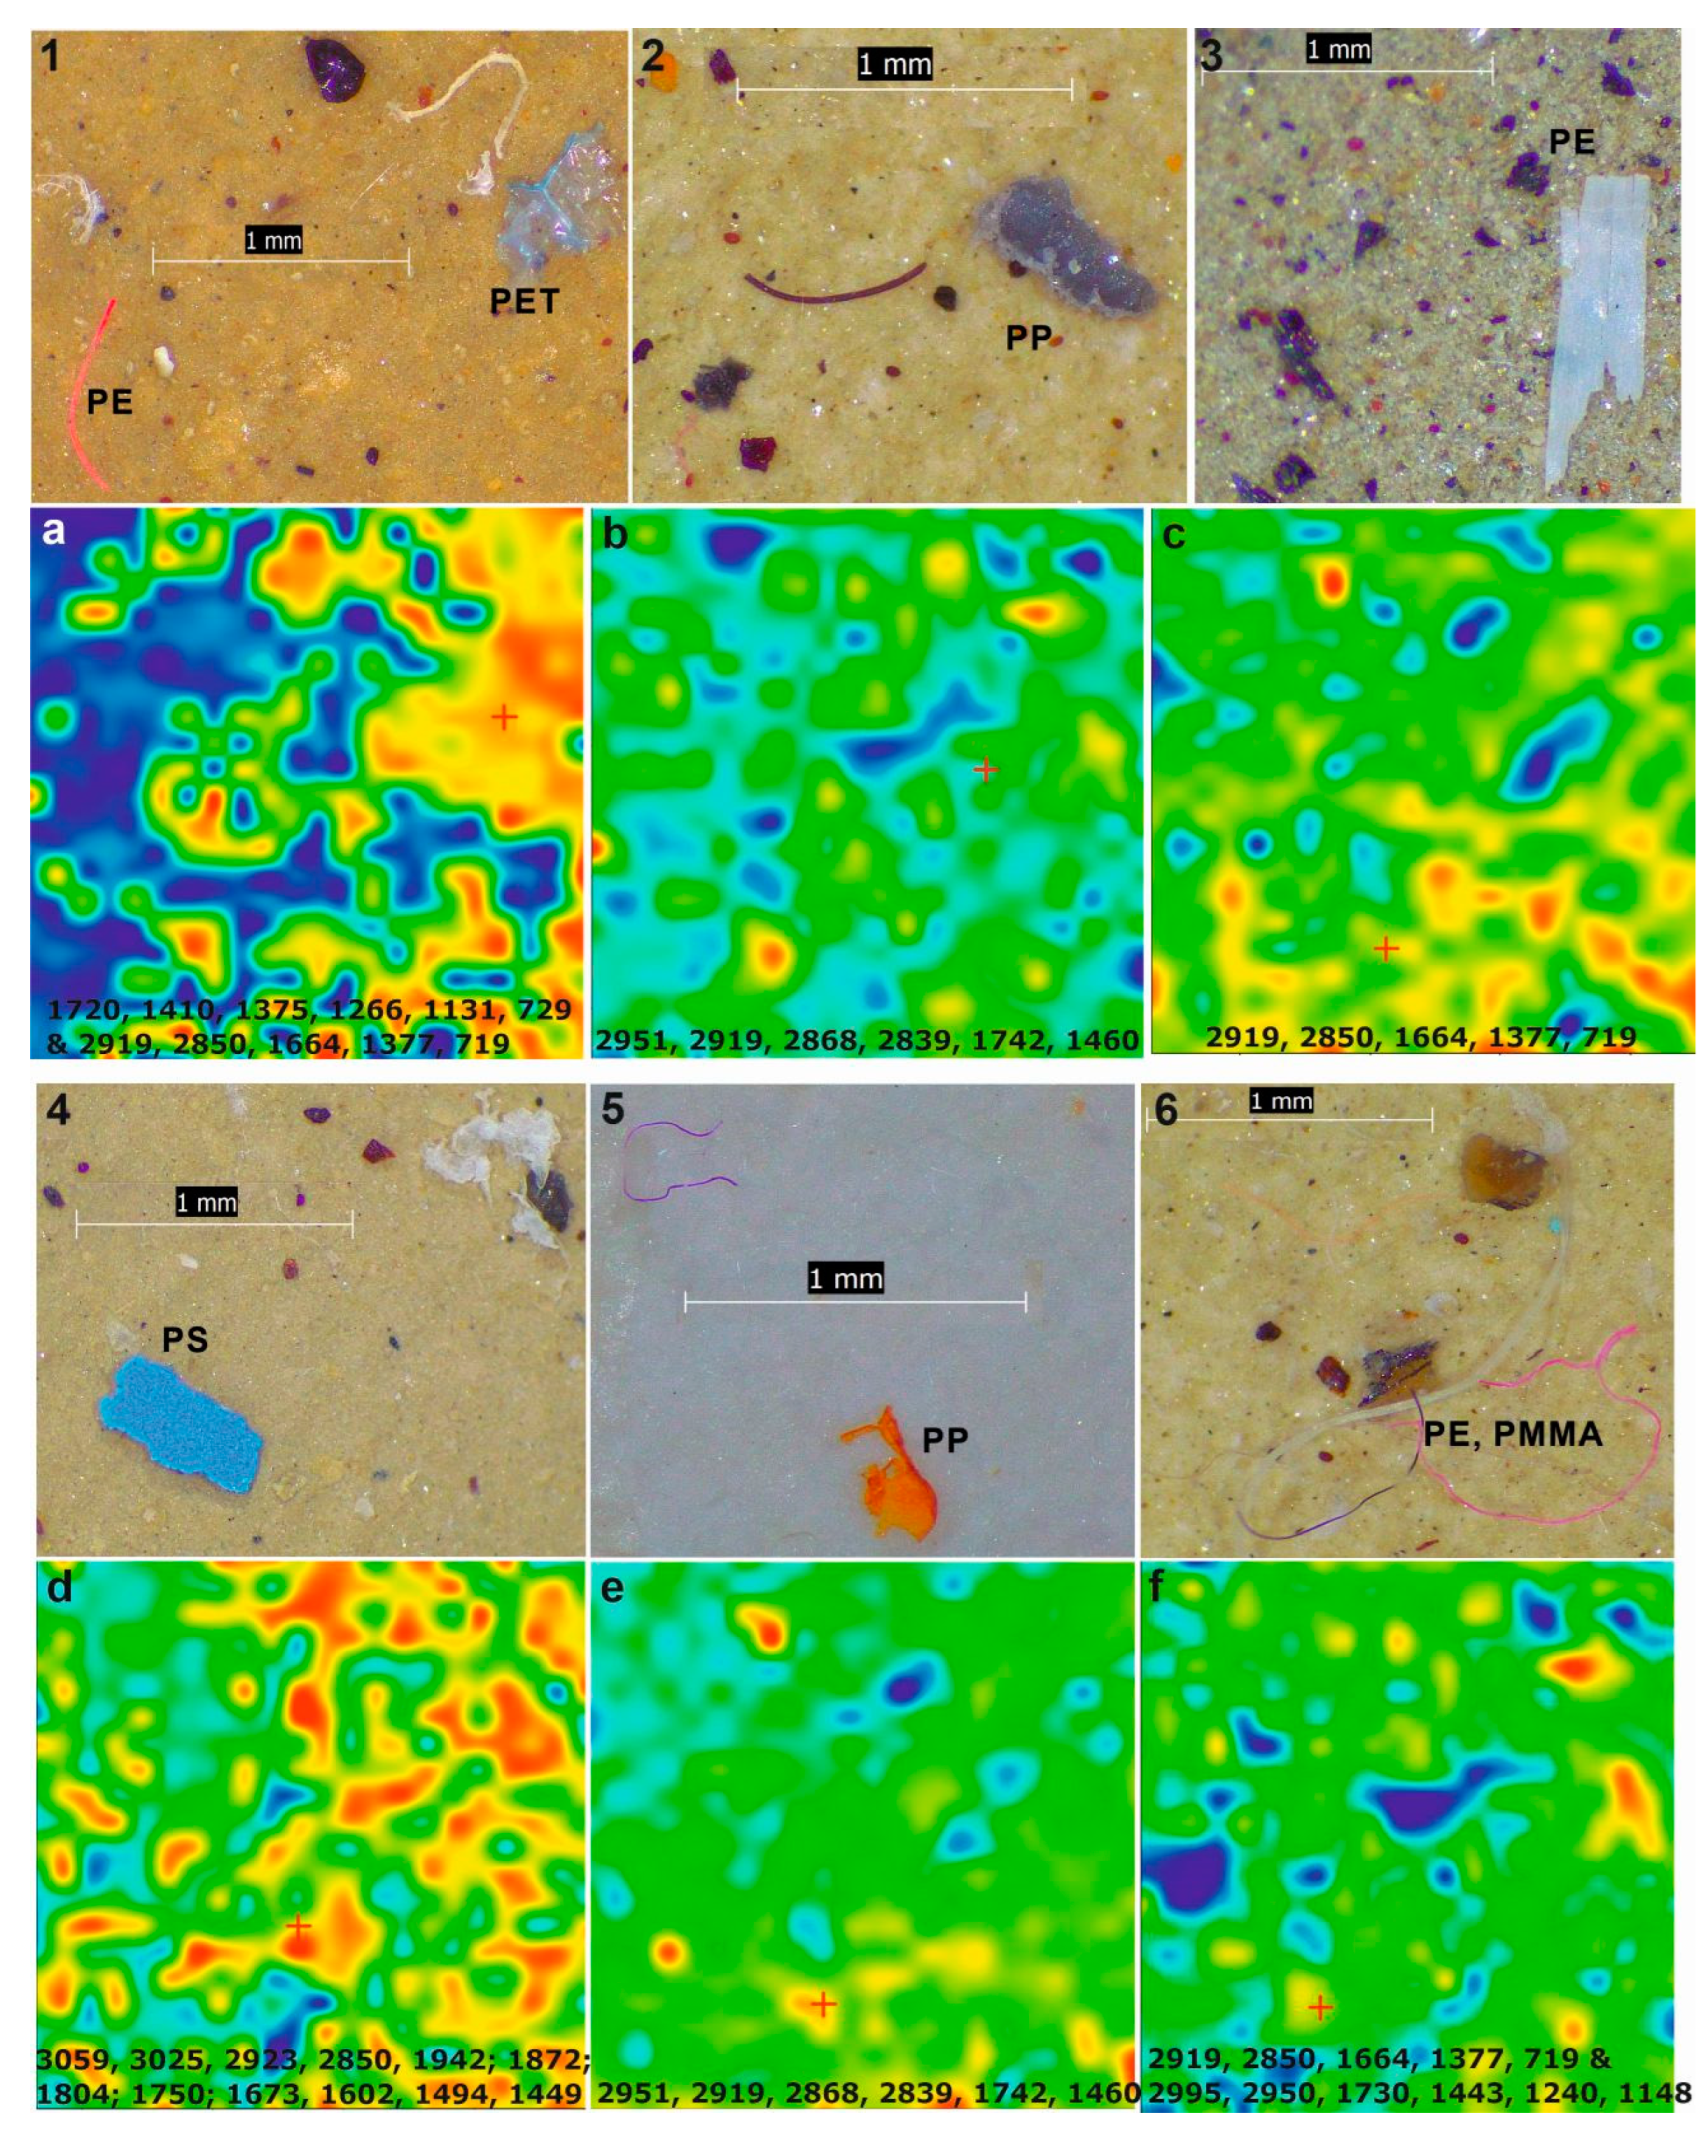
3.4. Polymer Types
3.5. Provenance and Sources
3.6. Implications
4. Conclusions
Author Contributions
Funding
Institutional Review Board Statement
Informed Consent Statement
Data Availability Statement
Acknowledgments
Conflicts of Interest
References
- Arthur, C.; Baker, J.E.; Bamford, H.A. Proceedings of the International Research Workshop on the Occurrence, Effects, and Fate of Microplastic Marine Debris, 9–11 September 2008, University of Washington Tacoma: Tacoma, WA, USA; U.S. Department of Commerce, National Oceanic and Atmospheric Administration, National Ocean Service, Office of Response & Restoration: Washington, DC, USA, 2009. [Google Scholar]
- Li, C.; Busquets, R.; Campos, L.C. Assessment of microplastics in freshwater systems: A review. Sci. Total Environ. 2020, 707, 135578. [Google Scholar] [CrossRef] [PubMed]
- Eerkes-Medrano, D.; Thompson, R.C.; Aldridge, D.C. Microplastics in freshwater systems: A review of the emerging threats, identification of knowledge gaps and prioritisation of research needs. Water Res. 2015, 75, 63–82. [Google Scholar] [CrossRef] [PubMed]
- Zhang, K.; Gong, W.; Lv, J.; Xiong, X.; Wu, C. Accumulation of floating microplastics behind the Three Gorges Dam. Environ. Pollut. 2015, 204, 117–123. [Google Scholar] [CrossRef] [PubMed]
- Parvin, F.; Hassan, M.A.; Tareq, S.M. Risk assessment of microplastic pollution in urban lakes and peripheral Rivers of Dhaka, Bangladesh. J. Hazard. Mater Adv. 2022, 8, 100187. [Google Scholar] [CrossRef]
- Graney, G. Slipping through the cracks: How tiny plastic microbeads are currently escaping water treatment plants and international pollution regulation. Fordham Int’l LJ 2015, 39, 1023. [Google Scholar]
- Pawar, P.R.; Shirgaonkar, S.S.; Patil, R.B. Plastic marine debris: Sources, distribution and impacts on coastal and ocean biodiversity. PENCIL Publ. Biol. Sci. 2016, 3, 40–54. [Google Scholar]
- Mihai, F.C.; Gündoğdu, S.; Markley, L.A.; Olivelli, A.; Khan, F.R.; Gwinnett, C.; Gutberlet, J.; Reyna-Bensusan, N.; Llanquileo-Melgarejo, P.; Meidiana, C.; et al. Plastic pollution, waste management issues, and circular economy opportunities in rural communities. Sustainability 2022, 14, 20. [Google Scholar] [CrossRef]
- Berov, D.; Klayn, S. Microplastics and floating litter pollution in Bulgarian Black Sea coastal waters. Mar. Pollut. Bull. 2020, 156, 111225. [Google Scholar] [CrossRef] [PubMed]
- Sarijan, S.; Azman, S.; Said, M.I.M.; Jamal, M.H. Microplastics in freshwater ecosystems: A recent review of occurrence, analysis, potential impacts, and research needs. Environ. Sci. Pollut. Res. 2021, 28, 1341–1356. [Google Scholar] [CrossRef] [PubMed]
- Cincinelli, A.; Scopetani, C.; Chelazzi, D.; Martellini, T.; Pogojeva, M.; Slobodnik, J. Microplastics in the Black Sea sediments. Sci. Total Environ. 2021, 760, 143898. [Google Scholar] [CrossRef]
- Vladimir, M.; Tatiana, R.; Evgeniy, S.; Veerasingam, S.; Bagaev, A. Vertical and seasonal variations in biofilm formation on plastic substrates in coastal waters of the Black Sea. Chemosphere 2023, 317, 137843. [Google Scholar] [CrossRef]
- Cera, A.; Cesarini, G.; Scalici, M. Microplastics in freshwater: What is the news from the world? Diversity 2020, 12, 276. [Google Scholar] [CrossRef]
- Szymańska, M.; Obolewski, K. Microplastics as contaminants in freshwater environments: A multidisciplinary review. Ecohydrol. Hydrobiol. 2020, 20, 333–345. [Google Scholar] [CrossRef]
- Kumar, P.; Inamura, Y.; Bao, P.N.; Abeynayaka, A.; Dasgupta, R.; Abeynayaka, H.D. Microplastics in freshwater environment in Asia: A systematic scientific review. Water 2022, 14, 1737. [Google Scholar] [CrossRef]
- Castañeda, R.A.; Avlijas, S.; Simard, M.A.; Ricciardi, A. Microplastic pollution in St. Lawrence River sediments. Can. J. Fish. Aquat. Sci. 2014, 71, 1767–1771. [Google Scholar] [CrossRef]
- Su, L.; Xue, Y.; Li, L.; Yang, D.; Kolandhasamy, P.; Li, D.; Shi, H. Microplastics in Taihu Lake, China. Environ. Pollut. 2016, 216, 711–719. [Google Scholar] [CrossRef] [PubMed]
- Mani, T.; Hauk, A.; Walter, U.; Burkhardt-Holm, P. Microplastics profile along the Rhine River. Sci. Rep. 2015, 5, 17988. [Google Scholar] [CrossRef] [PubMed]
- Rakib, M.R.J.; Al Nahian, S.; Madadi, R.; Haider, S.M.B.; De-la-Torre, G.E.; Walker, T.R.; Jonathan, M.P.; Cowgel, W.; Khandeker, M.U.; Idris, A.M. Spatiotemporal trends and characteristics of microplastic contamination in a large river-dominated estuary. Environ. Sci. Proc. Imp. 2023, 25, 929–940. [Google Scholar] [CrossRef]
- Free, C.M.; Jensen, O.P.; Mason, S.A.; Eriksen, M.; Williamson, N.J.; Boldgiv, B. High-levels of microplastic pollution in a large, remote, mountain lake. Mar. Pollut. Bull. 2014, 85, 156–163. [Google Scholar] [CrossRef]
- Watkins, L.; McGrattan, S.; Sullivan, P.J.; Walter, M.T. The effect of dams on river transport of microplastic pollution. Sci. Total Environ. 2019, 664, 834–840. [Google Scholar] [CrossRef]
- Dhivert, E.; Phuong, N.N.; Mourier, B.; Grosbois, C.; Gasperi, J. Microplastic trapping in dam reservoirs driven by complex hydrosedimentary processes (Villerest Reservoir, Loire River, France). Water Res. 2022, 225, 119187. [Google Scholar] [CrossRef] [PubMed]
- He, K.; Wang, J.; Chen, Q.; Wu, F.; Yang, X.; Chen, J. Effects of cascade dams on the occurrence and distribution of microplastics in surface sediments of Wujiang river basin, Southwestern China. Ecotoxicol. Environ. Saf. 2022, 240, 113715. [Google Scholar] [CrossRef] [PubMed]
- Shen, J.; Gu, X.; Liu, R.; Feng, H.; Li, D.; Liu, Y.; Jiang, X.; Qin, G.; An, S.; Li, N.; et al. Damming has changed the migration process of microplastics and increased the pollution risk in the reservoirs in the Shaying River Basin. J. Hazard. Mater. 2023, 443, 130067. [Google Scholar] [CrossRef] [PubMed]
- Horton, A.A.; Walton, A.; Spurgeon, D.J.; Lahive, E.; Svendsen, C. Microplastics in freshwater and terrestrial environments: Evaluating the current understanding to identify the knowledge gaps and future research priorities. Sci. Total Environ. 2017, 586, 127–141. [Google Scholar] [CrossRef] [PubMed]
- Grecu, F.; Bercan, C.; Vişan, M.C. Applied geomorphology field researches in the Transcarpathian Valley of Buzău. Analele Univ. București Geogr. 2017, 49–57. (In Romanian) [Google Scholar]
- Grecu, F.; Bercan, C.; Vişan, M.C. Cercetări în teren de geomorfologie aplicată în valea transcarpatică a Buzăului (poster, in Romanian). In Proceedings of the Re-Shaping Territories, Environment and Societies: New Challenges for Geography, Bucharest, Romania, 18–19 November 2016. [Google Scholar]
- Mainerici, M.; Stănișteanu, L.C.; Selagea, H.; Scuturici, D.; Luca, L.; Lupescu, S.; Papa, L.; Godea, M.; Zarea, R.; Dumitru, C.; et al. House Report (in Romanian): Batimetria Acumulării Siriu; National Administration Romanian Waters, Buzău-Ialomița Water Basin Administration, Basinal Prognosis Service: Buzău, Romania, 2015. [Google Scholar]
- Campanale, C.; Savino, I.; Pojar, I.; Massarelli, C.; Uricchio, V.F. A practical overview of methodologies for sampling and analysis of microplastics in riverine environments. Sustainability 2020, 12, 6755. [Google Scholar] [CrossRef]
- Stock, F.; Kochleus, C.; Bänsch-Baltruschat, B.; Brennholt, N.; Reifferscheid, G. Sampling techniques and preparation methods for microplastic analyses in the aquatic environment–A review. TrAC Trend. Anal. Chem. 2019, 113, 84–92. [Google Scholar] [CrossRef]
- Pojar, I.; Stănică, A.; Stock, F.; Kochleus, C.; Schultz, M.; Bradley, C. Sedimentary microplastic concentrations from the Romanian Danube River to the Black Sea. Sci. Rep. 2021, 11, 2000. [Google Scholar] [CrossRef] [PubMed]
- Ehlers, S.M.; Manz, W.; Koop, J.H.E. Microplastics of different characteristics are incorporated into the larval cases of the freshwater caddisfly Lepidostoma basale. Aquat. Biol. 2019, 28, 67–77. [Google Scholar] [CrossRef]
- Scherer, C.; Weber, A.; Stock, F.; Vurusic, S.; Egerci, H.; Kochleus, C.; Arendt, N.; Foeldi, C.; Dierkes, G.; Wagner, M.; et al. Microplastics in the water and sediment phase of the Elbe River, Germany. Sci. Total Environ. 2020, 738, 139866. [Google Scholar] [CrossRef]
- Norén, F. Small plastic particles in coastal Swedish waters. Kimo Swed. 2007, 11, 1–11. [Google Scholar]
- de Haan, W.P.; Sanchez-Vidal, A.; Canals, M. Floating microplastics and aggregate formation in the western Mediterranean Sea. Mar. Pollut. Bull. 2019, 140, 523–535. [Google Scholar] [CrossRef] [PubMed]
- Rebelein, A.; Int-Veen, I.; Kammann, U.; Scharsack, J.P. Microplastic fibers—Underestimated threat to aquatic organisms? Sci. Total Environ. 2021, 777, 146045. [Google Scholar] [CrossRef] [PubMed]
- Rakib, M.R.J.; Hossain, M.B.; Kumar, R.; Ullah, M.A.; Al Nahian, S.; Rima, N.N.; Choudhury, T.R.; Liba, S.I.; Yu, J.; Khandaker, M.U.; et al. Spatial distribution and risk assessments due to the microplastics pollution in sediments of Karnaphuli River Estuary, Bangladesh. Sci. Rep. 2022, 12, 8581. [Google Scholar] [CrossRef] [PubMed]
- Di, M.; Wang, J. Microplastics in surface waters and sediments of the Three Gorges Reservoir, China. Sci. Total Environ. 2018, 616–617, 1620–1627. [Google Scholar] [CrossRef] [PubMed]
- Lin, L.; Pan, X.; Zhang, S.; Li, D.; Zhai, W.; Wang, Z.; Tao, J.; Mi, C.; Li, Q.; Crittenden, J.C. Distribution and source of microplastics in China’s second largest reservoir-Danjiangkou Reservoir. J. Environ. Sci. 2021, 102, 74–84. [Google Scholar] [CrossRef] [PubMed]
- Al Nahian, S.; Rakib, M.R.J.; Kumar, R.; Haider, S.M.B.; Sharma, P.; Idris, A.M. Distribution, characteristics, and risk assessments analysis of microplastics in shore sediments and surface water of Moheshkhali channel of Bay of Bengal, Bangladesh. Sci. Total Environ. 2023, 855, 158892. [Google Scholar] [CrossRef]
- Chen, H.; Jia, Q.; Zhao, X.; Li, L.; Nie, Y.; Liu, H.; Ye, J. The occurrence of microplastics in water bodies in urban agglomerations: Impacts of drainage system overflow in wet weather, catchment land-uses, and environmental management practices. Water Res. 2020, 183, 116073. [Google Scholar] [CrossRef]


| Sample Type | Sample | Sampling Date (d.m.y) & Time (h:m) | Depth (m) | GPS Coordonates | Sediment Lithology/Filtered Water Volume (m3) | |
|---|---|---|---|---|---|---|
| Longitude | Latitude | |||||
| Surface sediment | P1s | 17.11.2021; 14:05 | 0.10 | 26°11′52.6″ | 45°31′53.1″ | sand |
| P2s | 17.11.2021; 15:40 | 0.10 | 26°15′23.7″ | 45°29′15.6″ | sand | |
| P3s | 18.11.2021; 9:55 | 1.50 | 26°11′59.22″ | 45°31′38.94″ | siltic sand | |
| P4s | 18.11.2021; 10:04 | 2.00 | 26°12′0.72″ | 45°31′29.52″ | siltic mud | |
| P5s | 18.11.2021; 11:25 | 2.50 | 26°13′30.96″ | 45°30′48.58″ | mud | |
| P8s | 19.11.2021; 9:27 | 0.30 | 26°19′1.52″ | 45°24′26.85″ | sand | |
| P9s | 19.11.2021; 10:40 | 0.50 | 26°22′15.41″ | 45°18′14.82″ | sand | |
| Core | P4c | 18.11.2021; 10:10 | 2.00 | 26°12′0.72″ | 45°31′29.52″ | siltic mud |
| Surface water layer | P1a | 17.11.2021; 14:05 | 0.10 | 26°11′52.6″ | 45°31′53.1″ | 131.6 |
| P2a | 17.11.2021; 15:40 | 0.10 | 26°15′23.7″ | 45°29′15.6″ | 136.36 | |
| P6T | 18.11.2021; 12:50 | >5.00 | 26°14′55.93″–26°14′45.13″ | 45°29′54.82″–45°29′44.02″ | 403.2 | |
| P7T | 18.11.2021; 13:10 | >5.00 | 26°14′54.55″–26°14′25.31″ | 45°29′54.27″–45°29′51.44″ | 417.76 | |
| P8a | 19.11.2021; 9:27 | 0.30 | 26°19′1.52″ | 45°24′26.85″ | 579.6 | |
| P9a | 19.11.2021; 10:40 | 0.50 | 26°22′15.41″ | 45°18′14.82″ | 281.4 | |
| Abundance in Sediments | Location | Environment | Refs. |
|---|---|---|---|
| items/Kg | |||
| 268 | Siriu Reservoir—Buzău River, Romania | River and Reservoir system | This study |
| 324.5 ± 187.6 | Shaying River Basin, China | Basin level with dams | Shen et al., 2023 [24] |
| 310–2620 | Wujiang river basin, China | Cascade dams system | He et al., 2022 [23] |
| ~104 | Villerest reservoir, Loire R., France | River and Reservoir system | Dhivert et al., 2022 [22] |
| 1835 | Danjiangkou Reservoir, China | Lacustrine | Lin et al., 2021 [39] |
| 89.02 ± 20.96 | Fall Creek & Six Mile Creek, USA | River and Reservoir systems | Watkins et al., 2019 [21] |
| 25-300 | Three Gorges Reservoir, China | River and Reservoir systems | Di & Wang, 2018 [38] |
| items/km2 | |||
| 3407–13,617 | Three Gorges Dam, Yangtze River basin, China | River and Reservoir systems | Zhang et al., 2015 [4] |
Disclaimer/Publisher’s Note: The statements, opinions and data contained in all publications are solely those of the individual author(s) and contributor(s) and not of MDPI and/or the editor(s). MDPI and/or the editor(s) disclaim responsibility for any injury to people or property resulting from any ideas, methods, instructions or products referred to in the content. |
© 2024 by the authors. Licensee MDPI, Basel, Switzerland. This article is an open access article distributed under the terms and conditions of the Creative Commons Attribution (CC BY) license (https://creativecommons.org/licenses/by/4.0/).
Share and Cite
Pojar, I.; Dobre, O.; Lazăr, C.; Baboș, T.; Ristea, O.; Constantin, A.; Cristoiu, N. Microplastic Evaluation in Water and Sediments of a Dam Reservoir–Riverine System in the Eastern Carpathians, Romania. Sustainability 2024, 16, 4541. https://doi.org/10.3390/su16114541
Pojar I, Dobre O, Lazăr C, Baboș T, Ristea O, Constantin A, Cristoiu N. Microplastic Evaluation in Water and Sediments of a Dam Reservoir–Riverine System in the Eastern Carpathians, Romania. Sustainability. 2024; 16(11):4541. https://doi.org/10.3390/su16114541
Chicago/Turabian StylePojar, Iulian, Oana Dobre, Constantin Lazăr, Teodora Baboș, Oana Ristea, Alina Constantin, and Nicoleta Cristoiu. 2024. "Microplastic Evaluation in Water and Sediments of a Dam Reservoir–Riverine System in the Eastern Carpathians, Romania" Sustainability 16, no. 11: 4541. https://doi.org/10.3390/su16114541
APA StylePojar, I., Dobre, O., Lazăr, C., Baboș, T., Ristea, O., Constantin, A., & Cristoiu, N. (2024). Microplastic Evaluation in Water and Sediments of a Dam Reservoir–Riverine System in the Eastern Carpathians, Romania. Sustainability, 16(11), 4541. https://doi.org/10.3390/su16114541