Abstract
Land formation seriously disturbs coastal salt marsh wetland ecosystems, while its influences on soil organic carbon (SOC) under chronosequences remain unclear. In this study, the impacts of the land formation time (from one to fourteen years) and soil properties on the chronosequences changes of SOC in the nascent wetland of Hengsha Island were investigated. The study results showed the following. (1) As the land-formation time extended, the SOC experienced a significant increase, tripling after a period of 14 years. The changes in SOC occurred mainly in the surface layer but not in the deep soil layer. Specifically, the surface layer’s average SOC reached 5.52 g·kg−1, markedly higher than 3.17 g·kg−1 in the deeper layer. (2) Spearman correlation analysis revealed that the ammonium nitrogen (-N), aboveground biomass (AGB), and soil water content (SWC) were positively correlated with the SOC. Methane emissions (CH4) and SOC exhibited a negative correlation. (3) The structural equation model (SEM) illustrated that the duration of soil deformation directly impacted the vegetation growth and affected the distribution characteristics of the SOC by modifying the soil environmental conditions. Changes in SOC following land formation influenced the rapid succession of soil properties and vegetation, with the modification of carbon sinks in the ecosystems.
1. Introduction
The increasing CO2 concentration in the atmosphere, mainly driven by frequent anthropogenic activity (e.g., fossil fuel combustion), has caused a series of global climate change events [1,2]. A crucial step in mitigating excessive CO2 concentrations is to bolster the carbon sequestration capacity of ecosystems [3]. Notably, the soil carbon pool accounts for about two-thirds of the total global soil carbon pool [4], which is 3.3 times larger than the atmospheric carbon pool (760 Gt) and 4.5 times larger than the biogenic carbon pool (560 Gt) [5]. Therefore, the storage of soil organic carbon (SOC) assumes critical importance in regulating the carbon cycle and ameliorating climate change. Salt marsh wetlands, one of the most vital blue carbon systems, store a large amount of soil organic carbon because of the high net primary productivity and low soil organic matter decomposition rate [6,7]. According to research, the carbon burial rate in salt marshes is 30–50 times that of terrestrial forests, and 50–90% of the carbon is stored in the soil [8]. Salt marsh wetlands play global important roles in the burial and storage of organic carbon at the land–ocean interface, and may play a key part in climate regulation [9].
However, whether the nascent wetlands with rapid succession are carbon sources or sinks has not been conclusively concluded. Soil organic matter and organic carbon increased over time for coastal wetlands of different ages in North Carolina, USA [10]. A study of restored wetlands in the Platte Valley found that aboveground biomass, belowground biomass, soil organic carbon, and total nitrogen all increased with the number of years of wetland development [11]. The study by Zhang et al. (2017) [12] on Chongming Dongtan, China, found that with the evolution of wetland ecosystems, the soil water content gradually increased, the soil bulk density decreased, and the soil organic carbon and total nitrogen gradually accumulated. In the above studies, wetlands played the role of a carbon sink. Another study of three urban tidal brackish wetlands in the Meadowlands, New Jersey, found that these wetlands were all carbon sources in winter and recovered as carbon sinks in summer [13], which suggests that wetlands were not always carbon sinks.
Wetlands in the early stages of development (1–3 years) have higher rates of carbon and nitrogen accumulation than mature wetlands [14]. Organic carbon storage in nascent salt marsh wetlands is primarily derived by endogenous plant photosynthesis or exotic organic materials input [15]. Complex root systems and dense vegetation stems can also allow salt marsh wetlands to capture more sediment and organic matter from tides, thus enhancing carbon sequestration [16]. Carbon and nitrogen accumulation in nascent salt marsh wetlands generally occurs in the early stages of wetland development, mainly associated with the establishment of vegetation. However, organic carbon storage is not only correlated with functions such as organic matter accumulation and nutrient transformation [17,18], but also associated with soil properties such as soil salinity [19]. The change in the SOC is also subject to decomposition. These differences in soil water content (SWC) and plant composition in the emerging salt marsh wetlands significantly altered the soil redox status, plant growth, and species [20], which in turn affected the soil respiration, and ultimately, GHG emissions and carbon balance [21]. In particular, the SOC content is affected by several factors including vegetation cover, hydrology, and the soil physical and chemical properties [4,16]. Vegetation cover has also changed under the combined effect of natural and anthropogenic factors, from pioneer saline plants to mesophytes [22,23]. The succession of plant communities affects soil properties, which in turn has an effect on the SOC [24].
To summarize, most of these studies assessed carbon stocks through field sampling and carbon flux monitoring [25], or assessed factors related to soil carbon stocks based on experimenting and monitoring changes in the water level, salinity, and nitrogen deposition [26,27]. Despite increasing attention to the relationship between environmental conditions and soil organic carbon [28], less is known about carbon dynamics and its mechanisms in dynamically developing nascent wetlands under a time chronosequence. Hengsha Island in the Yangtze estuary is a typical salt marsh wetland with rapid succession and nascent development in the presence of artificial interventions [29], which is most susceptible to anthropogenic activities and sea–land interactions. At present, Hengsha Island is a transitional habitat type between natural tidal flats and land formation [30]. During the silt promotion process, large areas of nascent wetlands were gradually formed on Hengsha Island with the blowing and filling of sediments on the flats [31]. The rapid development of wetland plants on Hengsha Island gradually formed a composite habitat consisting of artificial woodland, aquatic plants, submerged plants, water, and light beach [32]. Hengsha Island is a saltwater confluence greatly affected by tidal currents and waves. Its surface salinity and vegetation growth are significantly differentiated spatially, which provides an excellent example for studying vegetation growth, soil environment changes, and their impact on the carbon sequestration capability of wetlands [33]. Therefore, studying the variation patterns of the SOC and its influencing factors in the new salt marsh wetland on Hengsha Island holds great value for correctly interpreting the ecological impact of land formation activities and thoroughly understanding the mechanism of wetland carbon storage. Here, the nascent wetland of Hengsha Island in the Yangtze River estuary was investigated according to soil age, with the aim to: (1) determine the dynamic pattern of soil organic carbon in the new wetland during rapid succession, and (2) understand the key influencing factors of soil organic carbon in the new salt marsh wetland at the Yangtze River estuary. Results would provide scientific evidence for the ecological restoration of salt marsh wetlands and the management of nascent wetlands.
2. Materials and Methods
2.1. Study Area
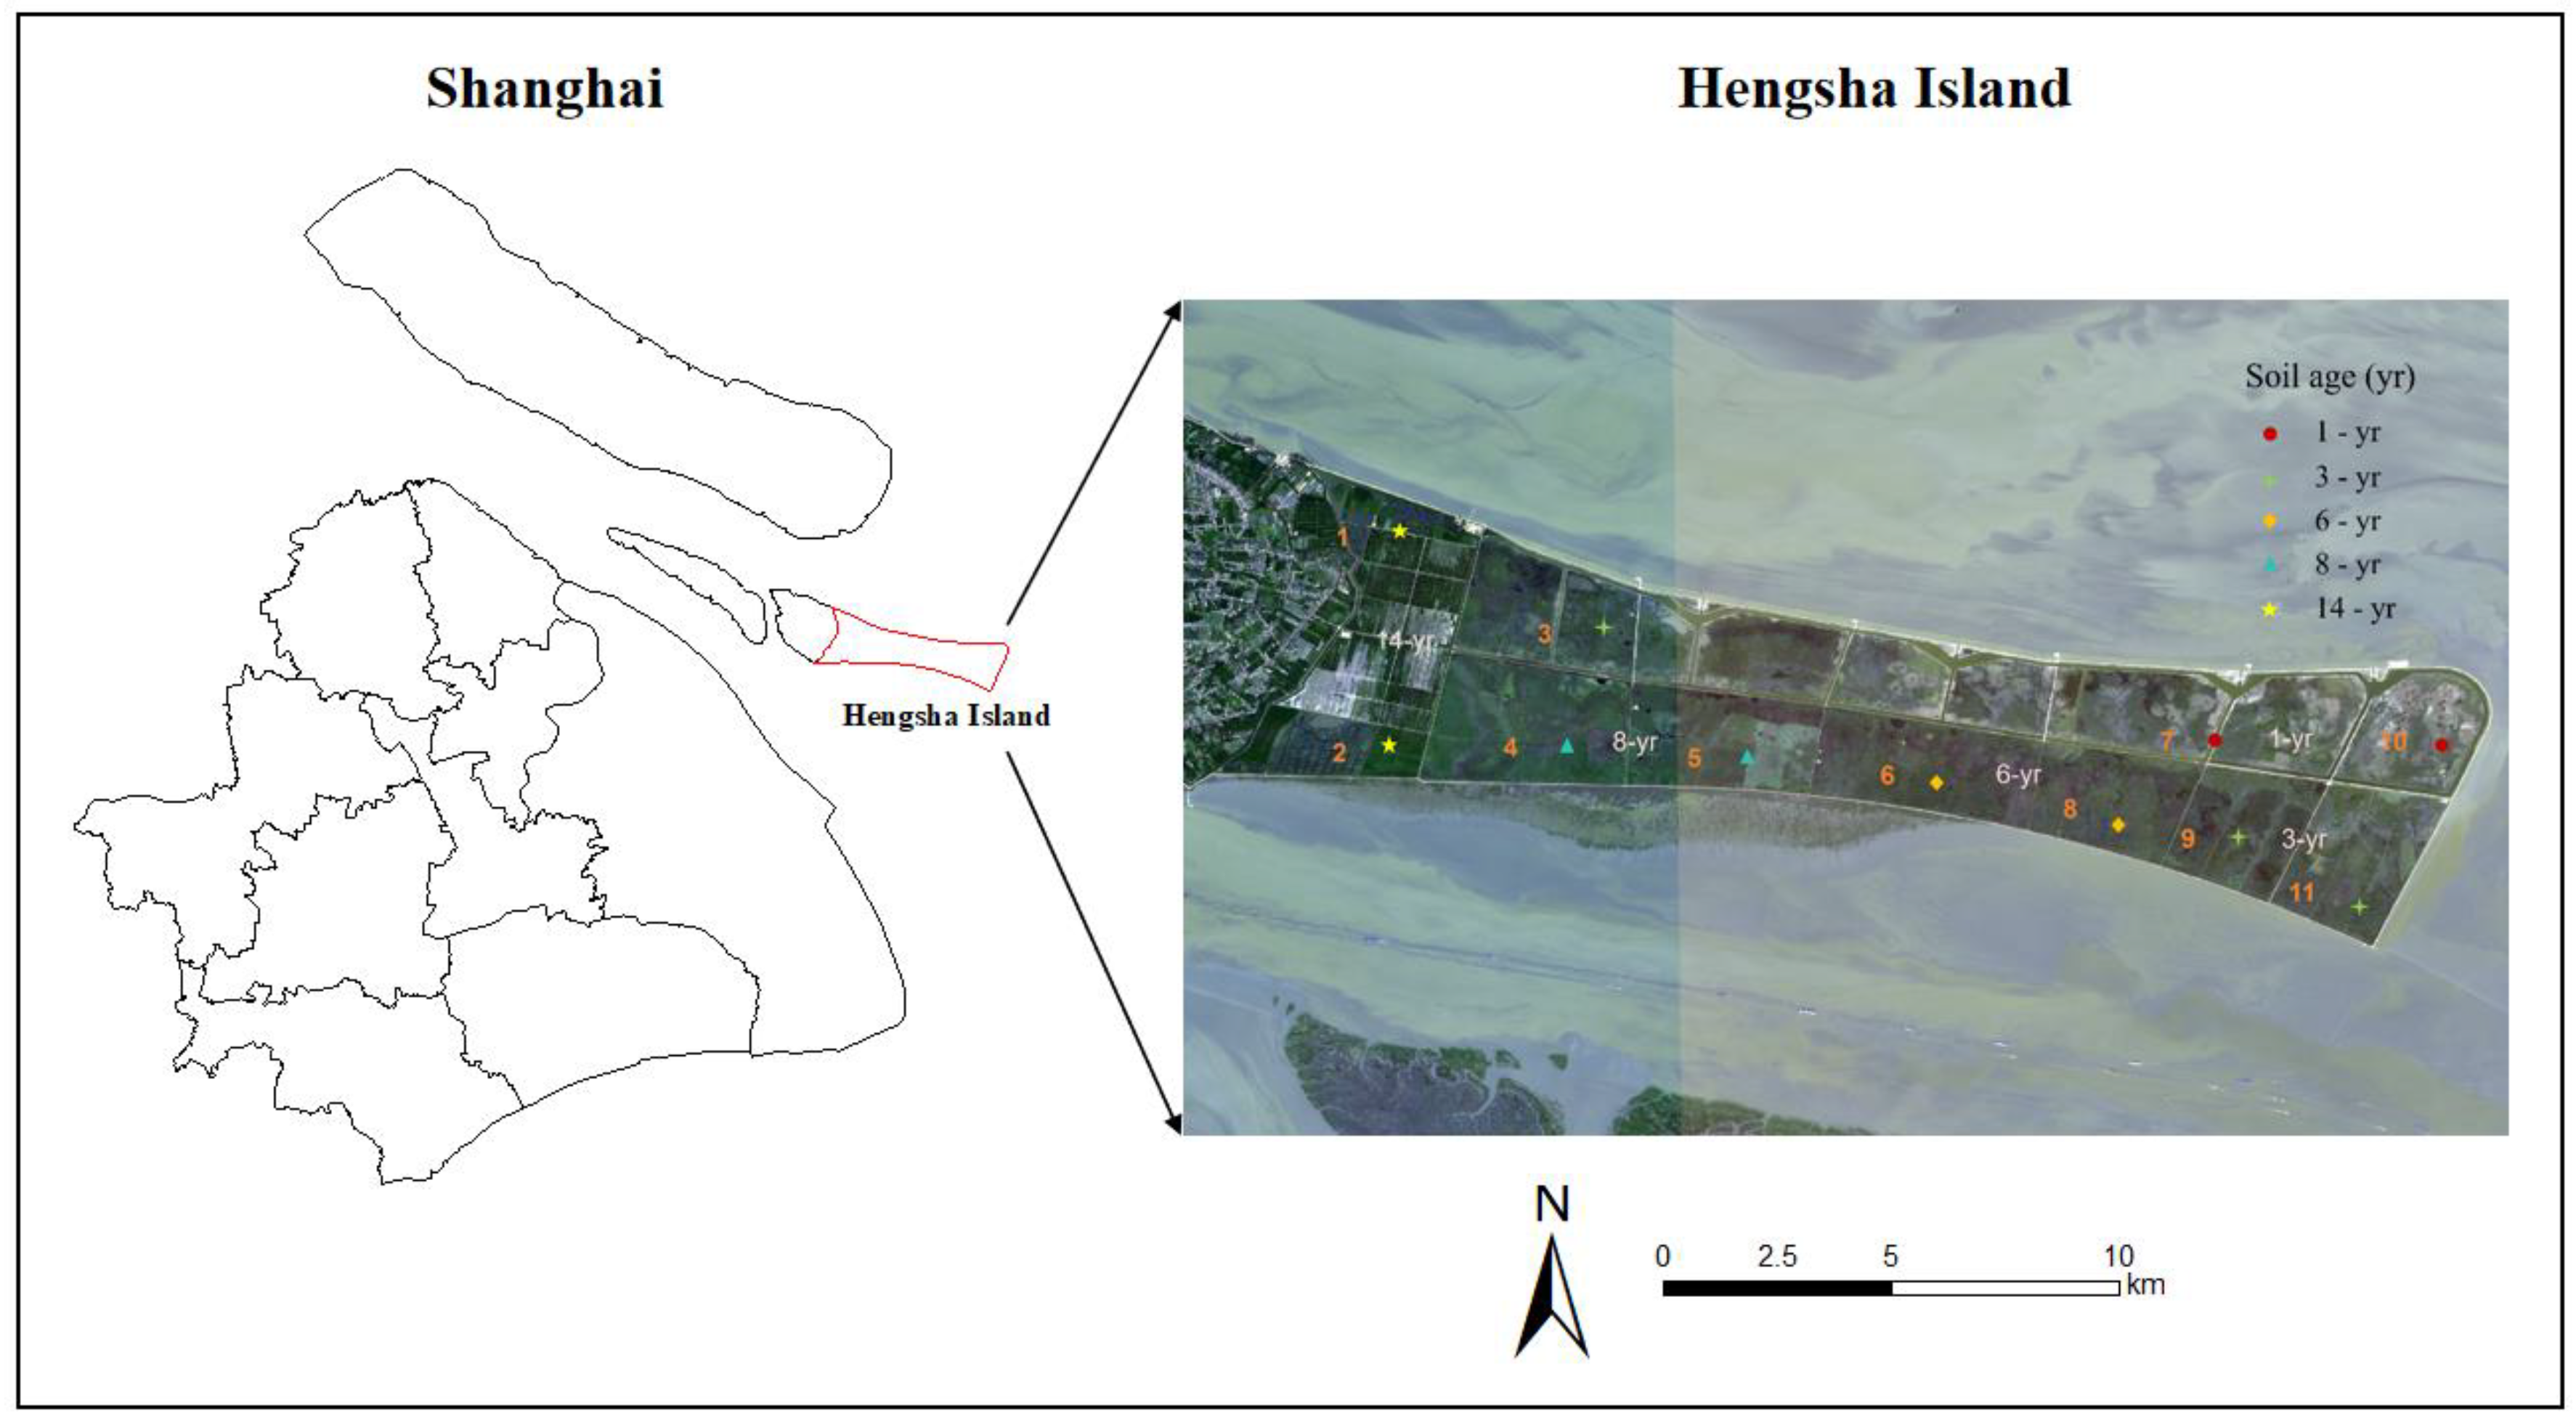
The study was conducted in an extensive salt marsh on Hengsha Island, which is located at the easternmost point of the Yangtze River estuary, Shanghai, China (121°58′–122°20′ E, 31°36′–31°51′ N). It is an alluvial island created by sediment discharged from the Yangtze River near the river mouth and subsequently deposited onto the water surface. A land formation project was conducted on the east coast of Hengsha Island from 2003 to 2020 [34], which constructed dikes on nascent wetlands and controlled the water level in them. The project was segmented into four primary phases, scheduled for completion in 2008, 2015, 2017, and 2020, respectively. Hengsha Island and the beach are shaped like a tongue from west to east. Following project completion, the island’s area has significantly expanded from the original 52 square kilometers to 155 square kilometers. The climate in this area is a typical subtropical monsoon climate. The mean annual temperature is 15.4 °C, with an average of 24.5 °C in summer and 4.3 °C in winter. In this region, the annual precipitation varies greatly, mainly occurring from June to October, totaling approximately about 1100 mm per year. The highest tide level is at 5.9 m and the lowest at −0.27 m. Due to the short history of the shoals, the soil type is original and simple, predominantly consisting of saline-alkali clay and sandy loam. Soil pH ranges from 7.55 to 9.68, and soil salinity is about 0.38–5.33‰. The primary vegetation types on Hengsha Island are Phragmites australis, Scirpus mariqueter, Suaeda glauca Bunge, and so on.
2.2. Study Design and Sample Collection
In order to understand the influences of soil age and environmental factor on the SOC in salt marshes, we implemented a field experiment in 2022. The space-for-time substitution approach was used to investigate the SOC in artificial wetlands at different developmental stages [35]. Based on the analysis of the vegetation distribution results on Hengsha Island from 2008 to 2022 using remote sensing, five distinct soil development ages with characteristic differences were identified. Specifically, the salt marsh wetlands in Hengsha Island were divided into five stages of land formation (1, 3, 6, 8, and 14 years), and the sampling plot distributions are shown in Figure 1. There were 11 sampling plots in the experimental area. On each sampling plot, three subplots (50 × 50 cm) were randomly set as replicates for the plant and soil samples. All aboveground litter and plant detritus were removed by sickle at each subplot. In mid-August, soil samples were collected at depths of 0–10, 10–20, 20–30, and 30–50 cm with a column sampler using the five-point sampling method and sealed in labeled plastic bags.
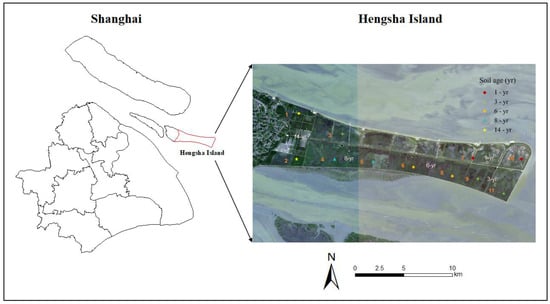
Figure 1.
Sample site layout at Hengsha Island.
2.3. Plant Biomass, Soil Characteristics, and Soil Respiration Measurements
The soil samples were dried naturally, ground, and sieved (80 mesh). A portion of the soil samples were acidified by 1 M HCl, and washed with distilled water to neutral after the inorganic carbon in the samples had reacted sufficiently, and dried by oven (not more than 60 °C) for the SOC measurement. The determination of the total soil nitrogen (TN) content was carried out by an elemental analyzer (Elementar, Langenselbold, Germany). Within each sample plot, the soil pH was determined with a portable soil pH meter (SoilStik, Spectrum, Haltom City, TX, USA). The soil water content (SWC) was determined through fresh soil samples oven-dried at 80 °C until a constant weight was achieved. -N and -N were analyzed by a fully automated continuous flow analyzer (AA 3, Seal, Germany). Soil from the corresponding soil layer was collected with a ring cutter, and later calculated to obtain the soil bulk weight. Polyvinyl chloride (PVC) soil respiration rings, 20 cm in diameter and 12 cm in height, were embedded in each parallel plot at a depth of 10 cm into the soil, with the upper end 2 cm above the ground, and the rate of CO2 production was determined using an automated soil respiration system (LI-8100, LI-COR Inc., Lincoln, NE, USA). A portable micro soil flux measurement system (N2OM 1-919) was used to determine the CH4. The measurement time was chosen between 10:00 and 12:00 on a sunny day. The measurement frequency was 1 HZ, and one measurement cycle was 5 min, which was repeated three times. At the same time, all of the aboveground tissues of the plants (included litter and detritus) in the sample plots were harvested and brought back to the laboratory where the roots and leaves were sorted out, rinsed, dried, and then weighed for aboveground biomass.
2.4. Statistical Analysis
Two-way ANOVA and Tukey’s HSD were employed to assess the significant variations in the soil organic carbon content and environmental factors in the salt marsh wetlands (p < 0.05). Additionally, Pearson correlation analysis was performed to examine the relationships between the soil physical and chemical properties and soil organic carbon content. In this case, the soil depth was divided into surface (0–20 cm) and deeper (20–50 cm) layers to be considered. Furthermore, a structural equation model (SEM) was employed to analyze the impact of environmental factors on the change in soil organic carbon using the R version 4.0.5 software (R Core Team 2017). A general linear regression was used to fit AGB, SAL, SWC, CO2, CH4, and land formation time. Statistical analyses were performed with SPSS 23.0 (SPSS Inc., Chicago, IL, USA) and Origin 2023 statistical software was utilized for drawing.
3. Results
3.1. Changes in Plant Community Distribution and Aboveground Biomass
The distribution of plant communities in this study area is complex and did not follow the natural succession process of salt marshes from aquatic to terrestrial (Table 1). In the early stage of land development, the main plant species on the east beach of Hengsha Island was Achnatherum splendens. After 8 years of land formation, a large amount of salt marsh vegetation such as Phragmites australis, Suaeda glauca, and Scirpus mariqueter emerged. When salt marshes had developed over a 14-year period, the most dominant species was Phragmites australis, which covered more than 90% of the plant community. Additionally, a highly salt-tolerant tree species, Tamarix chinensis (Table 1), appeared in the 14 year land formation area. The plant aboveground biomass (AGB) showed an obviously positive relationship with the development time of salt marshes (p < 0.001, Figure 2). The highest content of AGB was in the 14-year period (2.64 ± 0.53 kg·m−2), and approximately twice than that of the 1 year salt marsh (1.32 ± 0.33 kg·m−2).

Table 1.
The main vegetation distribution and aboveground biomass on Hengsha Island at various times.
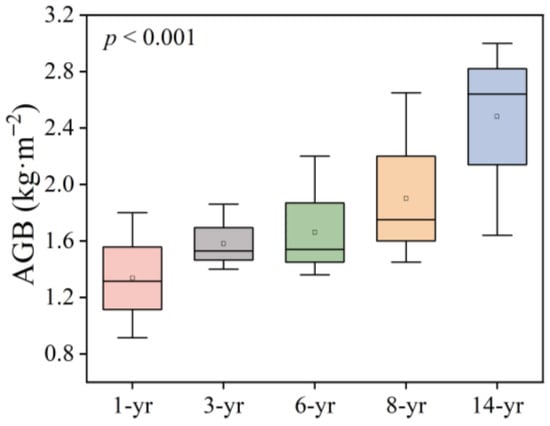
Figure 2.
Changes in the aboveground biomass (AGB, kg·m−2) of the dominant plant species on Hengsha Island during land formation.
3.2. Variations in Soil Physicochemical Properties of Soil Formation Time and Depth
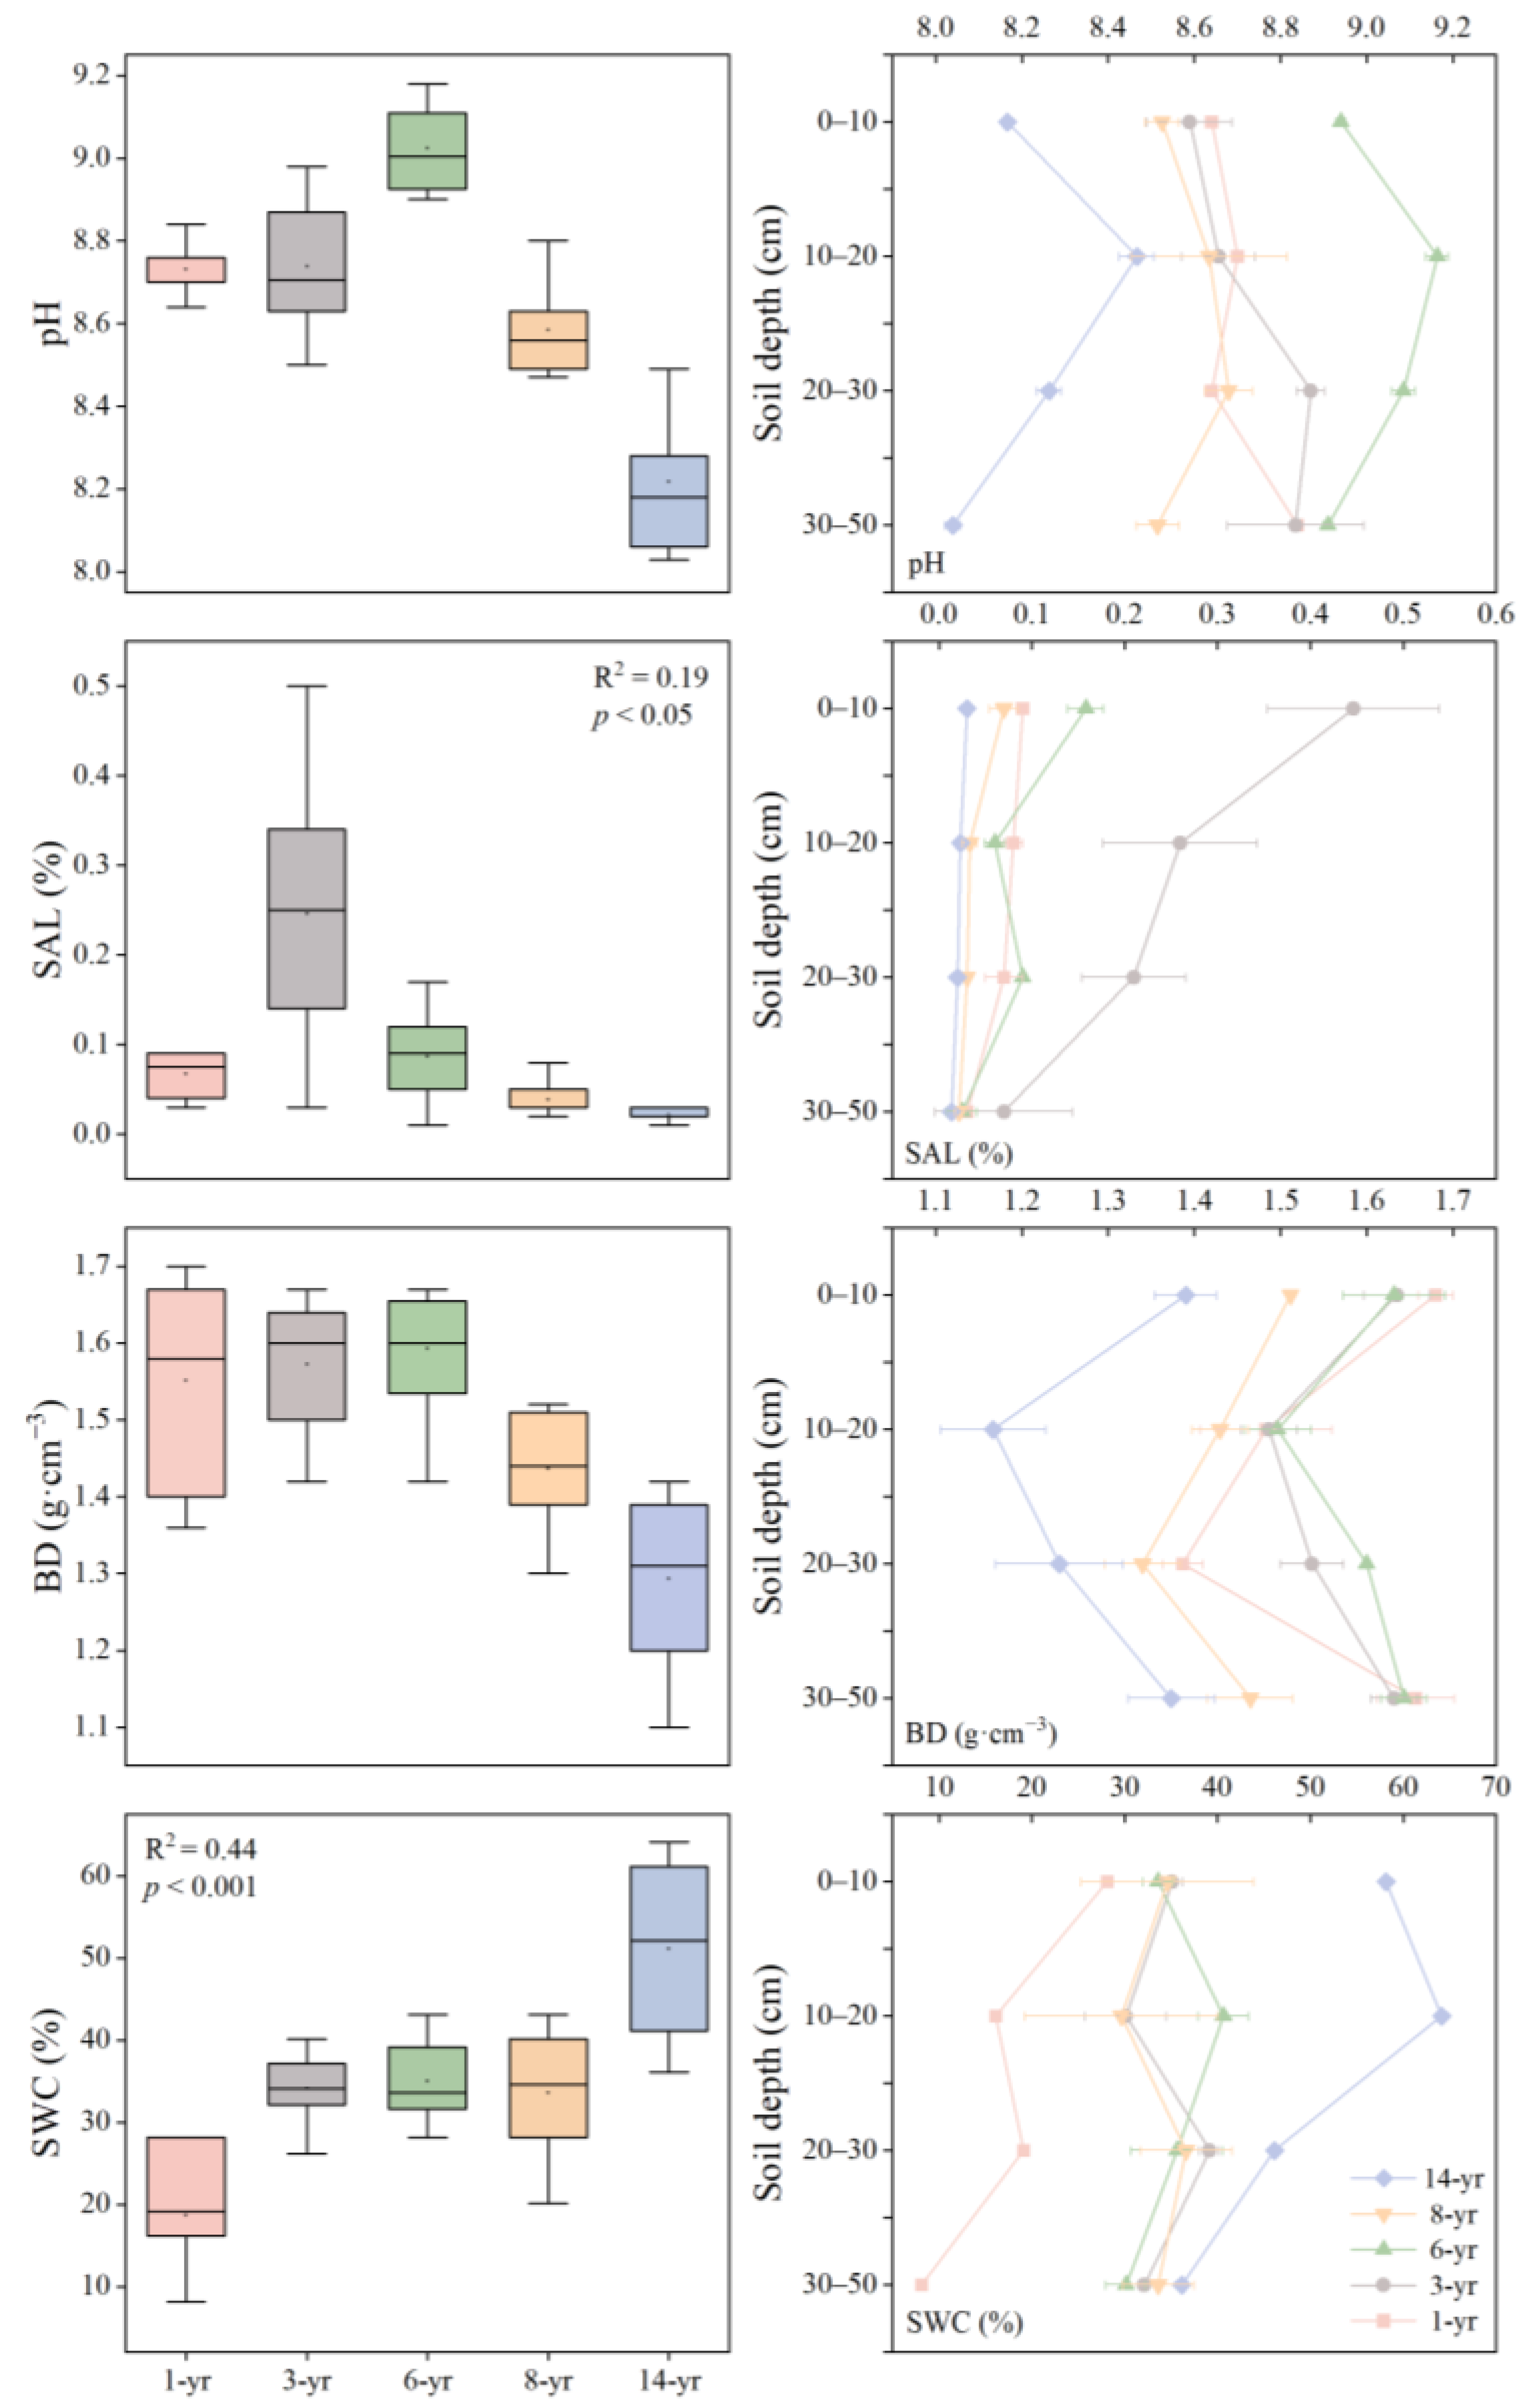
On Hengsha Island in the Yangtze estuary, the soil environmental factors changed rapidly over the years of wetland development. The soil pH was found to be greater than 7, initially increasing and then decreasing as the land formation time progressed with a recorded range of 8.21–9.02 (Figure 3). The soil pH between 0 and 20 cm increased with depth. The soil water content (SWC) increased significantly as the land formation time extended (p < 0.001), and the highest value of SWC was observed in the 14-year period. Notably, the surface soil had a higher SWC than deep soil (p < 0.05, Table 2). Soil salinity exhibited a decreasing trend during the period of 3–14 years with a range of 0.02% to 0.08%. The lowest mean value of soil salinity was recorded in the 14-year period. In addition, among the various time groups, the most significant difference in soil salinity was observed in the 0–20 cm soil layer (Figure 3). The soil salinity exhibited a slight decrease compared to that of the early stage after 8 years. During the period of 6–14 years, the soil bulk density decreased (Figure 3). Meanwhile, the ANOVA analysis revealed a significant interaction between the land formation time and soil depth (p < 0.05), which implies that both had a distinct effect on the soil physical properties (p < 0.001, Table 2).
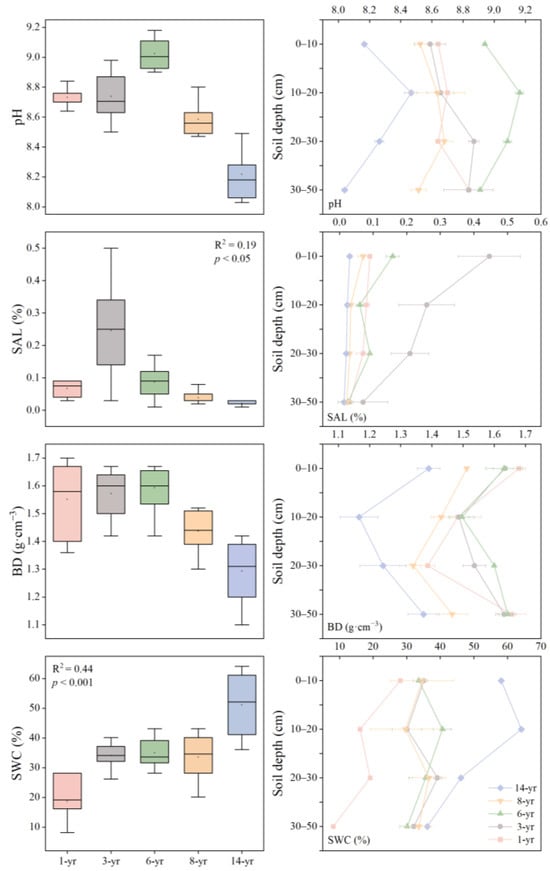
Figure 3.
The soil pH, water content (SWC, %), salinity (SAL, %), and bulk density (BD, g·cm−3) varied with land formation time (1–14 years), and soil depth (0–50 cm).
Table 2.
The main impacts of land formation time (A) and soil depth (D) on the soil characteristics properties and their interactive effects in two-factor ANOVA.
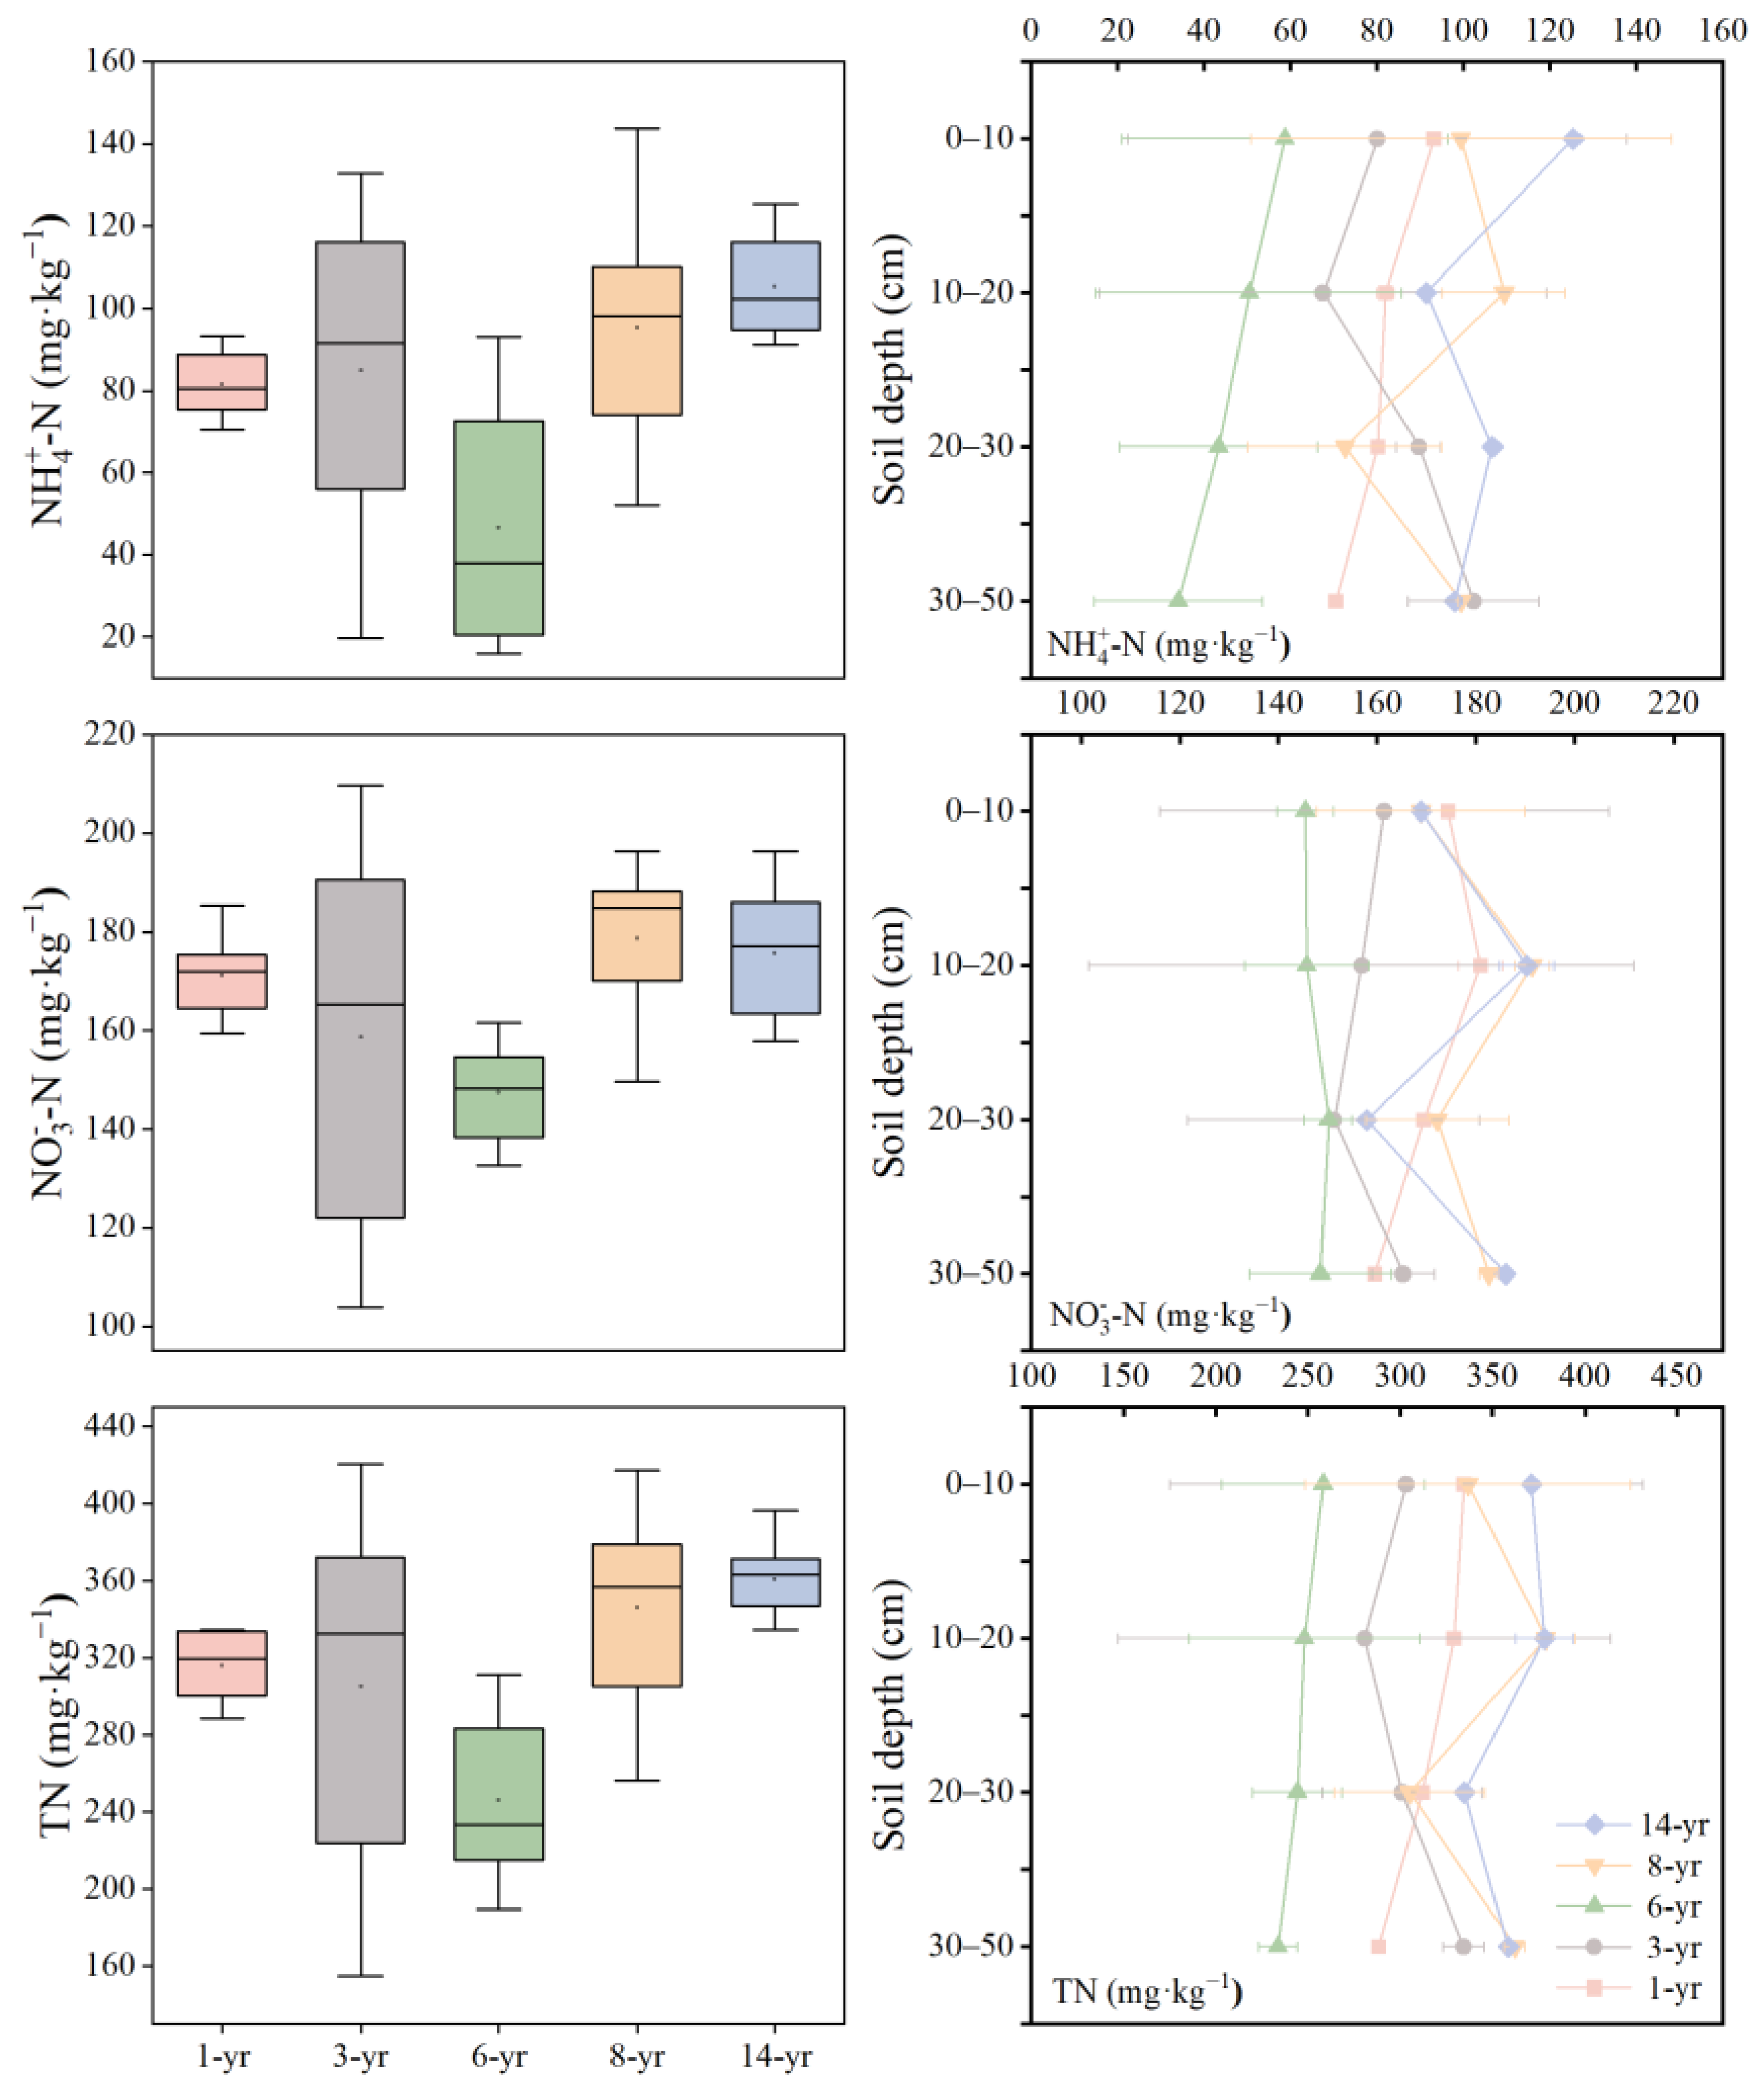
As shown in Figure 4, the soil nitrogen content of the nascent wetland initially decreased and then increased as the land formation time progressed, with the lowest soil nitrogen content observed in the 6-year period. Soil ammonium nitrogen (-N) ranged from 46.58 to 105.33 mg·kg−1 (Figure 4). The highest content of soil -N was recorded in the 14-year period, showing a slight increase compared to the early stage. Soil nitrate nitrogen (-N) ranged from 147.47 to 178.75 mg·kg−1. Similarly, the mean content of -N at the 14-year period of land formation was remarkably higher than that in the early stage. Additionally, the ANOVA analysis indicated a significant interaction between land formation time (p < 0.001, Table 2). The mean range of the total nitrogen (TN) content varied from 246.03 to 360.68 mg·kg−1 at different land formation times (Figure 4). Table 2 shows that the TN content in the 0−20 cm soil layer at the 14-year period was significantly higher than that in other land formation time and soil depths (p < 0.01).
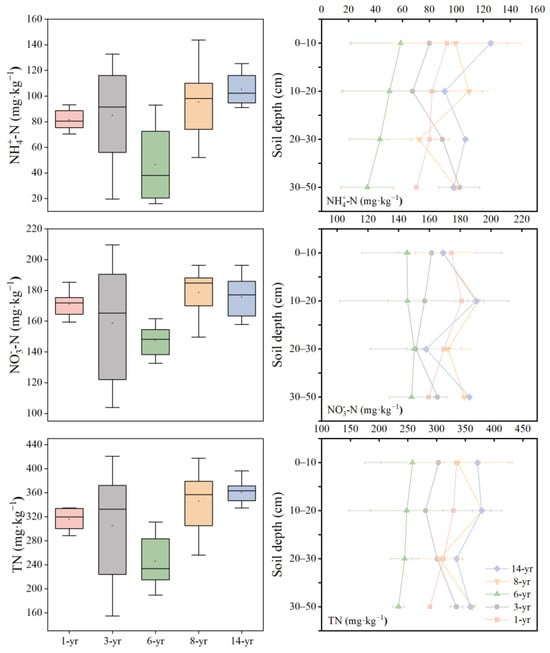
Figure 4.
Changes in soil ammonia nitrogen (-N, mg·kg−1), nitrate nitrogen (-N, mg·kg−1), and total nitrogen (TN, mg·kg−1) with land formation time and soil depth.
3.3. Variations in Soil Respiration in Relation to Land Formation Time
The CO2 fluxes in the salt marsh wetland ranged from 3.86 to 11.55 μmol·m−2·s−1 (Figure 5), with significant differences between the different periods (p < 0.001), and the CO2 fluxes increased as the land formation time progressed. The largest average value of the soil CO2 fluxes was measured in the 14-year period. However, the smallest value of CO2 flux was measured in the 1-year period. Soil CH4 fluxes in the study area varied from 6.35 to 22.84 nmol·m−2·s−1, and the CH4 flux decreased with the increase in the land formation time (p < 0.001). The mean soil methane emission at the beginning of land formation was the highest among all of the sample sites, nevertheless, the soil CH4 fluxes at 14 years was lower than that of all the other years.
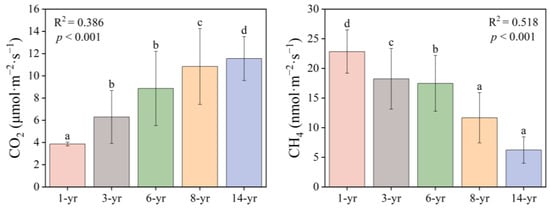
Figure 5.
Changes in CO2 (μmol·m−2·s−1) and CH4 (nmol·m−2·s−1) in the soils of Hengsha Island at different times of land formation. R2 indicates the degree of fit between the land formation time and gas fluxes. (a–d) indicates the results of the significant difference analysis, with different letters representing significance at p < 0.05.
3.4. Spatial Variations in SOC with Soil Formation Time and Depth
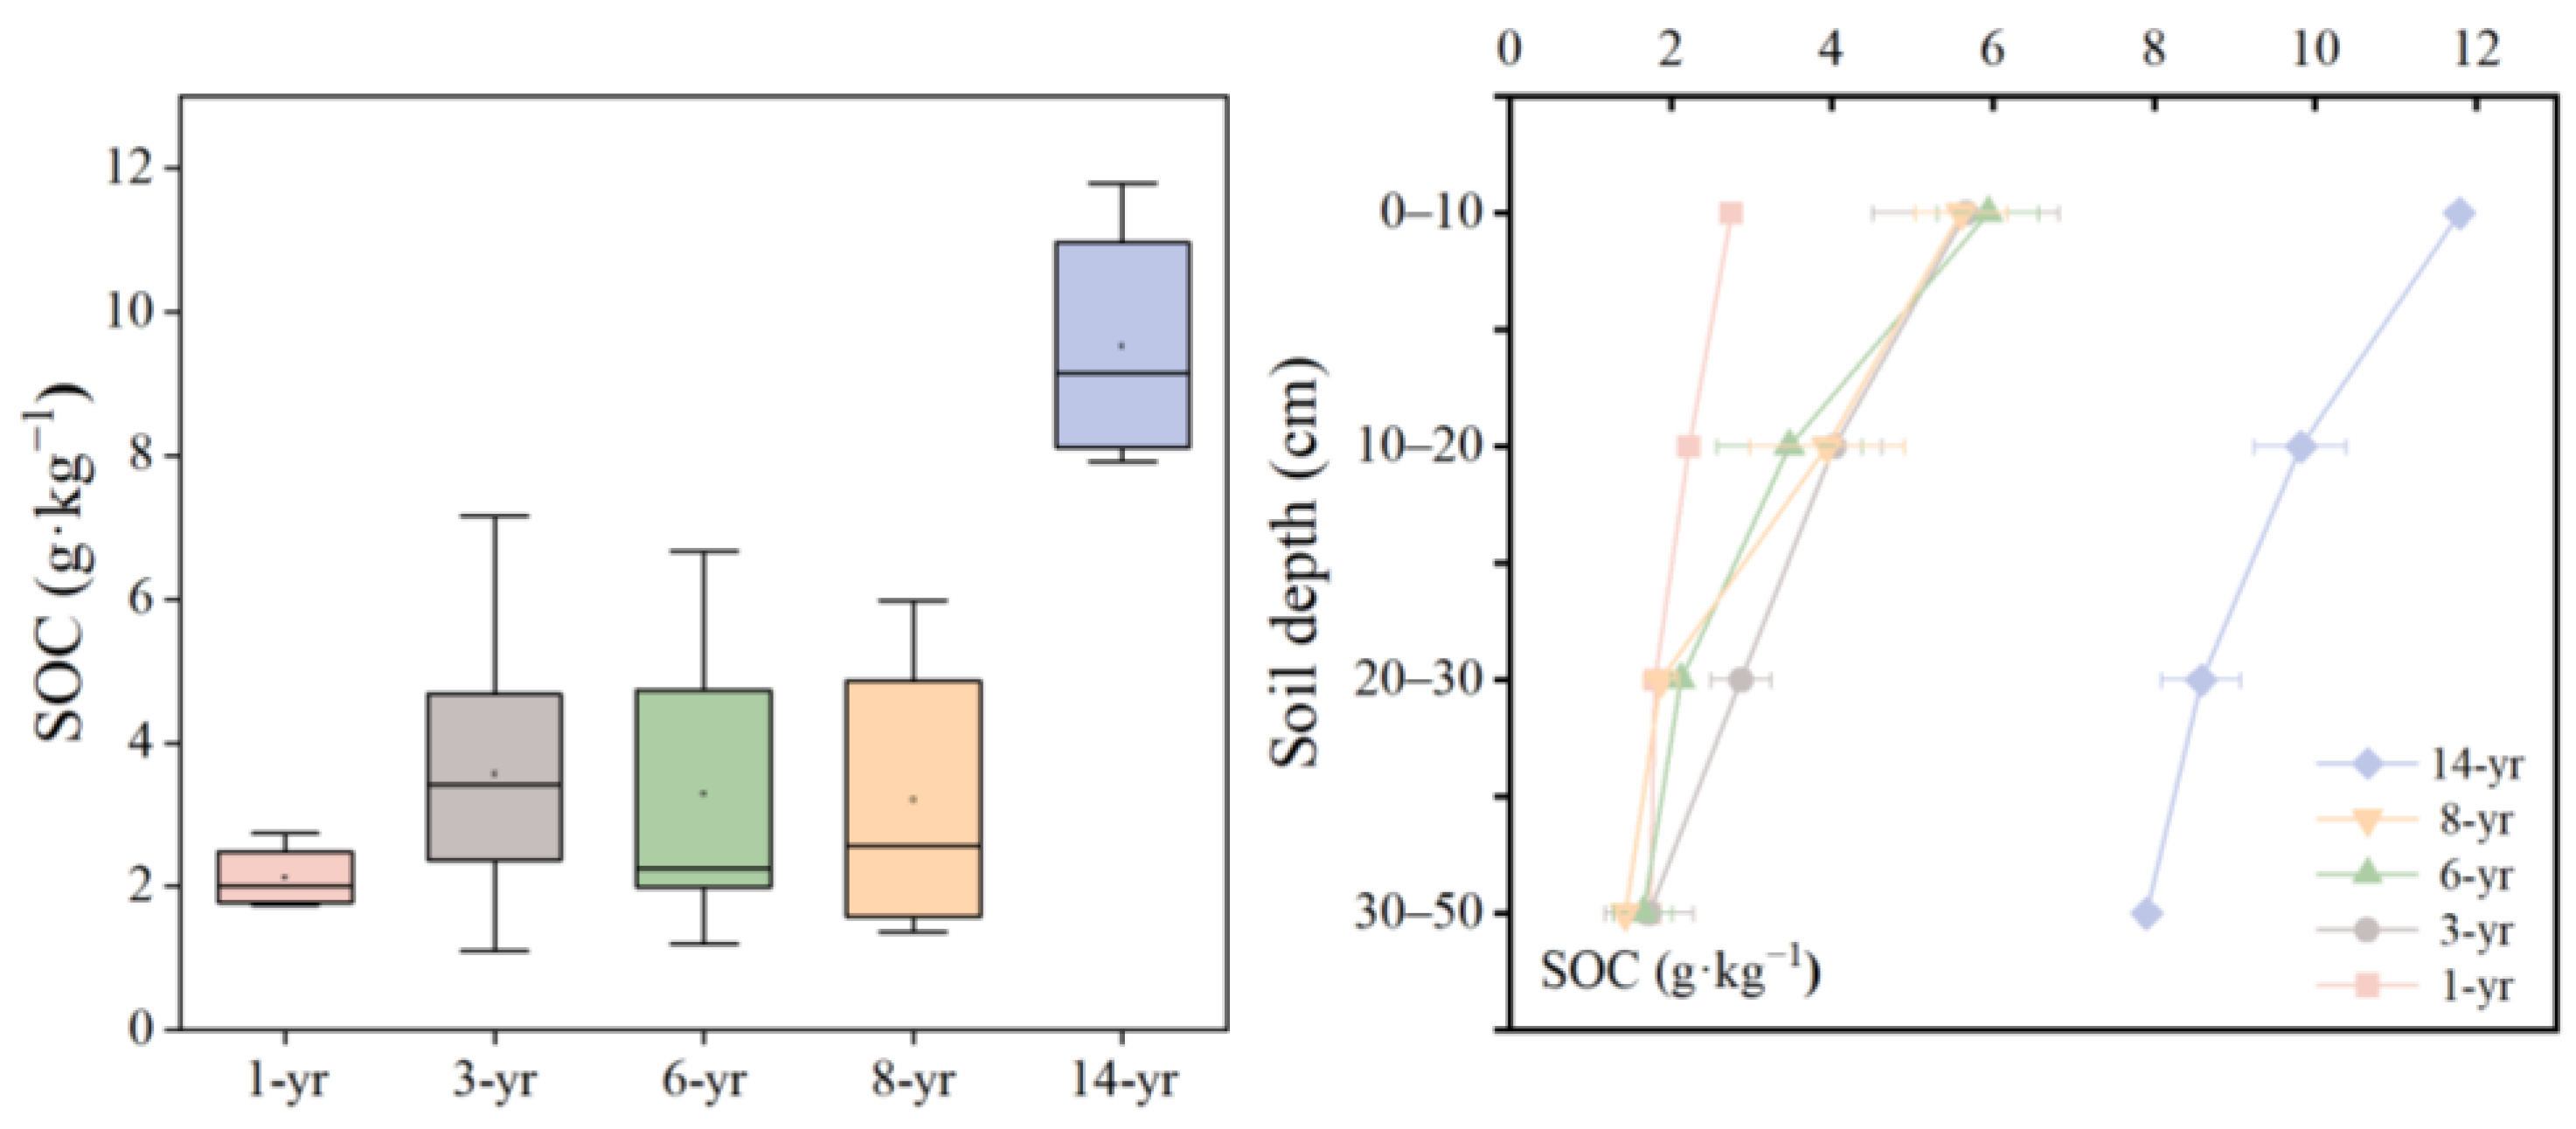
The results showed that the SOC content varied from 2.12 to 9.53 g·kg−1 and increased with soil formation time from six to fourteen years (Figure 6), and the trend of the SOC content in different soil ages was similar to that of the soil water content. Notably, the average SOC content was lowest in the early stage of land formation and reached its highest level in the 14-year period, which increased by 350% compared with the early stage of land formation. The greatest difference in the SOC at various times of land formation was observed in the 0–20 cm soil layer (Figure 6). The SOC content in the surface layer (0–20 cm) ranged from 2.74 to 11.80 g·kg−1 with a mean of 5.52 g·kg−1, and the deeper layer (20–50 cm) SOC ranged from 1.42 to 9.82 g·kg−1 with a mean of 3.17 g·kg−1. Therefore, the mean SOC content in the surface layer was higher than that in the deeper layer (Figure 6). Additionally, the ANOVA analysis revealed that the land formation time and soil depth had a strong effect on the SOC (p < 0.001, Table 2).
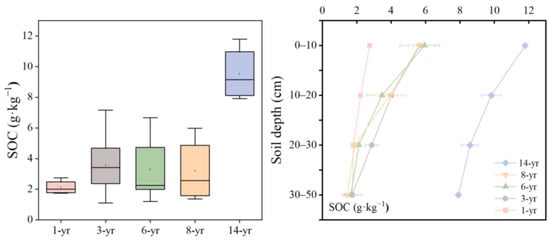
Figure 6.
Variation in the SOC (g·kg−1) with the soil formation time and soil depth.
3.5. Effects of Plant Growth and Soil Characteristics on SOC
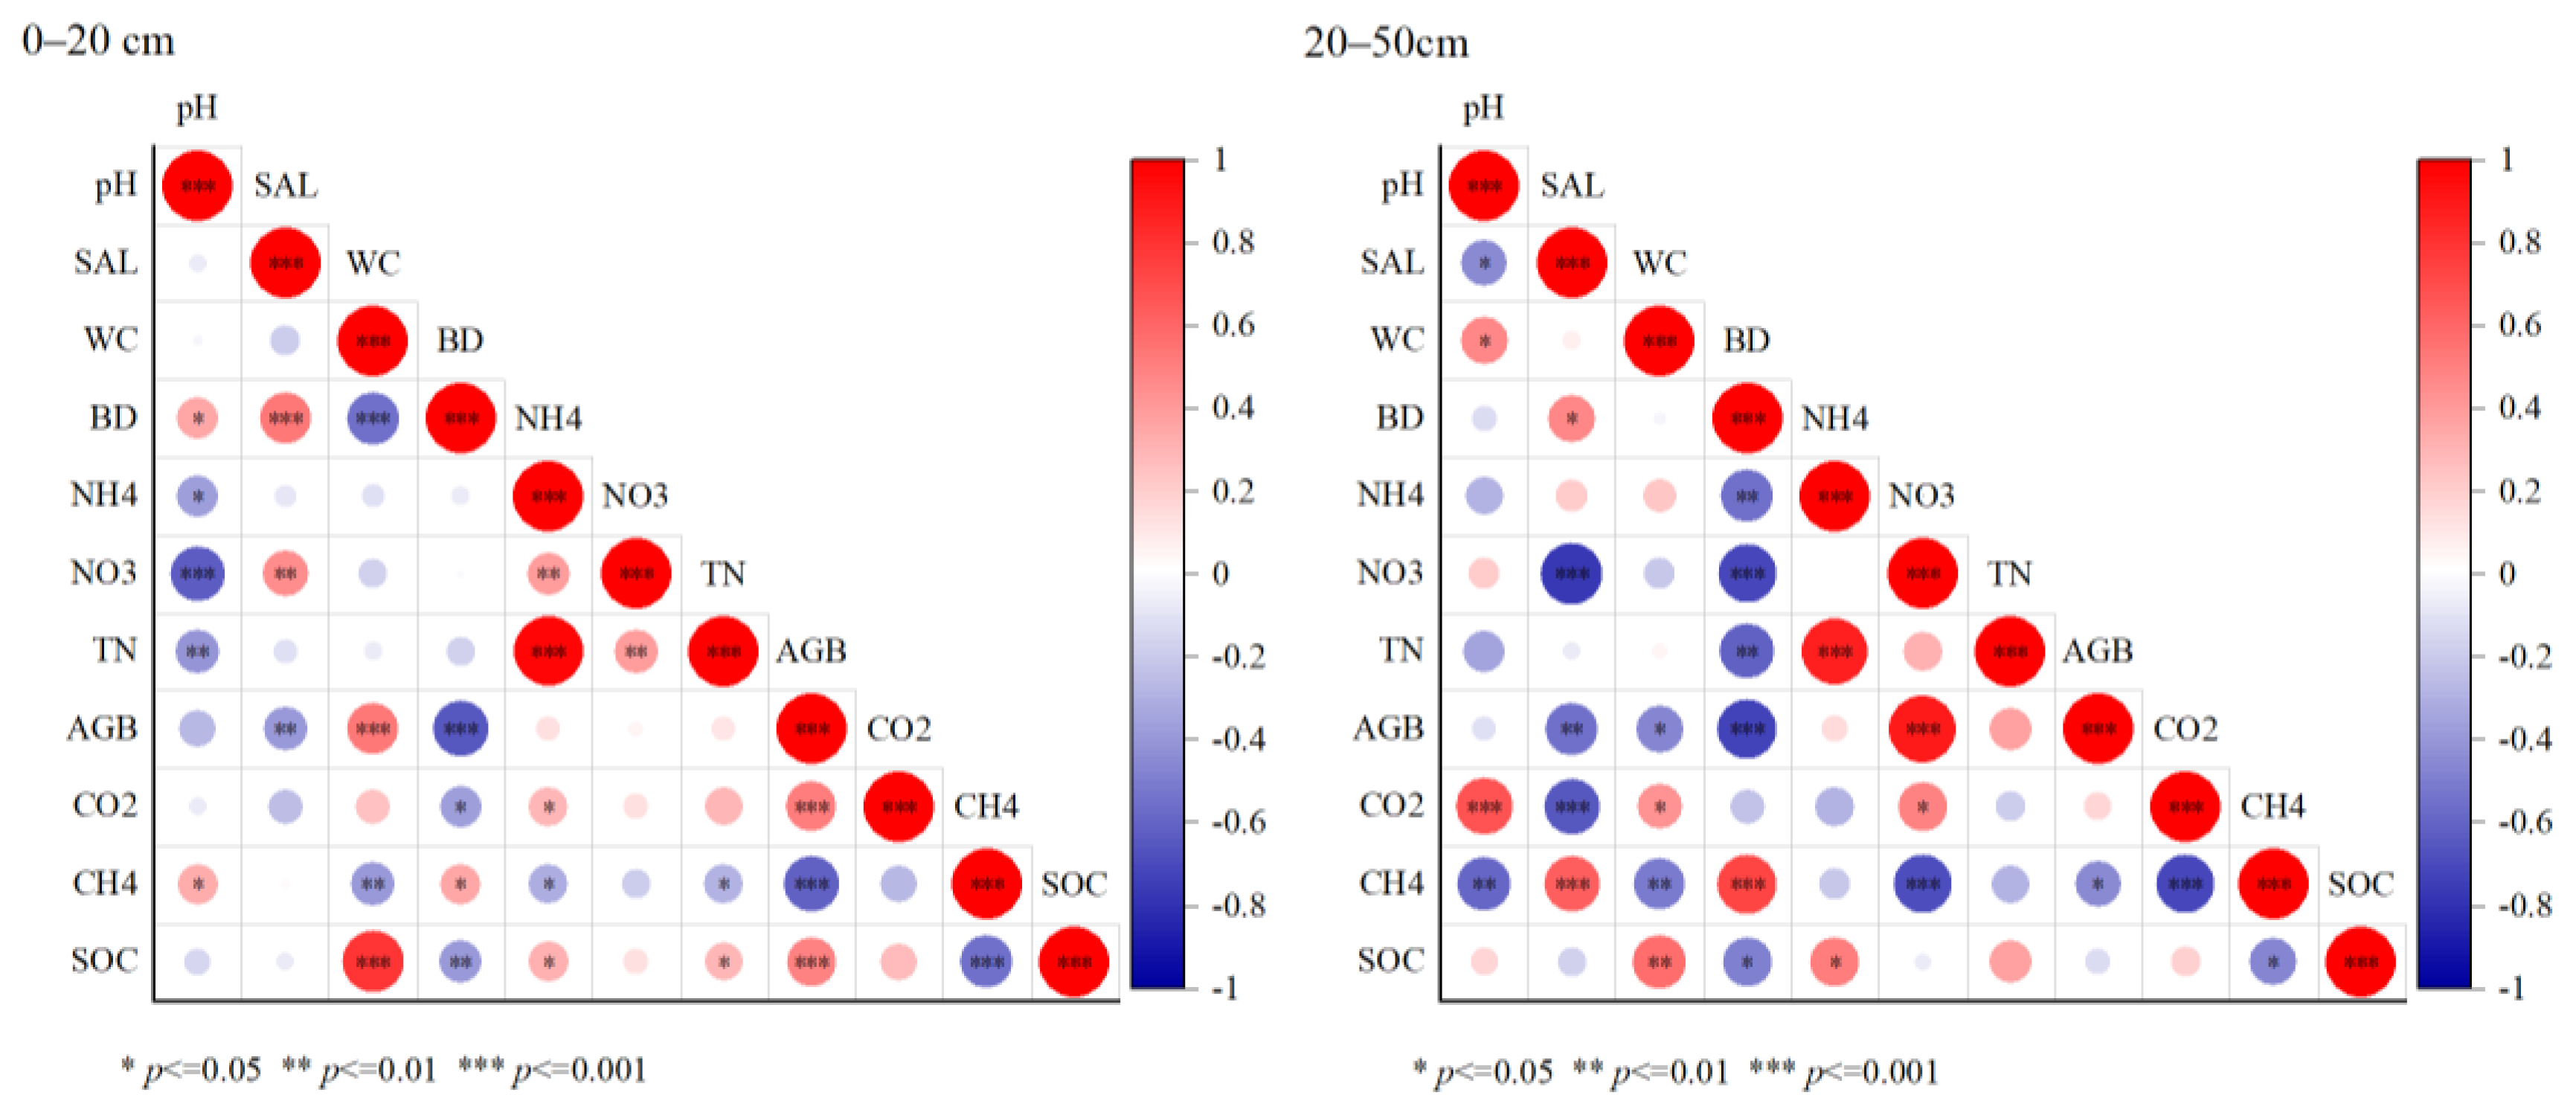
The correlations between the soil environmental factors and SOC in the 0–20 and 20–50 cm soil profiles were analyzed in Figure 7. In the 0–20 cm soil surface profile, AGB and SWC showed significant positive correlations with the SOC (p < 0.001, Figure 7), with correlation coefficients of 0.49 and 0.78, respectively. Soil -N and TN showed a positive correlation with the SOC (p < 0.05). Soil bulk density and CH4 fluxes showed a significant negative correlation with the SOC (p < 0.01). However, the correlations between the indicators in the 20–50 cm profile were higher than in the surface profile. Significant positive correlations were found between the SWC (p < 0.01), -N (p < 0.05), and SOC, with correlation coefficients of 0.57 and 0.50, respectively. Soil bulk weight and CH4 fluxes were significantly negatively correlated with the SOC (p < 0.05). Moreover, AGB was significantly negatively correlated with soil salinity (p < 0.01) and the SWC (p < 0.05).
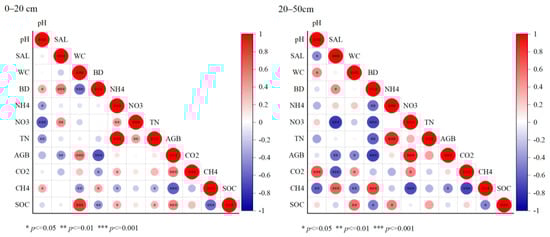
Figure 7.
Correlation analysis of the soil physical and chemical indicators with profile. The size of the circle represents the significance of the variable. Colors indicate Spearman’s correlations.
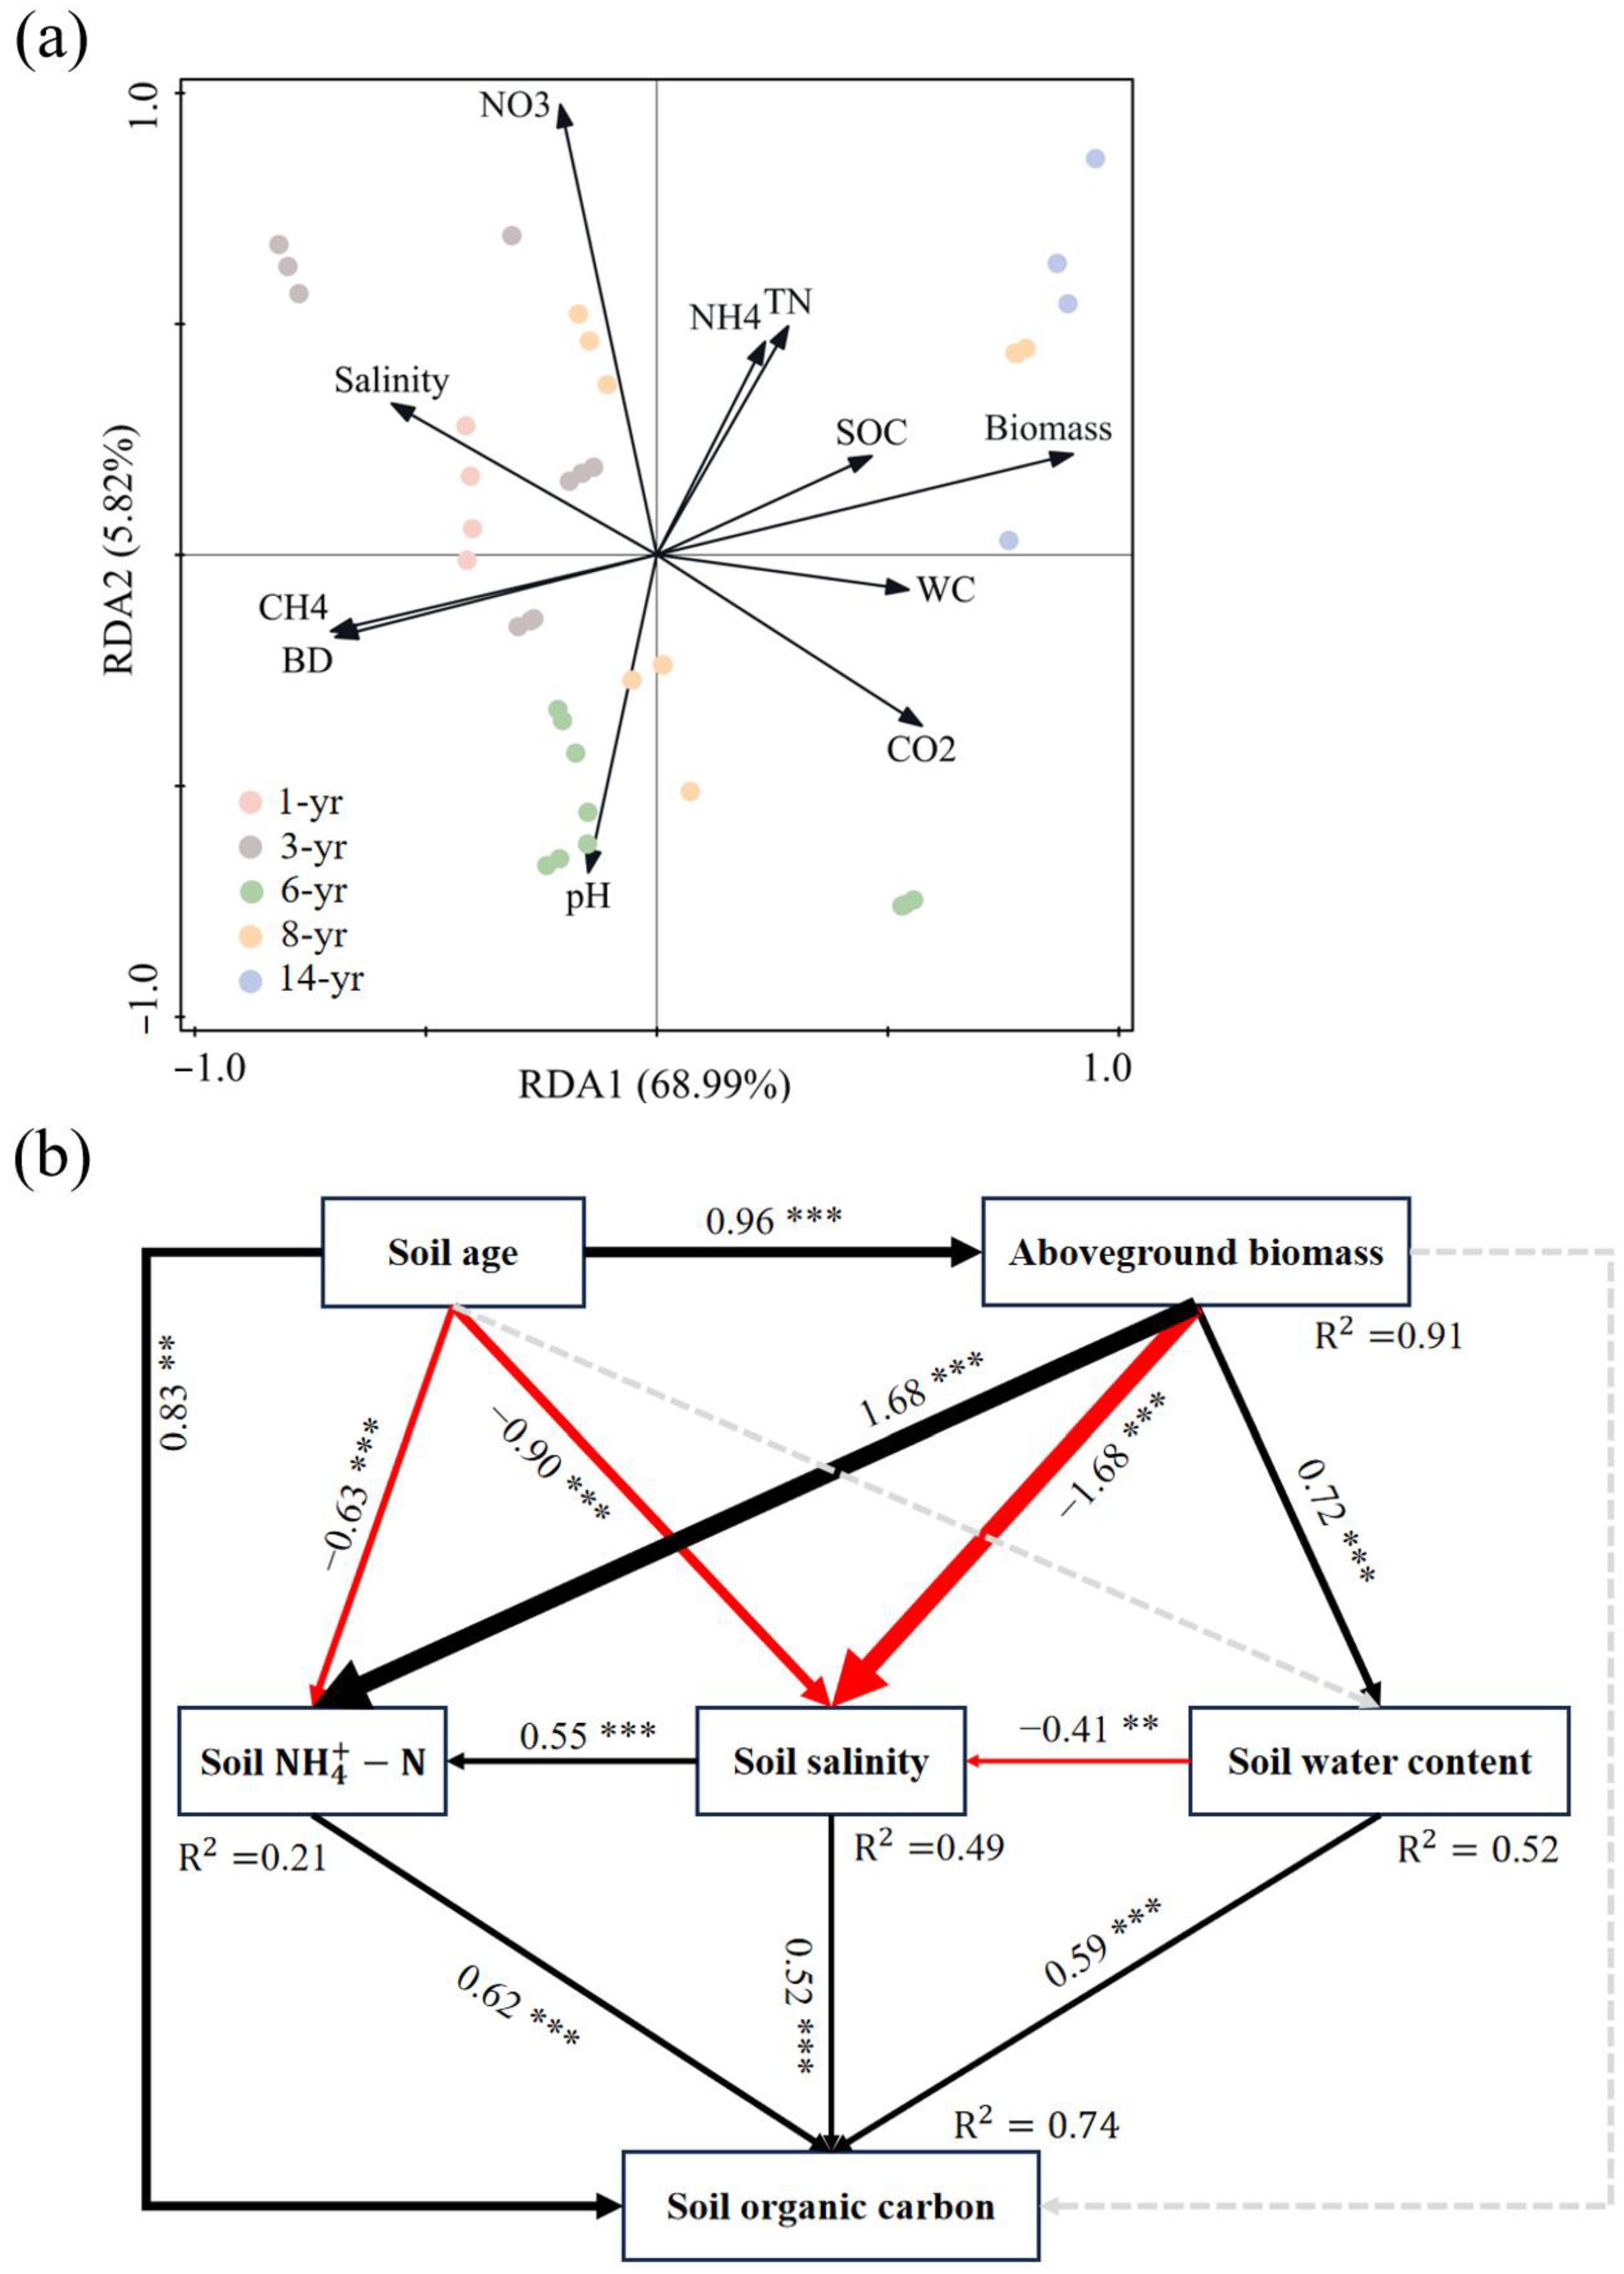
The results of the redundancy analysis (RDA) between the SOC and soil environmental factors are shown in Figure 8a. Soil salinity and CH4 emissions were the main driving factors influencing the initial SOC variation. Soil pH, -N, and AGB were the main driving factors for the difference between the SOC and other soil characteristics from the middle of land formation. AGB, SWC, and -N were the main factors influencing the difference between the SOC and other soil characteristics at the latter stage of land formation (Figure 8a). As shown in Figure 8b, the results of the structural equation modeling revealed the effects of land formation time, plant growth, and soil characteristics on the SOC. In particular, AGB showed a significant increase with land formation time (p < 0.001, Figure 8b), with a consequent indirect effect on the SOC levels. On the one hand, the increase in AGB led to a significant increase in SWC (p < 0.001), and the higher SWC contributed to a significant reduction in soil salinity (p < 0.01), ultimately leading to an increase in the SOC (p < 0.001). On the other hand, the increase in AGB showed a significant decrease in soil salinity (p < 0.001), which subsequently acted on the increase in SOC levels (p < 0.001). Furthermore, AGB was found to influence the SOC accumulation by influencing the soil -N and SWC. The land formation time also had an indirect effect on SOC accumulation by affecting the soil salinity, or it may have had a direct positive effect on the SOC content (p < 0.01, Figure 8b).
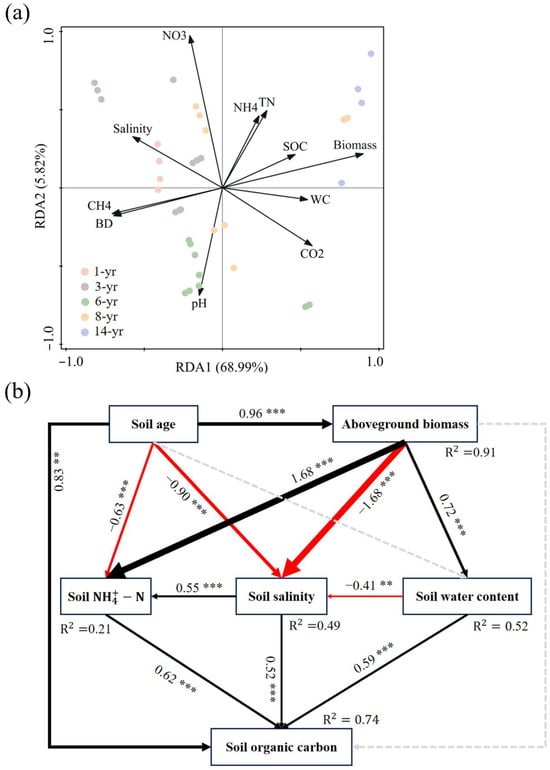
Figure 8.
(a) Redundancy analysis of the SOC content and environmental factors in the new salt marsh wetland of Hengsha Island. (b) Structural equation modeling of the effects of plant growth and soil properties on soil organic carbon (* p < 0.05; ** p < 0.01; *** p < 0.001). Black arrows represent significant positive pathways. Red arrows represent significant negative pathways. Gray dashed arrows indicate nonsignificant pathways.
4. Discussion
In this study, field experiments were conducted on Hengsha Island to characterize the spatial distribution of the SOC content at various stages of land-formation using the spatio-temporal substitution method. The aim was to unveil the significant factors influencing SOC in nascent salt marshes. The results revealed a significant positive correlation between the wetland development time and SOC changes. Additionally, a combination of vegetation succession and soil development found through correlation analysis may be responsible for the above phenomenon.
It has been demonstrated that anthropogenic alterations to landforms can profoundly affect soil properties, as observed in restored riparian wetlands [36], semi-arid soils [37], and rice fields [38]. The implementation of land reclamation projects between 2003 and 2020 resulted in significant changes in the soil physicochemical properties on Hengsha Island (Figure 8a). The soil texture of the salt marshes on Hengsha Island predominantly consists of saline clay and sandy loam. With soil development in its nascent stages, the growth of salt-tolerant plants, facilitated by the secretion of organic acids from the root system, accelerates the soil maturation process, leading to a significant decrease in soil pH with prolonged land formation time (p < 0.001, Figure 3) [39]. Soil salinity has emerged as a critical factor limiting plant growth in coastal regions [40], as high concentrations of Na+ and Mg2+ ions can impair plant cell structure and hinder photosynthesis, thereby constraining plant growth [41]. Mature salt marsh wetlands typically exhibit lower salinity levels compared to young salt marsh wetlands due to a combination of reduced tidal frequency and the plant uptake of salt ions [42]. We observed a significant negative correlation (p < 0.01) between the aboveground plant biomass and soil salinity, with the lowest soil salinity (Figure 3) and highest plant biomass (Figure 1) found in the developed salt marsh wetland (14 years). The process of siltation promotion leads to the accumulation and deposition of significant amounts of nutrient salts and organic particulate matter in the water column, attached to plant stems, thereby increasing the nitrogen inputs to the developing wetland, resulting in an elevation in the soil nitrogen content [43]. Moreover, thriving plants can augment nitrogen inputs to salt marshes through nitrogen fixation by root microorganisms [44]. Consequently, soil nutrient contents (-N, -N, and TN) varied significantly over the land formation time (p < 0.001, Figure 4, Table 2), with the nitrogen content decreasing initially and increasing after the sixth year.
Plant carbon inputs to salt marshes have been consistently identified as directly responsible for increases in the SOC, as evidenced by extensive previous research [45]. The accumulation of SOC after 14 years of land formation surpassed that at the onset of land formation (Figure 6), typically attributed to heightened primary productivity and reduced decomposition rates. In our study, we observed a remarkable 100.8% increase in the aboveground biomass of salt marsh plants after 14 years of establishment compared to 1 year of establishment (Figure 2). Elevated plant biomass signifies greater organic matter inputs, thereby fostering a higher SOC content [46]. Similarly, our findings revealed a significant positive correlation between AGB and SOC (p < 0.01, Figure 7). However, this notable positive correlation was solely evident in the surface soil, with no significant correlation detected in the deeper soil layers (Figure 7). Based on the study by Huang et al. (2021) [47], we believe that the deep SOC in this area was influenced not only by AGB, but also, to a greater extent, by factors such as plant roots and soil microbial activities. As the soil depth increased, the SOC content tended to gradually decrease (Figure 6, Table 2), with the SOC content in the 0–20 cm soil layer notably surpassing that in other profiles, constituting over 50% of the total SOC in the 0–50 cm soil layer (Figure 6). On the one hand, this phenomenon arises because carbon inputs from the decomposition of aboveground plant residues outweigh those from belowground root decomposition and secretions in emerging salt marsh wetlands [48,49,50]. On the other hand, a significant negative correlation was observed between soil salinity and respiration at depths of 30–50 cm (p < 0.001, Figure 7). The decrease in salinity led to increased microbial respiration, potentially resulting in reduced SOC content [51]. Our findings align with those of Wang et al. (2023) [52] in the coastal wetlands of Hangzhou Bay, where an increase in the soil depth corresponded with a decrease in the SOC content. The trend of the SOC content with depth was more pronounced in the later stages of salt marsh formation compared to the pre-salt marsh formation phase (p < 0.001, Figure 6). This can be primarily attributed to the higher aboveground biomass in salt marshes with longer land formation times. Additionally, the surface layer of the soil is more susceptible to external environmental disturbances such as decomposing dead leaves, local hydrological conditions, or trapped exogenous sediments, which may lead to disparities in surface SOC content storage. Conversely, deep SOC content primarily depends on the conversion and transport of organic matter to deeper soil layers by the plant root system [53].
Inglett et al. (2011) [54] observed a positive correlation between the soil organic matter content and CH4 emissions across five different wetland types. In our study, the SOC content exhibited a significant negative correlation with CH4 emissions (p < 0.05, Figure 7). This trend may be attributed to the competitive inhibition of sulfate substrates, which reduces CH4 synthesis and promotes SOC accumulation [55]. However, Li et al. (2020) [56] reported a significant positive correlation between the soil organic carbon content and CH4 release at a geographic scale. The disparity in results could stem from differences in the environmental conditions of the systems such as salinity [57]. Additionally, there was no significant correlation between the soil CO2 emissions and SOC, suggesting that microbial decomposition of the SOC accounts for only a small fraction [58]. In general, the carbon and nitrogen cycling processes in ecosystems are coupled [59]. In our study, we observed a significant positive correlation between changes in the SOC and soil -N and TN (p < 0.05, Figure 7). Feng and Wang’s (2023) [60] study table unveiled the mechanism of SOC formation, highlighting the role of the “microbial carbon pump”. Consequently, the increase in nitrogen in the soil environment promoted plant growth and the addition of organic matter to the soil, which added a further content of SOC [61]. Finally, the SEM indicated that the rise in SOC with increasing salt marsh formation time resulted from the combined effects of plant aboveground biomass, soil salinity, soil water content, and ammonium nitrogen.
5. Conclusions
Understanding how soil chronosequence formation affects the SOC is a critical issue regarding the carbon dynamics patterns of emergent wetlands in the Yangtze River estuary under rapid succession. This study examined the relationship between soil chronosequence formation and SOC dynamics by considering the soil environmental properties. The findings revealed that as the wetland formation time increases, the soil salinity decreases, while the AGB and SWC significantly increase. Additionally, there was a notable positive correlation between the wetland development time and SOC dynamics. This correlation may arise from the rapid habitat renewal dynamics in the new area. Plant carbon input to the salt marsh wetland directly contributed to the SOC increase in the surface layer. However, the SOC content in deeper layers was primarily influenced by soil respiration and salinity, exhibiting a gradual decrease with increasing soil depth. The SEM indicates that prolonged salt marsh development significantly impacts vegetation succession and the soil physicochemical properties (e.g., soil salinity, soil water content, and ammonium nitrogen), which were the main reasons for the increase in SOC. Therefore, reasonable land management measures should be taken to minimize the soil organic carbon loss during the early stage of wetland land formation. In the future, the spatial pattern of salt marsh carbon storage and its influencing factors should be taken into consideration during salt marsh protection and restoration efforts to better enhance the carbon sink and sequestration of nascent salt marshes.
Author Contributions
C.S. (Chenyan Sha), S.L., J.Z., M.W., C.S. (Cheng Shen), J.S., S.H., and Q.W. (Qing Wang) conceived and designed the experiments. C.S. (Chenyan Sha), S.L., and J.Z. performed the experiments. J.Z., S.L., and C.S. (Chenyan Sha) analyzed the data. J.Z. wrote the manuscript. S.L., C.S. (Chenyan Sha), S.H., M.W., Q.W. (Qiang Wang) provided editorial advice. S.L., J.Z., M.W., C.S. (Cheng Shen) reviewed the manuscript. All authors have read and agreed to the published version of the manuscript.
Funding
This work was supported by the National Natural Science Foundation of China (No. 31100404) and the Shanghai Science and Technology Commission Project (No. 23DZ1202703).
Institutional Review Board Statement
Not applicable.
Informed Consent Statement
Not applicable.
Data Availability Statement
Data will be available on request.
Acknowledgments
The authors would like to thank the Shanghai Academy of Environmental Sciences for its support during sampling.
Conflicts of Interest
The authors declare that they have no known competing financial interests or personal relationships that could have appeared to influence the work reported in this paper.
References
- Ciais, P.; Wang, Y.; Andrew, R.; Bréon, F.M.; Chevallier, F.; Broquet, G.; Nabuurs, G.J.; Peters, G.; McGrath, M.; Meng, W.; et al. Biofuel burning and human respiration bias on satellite estimates of fossil fuel CO2 emissions. Environ. Res. Lett. 2020, 15, 074036. [Google Scholar] [CrossRef]
- Hu, H.; Chen, J.; Zhou, F.; Nie, M.; Hou, D.; Liu, H.; Delgado-Baquerizo, M.; Ni, H.; Huang, W.; Zhou, J.; et al. Relative increases in CH4 and CO2 emissions from wetlands under global warming dependent on soil carbon substrates. Nat. Geosci. 2024, 17, 26–31. [Google Scholar] [CrossRef]
- Macreadie, P.I.; Nielsen, D.A.; Kelleway, J.J.; Atwood, T.B.; Seymour, J.R.; Petrou, K.; Connolly, R.M.; Thomson, A.C.; Trevathan-Tackett, S.M.; Ralph, P.J. Can we manage coastal ecosystems to sequester more blue carbon? Front. Ecol. Environ. 2017, 15, 206–213. [Google Scholar] [CrossRef]
- Ji, H.; Han, J.; Xue, J.; Hatten, J.A.; Wang, M.; Guo, Y.; Li, P. Soil organic carbon pool and chemical composition under different types of land use in wetland: Implication for carbon sequestration in wetlands. Sci. Total Environ. 2020, 716, 136996. [Google Scholar] [CrossRef]
- Bradford, M.A.; Wieder, W.R.; Bonan, G.B.; Fierer, N.; Raymond, P.A.; Crowther, T.W. Managing uncertainty in soil carbon feedbacks to climate change. Nat. Clim. Chang. 2016, 6, 751–758. [Google Scholar] [CrossRef]
- Sun, H.; Jiang, J.; Cui, L.; Feng, W.; Wang, Y.; Zhang, J. Soil organic carbon stabilization mechanisms in a subtropical mangrove and salt marsh ecosystems. Sci. Total Environ. 2019, 673, 502–510. [Google Scholar] [CrossRef]
- Reithmaier, G.M.; Cabral, A.; Akhand, A.; Bogard, M.J.; Borges, A.V.; Bouillon, S.; Burdige, D.J.; Call, M.; Chen, N.; Chen, X.; et al. Carbonate chemistry and carbon sequestration driven by inorganic carbon outwelling from mangroves and saltmarshes. Nat. Commun. 2023, 14, 8196. [Google Scholar] [CrossRef] [PubMed]
- Moritsch, M.M.; Young, M.; Carnell, P.; Macreadie, P.I.; Lovelock, C.; Nicholson, E.; Raimondi, P.T.; Wedding, L.M.; Ierodiaconou, D. Estimating Blue Carbon Sequestration under Coastal Management Scenarios. Sci. Total Environ. 2021, 777, 145962. [Google Scholar] [CrossRef] [PubMed]
- Perera, N.; Lokupitiya, E.; Halwatura, D.; Udagedara, S. Quantification of Blue Carbon in Tropical Salt Marshes and Their Role in Climate Change Mitigation. Sci. Total Environ. 2022, 820, 153313. [Google Scholar] [CrossRef] [PubMed]
- Craft, C. Co-development of wetland soils and benthic invertebrate communities following salt marsh creation. Wetl. Ecol. Manag. 2000, 8, 197–207. [Google Scholar] [CrossRef]
- Meyer, C.K.; Baer, S.G.; Whiles, M.R. Ecosystem Recovery across a Chronosequence of Restored Wetlands in the Platte River Valley. Ecosystems 2008, 11, 193–208. [Google Scholar] [CrossRef]
- Zhang, Q.; Jiang, J.Y.; Li, X.Z.; Zhang, Y.Q. Impacts of vegetation establishment duration on soil organic carbon accumulation in Chongming-Dongtan, China. Chin. J. Ecol. 2017, 36, 1173–1179. [Google Scholar] [CrossRef]
- Schäfer, K.V.R.; Duman, T.; Tomasicchio, K.; Tripathee, R.; Sturtevant, C. Carbon Dioxide Fluxes of Temperate Urban Wetlands with Different Restoration History. Agric. For. Meteorol. 2019, 275, 223–232. [Google Scholar] [CrossRef]
- Craft, C.; Megonigal, P.; Broome, S.; Stevenson, J.; Freese, R.; Cornell, J.; Zheng, L.; Sacco, J. The pace of ecosystem development of constructed Spartina alterniflora marshes. Ecol. Appl. 2003, 13, 1417–1432. [Google Scholar] [CrossRef]
- Ladd, C.J.T.; Smeaton, C.; Skov, M.W.; Austin, W.E.N. Best Practice for Upscaling Soil Organic Carbon Stocks in Salt Marshes. Geoderma 2022, 428, 116188. [Google Scholar] [CrossRef]
- Zhang, X.; Zhang, Z.; Zhe, L.; Min, L.; Wu, H.; Min, L.; Ming, J. Impacts of Spartina alterniflora Invasion on Soil Carbon Contents and Stability in the Yellow River Delta, China. Sci. Total Environ. 2021, 775, 145188. [Google Scholar] [CrossRef] [PubMed]
- Eagle, M.J.; Kroeger, K.D.; Spivak, A.C.; Wang, F.; Tang, J.; Abdul-Aziz, O.I.; Ishtiaq, K.S.; O’Keefe Suttles, J.; Mann, A.G. Soil Carbon Consequences of Historic Hydrologic Impairment and Recent Restoration in Coastal Wetlands. Sci. Total Environ. 2022, 848, 157682. [Google Scholar] [CrossRef] [PubMed]
- Xu, S.; Liu, X.; Li, X.; Tian, C. Soil Organic Carbon Changes Following Wetland Restoration: A Global Meta-Analysis. Geoderma 2019, 353, 89–96. [Google Scholar] [CrossRef]
- Brian, A.T. Soil organic carbon stocks and sequestration rates of inland, freshwater wetlands: Sources of variability and uncertainty. Sci. Total Environ. 2020, 749, 141444. [Google Scholar] [CrossRef]
- Qian, W.; Chen, J.; Zhang, Q.; Wu, C.; Ma, Q.; Silliman, B.R.; Wu, J.; Li, B.; He, Q. Top-down Control of Foundation Species Recovery during Coastal Wetland Restoration. Sci. Total Environ. 2021, 769, 144854. [Google Scholar] [CrossRef]
- Zou, J.; Ziegler, A.D.; Chen, D.; McNicol, G.; Ciais, P.; Jiang, X.; Zheng, C.; Wu, J.; Wu, J.; Lin, Z.; et al. Rewetting Global Wetlands Effectively Reduces Major Greenhouse Gas Emissions. Nat. Geosci. 2022, 15, 627–632. [Google Scholar] [CrossRef]
- Ba, Q.; Wang, B.; Zhu, L.; Fu, Z.; Wu, X.; Wang, H.; Bi, N. Rapid Change of Vegetation Cover in the Huanghe (Yellow River) Mouth Wetland and Its Biogeomorphological Feedbacks. Catena 2024, 238, 107875. [Google Scholar] [CrossRef]
- Wei, C.; Guo, B.; Lu, M.; Zang, W.; Yang, F.; Liu, C.; Wang, B.; Huang, X.; Liu, Y.; Yu, Y.; et al. The Changes in Dominant Driving Factors in the Evolution Process of Wetland in the Yellow River Delta during 2015–2022. Remote Sens. 2023, 15, 2858. [Google Scholar] [CrossRef]
- Chen, X.; Lin, C.; Hou, X.; Wu, Z.; Yan, G.; Zhu, C. The Impact of Land Consolidation on Arable Land Productivity: A Differentiated View of Soil and Vegetation Productivity. Agric. Ecosyst. Environ. 2022, 326, 107781. [Google Scholar] [CrossRef]
- Kang, X.; Yan, L.; Zhang, X.; Li, Y.; Tian, D.; Peng, C.; Wu, H.; Wang, J.; Zhong, L. Modeling Gross Primary Production of a Typical Coastal Wetland in China Using MODIS Time Series and CO2 Eddy Flux Tower Data. Remote Sens. 2018, 10, 708. [Google Scholar] [CrossRef]
- Zhao, Q.; Bai, J.; Zhang, G.; Jia, J.; Wang, W.; Wang, X. Effects of Water and Salinity Regulation Measures on Soil Carbon Sequestration in Coastal Wetlands of the Yellow River Delta. Geoderma 2018, 319, 219–229. [Google Scholar] [CrossRef]
- Lu, X.; Hou, E.; Guo, J.; Gilliam, F.S.; Li, J.; Tang, S.; Kuang, Y. Nitrogen Addition Stimulates Soil Aggregation and Enhances Carbon Storage in Terrestrial Ecosystems of China: A Meta-Analysis. Glob. Chang. Biol. 2021, 27, 2780–2792. [Google Scholar] [CrossRef] [PubMed]
- Dong, J.; Zhao, D.; Zhang, C.; Cao, Q.; Fang, J.; Yang, R.; Ji, S.; Li, C.; Zhao, R.; Liu, J. Factors Controlling Organic Carbon Distributions in a Riverine Wetland. Environ. Sci. Pollut. Res. 2020, 27, 34529–34540. [Google Scholar] [CrossRef] [PubMed]
- Pan, J.L.; Yuan, L.; Yuan, X.; Bo, S.Q.; Zhao, Z.Y.; Zhu, X.J.; Chen, Y.H.; Li, Y.; Zhang, J.L. Effects of coastal reclamation on the population and habitat of Anatidae birds: A case study of East Hengsha Shoal, Shanghai. Mar. Sci. 2019, 43, 45–56. [Google Scholar] [CrossRef]
- Lou, Y.Y. Morphodynamic processes of the unsheltered tidal flats in the Changjiang Estuary. East China Norm. Univ. 2023, 26–36. [Google Scholar] [CrossRef]
- Cheng, H.F.; Liu, J.; Chen, F.K.; Fu, G.; Wang, Z.Z.; Xie, Y.F. Study on Comprehensive Utilization of Dredged Soil in Yangtze Estuary Channel During the 14th Five-year Period. Resour. Environ. Yangtze Basin 2023, 32, 331–338. [Google Scholar] [CrossRef]
- Tian, B.; Zhou, Y.X.; Yuan, L.; Zhao, Y.L.; Chen, Y.Q.; Yuan, X.; Cao, Y. Investigation and analysis on the biodiversity and ecological environment in the Hengsha East Shoal of the Yangtze Estuary. J. East China Norm. Univ. 2013, 4, 120–127. [Google Scholar] [CrossRef]
- Zhang, X.H.; Tian, H.M.; Chen, X.C.; Yang, H.L.; Ding, R.; Zhao, M.M.; You, W.H. Vegetation growth characteristics and the blue carbon effect of restored salt marshes at different developmental ages in Hengsha, the Yangtze River Estuary. J. East China Norm. Univ. 2024, 113–121. [Google Scholar] [CrossRef]
- Wu, T.; Zhu, J.; Ma, R.; Qiu, W.; Yuan, R. Freshwater Resources around the Reclaimed New Land on the Eastern Hengsha Shoal in the Changjiang Estuary. Front. Mar. Sci. 2023, 10, 1302091. [Google Scholar] [CrossRef]
- Zhang, X.; Bai, J.; Zhang, Z.; Xie, T.; Zhang, G.; Liu, Y.; Chen, G.; Liu, Z. Plant Invasion Strengthens the Linkages between Dissolved Organic Matter Composition and the Microbial Community in Coastal Wetland Soils. Catena 2023, 232, 107449. [Google Scholar] [CrossRef]
- Luo, J.; Liao, G.; Banerjee, S.; Gu, S.; Liang, J.; Guo, X.; Zhao, H.-P.; Liang, Y.; Li, T. Long-Term Organic Fertilization Promotes the Resilience of Soil Multifunctionality Driven by Bacterial Communities. Soil Biol. Biochem. 2023, 177, 108922. [Google Scholar] [CrossRef]
- Naidoo, L.; van Deventer, H.; Ramoelo, A.; Mathieu, R.; Nondlazi, B.; Gangat, R. Estimating above Ground Biomass as an Indicator of Carbon Storage in Vegetated Wetlands of the Grassland Biome of South Africa. Int. J. Appl. Earth Obs. Geoinf. 2019, 78, 118–129. [Google Scholar] [CrossRef]
- Baiswar, A.; Yadav, J.S.; Sain, K.; Bhambri, R.; Pandey, A.; Tiwari, S.K. Emission of Greenhouse Gases due to Anthropogenic Activities: An Environmental Assessment from Paddy Rice Fields. Environ. Sci. Pollut. Res. 2022, 30, 37039–37054. [Google Scholar] [CrossRef] [PubMed]
- Xia, S.; Wang, W.; Song, Z.; Kuzyakov, Y.; Guo, L.; Van Zwieten, L.; Li, Q.; Hartley, I.P.; Yang, Y.; Wang, Y.; et al. Spartina Alterniflora Invasion Controls Organic Carbon Stocks in Coastal Marsh and Mangrove Soils across Tropics and Subtropics. Glob. Chang. Biol. 2021, 27, 1627–1644. [Google Scholar] [CrossRef]
- Steinhorst, L.; Kudla, J. How plants perceive salt. Nature 2019, 572, 318–320. [Google Scholar] [CrossRef]
- Chen, P.; Xia, J.; Ma, H.; Gao, F.; Dong, M.; Xing, X.; Li, C. Analysis of Spatial Distribution Pattern and Its Influencing Factors of the Tamarix Chinensis Population on the Beach of the Muddy Coastal Zone of Bohai Bay. Ecol. Indic. 2022, 140, 109016. [Google Scholar] [CrossRef]
- Ivajnšič, D.; Šajna, N.; Kaligarič, M. Primary succession on re-created coastal wetland leads to successful restoration of coastal halophyte vegetation. Landsc. Urban Plan. 2016, 150, 79–86. [Google Scholar] [CrossRef]
- Wan, D.; Yu, P.; Kong, L.; Zhang, J.; Chen, Y.; Zhao, D.; Liu, J. Effects of Inland Salt Marsh Wetland Degradation on Plant Community Characteristics and Soil Properties. Ecol. Indic. 2024, 159, 111582. [Google Scholar] [CrossRef]
- Yan, W.; Wu, F.; Li, X.; Li, C.; Zhao, Y.; Gao, Y.; Liu, J. Effects of Plants and Soil Microorganisms on Organic Carbon and the Relationship between Carbon and Nitrogen in Constructed Wetlands. Environ. Sci. Pollut. Res. 2023, 30, 62249–62261. [Google Scholar] [CrossRef]
- Zhang, P.; Scheu, S.; Li, B.; Lin, G.; Zhao, J.; Wu, J. Litter c Transformations of Invasive Spartina Alterniflora Affected by Litter Type and Soil Source. Biol. Fertil. Soils 2020, 56, 369–379. [Google Scholar] [CrossRef]
- Ridgeway, J.R.; Morrissey, E.M.; Brzostek, E.R. Plant Litter Traits Control Microbial Decomposition and Drive Soil Carbon Stabilization. Soil Biol. Biochem. 2022, 175, 108857. [Google Scholar] [CrossRef]
- Huang, J.; Liu, W.; Yang, S.; Yang, L.; Peng, Z.; Deng, M.; Xu, S.; Zhang, B.; Ahirwal, J.; Liu, L. Plant Carbon Inputs through Shoot, Root, and Mycorrhizal Pathways Affect Soil Organic Carbon Turnover Differently. Soil Biol. Biochem. 2021, 160, 108322. [Google Scholar] [CrossRef]
- Yan, J.; Qian, L.; Fu, X.; Wu, J.; Tsang, X.F.; Wang, L. Conversion Behaviors of Litter-Derived Organic Carbon of Two Halophytes in Soil and Their Influence on SOC Stabilization of Wetland in the Yangtze River Estuary. Sci. Total Environ. 2020, 716, 137109. [Google Scholar] [CrossRef] [PubMed]
- Mei, W.; Dong, H.; Qian, L.; Yan, J.; Hu, Y.; Wang, L. Effects of Anthropogenic Disturbances on the Carbon Sink Function of Yangtze River Estuary Wetlands: A Review of Performance, Process, and Mechanism. Ecol. Indic. 2024, 159, 111643. [Google Scholar] [CrossRef]
- Yang, X.; Wang, B.; Fakher, A.; An, S.; Kuzyakov, Y. Contribution of Roots to Soil Organic Carbon: From Growth to Decomposition Experiment. Catena 2023, 231, 107317. [Google Scholar] [CrossRef]
- Ding, Y.; Wang, Y.; Gu, X.; Peng, Y.; Sun, S.; He, S. Salinity Effect on Denitrification Efficiency with Reed Biomass Addition in Salt Marsh Wetlands. Bioresour. Technol. 2023, 371, 128597. [Google Scholar] [CrossRef] [PubMed]
- Wang, F.; Wang, T.; Gustave, W.; Wang, J.; Zhou, Y.; Chen, J. Spatial-Temporal Patterns of Organic Carbon Sequestration Capacity after Long-Term Coastal Wetland Reclamation. Agric. Ecosyst. Environ. 2023, 341, 108209. [Google Scholar] [CrossRef]
- Sokol, N.W.; Kuebbing, S.E.; Karlsen-Ayala, E.; Bradford, M.A. Evidence for the Primacy of Living Root Inputs, Not Root or Shoot Litter, in Forming Soil Organic Carbon. New Phytol. 2018, 221, 233–246. [Google Scholar] [CrossRef] [PubMed]
- Inglett, K.S.; Inglett, P.W.; Reddy, K.R.; Osborne, T.Z. Temperature Sensitivity of Greenhouse Gas Production in Wetland Soils of Different Vegetation. Biogeochemistry 2011, 108, 77–90. [Google Scholar] [CrossRef]
- Debanshi, S.; Pal, S. Assessing the Role of Deltaic Flood Plain Wetlands on Regulating Methane and Carbon Balance. Sci. Total Environ. 2022, 808, 152133. [Google Scholar] [CrossRef] [PubMed]
- Li, J.; Han, G.; Zhao, M.; Qu, W.; Nie, M.; Song, W.; Xie, B.; Eller, F. Nitrogen Input Weakens the Control of Inundation Frequency on Soil Organic Carbon Loss in a Tidal Salt Marsh. Estuar. Coast. Shelf Sci. 2020, 243, 106878. [Google Scholar] [CrossRef]
- Li, F.; Li, H.; Su, H.; Du, W.; Gao, Z.; Liu, H.; Liang, H.; Gao, D. Effects of Salinity on Methane Emissions and Methanogenic Archaeal Communities in Different Habitat of Saline-Alkali Wetlands. Environ. Sci. Pollut. Res. 2023, 30, 106378–106389. [Google Scholar] [CrossRef]
- Xie, M.; Liu, Q.; Dong, H.; Mei, W.; Fu, X.; Hu, Y.; Yan, J.; Sun, Y.; Wu, P.; Chen, X.; et al. The High Organic Carbon Accumulation in Estuarine Wetlands Necessarily Does Not Represent a High CO2 Sequestration Capacity. Environ. Int. 2023, 172, 107762. [Google Scholar] [CrossRef] [PubMed]
- Lewis, D.B.; Jimenez, K.L.; Abd-Elrahman, A.; Andreu, M.G.; Landry, S.M.; Northrop, R.J.; Campbell, C.; Flower, H.; Rains, M.C.; Richards, C.L. Carbon and Nitrogen Pools and Mobile Fractions in Surface Soils across a Mangrove Saltmarsh Ecotone. Sci. Total Environ. 2021, 798, 149328. [Google Scholar] [CrossRef]
- Feng, X.; Wang, S. Plant Influences on Soil Microbial Carbon Pump Efficiency. Glob. Chang. Biol. 2023, 29, 3854–3856. [Google Scholar] [CrossRef]
- Santini, N.S.; Lovelock, C.E.; Hua, Q.; Zawadzki, A.; Mazumder, D.; Mercer, T.R.; Muñoz-Rojas, M.; Hardwick, S.A.; Madala, B.S.; Cornwell, W.; et al. Natural and Regenerated Saltmarshes Exhibit Similar Soil and Belowground Organic Carbon Stocks, Root Production and Soil Respiration. Ecosystems 2019, 22, 1803–1822. [Google Scholar] [CrossRef]


Disclaimer/Publisher’s Note: The statements, opinions and data contained in all publications are solely those of the individual author(s) and contributor(s) and not of MDPI and/or the editor(s). MDPI and/or the editor(s) disclaim responsibility for any injury to people or property resulting from any ideas, methods, instructions or products referred to in the content. |
© 2024 by the authors. Licensee MDPI, Basel, Switzerland. This article is an open access article distributed under the terms and conditions of the Creative Commons Attribution (CC BY) license (https://creativecommons.org/licenses/by/4.0/).