Article

Spatial Heterogeneity and Driving Mechanisms of Cultivated Land Intensive Utilization in the Beibu Gulf Urban Agglomeration, China

by
Zhongqiu Zhang
1,2,3,
Yufeng Zhang
1,3,* and
Xiang Zhang
1
1
College of Geographical Sciences, Inner Mongolia Normal University, Hohhot 010022, China
2
College of Resources and Environment, Beibu Gulf University, Qinzhou 535011, China
3
Land Use and Remediation Engineering Technology Research Center of Inner Mongolia, Hohhot 010022, China
*
Author to whom correspondence should be addressed.
Sustainability 2024, 16(11), 4565; https://doi.org/10.3390/su16114565
Submission received: 15 April 2024 / Revised: 20 May 2024 / Accepted: 23 May 2024 / Published: 28 May 2024

Abstract

:
Cultivated land intensive utilization (CLIU) exhibits spatial heterogeneity that is influenced by both natural and anthropogenic factors, with land dissected into different scale systems; however, CLIU has not yet been systematically explored. This study takes the Beibu Gulf urban agglomeration, a national-level model area for integrated land and sea development in China, as an example to investigate the spatial heterogeneity of CLIU and explore its driving factors through multiple econometrical and geographical methods, including identifying its underlying mechanisms. The results indicate that (1) the CLIU index is 0.334, its Gini coefficient is 0.183, and its comprehensive level has a low intensity and obvious spatial nonequilibrium characteristics. Hypervariable density (50.33%) and the intraprovincial gap (45.6%) are the main sources. (2) Among the independent effects of single factors, the multiple cropping index (0.57), labor force index (0.489), and intensification of construction land (0.375) exert the most influence on CLIU spatial variation. The interaction effects of two factors primarily manifested as nonlinear enhancements, with the interaction between the labor force index and multiple cropping index being particularly noteworthy (0.859). (3) The geographically weighted regression coefficients reveal that temperature (0.332), multiple cropping index (0.211), and labor force index (0.209) have relatively large and positive impacts on CLIU, while slope (−0.1), precipitation (−0.087), and population urbanization (−0.039) have relatively small and negative impacts; all factors exhibit spatial nonstationarity. The spatial heterogeneity of CLIU in the Beibu Gulf urban agglomeration is characterized by patterns’ nonequilibrium and factors’ nonstationarity. The driving mode of multiple factors on CLIU is manifested as follows: natural factors of cropland utilization provide basic guarantees, internal factors of CLIU provide positive enhancement, and external factors of land intensive utilization provide auxiliary promotion.

1. Introduction

Cultivated land, the result of comprehensive interactions between humans and nature [1], is an important semi-natural resource for human survival and development [2]. Being the most common type of land use, cultivated land ensures food security [3], thus providing the material foundation for urbanization and industrialization while assuring multiple other non-productive functions recognized as positive externalities and public goods, such as regulation, support, and cultural benefits [4,5,6]. In recent years, with the rapid development of urban agglomerations and urban circles, issues such as nonagriculturalization, nongrain production, fragmentation, marginalization, and abandonment of cropland caused by population transfer and construction occupation have grown [7]; additionally, these issues have seriously constrained the process of CLIU and sustainable development [8]. During construction of an ecological civilization in the new era in China, contradictions regarding the protection and intensive utilization of cultivated land have arisen in relation to the coordinated development of the population, the economy, nature, and the environment [9]. Therefore, determining the spatial differentiation and driving mechanism of CLIU via scientific evaluation, revealing its driving mechanism, and providing a decision-making basis for zoning optimization and efficient utilization of cropland resources are important research topics for regional cropland protection and sustainable utilization.
Continuous population growth has driven improvements in agricultural efficiency [10]. Since intensive agricultural land management was first proposed [11], the law of diminishing land returns, theory of agricultural location [12], theory of labor value [13], and theory of land rental and price [14] have laid a theoretical foundation for CLIU. Scholars have focused on the research and practice of assessing cropland use intensity. In recent years, China has increased its investment in chemical fertilizers, pesticides, and machinery in arable land [15,16], achieving a steady increase in grain production. However, 53.60% of the counties have had agricultural land use indices lower than 0.6 [17], the inappropriate use of chemical fertilizers has led to an imbalance in soil fertility [18], and the reduction in the use of organic fertilizers has also reduced the soil’s ability to sequester carbon [19], indicating that the current efficiency and factors input structure of cultivated land needs to be further improved. In addition, the outflow of the rural population and increase in the urbanization rate has further limited the intensity of cropland utilization [20]; the unreasonable use of this cropland can easily lead to overintensive utilization [21]. Regarding cropland practices, the Dutch Skylark Group has developed a framework for farmer-initiated agricultural solutions; when farmers are incentivized by peers and supply chain partners, improvements in agricultural ecological efficiency and sustainable intensification are more likely to occur [22]. China has implemented a strict farmland protection system, and scholars have evaluated the average land use intensity and relative standard deviation of land use intensity in counties [17]. They have also calculated the dynamic balance between provincial cropland productivity and yield, as well as the relationship between cultivation distance and the sustainability of cropland use [23]. Studies have shown that the total productivity of cropland in China has decreased, the north–south distribution has been uneven, the boundary center of grain production has moved northward [24], and the intensity of arable land use and the proportion of sustainable compensated arable land in most areas are less than 0.7 [23]. Additionally, more than 40% of cropland has begun to deteriorate, posing a threat to sustainability [25]. The PMC-Index and PMC-Surface models have been used to evaluate the policy effects of cropland protection and intensive utilization by local governments in China, and the results show that there is significant room for improvement in the structure of policy tools, coordination of policy release agencies, and completeness of policy content in current local government public policies [26]. Factors such as population size, land size, GDP, policy effects, farmer organizations, and agricultural capital productivity all affect CLIU; under the guidance of the DSG’s framework, the concept and paradigm of sustainable and intensive use of cultivated land have become new focuses.
On the connotation of CLIU, geographers have defined that effective input, sustained output, reduced environmental damage, and restored soil fertility are the core elements of cropland intensive use. Garnett et al. proposed that the sustainable intensive use of arable land, in response to the priority action goals of food security and food systems, has four premises: increased production, environmental sustainability, and multiobjective synergy [27]. Firbank et al. argued that CLIU is associated with increases in the market dimension (agricultural production) without reductions in its nonmarket dimensions (environmental services); they used farm data in England and Wales to construct an indicator system from agricultural output and environmental output for empirical analysis [28]. Xie et al. argued that adjusting the input–output relationship can improve the yield of farmland, reduce ecological damage, and maintain the resilience of cultivated land and that this approach is the key to CLIU; a case evaluation was conducted from an energy perspective [29]. Influenced by the concept of sustainable intensification, scholars have conducted more comprehensive research on the evaluation and optimization of CLIU. Some ecologists analyzed influencing factors from aspects such as fertilizers, machinery, pesticides, labor, capital, energy, cultivated land productivity, cultivated land economic benefits, labor productivity, and land use mode transformation and used comprehensive evaluation and multiple regression models to evaluate China’s CLIU [30]. The indicators reflected renewable environmental input, nonrenewable environmental input, nonrenewable industrial assistance, renewable organic assistance, agricultural output, and chemical pollution industrial input; the intensive use of farmland was evaluated via energy analysis and the livelihood framework to determine farmers’ livelihood types [31]. Comprehensive factors reflected the levels of material productivity, the implicit flow of material output and stock, and the effects of environmental economics. Furthermore, the material flow method and Tobit model were used to evaluate CLIU at the household scale [32]. In addition, the use of econometric models and spatial econometric models to explore the economic relationship between urbanization level and farmland utilization efficiency [33], as well as economic agglomeration and sustainable intensification of farmland [34], provides a new paradigm for exploring the transformation of CLIU.
In the evaluation of CLIU, much research has been conducted on the spatiotemporal evolution, driving mechanisms, obstacles, and sustainable utilization of cropland. Current hotspots of concern are manifested in two main topics. First are issues involving the relationship between CLIU and nongrain production; in the process of large-scale and intensive use of cultivated land, the phenomenon of nongrain fragmentation of cropland will inevitably occur. In some areas, the proportion of grain crop-sown area has decreased and, the density of land has increased [35]; these changes will limit the effectiveness of CLIU. Second, from the perspective of input–output data, scholars have analyzed the causes and mechanisms of the nonagricultural transformation of farmland and believe that improving farmland irrigation facilities and increasing grain planting subsidies can increase enthusiasm for grain growth [36]. To construct a framework for the interaction between cultivated land fertility and comprehensive utilization fertility, an evaluation index system was established, and the Tapio decoupling model was used to study the decoupling relationship between nongrain production and CLIU in China from in spatial and temporal dimensions [37]. The spatial state of CLIU was evaluated via 3S technology. In some regions of China, the aggregation and cohesion index of farmland plots have been decreasing annually, while the density and fragmentation index of patches have gradually increased, which means that the methods and connotations of CLIU need to be transformed and upgraded [38]. On the other hand, scholars have focused on both anti-intensive cultivated land use and sustainable cultivated land use; they have new approaches to CLIU that involve expanding scale [39], strengthening investment [40], protecting ecology [41], maintaining sustainability [42], and implementing sustainable intensive transformation. However, in economically developed regions of China, the phenomenon of anti-intensive land use is quite significant. Liang et al. believe that anti-intensification acts as a kind of counterforce manifestation of negative effects that hinder the positive effects of intensive utilization of arable land; they constructed an evaluation index system from three aspects—input degree, utilization degree and output efficiency—and conducted an empirical analysis of Jiangsu Province in China by using the geographical detector model [43]. Another approach considers that CLIU results in energy flow between water resources, land, and food [12], i.e., natural conditions can influence CLIU. Based on a framework of water, soil, energy, and food interactions [44], Chen et al. constructed a sustainable utilization evaluation system for cultivated land that coordinates these four elements in CLIU and conducted a case study by using fuzzy comprehensive evaluation and coupling coordination models. The research findings showed that water resources are the key influencing factors for CLIU [45].
The results of these existing studies are rich and provide important references for this research. However, there are still some points that can be further refined in terms of the research object, research level, and research content. First, the current research is insufficient, and the existing evaluation system for CLIU does not account for the roles of geographical location and natural factors. In analyses of the driving factors influencing CLIU, natural factors such as temperature and precipitation, which affect the productivity level of arable land, are missing. Spatial imbalance analyses of the level of CLIU and spatial non-stationary analyses of driving factors are needed. Second, research has not been sufficiently systematic; analyses of the level, influencing factors, and driving forces of CLIU have focused mainly on the internal aspects of the cropland use system, neglecting the impact of external land intensive use and natural conditions on cultivated land intensive use, which is a reflection of the driving force results of geographic exploration and geographic weighted regression analysis. Furthermore, interaction detection and driving mechanism analyses of the multiple factors that account for both internal and external factors are lacking; the integration of research methods also needs improvement. Third, research on urban agglomerations is lacking, though in the process of urbanization, a reduction in the amount of cultivated land caused by construction occupation is inevitable [45]. Moreover, as the urbanization rate increases, declining interest in agricultural production has led to increasingly serious marginalization of arable land [46]. Urban agglomerations are not only important carriers of urbanization development but also key areas for farmland protection and intensive utilization; evaluating the intensive utilization status of arable land in urban agglomerations promotes high-quality development of urbanization and sustainable, intensive utilization of arable land. The Beibu Gulf urban agglomeration is an important gateway to the 21st Century Maritime Silk Road, not only as a typical hub for the ASEAN-facing international corridor but also as a national-level model area for integrated land and sea development. In recent years, with the economic development of the Bay Area, the level of urbanization has increased annually, and the scale of construction land has expanded rapidly; thus, the protection and intensive use of cropland has been subjected to great challenges. This study contributes to the literature on CLIU with a systematic and cross-regional-scale analysis of cultivated land intensive utilization spatial heterogeneity, trying to address two scientific questions: (1) How do we understand the spatial heterogeneity of CLIU systematically and the manifestations at different scales? (2) What are the influencing factors and driving mechanisms behind the spatial heterogeneity of CLIU in urban agglomerations? The research findings may provide theory and policy references for the implementation of CLIU.
The Beibu Gulf urban agglomeration was considered as a case study in this study; methods such as principal component analysis (PCA), use of the Dagum Gini coefficient, geographic detection, and geographically weighted regression were used to investigate the spatial imbalance of CLIU, explore the spatial nonstationarity of key influencing factors, and uncover the driving mechanisms among multiple factors. The research findings may be helpful for the implementation of national sustainable intensification of cultivated land use in China and may also provide reference for future CLIU research in similar areas worldwide.

2. Materials and Methods

2.1. Study Area

The Beibu Gulf urban agglomeration is a national-level urban agglomeration; it was approved by the Chinese government in 2017 and consists of 65 counties and districts in Guangdong, Guangxi, and Hainan Provinces. In 2023, the Ministry of Natural Resources of the People’s Republic of China issued the “China Land Ecological Basic Zoning (Trial)”, which addressed the Guangdong and Guangxi hilly and mountainous ecological areas and the Hainan Island ecological areas. It proposed coastal hilly plain urban and agricultural ecological areas in Guangxi and Guangdong and coastal plain agricultural ecological areas in Hainan Island, further clarifying the importance of agricultural ecology in the Beibu Gulf urban agglomeration. This land is approximately 116,600 km2, with a coastline of approximately 4234 km. The average annual rainfall in the area is approximately 1690 mm, the average annual temperature is approximately 23 °C, and the average slope is approximately 11° (Figure 1). It has a coastal hilly and plain terrain, with superior natural conditions for farmland and agriculture. In 2021, the cultivated land area was 2.411 million hm2, accounting for 42.51% of the total area in the three provinces. The number of people engaged in agriculture, forestry, animal husbandry, and fishery reached 469800, accounting for 38.91% of the total population in the three provinces. The added value of the primary industry was CNY 390.872 billion, accounting for 38.05% of the total amount of the three provinces. The grain output was 10.1355 million tons, accounting for 36.04% of the total amount in the three provinces.

2.2. Data Sources

The evaluation indicator and influencing factor data for CLIU used in the present study were obtained from the 2021 National Economic and Social Statistics Bulletin of each county, the 2022 China County Statistical Yearbook, the Guangxi Statistical Yearbook, the Guangdong Statistical Yearbook, the Hainan Statistical Yearbook, and the China Economic and Social Big Data Research Platform (https://data.cnki.net/, accessed on 5 January 2024). The land use data came from the annual data statistics of the natural resources department. The 30 m resolution digital elevation model (DEM) of the research area was obtained from the Chinese Academy of Sciences geospatial data cloud platform (https://www.gscloud.cn/home, accessed on 6 January 2024). Precipitation and temperature resolution 90 m data were obtained from the Copernican climate service platform (ERA5 meteorological data; https://www.copernicus.eu/en, accessed on 8 January 2024). The projection and resolution parameters of these data were resampled and statistically processed to be consistent with those of the DEM data. Then, the average temperature and cumulative precipitation of each month were extracted from the NetCDF format as analysis data. The administrative scope vector map of the research area is sourced from the China National Standard Map Service Platform (http://bzdt.ch.mnr.gov.cn/, accessed on 7 January 2024). The process of extracting the principal components of the driving factors of intensive land use based on human factors was as follows: In Stata16 software, the Bartlett test was conducted with a p value of 0 and a sampling measurement through the global Moran’s I of the comprehensive index via ArcGIS10.8 spatial analysis.

2.3. Construction of the Evaluation System

2.3.1. Construction of a Comprehensive Evaluation System

CLIU is an input–output activity that takes cultivated land resources as the object and, under specific natural productivity conditions, carries out its goal to maximize the utilization efficiency of arable land and promote a sustainable and intensive state by increasing the input intensity and reasonable utilization degree per unit area. Sustainable intensive utilization concepts [47] and the “social—economic—ecological” composite system of farmland utilization theory [48] are referenced in this research, and CLIU is defined by a reasonable investment intensity, balanced utilization degree, efficient output efficiency, and sustainable utilization status. Specifically, a reasonable investment intensity is achieved by improving business methods and operating models, transforming past material hard investments into technological soft investments, saving resources and avoiding excessive intensification, and elucidating the effectiveness and marginal nature of investment. The degree of balanced utilization refers to the delineation of zoning utilization models based on natural productivity conditions such as regional light, temperature, precipitation, and cultivated land terrain, as well as the balanced layout of management scales, regional layouts, and cultivation systems with spatial heterogeneity; it emphasizes the ability of the cultivation model to adapt local conditions. Output efficiency is determined by coordination of the spatiotemporal allocation of inputs such as land, labor, capital, and technology; improvements in the population carrying capacity of arable land; maximization of the comprehensive production efficiency of arable land; and steady increases in arable land remuneration. Continuous utilization status refers to sufficient and high-level tillage personnel; harmonization of the quantity, quality and ecological status of arable land; maintenance of the productivity and carrying capacity of cultivated land; guarantees of food security; and intergenerational fairness and distributive justice. Thus, based on CLIU connotations, the relevant literature, and data accessibility, an evaluation system for CLIU was constructed from four aspects: input intensity, utilization degree, output efficiency, and sustainability (Table 1).

2.3.2. Construction of the Driver System

According to the theory of human–environment relationships, the differences in CLIU among regions are caused by the differences in the natural conditions of cropland utilization and anthropogenic factors related to socioeconomic development. We grouped the potential driving factors of CLIU into two dimensions: natural and humanistic (Table 2). On the one hand, CLIU is constrained by natural conditions such as terrain and climate, which impact production patterns and utilization efficiency. Therefore, natural factors such as elevation and slope, which represent terrain, and precipitation and temperature, which represent climate, were chosen. On the other hand, CLIU in urban agglomerations is influenced not only by internal factors in the cropland use system but also by the level of intensive regional land use. First, the comprehensive development and construction of urban agglomerations has influenced society, the economy, and the ecological environment; improvements in the urbanization rate and the agglomeration of economic scale have benefited the efficiency and sustainable utilization of cultivated land in urban agglomerations [34,35]. Improvements in the internal efficiency of cultivated land utilization systems have transformed and driven the sustainable development of CLIU. Second, from the perspective of land use types and functions, cultivated land is one of many types of land use; urban land use in urban agglomerations has multiple functions related to urban life, agricultural production, and ecology [49]. The intensive use of urban land in urban agglomerations can further stimulate agricultural production and the ecological functions of cultivated land, driving sustainable and intensive cropland use. From the perspective of land use structure, conversions and transformations among arable land, agricultural land, and non-agricultural land are related, as are conversions and transformations between ecological land and urban construction land [50]. Urban land use in urban agglomerations promotes a more reasonable land use structure, which is conducive to ensuring the quantity and quality of cropland. Finally, under the constraints of territorial spatial planning, the overall investment intensity, utilization degree, and economic-social-ecological benefits of urban agglomeration construction land and agricultural land have significantly improved. Improvements in intensive land utilization will inevitably directly or indirectly drive improvements in CLIU levels; intensive land utilization has a spillover effect on CLIU. Therefore, anthropogenic factors were selected from two aspects: intensive use of cropland and intensive use of land (Table 2). The intensive use of cropland was evaluated by selecting four factors with higher weights from the evaluation system: the labor force index, food per capita, multiple cropping index, and agricultural machinery power. For intensive land use, 20 factors were selected to reflect the land input intensity, utilization degree, and economic-social-ecological benefits [51,52]; representative factors were extracted via PCA for statistical analysis.

2.4. Research Methods

2.4.1. Fuzzy Comprehensive

The original data were standardized using the standard deviation method, the index weight was calculated using the entropy method, and the comprehensive index was calculated using the fuzzy comprehensive evaluation method. The formulae are as follows:
e j = 1 ln ( n ) i = 1 n Z i j ln ( Z i j )
d j = 1 e j
W j = d j j = 1 m d j
S i = j = 1 m W j Z i j
where Z i j represents the standardized data, e j represents the entropy value of the j th indicator, W j represents the weight of the j th indicator, and S i represents the comprehensive index of intensive utilization of cultivated land in the j th county.

2.4.2. Dagum Gini Coefficient

The Dagum Gini coefficient [53] was used to evaluate the spatial imbalance of CLIU and was decomposed into three parts: intraregional differences, interregional differences, and hyperdensity. The formula is as follows:
G = j = 1 k h = 1 k i = 1 n j r = 1 n h S j i S h r 2 n 2 S ¯
where k represents the number of regions, n represents the total number of counties and districts, S j i ( S h r ) represents the i ( r ) comprehensive index of CLIU in counties and districts within the j ( h ) region, and S ¯ represents the average of the comprehensive index of CLIU in all counties and districts. Where G is the Gini coefficient, the larger its value is, the greater the degree of spatial difference.
The Gini coefficient of the region j is
G j j = i = 1 n j r = 1 n j S i j S j r 2 n 2 S j ¯
G j h = i = 1 n j r = 1 n h S j i S h r n j n h ( S j ¯ + S h ¯ )
G w = j = 1 k G j j p j q j
G n b = j = 2 k h = 1 j 1 G j h D j h ( p j q h + p h q j )
G t = j = 2 k h = 1 j 1 G j h ( 1 D j h ) ( p j q h + p h q j )
where G w represents the gap between cities within a province or county within a city, and G n b represents the gap between these regions when a province, city, or county is taken as a whole, reflecting the cross overlap between two different regions. G t represents the difference between two regions and is not the result of all individuals in one region having a higher composite index than all individuals in the other region.

2.4.3. Principal Component Analysis

According to the dimensionality reduction idea of PCA, a few major comprehensive indicators were extracted to replace the original indicator system. This method can eliminate the multicollinearity problem between indicators and preserve the main information features in the original indicators [54]. In this paper, the process of extracting the principal components of the driver of intensive land use was completed in Stata16 software. The p-value of Bartlett’s test was 0, and the value of the sample measure KMO was 0.804; the five principal component factors were then extracted.

2.4.4. Geographic Detectors

A geographic detector is a statistical method based on spatial differentiation that detects the driving force of independent variables on dependent variables and the interactions between independent variables [55]. Assuming that the influencing factors are the independent variable and that the comprehensive index of CLIU is the dependent variable, following formula is used:
q x = 1 1 n σ 2 i = 1 m n x i σ x i 2
where q x represents the influence coefficient. The closer q x is to 1, the greater the explanatory power of the factor. After discretization, the factors x are discretized with m levels of classification, n x i denotes the number of samples of factor x within level i ( i = 1 , 2 , , m ) , and n represents a total of 65 samples from all counties and districts in the study area. σ x i 2 denotes the discrete variance in the composite index of intensive utilization of cropland at level i , and σ 2 denotes the discrete variance in the composite index of CLIU in the whole area. Interaction detection is the assessment of the explanatory power of factors x 1 and x 2 together on y , which is divided into five types [56] (Table 3).

2.4.5. Geographically Weighted Regression (GWR) Model

(1)
Spatial Autocorrelation Analysis
The occurrence of spatial autocorrelation in the dependent variable is a prerequisite for applying geographically weighted regression [56], which can be measured by the global Moran’s I index with the following formula:
I = i = 1 n j = 1 n w i j ( S i S ¯ ) ( S j S ¯ ) i = 1 n j = 1 n w i j i = 1 n ( S i S ¯ ) 2
where n is the number of sample counties, S i and S j are the comprehensive index of CLIU for samples i and j , respectively, S ¯ is the average of the composite indices, and w i j is spatial weighting matrix (physics). The Moran’s I index range is [–1, 1], I = 0 is spatially uncorrelated and randomly distributed, I < 0 is spatially negatively correlated and dispersed, and I > 0 is spatially positively correlated and clustered. The closer it is to 1, the stronger the spatial cluster pattern, and vice versa.
(2)
GWR
The characteristic of GWR entails the regression coefficients considering the geographical location and spatial nonstationary nature, which can reflect the degree of influence of variables from different geographical locations on the region [57,58]. The formula is as follows:
y ( u ) = β 0 ( u ) + k = 1 p β k ( u ) × x k ( u ) + ε ( u )
where y ( u ) is the index of CLIU at the sample location, x k ( u ) is the value of the k th covariate at the sample location u , β k ( u ) is the regression coefficient of the k th covariate, β 0 ( u ) is the intercept term, and ε ( u ) is the random error term at the sample location u . In the GWR model, the spatial weight is determined by a Gaussian function, and the bandwidth is determined according to the Akaike information criterion (AIC).

3. Results

3.1. Characteristics of Spatial Distribution Pattern of CLIU

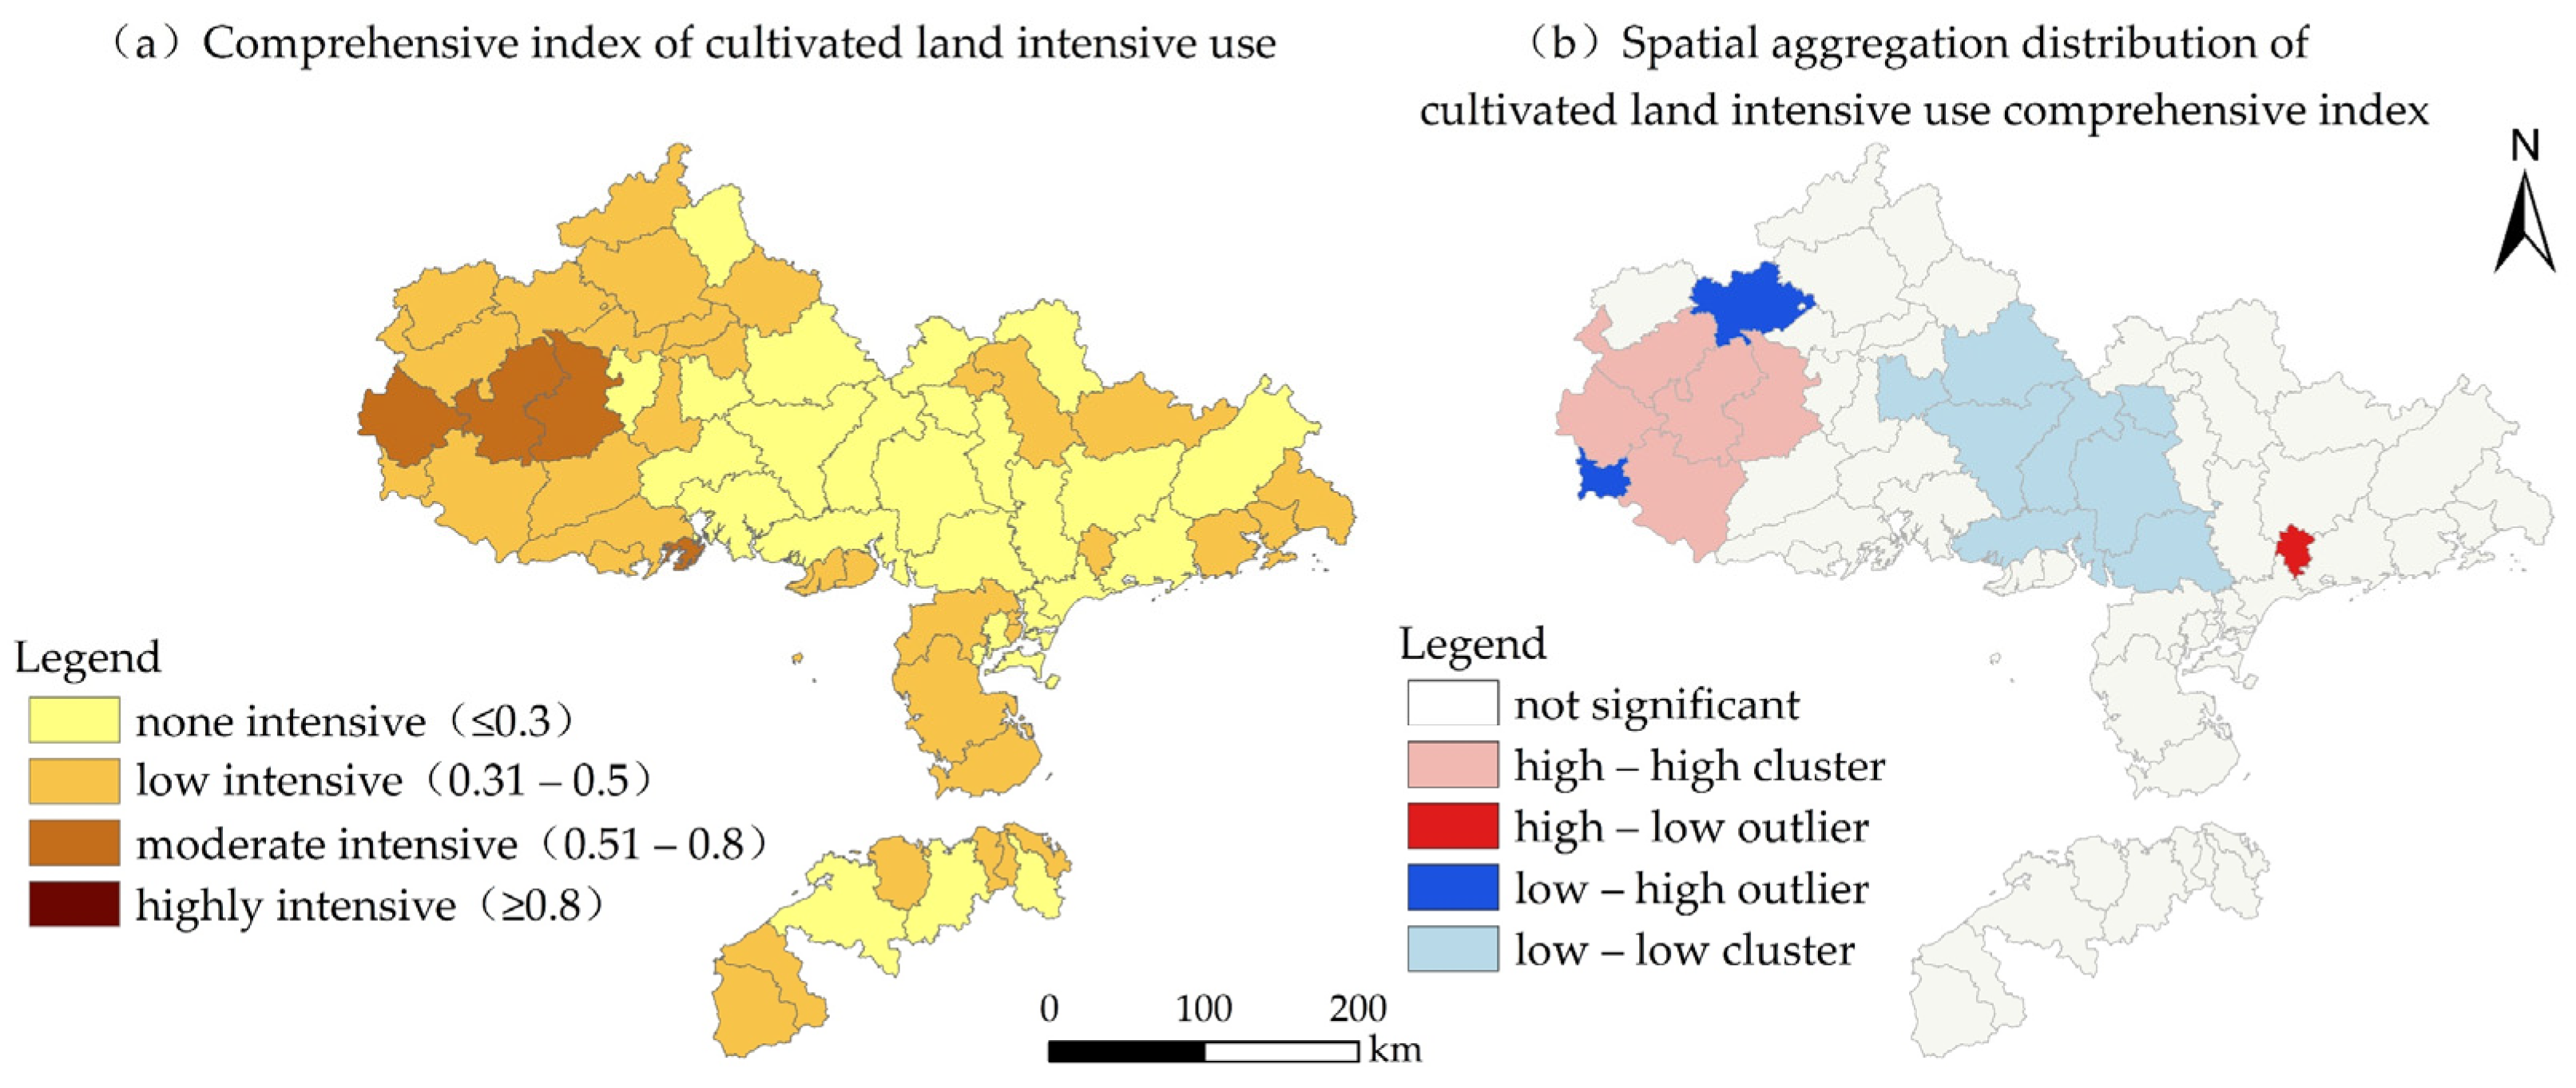
In 2021, the 65 counties of the Beibu Gulf urban agglomeration had higher CLIU levels; these included Jiangzhou District (0.606) in Chongzuo city, Gangkou District (0.58) in Fangchenggang city, and Fusui County (0.544) in Chongzuo city. The lowest levels were in Hepu County (0.149) in Beihai city, Qinbei District (0.154) in Qinzhou city, and Lingshan County (0.156) in Qinzhou city. The spatial distribution status was divided into four types: non-intensive (≤0.3), low intensive (0.3–0.5), moderate intensive (0.5–0.8), and highly intensive (≥0.8); a spatial distribution and clustering diagram was drawn (Figure 2). Overall, there were 25 non-intensive counties, 36 low-intensity counties, and 4 moderate-intensity counties; the average CLIU index was 0.334, indicating a low-intensity state. From the perspective of spatial distribution, relatively good development was concentrated mainly in Chongzuo and Nanning cities in the northwestern region. Among these cities, Chongzuo city is rich in arable land resources, has an extensive history of farming in the Zuojiang River Basin, and has a good foundation for the development of primary industry. Binyang and Wuming in Nanning city are located on the Guizhong Plain. These areas rely on water and soil resources in the Yongjiang River Basin and have good natural conditions for cultivation. From the perspective of spatial aggregation, Daxin, Jiangzhou, Fusui, Longzhou, and Ningming counties exhibit high levels of aggregation and intensity. The cities of Hengzhou, Yongning, Lingshan, Pubei, Hepu, Tieshangang, Fumian, Bobai, and Lianjiang exhibit low concentrations and low intensities.

3.2. Analysis of Spatial Imbalance in Cultivated Land Intensive Utilization

The overall Gini coefficient of CLIU in the Beibu Gulf urban agglomeration was 0.183. From the perspective of the province, Guangxi had the highest degree of spatial imbalance, with a Gini coefficient of 0.2. The performance of each city was as follows: Beihai (0.188) > Yulin (0.141) > Fangchenggang (0.116) > Nanning (0.099) > Chongzuo (0.095) > Qinzhou (0.067). With a Gini coefficient of 0.161, the spatial imbalance degree in Guangdong Province was moderate, and the performance of each city was as follows: Zhanjiang (0.169) > Maoming (0.163) > Yangjiang (0.107). Hainan had the smallest degree of spatial imbalance, with a Gini coefficient of 0.137.
From a provincial perspective, the degree of spatial imbalance between Guangxi and Guangdong was the highest (0.184); the degree of spatial imbalance between Hainan and Guangxi was in the middle (0.176); the degree of spatial imbalance between Hainan and Guangdong was the smallest (0.154). From an intercity perspective, the spatial imbalance between Chongzuo and Qinzhou in Guangxi and that between Fangchenggang and Qinzhou were the highest, with Gini coefficients of 0.476 and 0.44, respectively. The spatial imbalance coefficient between Maoming and Zhanjiang in Guangdong was the highest, with a Gini coefficient of 0.177. In Hainan Province, the Gini coefficient between Haikou and Danzhou was 0.145.
From the perspective of the provincial contribution rate, the contribution rates of supervariable density (50.33%) and intra-provincial differences (45.6%) were relatively high, while the contribution rate of interprovincial differences (4.07%) was the smallest. From the perspective of the municipal contribution rate, the contribution rate of intermunicipal differences within the Guangxi region was the highest (72.65%), while the contributions of intra-municipal differences (10.84%) and super variable density (16.51%) were relatively small. The contribution rates of supervariable density (50.02%) and intra-municipal differences (36.75%) in the Guangdong region were relatively high, while the contribution rate of intermunicipal differences (13.23%) was relatively small. The contribution rate of intermunicipal differences (47.44%) within the Hainan region was the highest, while that of intermunicipal differences (24.79%) and super variable density (27.77%) were relatively small.

3.3. Analysis of Spatial Nonstationarity in Cultivated Land Intensive Utilization

3.3.1. Geographical Exploration Results and Analysis

(1)
Driver Detection
According to the principal components of the driving factors, five principal component factors were extracted, for a cumulative contribution rate of 83.11% (Table 4). Specifically, the factor loadings of the land average labor force and average fiscal expenditure in the first principal component were the highest; they represent land-related labor and financial input intensity (X1). The factor load of the straight-line distance from the nearest port in the second principal component was the highest; it represents port trade convenience (X2). The factor loadings of the college degree or above proportion and the urban population proportion were the highest for the third principal component; they represent population urbanization (X3). The factor loads of per capita construction land, road area proportion, and per capita dwelling area in the fourth principal component were the highest; they represent construction land intensity degree (X4). The factor load of the number of industrial enterprises on average in the fifth principal component was the highest; it represents the industrial scale (X5).
In summary, a total of 13 driving factors were established, including the labor force index, food per capita, multiple cropping index, agricultural machinery power, land-related labor and financial input intensity, port trade convenience, population urbanization level, intensification of construction land, industrial scale, elevation, slope, precipitation, and temperature. Geographical detectors were used to determine the influence of the factors (Figure 3) in the following order of magnitude: multiple cropping index (0.57), labor force index (0.489), intensification of construction land (0.375), agricultural machinery power (0.249), temperature (0.221), food per capita (0.215), land-related labor and financial input intensity (0.189), port trade convenience (0.185), population urbanization level (0.172), industrial scale (0.161), precipitation (0.126), elevation (0.109), and slope (0.02).
(2)
Geodetector Results and Analysis
The multiple cropping index, labor force index, and construction land intensity were the main driving factors for the spatial differentiation of CLIU. The multiple cropping index is the ratio of annual cultivated area to cultivated land area, and the larger its value, the greater the utilization intensity per unit area. The labor force index refers to the number of employees in agriculture, forestry, animal husbandry, and fishery per unit of agricultural land area; the larger the value, the larger the number of employees in agriculture, forestry, animal husbandry, and fishery, and the more sufficient the labor force input. The intensity of construction land had a significant impact on the intensive use of cultivated land; if the per capita construction land scale can be controlled within a certain range, the scale of construction-occupied cultivated land decreases. If the potential of existing construction land can be explored and improved, large-scale expansion of the construction can be alleviated, sufficient space for life and ecology can be reserved, and the protection of cultivated land quantity, quality, and ecology can be promoted.
An interaction detector was used to explore the extent to which the two factors together influenced CLIU, and the detection results (Table 5) showed that the influence of dual factor interaction was greater than that of single factor independent action. Among the 78 dual factor interactions, 21 showed dual factor enhancement, and the remaining 57 showed nonlinear enhancement. In the results for the two-factor interactive detection coefficient (Figure 4), the most significant dual factor enhancement types were interactions between the labor force index and multiple cropping index (0.859); multiple cropping index and construction land intensity (0.842); and multiple cropping index and agricultural machinery power (0.808). The most significant nonlinear enhancement types were the interactions between food per capita and the multiple cropping index (0.856); agricultural machinery power and construction land intensity (0.856); and the labor force index and industrial scale (0.841).

3.3.2. Geographical Weighted Regression Results and Analysis

(1)
Model Regression Coefficient Results
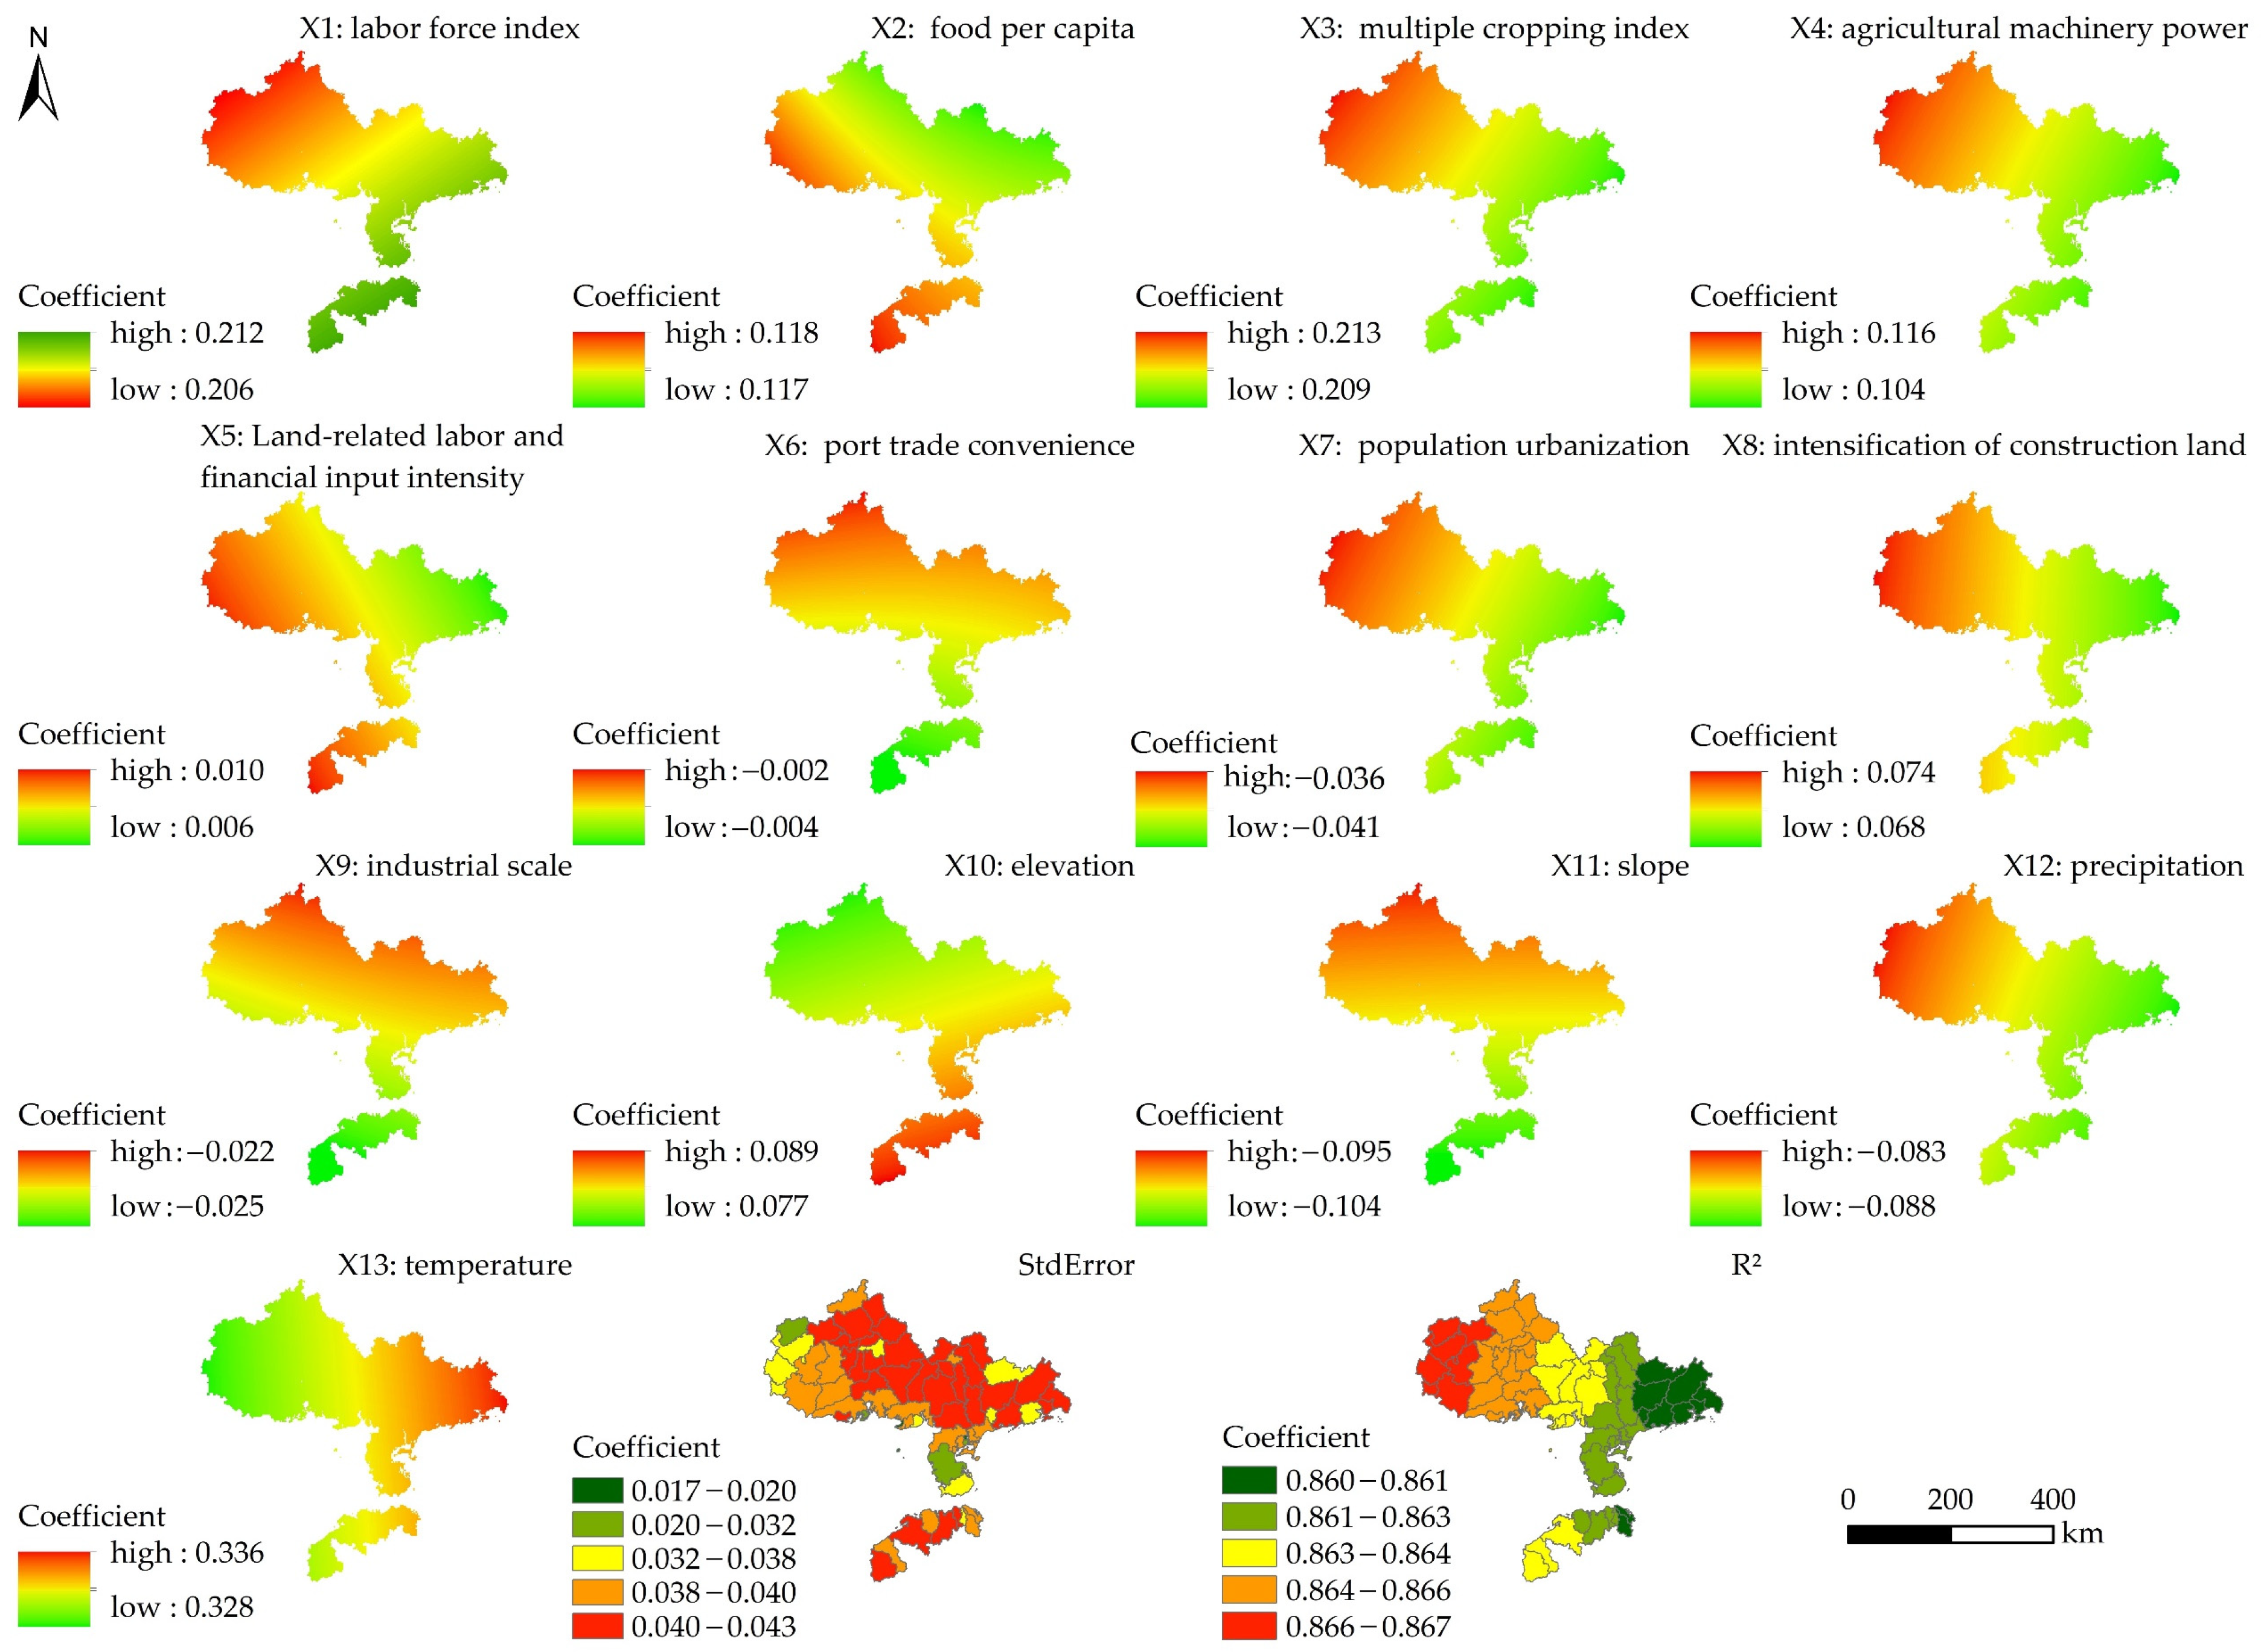
Global Moran’s I of the comprehensive index of CLIU in 65 counties was calculated as 0.244, the variance as 0.008, the Z value as 2.819, and the p value as 0.005, thus indicating a significant spatial correlation. On the basis of these findings, geographically weighted regression was used to measure the spatial variability in the 13 factors. The regression results revealed that R2 was 0.866, the corrected R2 was 0.829, the bandwidth was 120 km, the sum of the squared residuals was 0.102, and the sigma value was 0.045, indicating that the model passed the multicollinearity test, with a good fitting effect and high reliability.
The regression coefficient results of the model (Table 6) showed that temperature, multiple cropping index, labor force index, food per capita, agricultural machinery power, elevation, intensification of construction land, and land-related labor and financial input intensity had positive impacts on CLIU in the Beibu Gulf urban agglomeration, while precipitation, population urbanization level, industrial scale, and port trade convenience had negative impacts on CLIU.
(2)
Analysis of Spatial Differences Among Various Factors
As for the internal driving factors of CLIU (Figure 5), the regression coefficient of labor force index was high in Danzhou, Dongfang, Chengmai, Lingao, Changjiang, Xuwen, Yangdong, and Jiangcheng. Common characteristics of these areas include a larger proportion of people engaged in agriculture, forestry, animal husbandry, and fishery, as well as a relatively stable labor force index for arable land. Similarly, the regression coefficient for food per capita was high in Pingxiang, Longzhou, Ningming, Dongfang, and Changjiang. In addition, the arable land per capita was relatively large, and the extent of arable land in these areas is relatively high, with relatively good agricultural conditions; these factors are conducive to intensive cultivation. Similarly, the regression coefficients of multiple cropping index and agricultural machinery power were relatively high in Wuming, Long’an, Mashan, Shanglin, Fusui, Ningming, Longzhou, Daxin, Tianwait, and Pingxiang, as these areas have relatively flat terrain; thus, large-scale agricultural production with a high degree of comprehensive utilization of arable land was basically achieved.
As for the external driving factors for intensive land use (Figure 5), the regression coefficient of land-related labor and financial input intensity in Pingxiang, Longzhou, Ningming, Shangsi, Dongxing, Dongfang, and Changjiang was high; these areas are located along the southwestern border of China, and the Border-Raising and People-Raising Project has promoted investments in land-related labor, materials, and financial resources, thus indirectly driving CLIU. The regression coefficient of construction land intensification in Fushui, Ningming, Longzhou, Daxin, Pingxiang, Tianwait, and Long’an was high; these counties are located in mountainous areas, with relatively remote locations, slow urban construction growth, and less cultivated land occupied by construction. These factors are conducive to the protection of cultivated land quantity. From the perspective of national food security, the return coefficient of port trade convenience was high in Tiantai, Daxin, Long’an, Mashan, Shanglin, Wuming, and Binyang; although the foreign trade of agricultural products (such as imported grain) can make up for the domestic demand gap, it is not conducive to improving CLIU in the long run. The population urbanization level regression coefficient was high in Shanglin, Wuming, Xixiangtang, Long’an, Fusui, Ningming, Longzhou, Daxin, Tianwait, and Pingxiang, the population urbanization rate in these areas was relatively low, and the proportion of rural population was relatively large. However, the gradual increase in the transfer of the rural population to urban areas has led to significant patterns of abandonment and nonagricultural transformation. The return coefficients of industrial scale in Xinyi, Xingye, Beiliu, Rongxian, Mashan, and Shanglin were high, the number of large-scale industries in these areas was small, and the proportion of industrial land area was small; these factors protect land area to a certain extent. However, industrialization inevitably leads to transformations of arable land resources, affecting the quantity and quality of cultivated land.
As for the driving factors of the natural conditions of cultivated land, the elevation regression coefficients of the four districts of Haikou City, Danzhou, and Xuwen were relatively high; these areas have low altitudes, small topographic relief, and relatively flat terrains, which provide an important natural foundation for the mechanization and large-scale development of cultivated land. The slope regression coefficient was high in Tiandeng, Daxin, Long’an, Shanglin, Wuming, and Mashan. These areas are located in the remaining veins of Daming Mountain and Shiwandashan Mountain, and some of them are karst areas, which have great topographic relief, poor soil fertility, and poor arable land quality; these factors limit large-scale farming. The regression coefficient of precipitation was high in Fusui, Ningming, Longzhou, Daxin, Tiandeng, Long’an, and Mashan; compared with that in inland areas, high precipitation in coastal areas exacerbates surface scouring and easily causes soil erosion. Furthermore, karst areas exacerbate leaching and accelerate the formation of rocky desertification, which is not conducive to soil and water conservation. The temperature regression coefficient was high in Xinyi, Gaozhou, Dianbai, Jiangcheng, Yangdong, Yangchun, and Yangxi, the hydrothermal conditions in these regions are better than those in other regions, and the conversion rate of crop photosynthesis is high. These factors, together with the flat topography, are conducive to high and stable crop yields.

4. Discussion

4.1. The Interactive Relationship between Urban Agglomeration Development and CLIU

Under the strategy of new urbanization and rural revitalization, the tasks of cultivated land protection and intensive use in China are arduous and have stimulated academic research related to cultivated land, which has become an important topic; current research mainly involves land use efficiency and spatiotemporal evolution [59,60], changes in cultivated land use and carbon effects [61], and the ecological benefits of cultivated land. However, studies on CLIU in urban agglomerations are rare. From a superficial perspective, there seems to be no correlation between the development of urban agglomerations and the intensive use of cultivated land. Urban agglomerations are mainly places for political, economic, social, and cultural development, where construction land and its intensive use are the main focus. CLIU mainly serves agricultural production and ensures food security, with arable land as its main source. However, from the perspective of land use transformation, there is a strong correlation between urban agglomerations and cultivated land, with intensive construction land use connecting them (Figure 6). Compared with typical urban agglomerations in China, such as the Beijing-Tianjin-Hebei region, Yangtze River Delta, and Pearl River Delta, the Beibu Gulf urban agglomeration has typical coastal characteristics but is mainly composed of small towns with relatively low levels of urbanization and modernization; thus, its agricultural resources and ecological foundation are relatively superior. However, with the implementation of “the Belt and Road” strategy, the Beibu Gulf urban agglomeration will surely usher in new development opportunities. Although land use in the agglomeration of port cities is more efficient and intensified, the amount of arable land occupied for construction is large, which is not conducive to arable land protection [62]; thus, the coordinated coupling of the scale of urban construction land with protections for cultivated land quantity and quality is necessary for high-quality regional development. The results showed that the intensity of construction land has a positive effect on CLIU; among all the anthropogenic factors, the regression coefficient of construction land intensity is the largest. Therefore, improving the overall level of construction land intensity in urban agglomerations is the main factor for achieving farmland protection and intensive use. This process requires the government to improve land use efficiency and control land use scale by adjusting the supply and demand status of urban industrial and residential land [63]. Reductions in the scale of newly-increased construction land will equalize the quantity and quality of cultivated land, which will ensure the sustainable development of agricultural production space and agro-ecological space [64], thus enabling the scale and supply of construction land to be compatible with the level of urban socioeconomic development.

4.2. Comprehensive Driving Mechanism of Multiple Factors

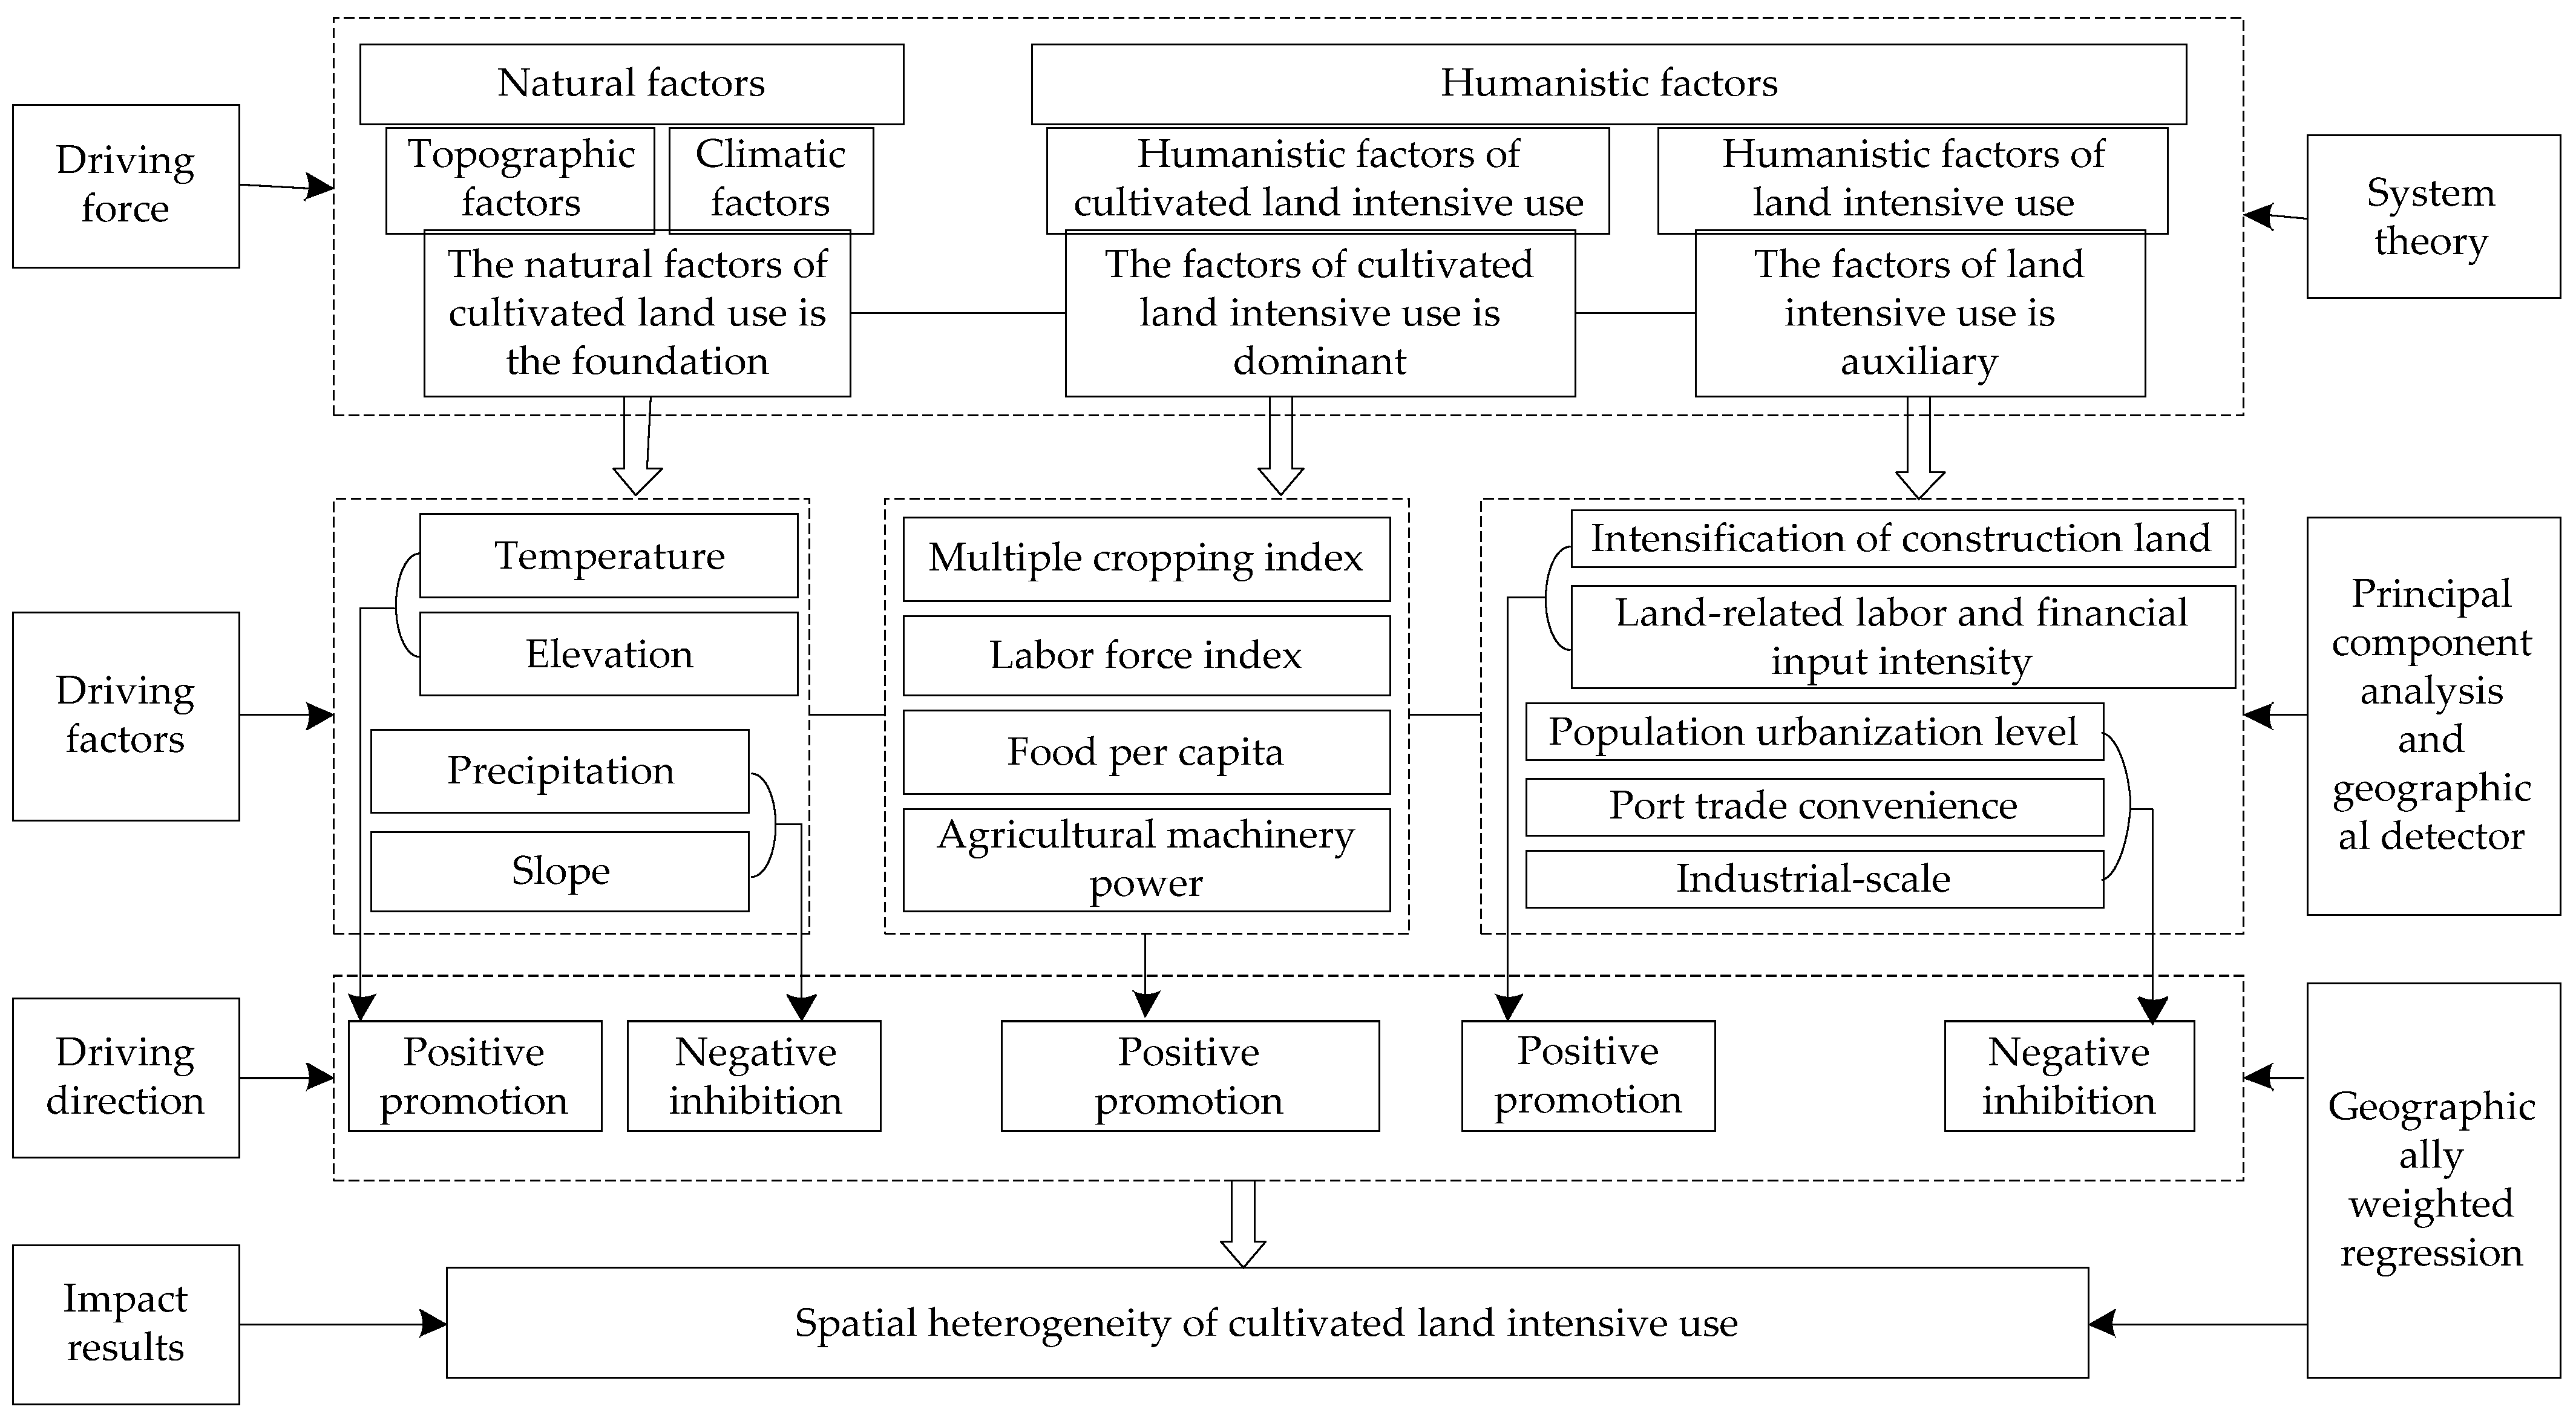
The CLIU level and spatial differentiation in the Beibu Gulf urban agglomeration were the result of the interaction of multiple natural and humanistic factors (Figure 7). From the perspective of geographical detection and regression coefficient size, the difference in the input and output benefits of cultivated land due to improvements in the multiple cropping index and labor force index was an important internal driving force. This driving force triggered the level and spatial differentiation of CLIU, thus playing a dominant role. Furthermore, differences in temperature and slope can also lead to differences in the spatial differentiation of CLIU. Temperature was the largest factor in the positive regression coefficient, and slope was the smallest factor in the negative regression coefficient; both of these factors are the basis for zoning control and intensive use of cultivated land. The difference in land use and social benefits caused by construction land intensification and population urbanization growth was the main external driving force for the spatial differentiation of CLIU, playing a supporting role. According to the sizes of the regression coefficients for the various factors, the average value of the four internal factors for CLIU was 0.162, indicating that they were positively related to CLIU. The average value of the five factors of intensive land use was 0.003, which indicated a weak positive effect on CLIU. The average value of the four natural factors affecting the conditions of cultivated land was 0.057. These factors play a comprehensive and fundamental role in zoning control and intensive utilization of cultivated land. Overall, the multiple factors reflecting the driving mechanism were the natural conditions of cultivated land, which provided the foundation; the internal factors of intensive use of cultivated land, which were the dominant factor, and the external factors of intensive land utilization, which were the auxiliary factor.

4.3. Impact of Socio-Economic Factors on CLIU

At present, the overall level of CLIU in the Beibu Gulf urban agglomeration is relatively low, as most of the region exhibits low-intensity CLIU. Although China has implemented a strict farmland protection system [65], occupation–compensation balance, and import–export balance policies, which have helped ensure the quantity of farmland, policy performance is still not outstanding [66]; moreover, the effectiveness of farmland protection policies in promoting CLIU has not been significant. Therefore, improvements in the utilization and protection of farmland through scientific innovation, technological innovation, and policy innovation are still necessary. CLIU reflects not only the energy flow between humans and arable land but also the harmonious development state between humans and nature; therefore, the macroeconomic situation of regional society and the economy is also a driving force affecting CLIU. Grain prices can affect farmers’ enthusiasm for farming [67]. The statistical data on the purchase prices of major grains in China (Figure 8a) show that the purchase prices of mid-to-late season rice in China decreased from 2709 to 2520 CNY/ton between 2017 and 2019 and increased from 2520 to 2666 CNY/ton between 2019 and 2021. In Guangxi, the purchase price fell from 3311 to 2947 CNY/ton between 2017 and 2019 and then rose from 2947 to 3238 CNY/ton between 2019 and 2021. In Guangdong, the purchase price also fell from 3160 to 3133 CNY/ton between 2017 and 2019 but then rose from 3133 to 3248 CNY/ton between 2019 and 2021. Chinese CPI statistics (Figure 8b) show that the national CPI increased from 101.6 to 102.9 between 2017 and 2019 and decreased from 102.9 to 100.9 between 2019 and 2021, with Guangxi increasing from 101.6 to 103.7 between 2017 and 2019 and decreasing from 103.7 to 100.9 between 2019 and 2021. Guangdong increased from 101.5 to 103.4 between 2017 and 2019 and decreased from 103.4 to 100.8 between 2019 and 2021. Hainan increased from 102.8 to 103.4 between 2017 and 2019 and decreased from 103.4 to 100.3 between 2019 and 2021.The statistical data on the amount of agricultural fertilizer applied (Figure 9a) shows that the amount of agricultural fertilizer applied nationwide decreased from 5859.4 to 5191.3 million tons, with the amount applied in Guangxi dropping from 263.83 to 251.9 million tons, that in Guangdong from 237.94 to 212.9 million tons, and that in Hainan from 51 to 40.8 million tons. The amount of agricultural fertilizer applied in the Beibu Gulf urban agglomeration also showed a downward trend between 2017 and 2021. The statistical data on the size of the cultivated area (Figure 9b) show that the total cultivated area in China has decreased from 13488.12 to 12751.68 million hectares, with the cultivated area in Guangxi decreasing from 438.75 to 326.02 million hectares, that in Guangdong from 259.97 to 189.97 million hectares, and that in Hainan from 72.24 to 48.75 million hectares.
Overall, the purchase price of rice in the Beibu Gulf urban agglomeration showed a trend of decreasing and then increasing from 2017 to 2021, CPI showed a trend of increasing and then decreasing, and both fertilizer application and cultivated land area showed a decreasing trend. Despite fluctuations in rice purchase prices, CPI, fertilizer application, and cultivated land area in the Beibu Gulf urban agglomeration between 2017 and 2021, it can be hypothesized that the recent recovery in rice purchase prices, which was accompanied by a decline in CPI, was not sufficient to regain farmers’ confidence and thus reverse the trend of declining fertilizer application and decreasing cultivated land size. On the one hand, the low purchase price of grain and the expropriation of arable land have led to farmers earning a low and declining income from growing grain. The “rent-seeking” behavior of farmers has changed their work as they try to improve their economic situation. On the other hand, the cost of production and living for farmers has increased annually. Together with the effects of inflation, which have increased the financial pressure on farmers, these social and economic macro factors are reducing farmers’ motivation to cultivate their farmland. As a result, many highly skilled workers have migrated to the cities, labor has moved to secondary and tertiary industries, and farmland is increasingly lying fallow [68]; these factors have led to inefficient use of farmland. Therefore, low cereal price is not only an important factor limiting the improvement of CLIU but also the driving force behind nongrain production on cultivated land [69]. The government should formulate a regional grain purchase price protection mechanism to stabilize the selling price of grain while improving the price of grain storage. In addition, besides providing subsidies for agriculture, rural areas, and farmers, the grain storage market mechanism should be reformed to stabilize grain prices and enhance farmers’ confidence and enthusiasm in agriculture.

4.4. Policy Implications

According to the analyses performed in this research, some policies are suggested for the government to implement.
(1)
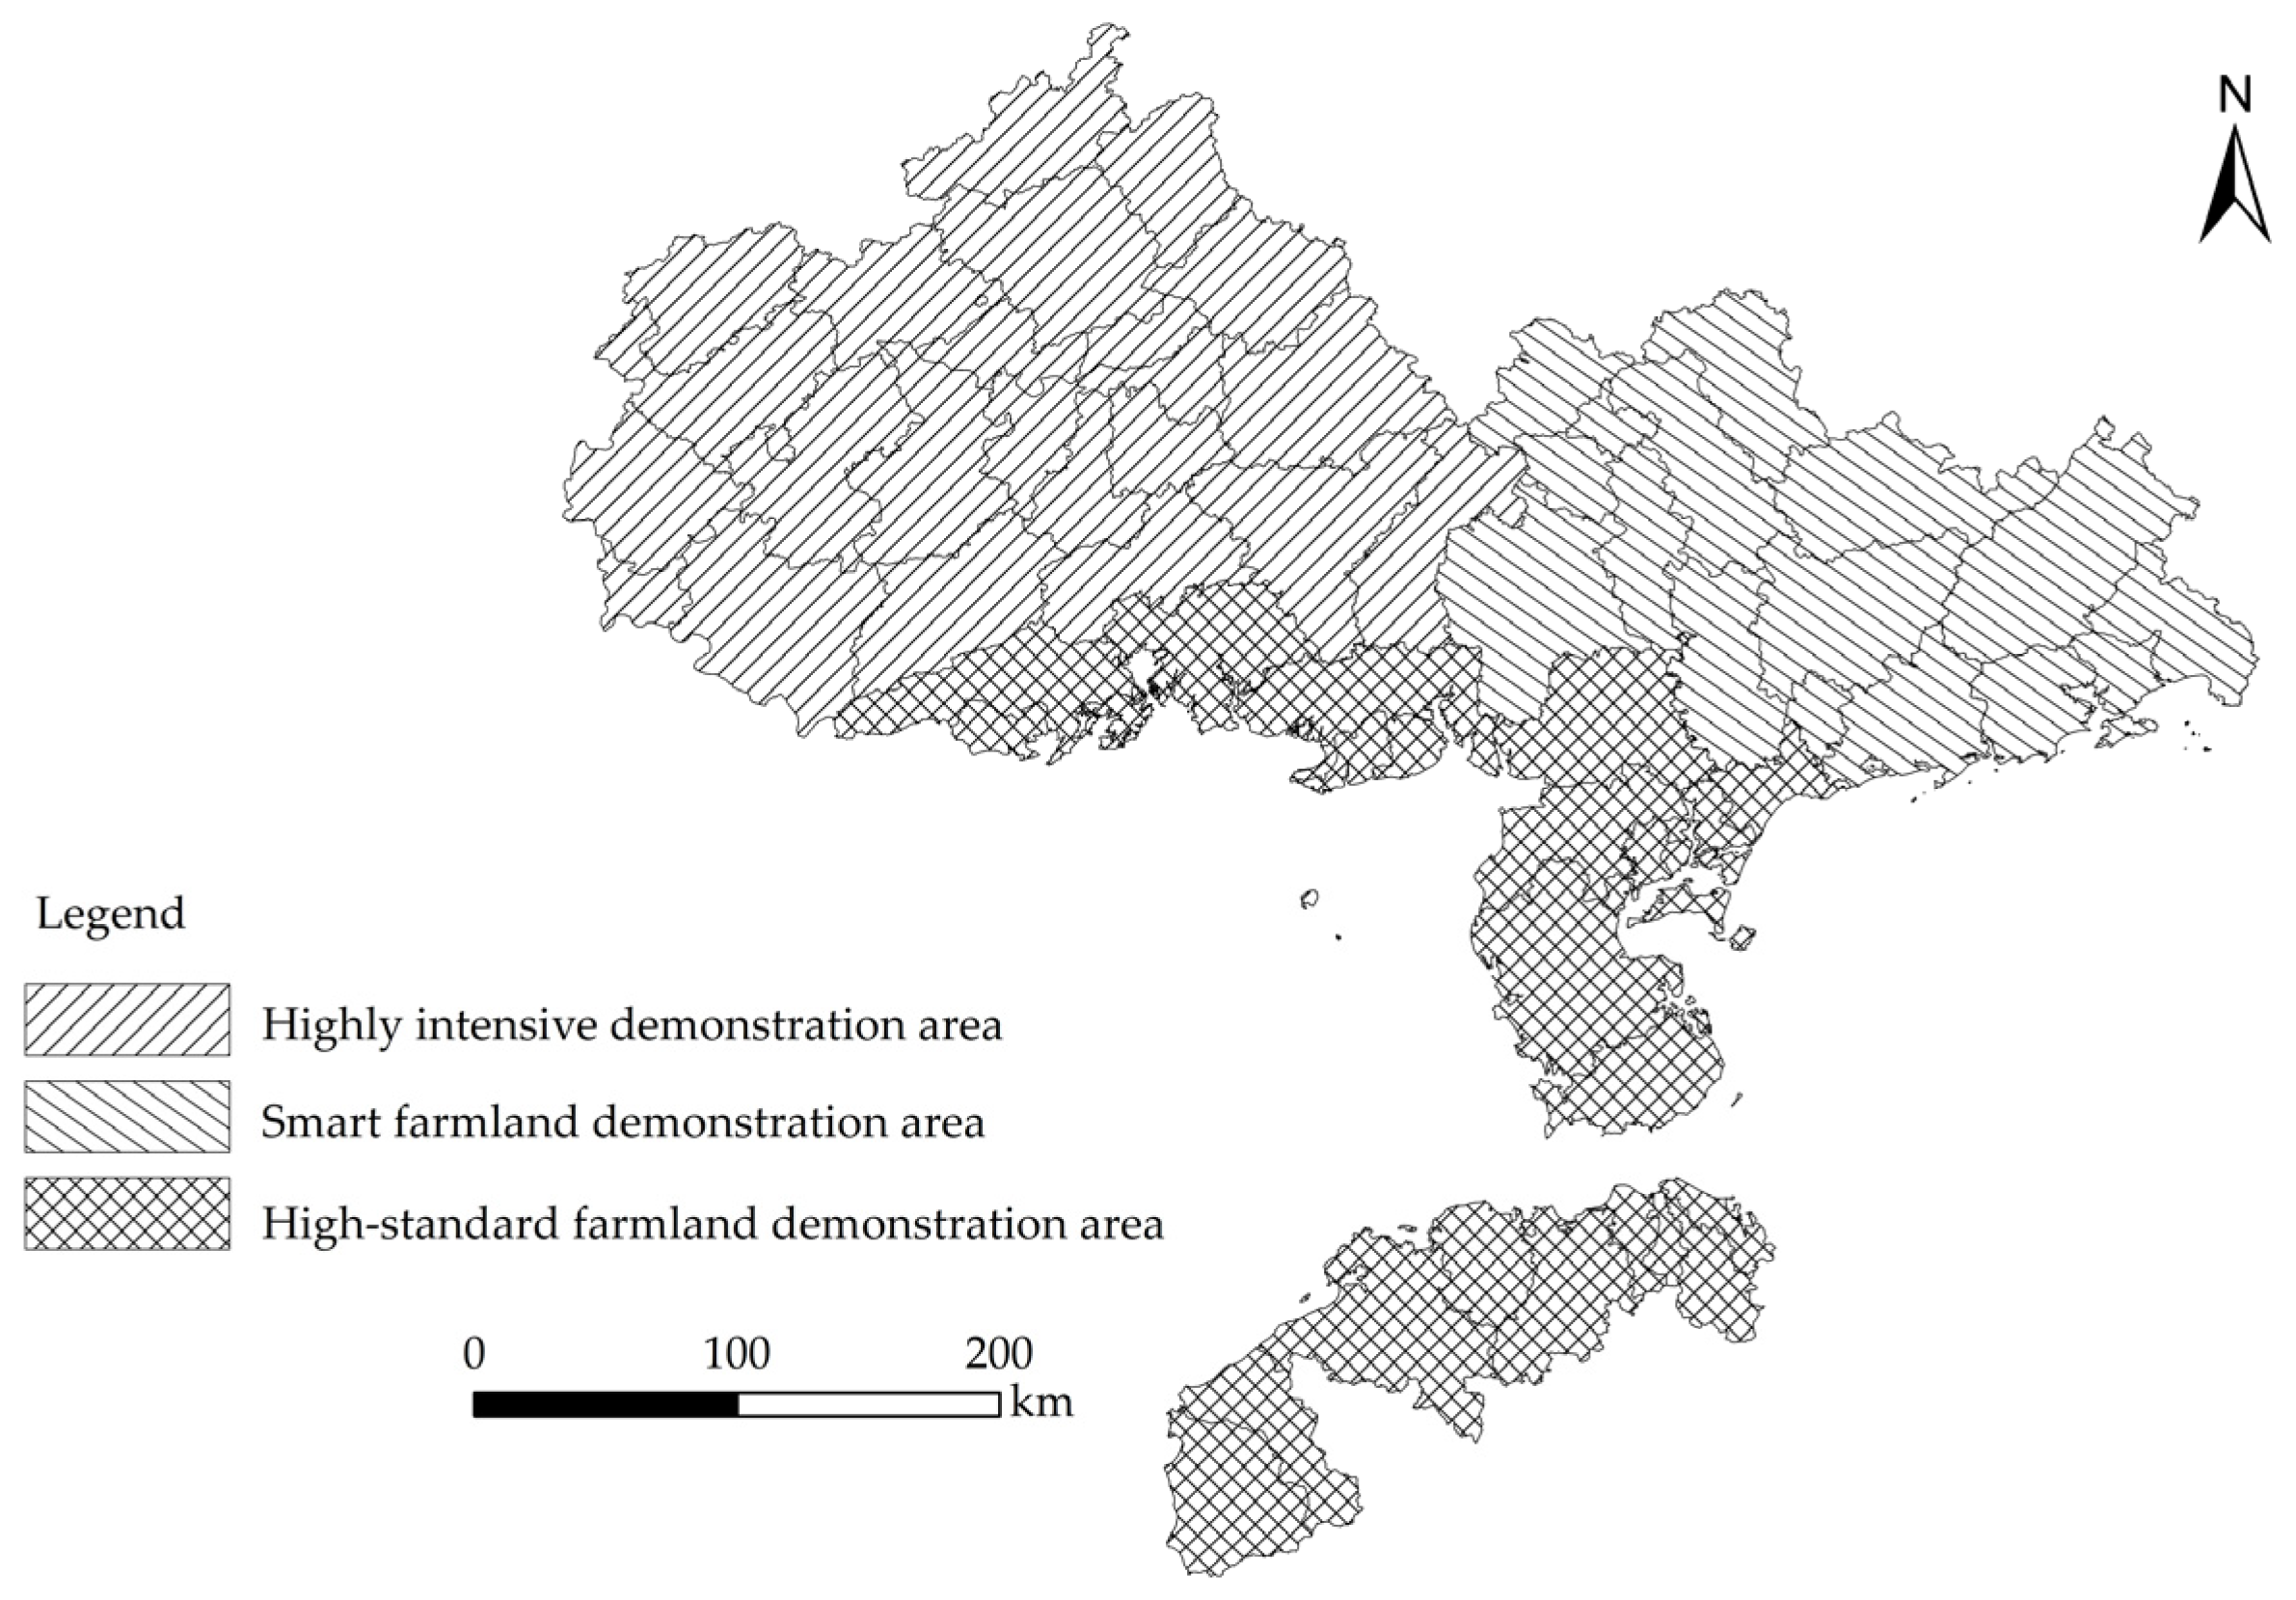
Based on the spatial patterns of CLIU, measures for regional differentiation should be taken to delineate areas of control for CLIU. The research results again showed that the level of CLIU in counties and districts under the jurisdiction of Chongzuo and Nanning city in Guangxi was higher than that in other regions (Figure 2). Nanning is part of the Guizhong Plain area, Chongzuo is a large city with farming activities, and Long’an County in Nanning city is the birthplace of Na culture. These areas are dominated by the rice cultivation civilization, which has a profound impact on the development and utilization of arable land resources and agricultural production in the foothills of the Daming Mountains, Zuojiang-Youjiang River Basin, and Yongjiang River valley. The basic agricultural conditions in the region are relatively solid, but the cultivated fields are small and scattered; therefore, the counties and districts in Chongzuo and Nanning in Guangxi should accelerate the process of farmland transfer, implement large-scale management, and create highly intensive demonstration areas. Yulin city in Guangxi and Maoming city in Guangdong have moderate CLIU levels. Yulin is rich in arable land resources, as digital agriculture developed early. Maoming has promoted the construction of agricultural industry clusters and the development of characteristic agriculture. Therefore, these cities should implement comprehensive land consolidation, promote agricultural mechanization and digital control, and then create a smart farmland demonstration zone. The counties and districts of Qinzhou, Beihai, Fangchenggang, Zhanjiang, and Haikou should strictly control the scale of cultivated land occupied by construction resulting from economic development in the Bay Area, vigorously treat salinized and hardened cultivated land in coastal areas, develop salt-tolerant varieties of rice and sea rice planting techniques, and create coastal high-standard farmland demonstration areas (Figure 10).
(2)
Identifying the spatial heterogeneity of key factors for different counties enables the implementation of measures to control key indicators. The results showed that factors such as the degree of construction land intensification and population urbanization can have positive or negative effects on CLIU (Table 6 and Figure 5). Therefore, government agencies can indirectly promote the level of CLIU by improving the degree of construction land intensification and enhancing the vitality of the rural population and other measures. To manage the protection of farmland, farmland resources in districts and counties should be zoned based on the criteria of natural conditions such as temperature and terrain slope and habitat quality assessment to achieve a balance of cultivated land at different administrative levels. The replanting index should be included as the primary indicator in the farmland protection system for performance management. The law on compensation of arable land should be applied, and a map of the current status of compensation of arable land and a distribution map of potential upgrading at the community level should be established. Subsequently, a differentiated production function for arable land should be established to improve the input and output efficiency of arable land.
(3)
The spatial nonequilibrium pattern of CLIU in the Beibu Gulf urban agglomeration reflects differences in resource allocation and input-output status during the process of arable land utilization. To promote the coordinated development of CLIU between counties, it is essential to strengthen the integrated control of arable land and encourage cooperation between neighboring counties to increase the sharing of agricultural resources, technology, and equipment. A bay area large tillage system should be established to quantify the land remuneration of cultivated land in each county and district, clarify the coordinated relationship between the intensive margin of cultivated land use and the intensive margin of nonagricultural land use, and reduce intergroup overlap in the degree of CLIU between counties.

4.5. Limitations

This research developed an evaluation system for CLIU that integrates methods such as the Dagum Gini coefficient, PCA, geographic detectors, and geographically weighted regression. Then, CLIU and its driving factors in the Beibu Gulf urban agglomeration were comprehensively analyzed from the perspective of spatial heterogeneity. Based on the geographical detection results for each factor, the multiple cropping index, labor force index, and interaction between the two are the main driving factors; on this basis, the driving influences of intensive land use and regional natural factors on CLIU are explored. Thus, this research contributes to future policy implementations. However, due to the data limitations, several aspects need to be ameliorated by future research. First, on the evaluation scale, CLIU was investigated only at county scale; detailed research that takes villages and towns as the research objects needs to be further expanded. Second, the effects of factors on CLIU are not constant, as they change over time. The drivers of long time series were not investigated in this research. Finally, the coupled coordination mechanism of urban agglomeration construction and intensive utilization of arable land needs to be verified by a large amount of experimental data in order to better reveal the scale of mutual contradictions.

5. Conclusions

The case of the Beibu Gulf urban agglomeration in China shows that the spatial heterogeneity of CLIU is manifested by the spatial nonequilibrium of patterns and the spatial nonstationarity of factors, which helps to better promote inclusive spatial design and differentiated control systems.
On the spatial nonequilibrium scale, relatively high levels of CLIU were found in the Beibu Gulf urban agglomeration in the Jiangzhou District of Chongzuo city, the Fusui County of Chongzuo city, and the Port District of Fangchenggang city, while lower levels were found in the Hepu County of Beihai city, the Qinbei District of Qinzhou city, and the Lingshan County of Qinzhou city. The average level of CLIU in the region was not high; there was a significant spatial nonequilibrium, and the hypervariable density and provincial difference were the main factors.
On the spatial nonstationarity scale, among the independent effects of individual factors, the multiple cropping index, labor force index, and intensification of construction land had the largest impacts on CLIU and spatial differentiation; among the interaction effects of two factors, there were mainly nonlinear enhancements, with the interaction between the labor force index and the multiple cropping index being the most significant. The coefficients of temperature, multiple cropping index, and labor force index were relatively large and positive, while the coefficients of slope, precipitation, and urbanization were relatively small and negative; additionally, the driving forces of different factors on CLIU were spatially nonstationary.
On the driving mechanisms scale, the spatial heterogeneity of CLIU in the Beibu Gulf urban agglomeration was manifested by the spatial nonequilibrium of the pattern and the spatial non-smoothness of the factors; furthermore, the roles of multifactors were embodied as follows: the natural factors of cropland were the foundation, the factors of CLIU were dominant, and the factors of intensive land use were auxiliary.

Author Contributions

Conceptualization, methodology, investigation, resources, data curation, visualization, formal analysis, writing—review, project administration, Z.Z.; supervision, writing—review and editing, visualization, project administration, funding acquisition, Y.Z.; software, validation, resources, data curation, writing—review and editing, X.Z. All authors have read and agreed to the published version of the manuscript.

Funding

This research was supported by the Young Scientists Fund of the National Natural Science Foundation of China (Grant No: 42301306); the National Social Science Foundation of China (Grant No: 21XGL015); The Key Projects of Philosophy and Social Science Planning in Inner Mongolia Autonomous Region (Grant No: 2022NDA219); Qinzhou Scientific Research and Technology Development Project (Grant No: 20223633); Graduate students’ research & Innovation fund of Inner Mongolia Normal University (Grant No: CXJJB23016).

Institutional Review Board Statement

Not applicable.

Informed Consent Statement

Informed consent was obtained from all subjects involved in the study.

Data Availability Statement

The data presented in this study are available on request from the corresponding author.

Acknowledgments

We thank all the reviewers for their suggestions.

Conflicts of Interest

The authors declare no conflicts of interest.

References

  1. Wang, J.; Su, D.; Wu, Q.; Li, G.; Cao, Y. Study on eco-efficiency of cultivated land utilization based on the improvement of ecosystem services and emergy analysis. Sci. Total Environ. 2023, 882, 163489. [Google Scholar] [CrossRef]
  2. Xie, H.; Jin, S. Evolutionary game analysis of fallow farmland behaviors of different types of farmers and local governments. Land Use Policy 2019, 88, 104122. [Google Scholar] [CrossRef]
  3. Rosegrant, M.W.; Cline, S.A. Global food security: Challenges and policies. Science 2003, 302, 1917–1919. [Google Scholar] [CrossRef]
  4. Song, X.; Huang, Y.; Wu, Z.; Ouyang, Z. Does cultivated land function transition occur in China? J. Geogr. Sci. 2015, 25, 817–835. [Google Scholar] [CrossRef]
  5. Jiang, G.; Wang, M.; Qu, Y.; Zhou, D.; Ma, W. Towards cultivated land multifunction assessment in China: Applying the “influencing factors-functions products-demands” integrated framework. Land Use Policy 2020, 99, 104982. [Google Scholar] [CrossRef]
  6. Wang, X.; Wang, D.; Wu, S.; Yan, Z.; Han, J. Cultivated land multifunctionality in undeveloped peri-urban agricul ture areas in China: Implications for sustainable land management. J. Environ. Manag. 2023, 325, 116500. [Google Scholar] [CrossRef] [PubMed]
  7. Cheng, P.; Tang, H.; Lin, F.; Kong, X. Bibliometrics of the nexus between food security and carbon emissions: Hotspots and trends. Environ. Sci. Pollut. Res. 2023, 30, 25981–25998. [Google Scholar] [CrossRef]
  8. Li, W.; Wang, D.; Liu, S.; Zhu, Y. Measuring urbanization-occupation and internal conversion of peri-urban cultivated land to determine changes in the peri-urban agriculture of the black soil region. Ecol. Indic. 2019, 102, 328–337. [Google Scholar] [CrossRef]
  9. Bai, X.; Shi, P.; Liu, Y. Society: Realizing China’s urban dream. Nature 2014, 7499, 158–160. [Google Scholar] [CrossRef] [PubMed]
  10. Trewavas, A. Malthus foiled again and again. Nature 2002, 418, 668–670. [Google Scholar] [CrossRef]
  11. Naylor, R.L. Energy and resource constraints on intensive agricultural production. Annu. Rev. Energy Environ. 1996, 21, 99–123. [Google Scholar] [CrossRef]
  12. O’Kelly, M.; Bryan, D. Agricultural location theory: Von thunen’s contribution to economic geography. Prog. Hum. Geogr. 1996, 20, 457–475. [Google Scholar] [CrossRef]
  13. Sen, A. On the labour theory of value: Some methodological issues. Camb. J. Econ. 1978, 2, 175–190. [Google Scholar] [CrossRef]
  14. Czyżewski, B.; Matuszczak, A. A new land rent theory for sustainable agriculture. Land Use Policy 2016, 55, 222–229. [Google Scholar] [CrossRef]
  15. Yang, J.; Lin, Y. Spatiotemporal evolution and driving factors of fertilizer reduction control in Zhejiang province. Sci. Total Environ. 2019, 660, 650–659. [Google Scholar] [CrossRef] [PubMed]
  16. Shen, Y.; Zhang, Z.; Xue, Y. Study on the new dynamics and driving factors of soil pH in the red soil, hilly region of south China. Environ. Monit. Assess. 2021, 193, 304. [Google Scholar] [CrossRef]
  17. Ye, S.; Song, C.; Shen, S.; Gao, P.; Cheng, C.; Cheng, F.; Wan, C.; Zhu, D. Spatial Pattern of Arable Land-Use Intensity in China. Land Use Policy 2020, 99, 104845. [Google Scholar] [CrossRef]
  18. Darilek, J.L.; Huang, B.; Wang, Z.G.; Qi, Y.B.; Zhao, Y.C.; Sun, W.X.; Gu, Z.Q.; Shi, X.Z. Changes in soil fertility parameters and the environmental effects in a rapidly developing region of China. Agric. Ecosyst. Environ. 2009, 129, 286–292. [Google Scholar] [CrossRef]
  19. Brar, B.S.; Singh, K.; Dheri, G.S.; Balwinder, K. Carbon sequestration and soil carbon pools in a rice-wheat cropping system: Effect of long-term use of inorganic fertilizers and organic manure. Soil Tillage Res. 2013, 128, 30–36. [Google Scholar] [CrossRef]
  20. Liu, G.; Wang, H.; Cheng, Y.; Zheng, B.; Lu, Z. The impact of rural out-migration on arable land use intensity: Evidence from mountain areas in Guangdong, China. Land Use Policy 2016, 59, 569–579. [Google Scholar] [CrossRef]
  21. Xie, H.; Chen, Q.; Wang, W.; He, Y. Analyzing the green efficiency of arable land use in China. Technol. Forecast. Soc. Chang. 2018, 133, 15–28. [Google Scholar] [CrossRef]
  22. Westerink, J.; Pérez-Soba, M.; van Doorn, A. Social learning and land lease to stimulate the delivery of ecosystem services in intensive arable farming. Ecosyst. Serv. 2020, 44, 101149. [Google Scholar] [CrossRef]
  23. Liu, C.; Song, C.; Ye, S.; Cheng, F.; Zhang, L.; Li, C. Estimate provincial-level effectiveness of the arable land requisition-compensation balance policy in mainland China in the last 20 years. Land Use Policy 2023, 131, 106733. [Google Scholar] [CrossRef]
  24. Wang, J.; Zhang, Z.; Liu, Y. Spatial shifts in grain production increases in China and implications for food security. Land Use Policy 2018, 74, 204–213. [Google Scholar] [CrossRef]
  25. Li, X.; Wu, K.; Yang, Q.; Hao, S.; Feng, Z.; Ma, J. Quantitative assessment of cultivated land use intensity in Heilongjiang province, China, 2001–2015. Land Use Policy 2023, 125, 106505. [Google Scholar] [CrossRef]
  26. Kuang, B.; Han, J.; Lu, X.; Zhang, X.; Fan, X. Quantitative evaluation of China’s cultivated land protection policies based on the PMC-index model. Land Use Policy 2020, 99, 105062. [Google Scholar] [CrossRef]
  27. Garnett, T.; Appleby, M.C.; Balmford, A.; Bateman, I.J.; Benton, T.G.; Bloomer, P.; Burlingame, B.; Dawkins, M.; Dolan, L.; Fraser, D.; et al. Sustainable intensification in agriculture: Premises and policies. Science 2013, 341, 33–34. [Google Scholar] [CrossRef]
  28. Areal, F.J.; Jones, P.J.; Mortimer, S.R.; Wilson, P. Measuring sustainable intensification: Combining composite indicators and efficiency analysis to account for positive externalities in cereal production. Land Use Policy 2018, 75, 314–326. [Google Scholar] [CrossRef]
  29. Xie, H.; Huang, Y.; Choi, Y.; Shi, J. Evaluating the sustainable intensification of cultivated land use based on emergy analysis. Technol. Forecast. Soc. Chang. 2021, 165, 120449. [Google Scholar] [CrossRef]
  30. Wang, G.; Liu, Y.; Li, Y.; Chen, Y. Dynamic trends and driving forces of land use intensification of cultivated land in China. J. Geogr. Sci. 2015, 25, 45–57. [Google Scholar] [CrossRef]
  31. Lyu, X.; Peng, W.; Niu, S.; Qu, Y.; Xin, Z. Evaluation of sustainable intensification of cultivated land use according to farming households’ livelihood types. Ecol. Indic. 2022, 138, 108848. [Google Scholar] [CrossRef]
  32. Niu, S.; Lyu, X.; Gu, G.; Zhou, X.; Peng, W. Sustainable intensification of cultivated land use and its influencing factors at the farming household scale: A case study of Shandong province, China. Chin. Geogr. Sci. 2021, 31, 109–125. [Google Scholar] [CrossRef]
  33. Hou, X.; Liu, J.; Zhang, D.; Zhao, M.; Xia, C. Impact of urbanization on the eco-efficiency of cultivated land utilization: A case study on the Yangtze River economic belt, China. J. Clean. Prod. 2019, 238, 117916. [Google Scholar] [CrossRef]
  34. Hou, X.; Yin, Y.; Zhou, X.; Zhao, M.; Yao, L.; Zhang, D.; Wang, X.; Xia, C. Does economic agglomeration affect the sustainable intensification of cultivated land use? Evidence from China. Ecol. Indic. 2023, 154, 110808. [Google Scholar] [CrossRef]
  35. Liu, Z.; Yang, P.; Wu, W.; You, L. Spatiotemporal changes of cropping structure in China during 1980–2011. J. Geogr. Sci. 2018, 28, 1659–1671. [Google Scholar] [CrossRef]
  36. Cheng, X.; Tao, Y.; Huang, C.; Yi, J.; Yi, D.; Wang, F.; Tao, Q.; Xi, H.; Ou, W. Unraveling the causal mechanisms for non-grain production of cultivated land: An analysis framework applied in Liyang, China. Land 2022, 11, 1888. [Google Scholar] [CrossRef]
  37. Wu, Y.; Yuan, C.; Liu, Z.; Wu, H.; Wei, X. Decoupling relationship between the non-grain production and intensification of cultivated land in China based on Tapio decoupling model. J. Clean. Prod. 2023, 424, 138800. [Google Scholar] [CrossRef]
  38. Liang, J.; Pan, S.; Chen, W.; Li, J.; Zhou, T. Cultivated land fragmentation and its influencing factors detection: A case study in Huaihe river basin, China. Int. J. Environ. Res. Public Health 2022, 19, 138. [Google Scholar] [CrossRef]
  39. Erenstein, O. Intensification or extensification? factors affecting technology use in peri-urban lowlands along an agro-ecological gradient in West Africa. Agric. Syst. 2006, 90, 132–158. [Google Scholar] [CrossRef]
  40. Rasmussen, L.V.; Coolsaet, B.; Martin, A.; Mertz, O.; Pascual, U.; Corbera, E.; Dawson, N.; Fisher, J.A.; Franks, P.; Ryan, C.M. Social-ecological Outcomes of Agricultural Intensification. Nat. Sustain. 2018, 1, 275–282. [Google Scholar] [CrossRef]
  41. Gurr, G.M.; Lu, Z.X.; Zheng, X.S.; Xu, H.X.; Zhu, P.Y.; Chen, G.H.; Yao, X.M.; Cheng, J.; Zhu, Z.R.; Catindig, J.L.; et al. Multi-country evidence that crop diversification promotes ecological intensification of agriculture. Nat. Plants 2016, 2, 16014. [Google Scholar] [CrossRef] [PubMed]
  42. Pretty, J. Intensification for redesigned and sustainable agricultural systems. Science 2018, 362, 0294. [Google Scholar] [CrossRef] [PubMed]
  43. Liang, X.; Jin, X.; Sun, R.; Han, B.; Liu, J.; Zhou, Y. A typical phenomenon of cultivated land use in China’s economically developed areas: Anti-intensification in Jiangsu Province. Land Use Policy 2021, 102, 105223. [Google Scholar] [CrossRef]
  44. Ringler, C.; Bhaduri, A.; Lawford, R. The nexus across water, energy, land and food (WELF): Potential for improved resource use efficiency? Curr. Opin. Environ. Sustain. 2013, 5, 617–624. [Google Scholar] [CrossRef]
  45. Chen, A.; Hao, Z.; Wang, R.; Zhao, H.; Hao, J.; Xu, R.; Duan, H. Cultivated land sustainable use evaluation from the perspective of the water–Land–Energy–Food nexus: A case study of the major grain-producing regions in Quzhou, China. Agronomy 2023, 13, 2362. [Google Scholar] [CrossRef]
  46. Liu, J.; Xu, W.; Zhou, Y. Influence mechanism of cultivated land fragmentation on sustainable intensification and its governance framework. Acta Geogr. Sin. 2022, 77, 2703–2720. [Google Scholar] [CrossRef]
  47. Petersen, B.; Snapp, S. What is sustainable intensification? views from experts. Land Use Policy 2015, 46, 1–10. [Google Scholar] [CrossRef]
  48. Lai, Z.; Chen, M.; Liu, T. Changes in and prospects for cultivated land use since the reform and opening up in China. Land Use Policy 2020, 97, 104781. [Google Scholar] [CrossRef]
  49. Gao, Y.; Li, H.; Song, Y. Interaction relationship between urbanization and land use multifunctionality: Evidence from Han River basin, China. Land 2021, 10, 938. [Google Scholar] [CrossRef]
  50. Dadashpoor, H.; Azizi, P.; Moghadasi, M. Land use change, urbanization, and change in landscape pattern in a Metropolitan Area. Sci. Total Environ. 2019, 655, 707–719. [Google Scholar] [CrossRef]
  51. Wang, L.; Zhang, S.; Xiong, Q.; Liu, Y.; Liu, Y.; Liu, Y. Spatiotemporal dynamics of cropland expansion and its driving factors in the Yangtze River economic belt: A nuanced analysis at the county scale. Land Use Policy 2022, 119, 106168. [Google Scholar] [CrossRef]
  52. Geng, B.; Zheng, X.; Fu, M. Scenario analysis of sustainable intensive land use based on SD Model. Sustain. Cities Soc. 2017, 29, 193–202. [Google Scholar] [CrossRef]
  53. Dagum, C. A new approach to the decomposition of the Gini income inequality ratio. Empir. Econ. 1997, 22, 515–531. [Google Scholar] [CrossRef]
  54. Mishra, S.P.; Sarkar, U.; Taraphder, S.; Datta, S.; Swain, D.P.; Saikhom, R.; Panda, S.; Laishram, M. Multivariate statistical data analysis-principal component analysis (PCA). Int. J. Livest. Res. 2017, 7, 60–78. [Google Scholar] [CrossRef]
  55. Xu, D.; Zhang, K.; Cao, L.; Guan, X.; Zhang, H. Driving forces and prediction of urban land use change based on the Geodetector and CA-Markov model: A case study of Zhengzhou, China. Int. J. Digit. Earth 2022, 15, 2246–2267. [Google Scholar] [CrossRef]
  56. Moran, P.A.P. Notes on continuous stochastic phenomena. Biometrika 1950, 37, 17–23. [Google Scholar] [CrossRef] [PubMed]
  57. Charlton, M.E.; Brunsdon, C.F.; Fotheringham, A.S. Geographically weighted regression-modelling spatial non-stationarity. J. R. Stat. Soc. 1998, 47, 431–443. [Google Scholar] [CrossRef]
  58. Punzo, G.; Castellano, R.; Bruno, E. Using geographically weighted regressions to explore spatial heterogeneity of land use influencing factors in Campania (Southern Italy). Land Use Policy 2022, 112, 105853. [Google Scholar] [CrossRef]
  59. Alipbeki, O.; Alipbekova, C.; Sterenharz, A.; Toleubekova, Z.; Aliyev, M.; Mineyev, N.; Amangaliyev, K. A Spatiotemporal assessment of land use and land cover changes in Peri-Urban areas: A case study of Arshaly District, Kazakhstan. Sustainability 2020, 12, 1556. [Google Scholar] [CrossRef]
  60. Guo, S.; Wang, Y.; Wang, Y.; Wang, M.; He, P.; Feng, L. Inequality and collaboration in north China urban agglomeration: Evidence from embodied cultivated land in Jing-Jin-Ji’s interregional trade. J. Environ. Manag. 2020, 275, 111050. [Google Scholar] [CrossRef]
  61. Lu, X.; Zhang, Y.; Li, J.; Duan, K. Measuring the urban land use efficiency of three urban agglomerations in China under carbon emissions. Environ. Sci. Pollut. Res. 2022, 29, 36443–36474. [Google Scholar] [CrossRef] [PubMed]
  62. Dong, Y.; Zhou, Y.; Zhang, L.; Gu, Y.; Sutrisno, D. Intensive land-use is associated with development status in port cities of Southeast Asia. Environ. Res. Lett. 2023, 18, 044006. [Google Scholar] [CrossRef]
  63. Xiong, Y.; Chen, Y.; Peng, F.; Li, J.; Yan, X. Analog simulation of urban construction land supply and demand in Chang-Zhu-Tan Urban agglomeration based on land intensive use. J. Geogr. Sci. 2019, 29, 1346–1362. [Google Scholar] [CrossRef]
  64. Li, Q.; Wang, L.; Zhu, Y.; Mu, B.; Ahmad, N. Fostering land use sustainability through construction land reduction in China: An analysis of key success factors using fuzzy-AHP and DEMATEL. Environ. Sci. Pollut. Res. 2022, 29, 18755–18777. [Google Scholar] [CrossRef] [PubMed]
  65. Liu, X.; Zhao, C.; Song, W. Review of the evolution of cultivated land protection policies in the period following China’s reform and liberalization. Land Use Policy 2017, 67, 660–669. [Google Scholar] [CrossRef]
  66. Niu, S.; Lyu, X.; Gu, G. What is the operation logic of cultivated land protection policies in China? A grounded theory analysis. Sustainability 2022, 14, 8887. [Google Scholar] [CrossRef]
  67. Morales, C.; Pauw, K. Synergies and trade-offs between agricultural export promotion and food security: Evidence from African economies. World Dev. 2023, 172, 106368. [Google Scholar] [CrossRef]
  68. Guo, A.; Yue, W.; Yang, J.; Xue, B.; Xiao, W.; Li, M.; He, T.; Zhang, M.; Jin, X.; Zhou, Q. Cropland abandonment in China: Patterns, drivers, and implications for food security. J. Clean. Prod. 2023, 418, 138154. [Google Scholar] [CrossRef]
  69. Zhang, D.; Yang, W.; Kang, D.; Zhang, H. Spatial-temporal characteristics and policy implication for non-grain production of cultivated land in Guanzhong region. Land Use Policy 2023, 125, 106466. [Google Scholar] [CrossRef]
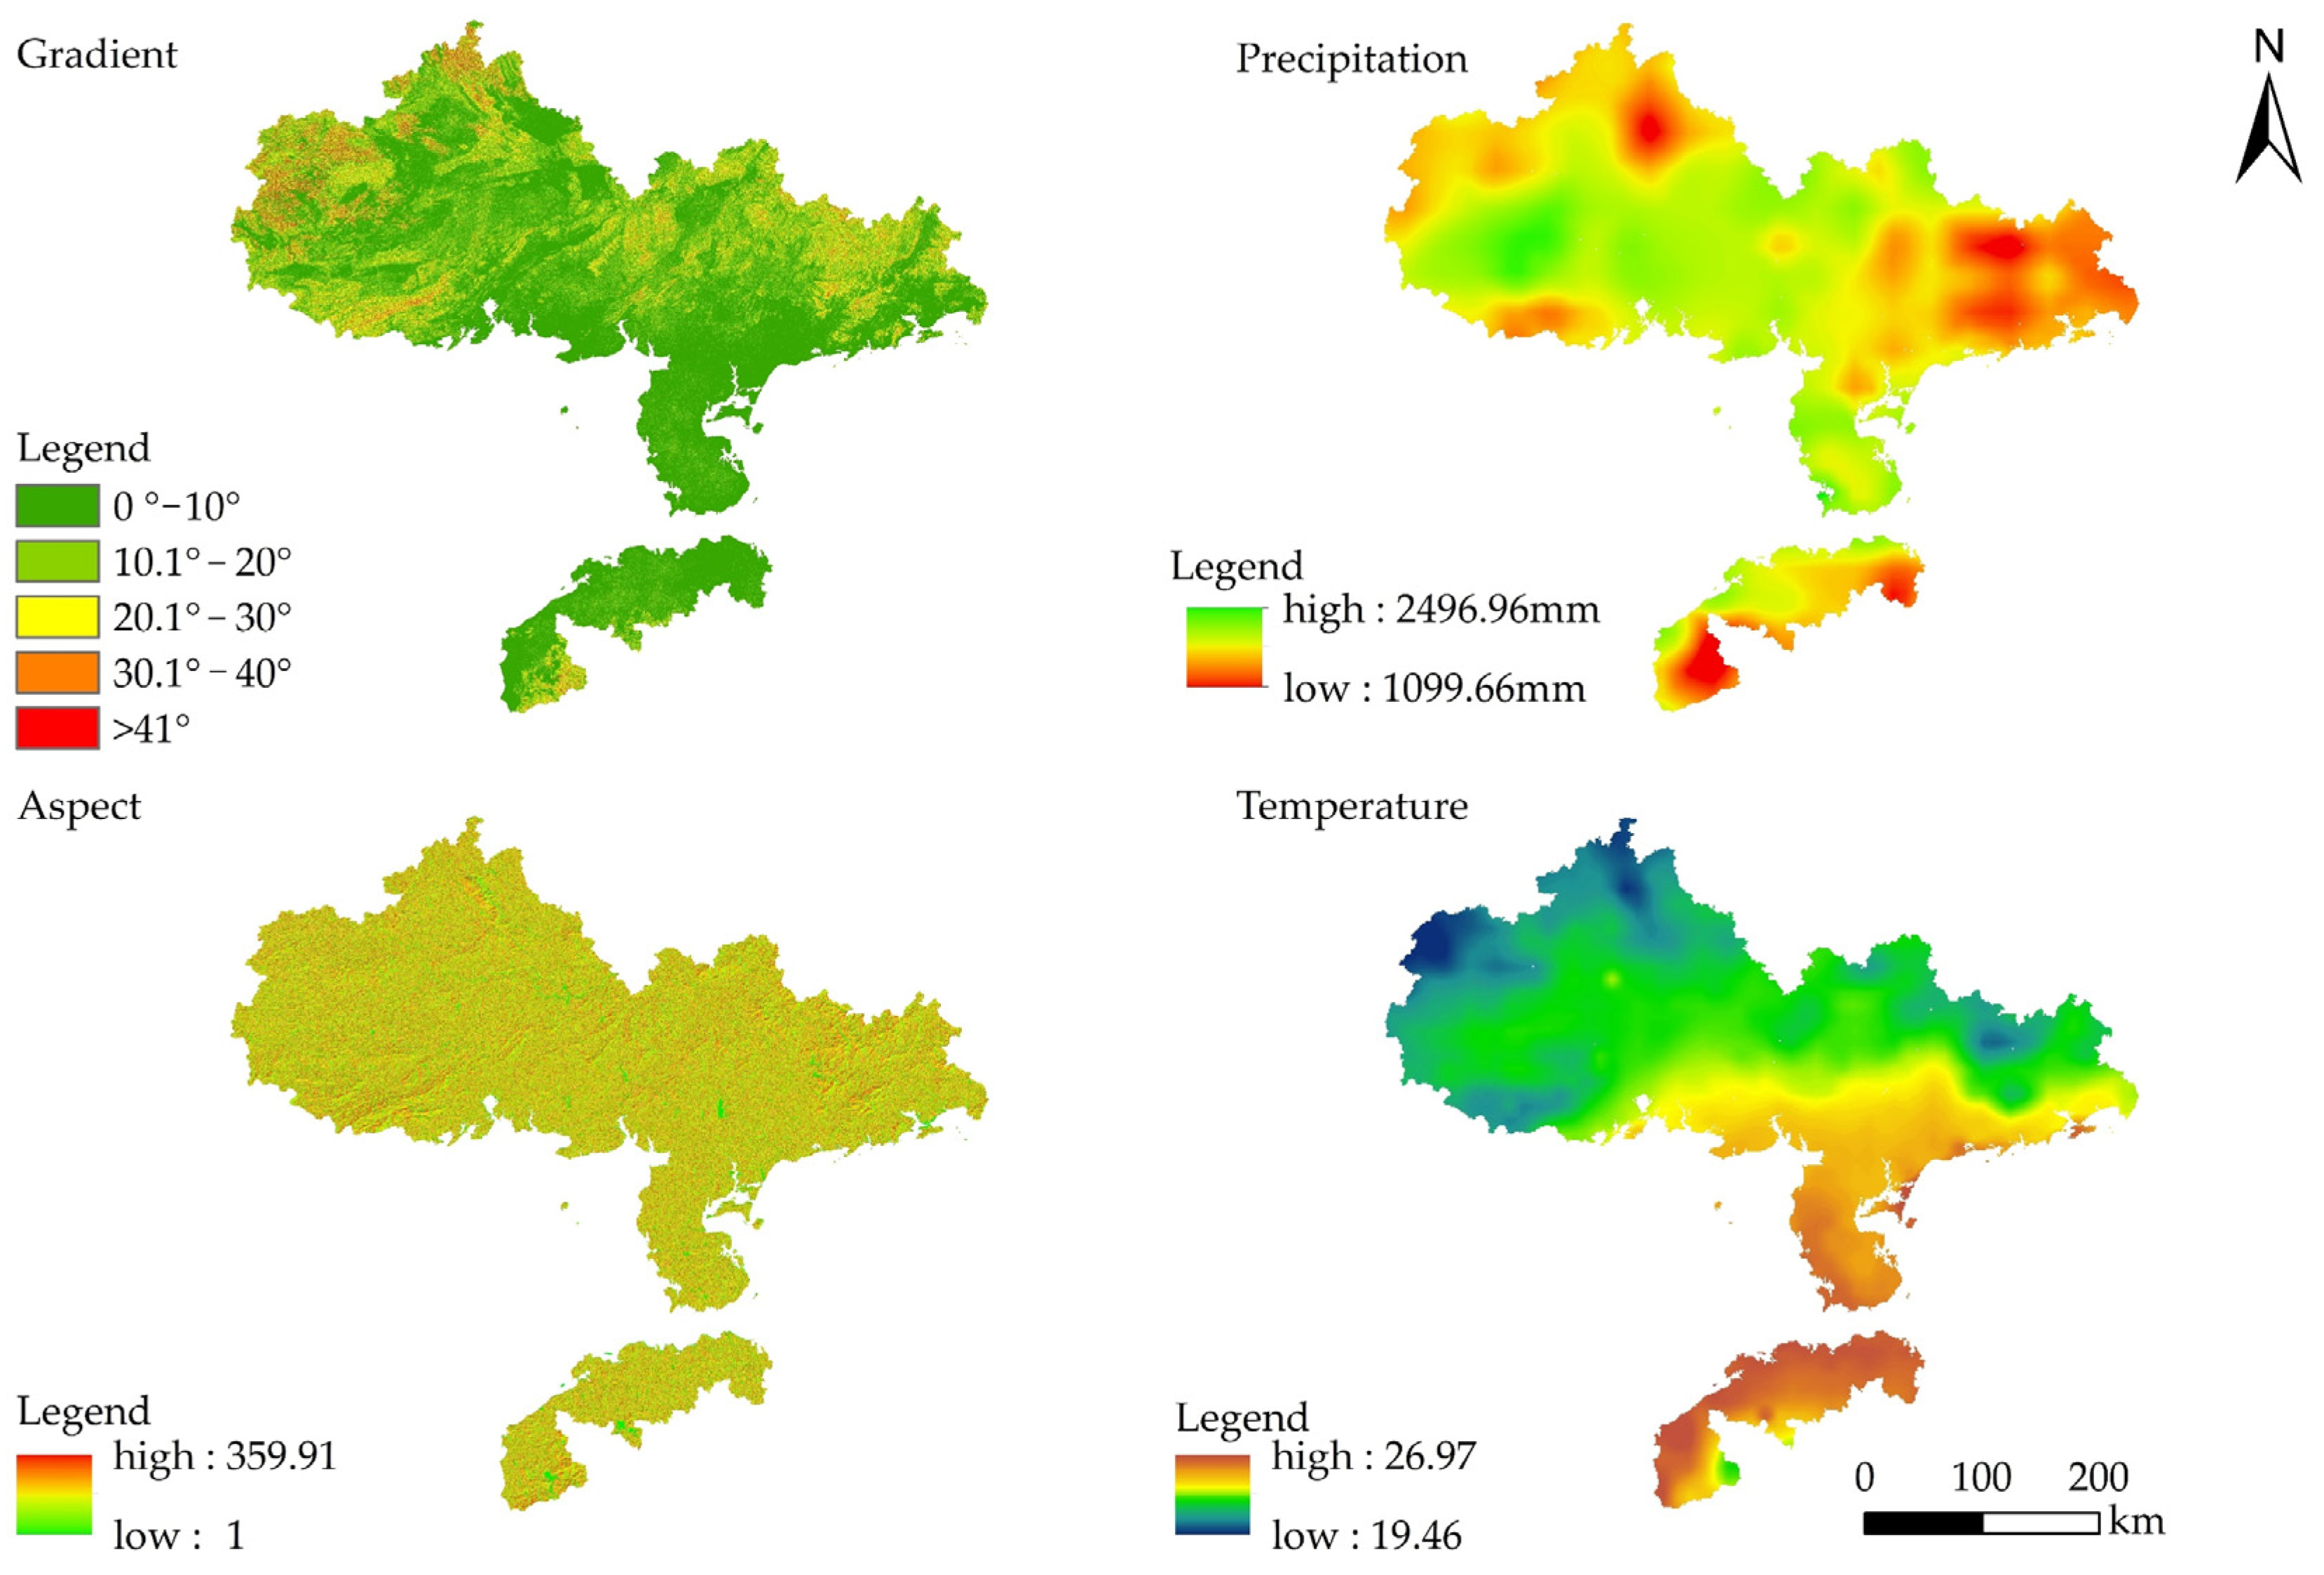
Figure 1. The natural conditions of the study area.
Sustainability 16 04565 g001
Figure 2. Spatial distribution of CLIU.
Sustainability 16 04565 g002
Figure 3. Spatial distribution of influence factors of CLIU.
Sustainability 16 04565 g003
Figure 4. The coefficient results of two-factor interaction detection.
Sustainability 16 04565 g004
Figure 5. Spatial pattern of the regression coefficients of the factors influencing CLIU incidence.
Sustainability 16 04565 g005
Figure 6. Functional relationship between urban agglomeration and CLIU.
Sustainability 16 04565 g006
Figure 7. Mechanism of driving factors of CLIU.
Sustainability 16 04565 g007
Figure 8. (a) Rice purchase prices for the period 2017–2021. (b) CPI for the period 2017–2021.
Sustainability 16 04565 g008
Figure 9. (a) Fertilizer application for the period 2017–2021; (b) Cultivated land size for the period 2017–2021.
Sustainability 16 04565 g009
Figure 10. A layout for improving CLIU in the Beibu Gulf urban agglomeration.
Sustainability 16 04565 g010
Table 1. Evaluation system of CLIU.
CriterionIndicatorWeight
Investment intensityAgricultural machinery power (kW/hm2)0.079
Proportion of effective irrigation area (%)0.076
Labor input index (person/104 hm2)0.07
Number of agricultural employees per capita (person/hm2)0.06
Utilization levelMultiple cropping index0.08
Coefficient of cultivated land0.07
Cropland balance index0.056
Output benefitsPer capita grain (kg/person)0.083
Agricultural supply index (104 CNY/person)0.073
Average output value of labor (104 CNY/person)0.071
The primary industry output value per square meter (CNY/m2)0.055
Continuous conditionLabor force index0.084
Per capita cropland area (hm2/person)0.078
Population density (person/km2)0.065
Table 2. Driver system of CLIU.
Target Criterion Factors Description and Formulation
Driving Factors for CLIUNatural factorsElevation (m)Digital elevation data acquisition
Slope (°)Digital elevation data acquisition
Average annual precipitation (mm)ERA5 meteorological data acquisition
Average annual temperature (°C)ERA5 meteorological data acquisition
Humanistic factorsLabor force indexNumber of employees in agriculture, forestry, animal husbandry, fishery/total population
Food per capita (kg/person)Grain yield/total population
Multiple cropping indexTotal sown area of crops/cultivated land area
Agricultural machinery power (kw/hm2)Total power of agricultural machinery
Average fixed assets investment (104 CNY/km2)Fixed assets investment/administrative area
Number of industrial enterprises on average scale (units/km2)Number of large-scale industrial enterprises/administrative area
Land average financial expenditure (104 CNY/km2)Financial expenditure/administrative area
Land average labor force (person/km2)Labor force/administrative area
Agricultural land per capita (hm2/person)Agricultural land area/total population
Construction land per capita (m2/person)Construction land area/total population
Road area proportion (%)Rural road area/administrative area
Per capita dwelling area (m2/person)Statistical data
GDP per km2 (CNY/km2)GDP/Administrative area
Local average fiscal revenue (CNY/m2)Fiscal revenue/administrative area
Retail sales of consumer goods per land (CNY/km2)Retail sales of social consumer goods/administrative area
Average import and export volume (104 CNY/km2)Import and export trade volume/administrative area
Number of medical and health beds per land (sheet/km2)Number of medical and health beds/administrative area
Average number of students per land (person/km2)Number of primary and middle school students/administrative area
College degree or above proportion (%)Population with a college degree or above/total population
Urban population proportion (%)Urban population/total population
Land average of loan amount (104 CNY/km2)Loan amount/administrative area
Forest and grass coverage rate (%)Forest and grassland area/administrative area
Scale of natural wetland protection (hm2)Statistical data
Straight-line distance from the nearest port (km)Baidu map distance measurement
Table 3. Types of factor interactions.
IllustrationExpressionTypes
Sustainability 16 04565 i001 q ( x 1 x 2 ) < min q x 1 , q ( x 2 ) Nonlinear attenuation
Sustainability 16 04565 i002 min q x 1 , q ( x 2 ) < q ( x 1 x 2 ) < max q x 1 , q ( x 2 ) Single-factor nonlinear attenuation
Sustainability 16 04565 i003 q ( x 1 x 2 ) > max q x 1 , q ( x 2 ) Double factor enhancement
Sustainability 16 04565 i004 q x 1 x 2 = q x 1 + q ( x 2 ) Mutual independence
Sustainability 16 04565 i005 q x 1 x 2 > q x 1 + q ( x 2 ) Nonlinear enhancement
Sustainability 16 04565 i006 represents min q x 1 , q ( x 2 ) , Sustainability 16 04565 i007 represents max q x 1 , q ( x 2 ) , Sustainability 16 04565 i008 represents q x 1 + q ( x 2 ) , Sustainability 16 04565 i009 represents q ( x 1 x 2 ) .
Table 4. Principal component matrix of factors.
DriversFive Extracted Principal Component Representatives
X1X2X3X4X5
Average fixed assets investment0.798−0.002−0.050.2970.068
Number of industrial enterprises on average scale0.6370.0380.186−0.1250.44
Land average fiscal expenditure0.9240.1550.185−0.1080.095
Land average labor force0.960.140.124−0.0740.094
Per capita agricultural land−0.5420.5490.1070.316−0.192
Per capita construction land−0.53−0.0180.3970.658−0.098
Road area proportion0.443−0.568−0.0840.420.451
Per capita dwelling area−0.510.3520.3090.1470.463
GDP per km20.9140.1620.3110.0080.015
Local average fiscal revenue0.831−0.071−0.2870.119−0.031
Retail sales of consumer goods per land0.9120.2770.1480.026−0.157
Average import and export trade volume0.6940.2930.1970.245−0.175
Number of medical and health beds per land0.9170.2320.13−0.0830.038
Average number of students per land0.8580.270.259−0.113−0.125
College degree or above proportion0.653−0.152−0.5140.316−0.07
Urban population proportion0.747−0.108−0.4960.079−0.078
Land average of loan amount0.8870.227−0.0960.131−0.181
Forest and grass coverage rate−0.5640.642−0.2660.004−0.095
Scale of natural wetland protection−0.061−0.6560.4580.097−0.31
Straight-line distance from the nearest port−0.4080.663−0.2550.1870.222
Accumulated contribution rate 52.62%65.0372.7778.3483.11
Table 5. The main results of interaction detection.
C = A ∩ BA + B/Max (A, B)ResultInteraction Type
Labor force index ∩ multiple cropping index = 0.859Max (labor force index, multiple cropping index) = 0.570C > max (A, B)Dual factor enhancement
Labor force index ∩ agricultural machinery power = 0.837Labor force index + agricultural machinery power = 0.738C > A + BNonlinear enhancement
Labor force index ∩ industrial scale = 0.841Labor force index + industrial scale = 0.649C > A + BNonlinear enhancement
Multiple cropping index ∩ agricultural machinery power = 0.808Max (multiple cropping index, agricultural machinery power) = 0.570C > max (A, B)Dual factor enhancement
Multiple cropping index ∩ construction land intensity = 0.842Max (multiple cropping index, construction land intensity) = 0.570C > max (A, B)Dual factor enhancement
Multiple cropping index ∩ industrial scale = 0.837Multiple cropping index + industrial scale = 0.731C > A + BNonlinear enhancement
Multiple cropping index ∩ temperature = 0.765Max (multiple cropping index, temperature) = 0.570C > max (A, B)Dual factor enhancement
Table 6. Regression results of the GWR model.
VariantAverageStandard DeviationMinimum ValueMedianMaximum Values
Labor force index0.209 0.002 0.206 0.209 0.212
Food per capita0.117 0.000 0.117 0.117 0.117
Multiple cropping index0.211 0.001 0.210 0.211 0.213
Agricultural machinery power0.110 0.003 0.104 0.109 0.116
Land-related labor and financial input intensity0.009 0.001 0.006 0.009 0.010
Port trade convenience−0.003 0.000 −0.004 −0.003 −0.003
Population urbanization level−0.039 0.002 −0.041 −0.039 −0.036
Intensification of construction land0.072 0.001 0.068 0.071 0.074
Industrial scale−0.023 0.000 −0.025 −0.023 −0.023
Elevation0.083 0.003 0.078 0.083 0.089
Slope−0.100 0.002 −0.105 −0.099 −0.096
Precipitation−0.087 0.001 −0.089 −0.087 −0.084
Temperature0.332 0.002 0.328 0.332 0.337
Disclaimer/Publisher’s Note: The statements, opinions and data contained in all publications are solely those of the individual author(s) and contributor(s) and not of MDPI and/or the editor(s). MDPI and/or the editor(s) disclaim responsibility for any injury to people or property resulting from any ideas, methods, instructions or products referred to in the content.