Article

Assessing the Influence of Planting Dates on Sustainable Maize Production under Drought Stress Conditions

Institute of Grain Crops, Xinjiang Academy of Agricultural Sciences, Urumqi 830091, China
*
Author to whom correspondence should be addressed.
Sustainability 2024, 16(11), 4571; https://doi.org/10.3390/su16114571
Submission received: 22 March 2024 / Revised: 30 April 2024 / Accepted: 13 May 2024 / Published: 28 May 2024
(This article belongs to the Section Sustainable Agriculture)

Abstract

:
Water is one of the most precious resources and is essential to agricultural output; the biggest user of water is the agricultural sector. Several societal sectors are impacted by the problem of climate change, including agriculture, water resources, and irrigation water demand. A key element in determining sustainable crop production potential is choosing the right cultivars at the right time of year to plant. The dates on which maize is sown are greatly impacted by high summer temperatures and low spring temperatures. Water stress and the timing of sowing can have a significant impact on maize crop yield and water use efficiency. As a result, figuring out the ideal irrigation volume and sowing dates depending on local conditions is essential. A split plot layout was used to create a randomized complete block design for an experiment with five sowing dates (A, B, C, D, and E) and six hybrids (KWS3376, Xinyu 65, KWS9384, Huamei No. 1, Xinyu 102, and Heyu 187). All sowing dates and hybrids had a significant impact on the yield and yield-contributing features (leaf length, ear diameter, grain number per spike, grain breadth, hundred-grain weight, etc.) of maize crops according to the data analysis. A higher grain yield with yield features, such as ear length, number of grains per ear, and hundred-grain weight, was obtained with early-season sowing. Delayed seeding resulted in a lower crop yield. The seasonally delayed seeding of maize reduces yield and yield characteristics. Xinyu 65 produced the highest yield and yield component values of any hybrid. For improved yield and yield traits in the examined area, the study recommended planting maize hybrid Xinyu 65 early in the growing season.

1. Introduction

Unfavorable weather patterns and a rise in the frequency of extreme weather events have had a major influence on agricultural output in recent decades. Due to these circumstances, agricultural productivity and quality have significantly decreased, which has decreased overall output [1,2,3]. The ongoing global climate change has resulted in the simultaneous occurrence of various abiotic stresses affecting crop growth. Among these, the combination of heat stress and drought stress has become particularly prevalent [4,5]. The escalating effects of climate change are evident in the rising frequency and severity of droughts and heat waves, posing substantial risks to global agricultural production and endangering food security on a global scale [6]. Notable instances include the 2003 drought and heat events in Europe, which caused a 30% reduction in agricultural production [2]. Similarly, the 2010 heat events in western Russia led to a significant decline in grain production, with the wheat belt yielding less than half of the previous year’s output [7]. In 2012, heat and drought stress in the Great Plains of the United States resulted in a 20% decrease in maize yield [3]. More recently, the Yangtze River basin in China saw its worst high-temperature and drought episode since 1961 during the summer of 2022. More than 40,000 km2 of crops were affected by this event, seriously harming crop productivity [8,9]. The shift in the global climate from rare simultaneous occurrences of heat and drought to widespread exposure of large crop areas to both stresses annually is a concerning trend [10]. When heat waves coincide with flash or prolonged droughts, the combined impact has devastating consequences on agriculture and the broader social economy [11].
Droughts and heat events often stem from similar weather circulation anomalies, compounded by interactions with soil moisture and atmospheric factors [12]. The recurrent occurrence of high temperatures disrupts precipitation patterns, hastens soil water evaporation, exacerbates drought severity, and heightens the overall drought risk [13,14,15]. Simultaneous exposure to drought and heat stress leads to a reduction in crop yields [12,16]. The impact of combined heat and drought (CHD) events may surpass the cumulative effects of individual events [17,18]. Managing the challenges posed by CHD events involves a complex interplay of factors. On one hand, leaf temperature is regulated to mitigate damage under elevated temperatures through increased transpiration, albeit at the cost of accelerating water deficit and worsening drought conditions [3]. On the other hand, diminished water availability restricts crops’ ability to regulate temperature through evaporative cooling, rendering them more susceptible to damage from high temperatures [16]. To withstand the combined effects of high temperatures and drought, crops must strike a balance in stomatal responses to prevent both water loss and overheating [19]. Consequently, the impact of heat and drought stress on crops is more intricate than that of either stressor alone. As the frequency of extreme weather events, coupled with high temperatures and drought, continues to rise, novel scientific inquiries emerge. Addressing these challenges involves understanding the intricate ways in which the combination of heat and drought stresses affects crop growth, quantifying its impact on crops, and enhancing crop adaptation to these evolving extreme climate conditions.
Maize (Zea mays L.) holds the distinction of being the third most crucial grain globally, with a planting area and total yield second only to wheat and rice, owing to its remarkable diversity and versatility. Cultivated across a broad spectrum of agricultural conditions [20], maize faces challenges when subjected to drought, which can constrain its photosynthesis and stomatal movement, thereby impacting growth and physiological metabolism [21]. Prolonged exposure to temperatures exceeding 35 °C is detrimental to maize growth, with temperatures surpassing 40 °C, particularly during flowering and filling stages, significantly reducing maize yield [22]. Concurrent drought and high temperatures result in a rapid decline in the growth and functionality of maize plants, exacerbating the impact on crop morphology and physiological characteristics [23]. Research indicates that the loss of grain yield due to drought and heat waves in Europe is twice that of non-grain crops [24]. In the face of an extraordinary drought, maize yield in the United States faces a substantial 78.1% probability of loss risk, particularly in the central and southeastern regions [25]. In recent years, China, especially in regions like Xinjiang, has faced challenges due to combined heat and drought (CHD) conditions, impacting agricultural production. Xinjiang, known for its vast agricultural lands, has experienced prolonged periods of high temperatures and limited rainfall, leading to significant stress on crops. For example, in Xinjiang, the cotton industry has been severely affected by CHD conditions, resulting in decreased yields and quality. Maize, another important crop in the region, has also suffered from reduced growth and productivity due to the combined effects of heat and drought. The fruit industry in Xinjiang, particularly the production of grapes and melons, has faced challenges due to CHD conditions, leading to lower fruit quality and yields. Additionally, livestock farming in Xinjiang has been impacted, as the availability of water and forage for animals has been limited, affecting the health and productivity of livestock. Combined heat and drought (CHD) stress has led to an 18.75% reduction in maize yield in Northeast China, with the combined stresses proving more detrimental than either drought or heat stress in isolation [26]. While numerous studies have delved into CHD extreme weather events and their impact on crop yield, few have comprehensively assessed the effects of these combined stresses on the entire growth process of maize. Furthermore, the influence of these combined stresses on maize plants at different developmental stages remains unclear. Understanding the comprehensive effects of combined stresses on maize growth will contribute to enhancing the resilience of the maize production system in the face of extreme climate conditions spurred by global warming.

2. Materials and Methods

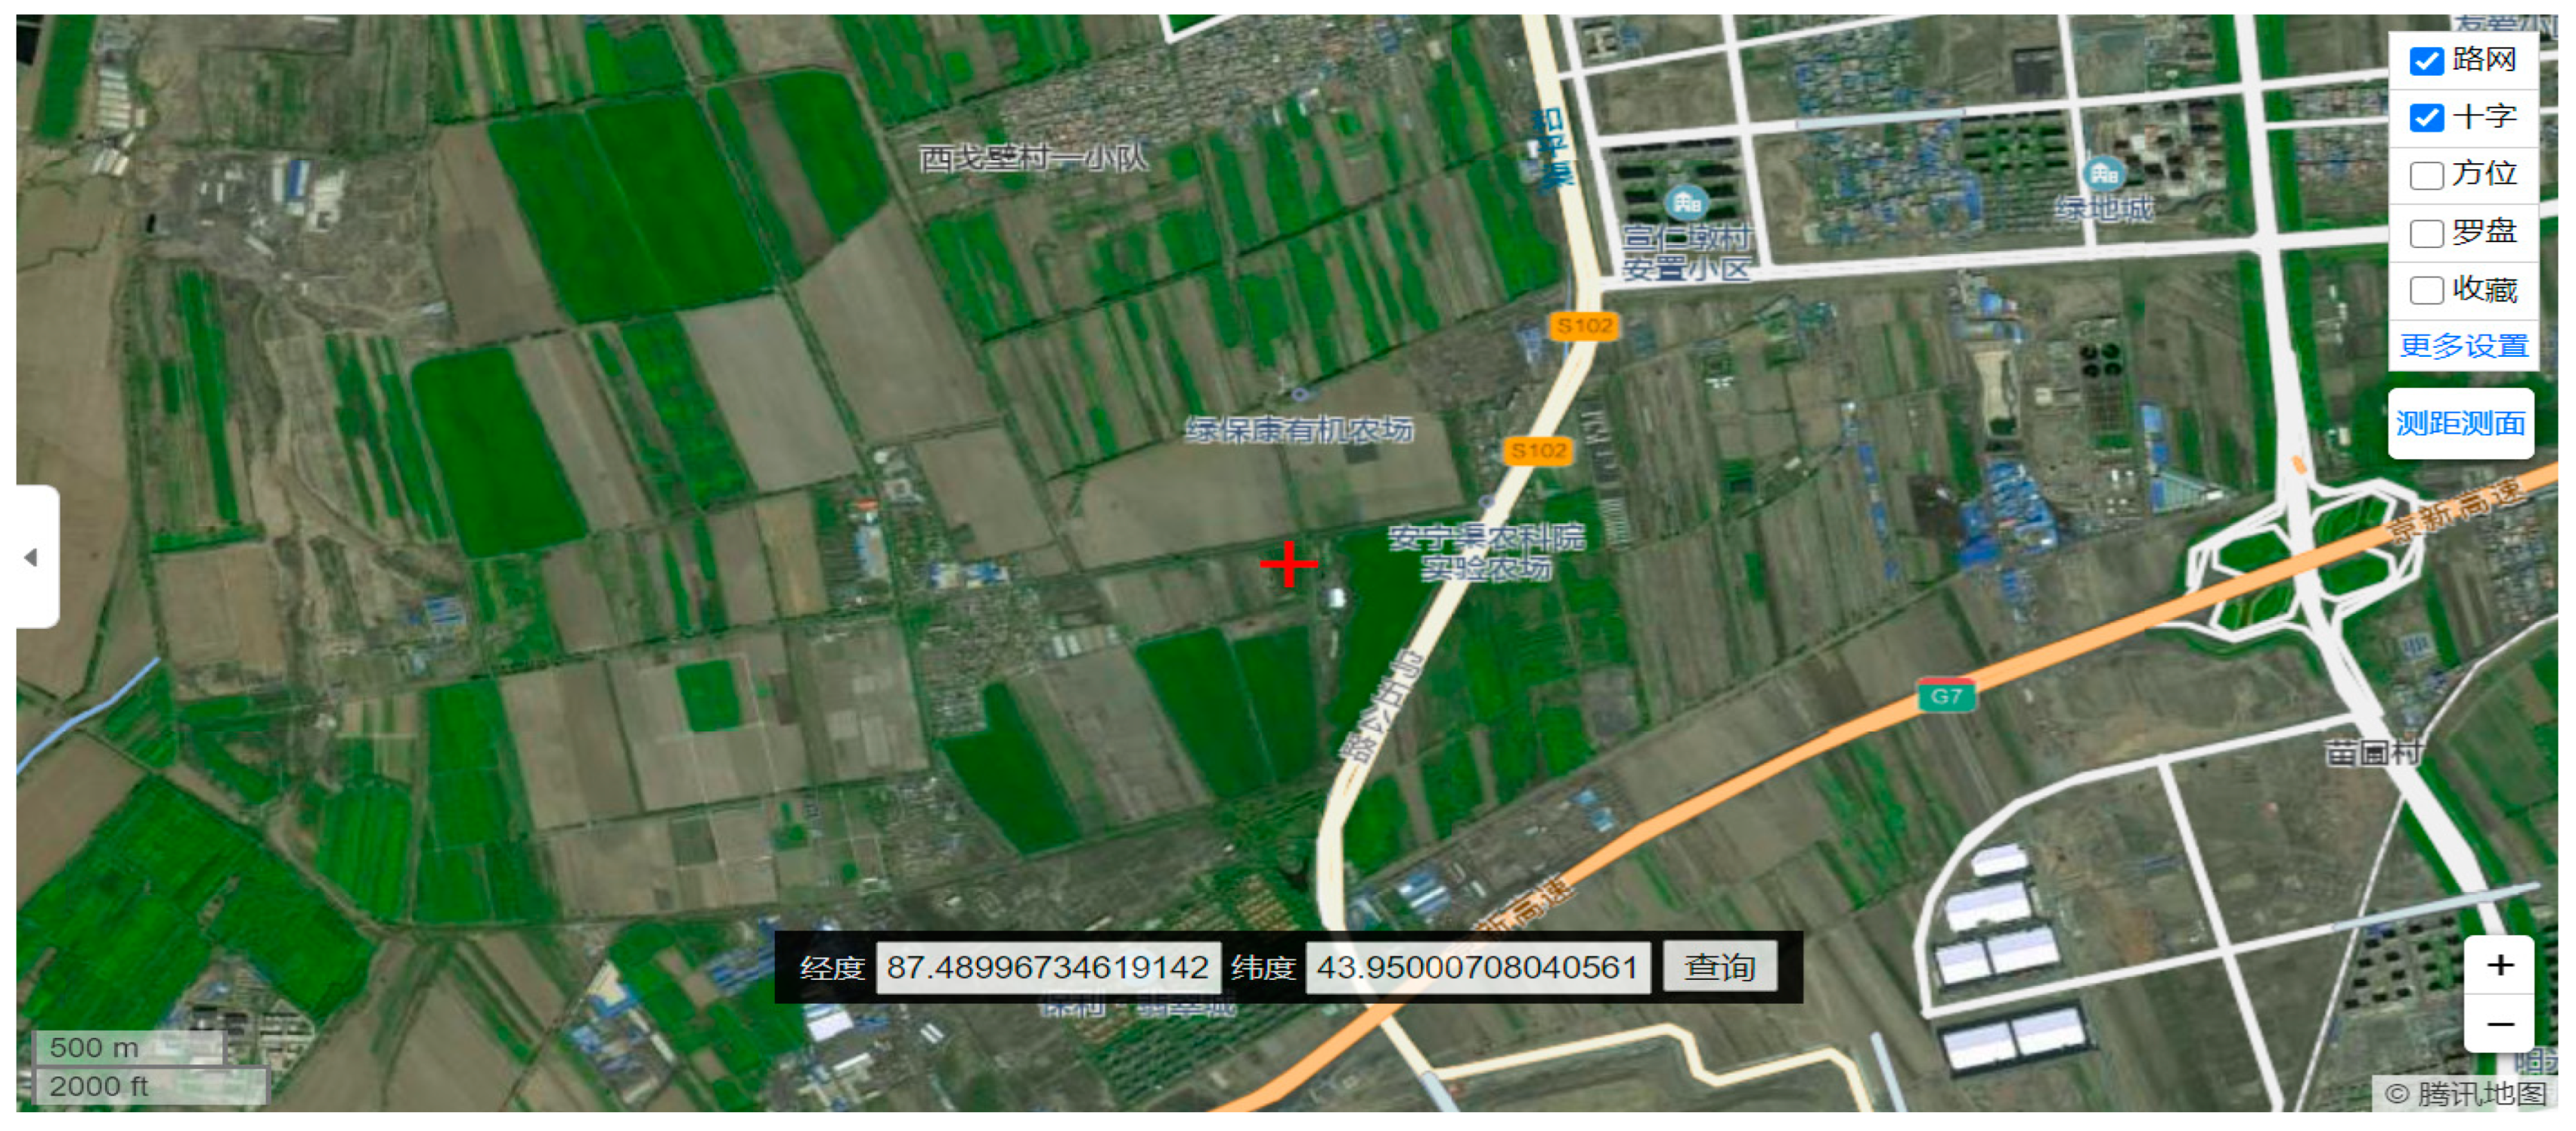
2.1. Experimental Design

The test was planted in a randomized complete block design with three replicate blocks at the Anningqu Urumqi (87.49° E, 43.95° N, height above sea level 590 m), Xinjiang Province, China, in 2021 and 2022 in test sites (Figure 1) and with medium soil fertility. During the reproductive period of maize, the average daily temperature was 10–35 degrees, rainfall was 50–70 mm, evaporation was 1500–1700 mm, and the atmosphere and soil are both dry. The test materials were five corn varieties: KWS3376, Xinyu 65, KWS9384, Huamei No. 1, Xinyu 102, and Heyu 187. A random block experimental design was adopted, with 6 rows of each material planted in the test, repeated 3 times, with a row length of 3 m, a row spacing pf 0. 6 m, and plant spacing of 0. 25 m. We set 5 temperatures and 6 gradient irrigation volumes for a total of 30 treatments. The amount of irrigation water is calculated based on the water requirement of 3.2 to 4.0 kg of water per kilogram of corn kernels produced. The rated corn hybrid yield is 5000 kg/ha, and the water requirement during the entire growth period is 4800 to 6000 cubic meters per ha. This study determined the whole growth period of planned water supply (5400 m3/ha, including rainfall), and the eight irrigation times are at the sowing stage, jointing stage, tasseling stage, flowering stage, early filling stage, middle filling stage, late filling stage, and final filling stage of corn. After the seeds are sown, we uniformly irrigate 45 m3/mu to ensure soil water supply during the seedling stage; for the next 7 irrigations, the amount of water used each time is 0%, 20%, 40%, 60%, and 80% of the 675 m3/ha in the entire water area at a 100% irrigation ratio; respectively, 0, 135, 270, 405, 540, and 675 m3/ha. The actual amount of irrigation each time will be converted according to rainfall and reduced accordingly. The equivalent irrigation amount per mu per 1 mm of rainfall is 10 m3/ha. The irrigation design of the 30 treatments is shown in Table 1. By setting different sowing times, the growth and development of corn can be in different temperature environments in the same year, and the flowering stages of different sowing date treatments can be in different atmospheric temperature stress environments. Five different sowing dates were tested; they are the following: A = 21 April sowing date; B = 26 April sowing date; C = 6 May sowing date; D = 16 May sowing date; and E = 26 May sowing date (Table 2).

2.2. Measurement Indicators and Methods

Growth process investigation: According to the corn growth period classification standard, the sowing stage, emergence stage, jointing stage, trumpet stage, powdering stage, silking stage, filling stage, and maturity stage are recorded.
Soil moisture content measurement: The soil moisture content at 10 cm, 20 cm, 30 cm, 40 cm, 60 cm, and 100 cm underground was measured in the field before the sowing and after harvesting of the crop, and the dynamic soil moisture content of different treatments was obtained (Table 3).
Yield measurement: We harvested 10 consecutive plants in the middle of each treatment at maturity. Yield factors such as ear length, ear width, number of kernels per ear, and 100-grain weight were measured; grain yield and grain moisture content were measured and converted into a single plant yield of 14% standard moisture.

2.3. Statistical Analysis

In this study, the recorded data were analyzed statistically using STATIX 9.1 software. This software is commonly used for statistical analysis in research and provides tools with which to analyze data with various statistical tests and methods. The phrase “at a 5% probability level” refers to the significance level chosen for the statistical analysis. In this case, a significance level of 5% indicates that the results are considered statistically significant if the probability of obtaining those results by chance alone is less than 5%. This significance level is commonly used in many scientific studies to determine the validity of the results. Using STATIX 9.1 software at a 5% probability level means that the statistical analysis was conducted with this significance level in mind, and any conclusions drawn from the analysis are based on this level of significance.

3. Results

3.1. Days to Tasseling (DTT), Days to Anthesis (DTA), and Days to Silking (DTS)

Recorded data of DTT, DTA, and DTS were significantly affected on all varieties of corn under different irrigation treatments with different sowing dates for both years (2021–2022) (Table 4). The highest values of DTT and DTA were noted where irrigation treatments were applied at 0% in 2021 and 20% in 2022 on sowing date A in the Xinyu 65, while the lowest values of DTT were observed on sowing date D in 2021, where 60% and 100% irrigation treatments were applied for Xinyu 102, but the low value of DTT is noted in 2022 on sowing date A, where 0% irrigation treatments were applied in all corn varieties except KWS9384 (Figure 2). The lowest value of DTA was observed for Heyu 187 on sowing date D in 2021, where 0% irrigation treatment was applied (Figure 3). In 2022, Xinyu 65, Huame No. 1, and Heyu 187 showed non-significant results, having 0% values of DTA on sowing date A in 0% irrigation treatment. The highest value of DTS was noted for Xinyu 65 in 2021, where irrigation treatments were applied at 20% on sowing date A, and in 2022, the highest DTS was observed for Xinyu 65 on sowing date B, with 20% irrigation treatment. The lowest value was observed for 0% irrigation treatment on sowing date A in 2021 and 2022 (Figure 4).

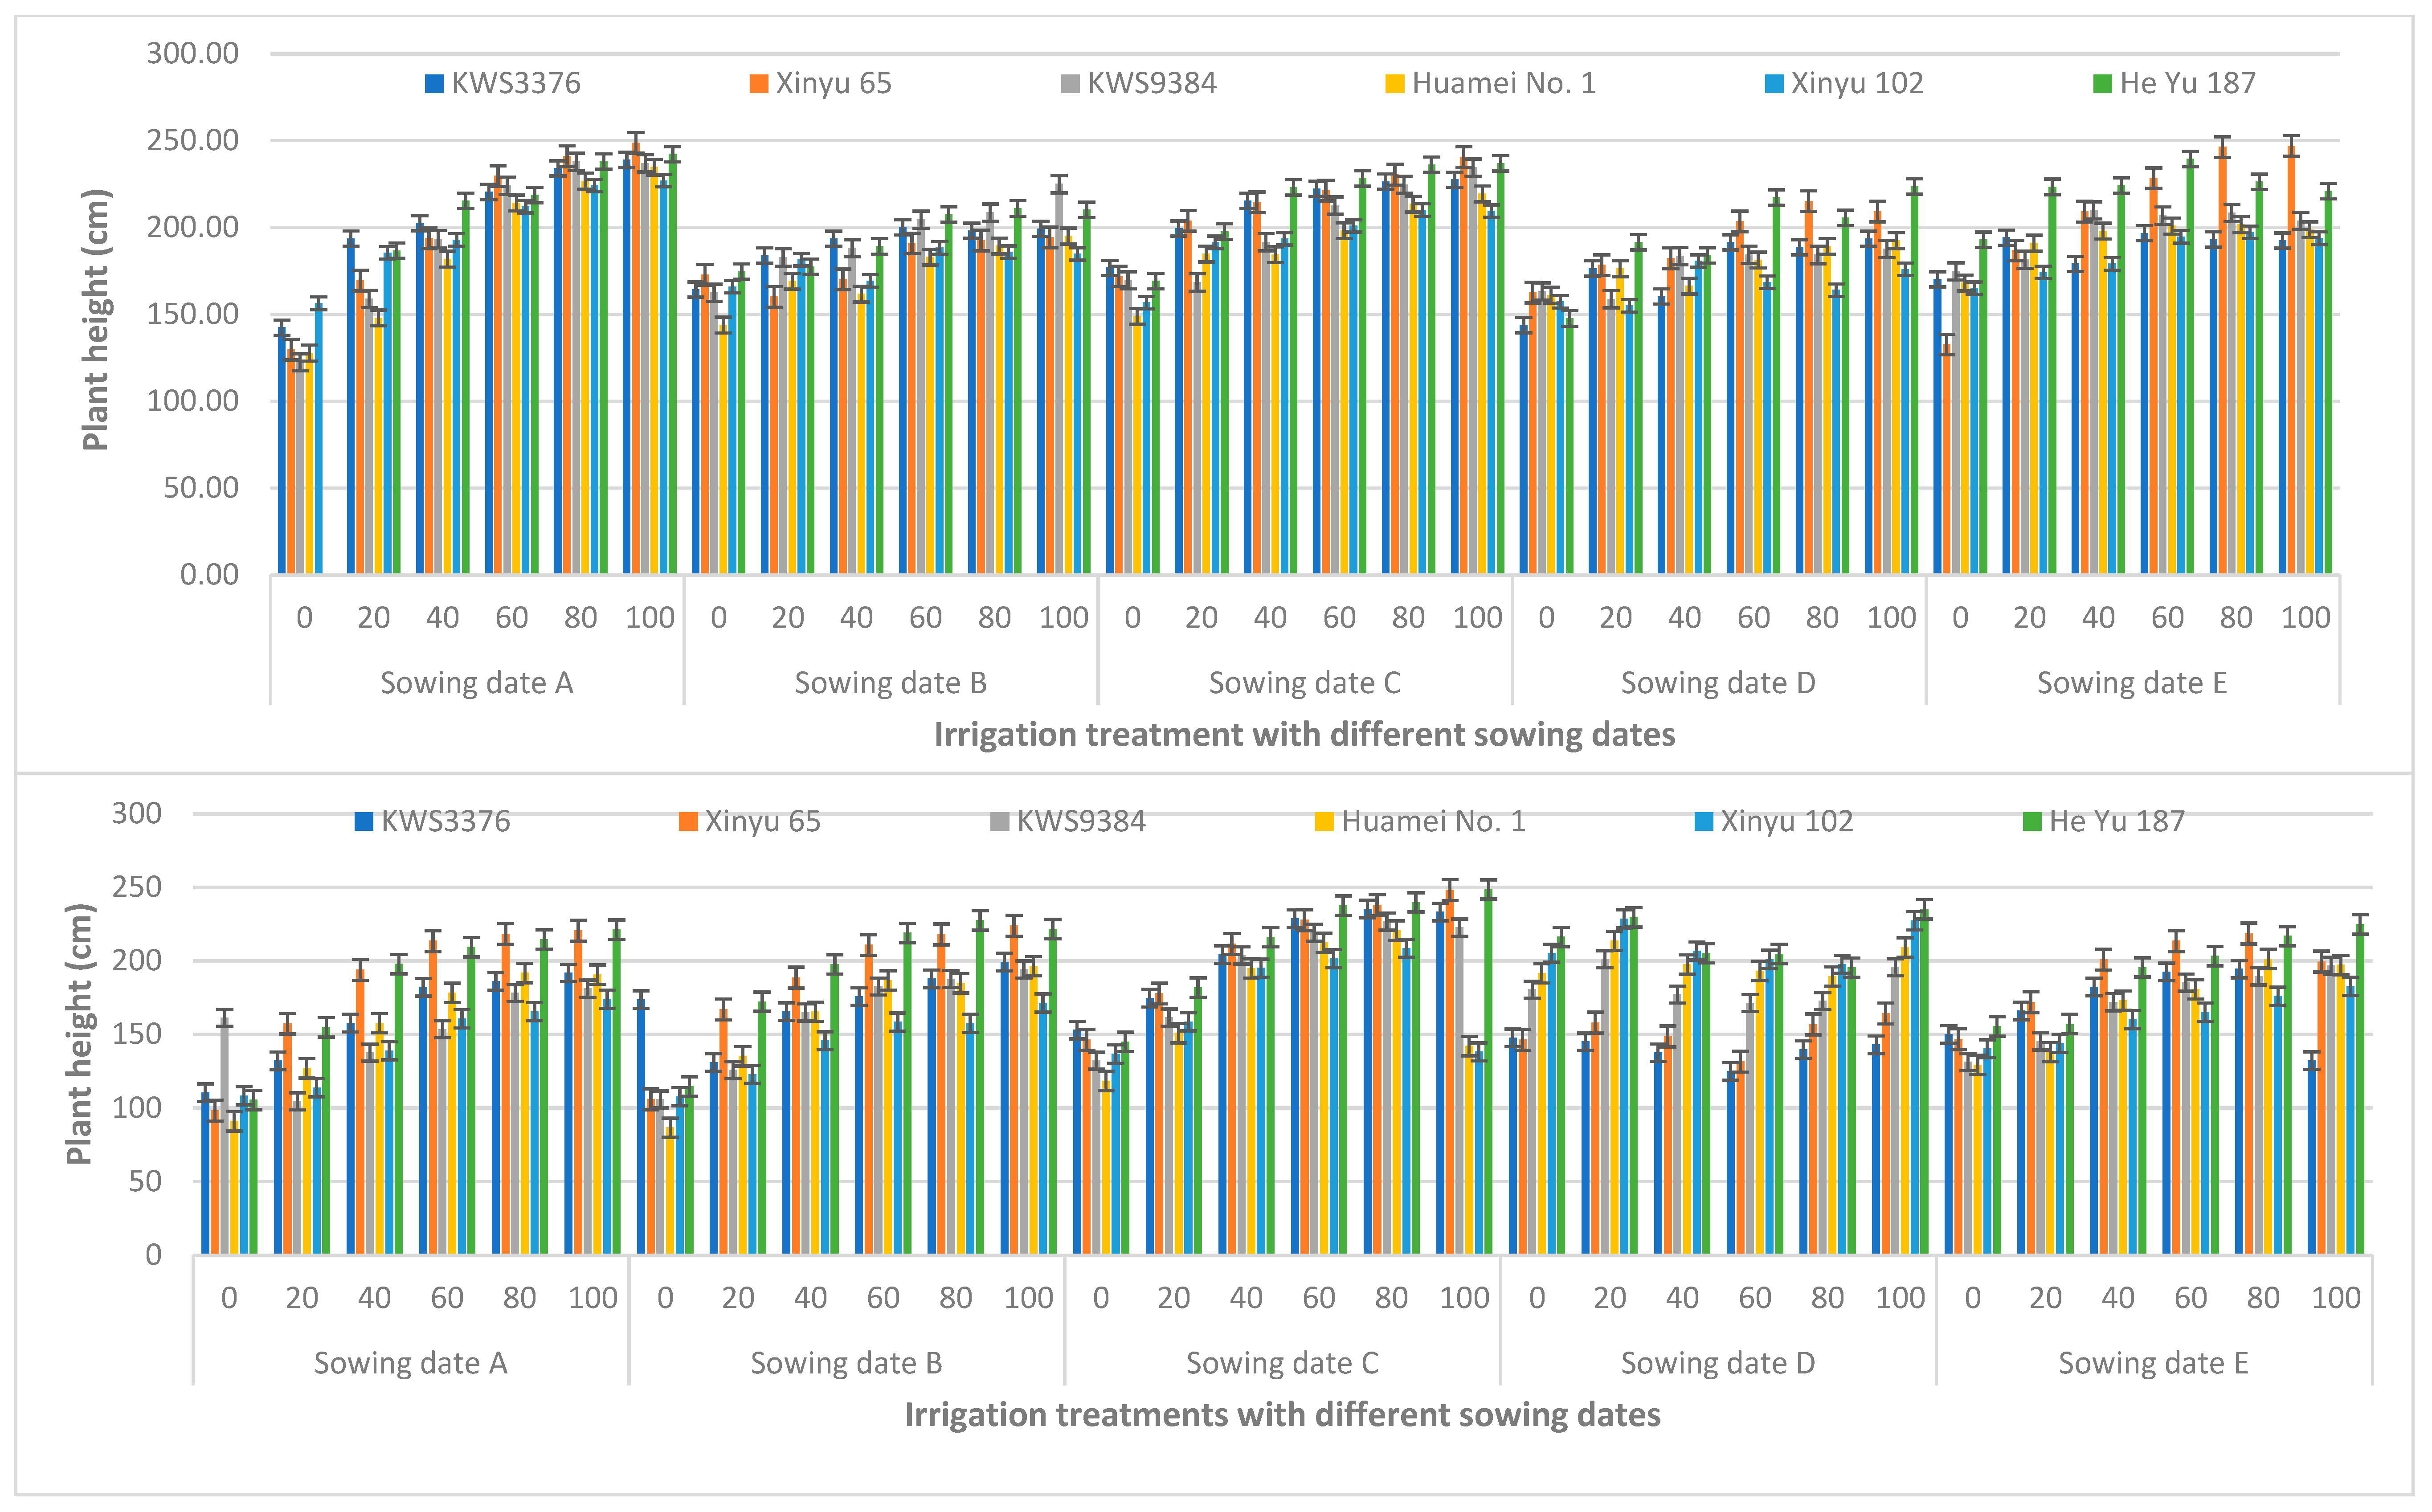
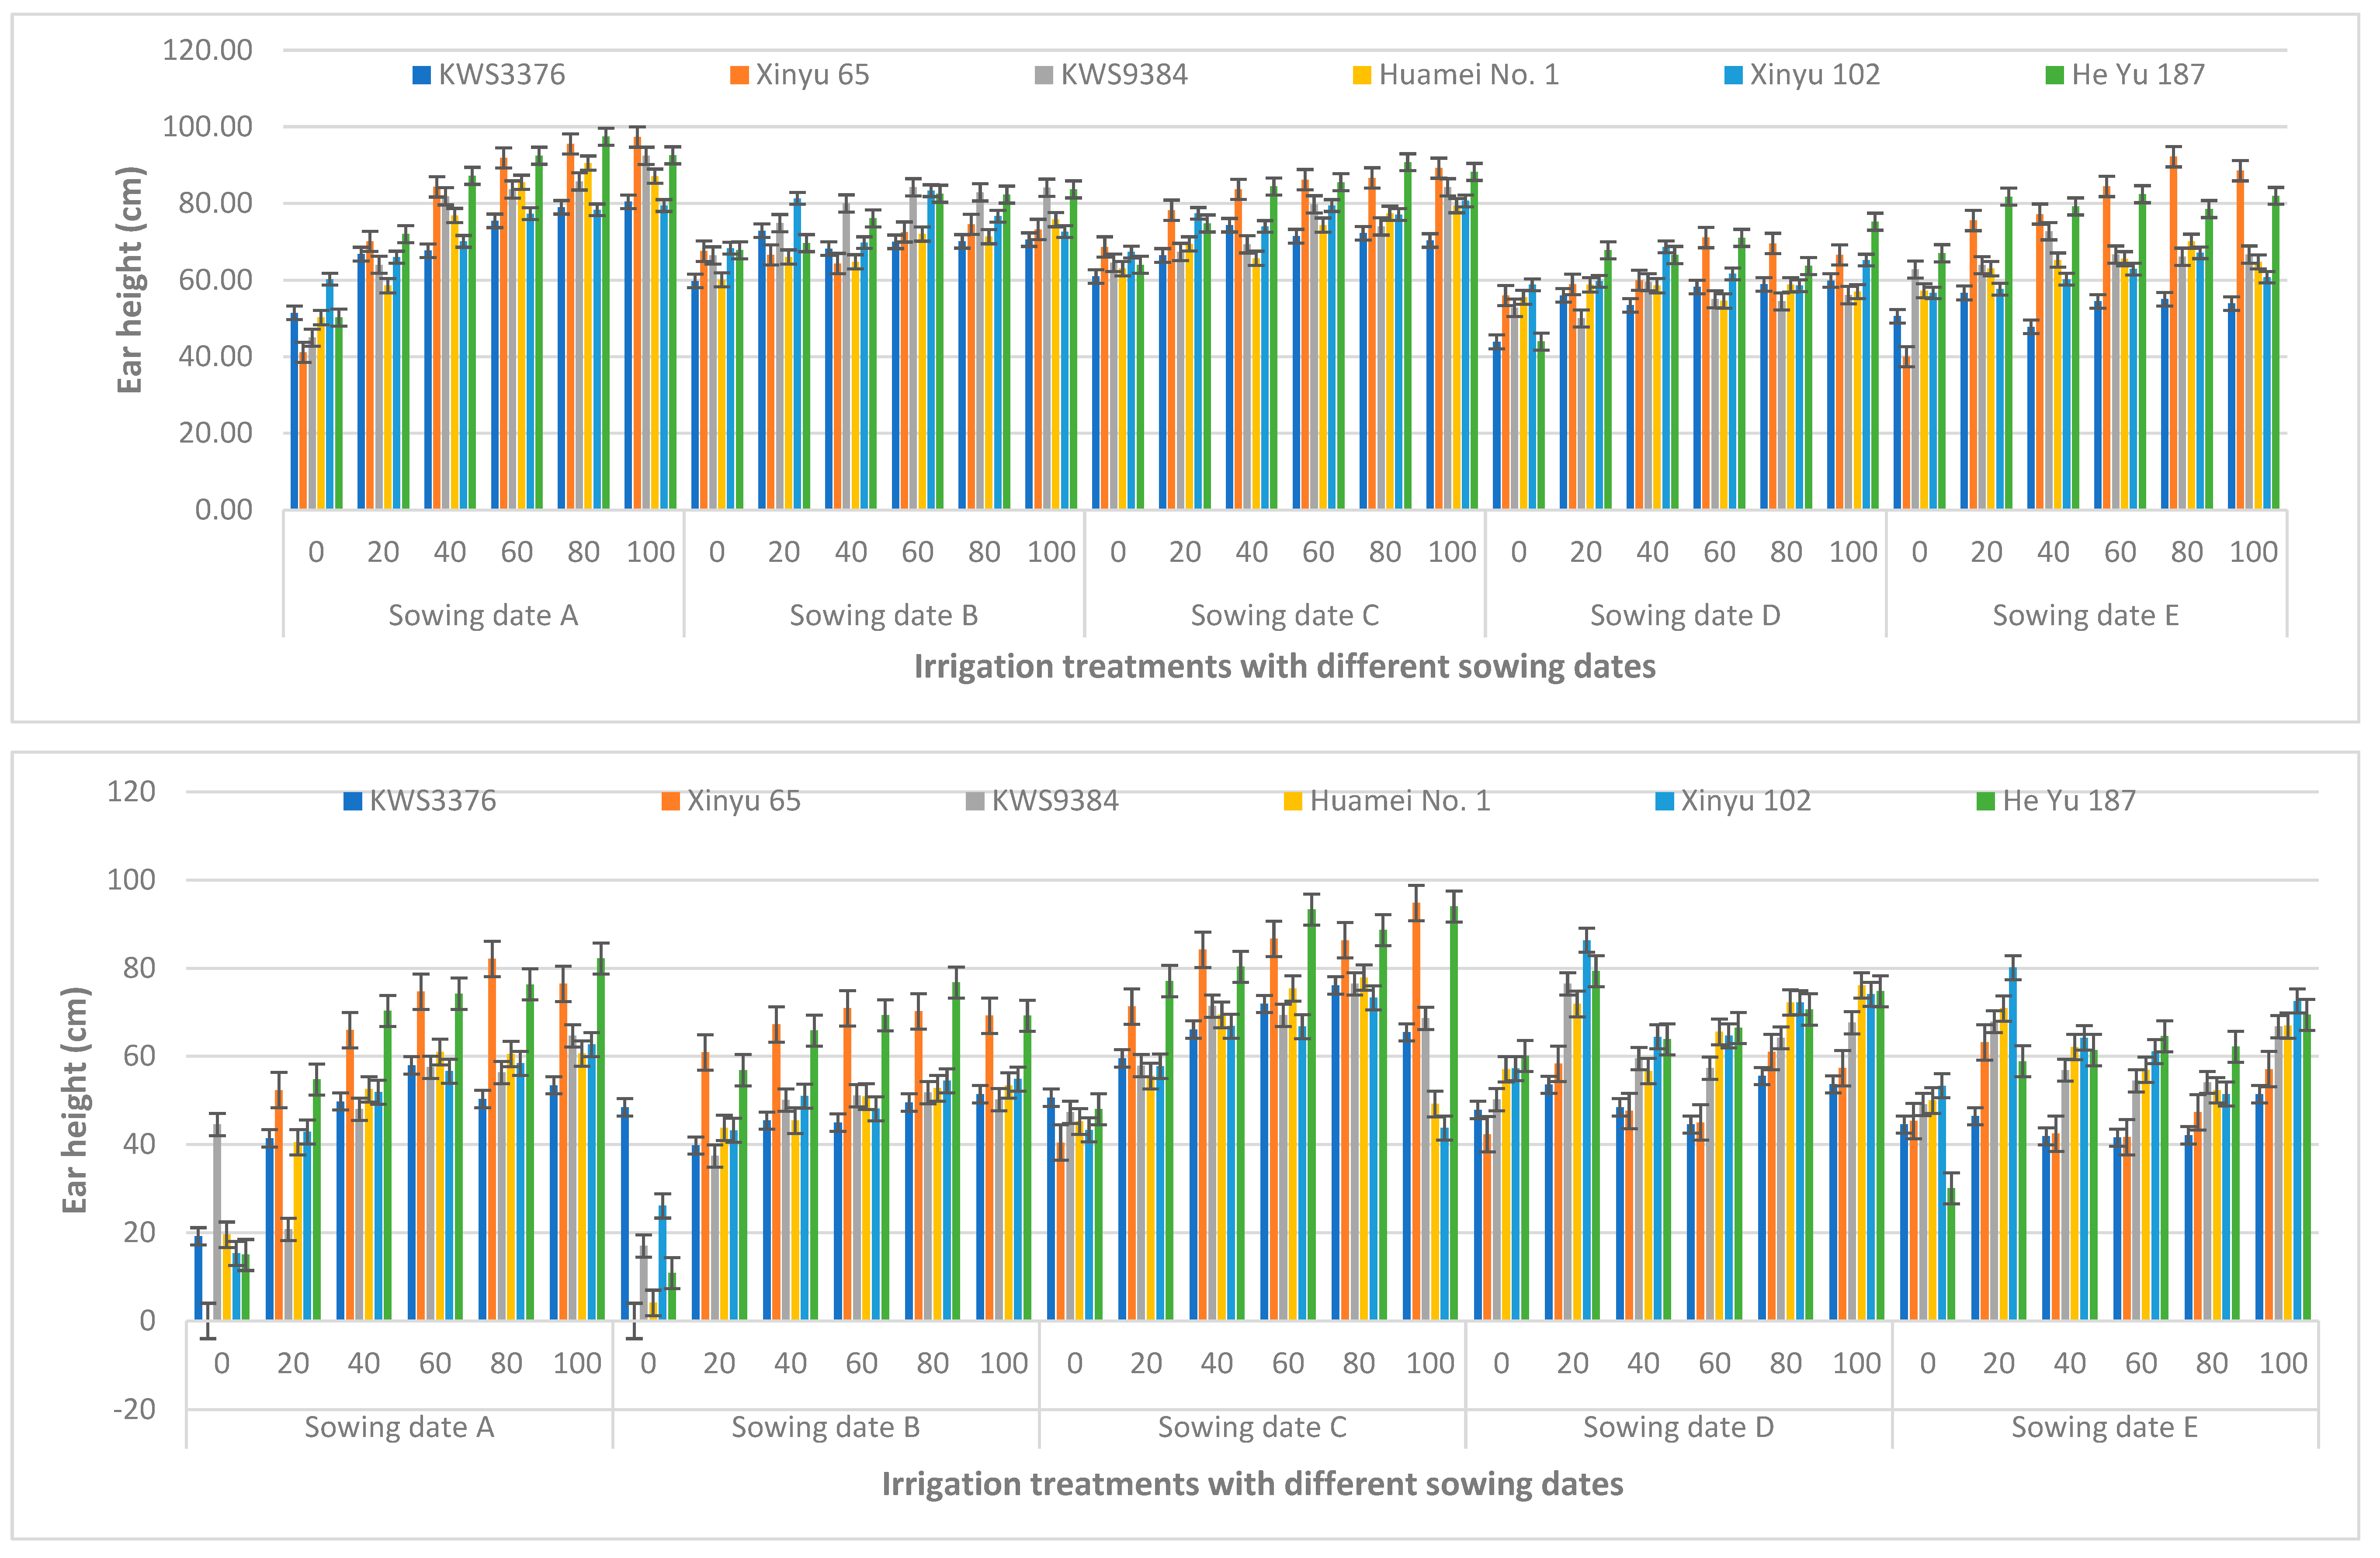
3.2. ASI (Anthesis–Silking Interval), Plant Height (PH), and Ear Height (EH)

ASI, PH, and EH were significantly affected on all varieties of corn under different irrigation treatments with different sowing dates for both years (2021–2022) (Table 4). Maximum ASI was observed for Heyu 187 on sowing date D at 0% irrigation treatment in 2021, while the lowest ASI was observed on sowing date C in different corn varieties. In 2022, the maximum ASI was seen for Xinyu 65 on sowing date B at 20% irrigation treatment, while the minimum ASI was observed in 0% irrigation treatment on sowing date B in different corn varieties (Figure 5). PH is an important morphological characteristic that is governed in part by genes but also influenced by environmental conditions. PH is a reliable indicator of the level of vegetative maturity. Figure 6 displays the measured corn PH. All treatments are effective in supplementing plant growth, leading to the increased height of the plant. There was a statistically significant variation between the various treatments. The maximum height was seen in the Xinyu 65 corn variety on sowing date A at 100% irrigation treatment as compared to all other treatments in 2021. In 2022, Heyu 187 showed maximum height on sowing date C and 100% irrigation treatment. The lowest PH was observed in the KWS9384 corn variety on sowing date A and 0% irrigation treatment in 2021, while Huame No.1 showed minimum PH on sowing date B and 0% irrigation treatment. Maximum EH was observed for Heyu 187 on sowing date A and 80% irrigation treatment in 2021, while minimum EH values were seen for Xinyu 65 on sowing date E in 0% irrigation treatment. In 2022, the maximum EH value was observed for Xinyu 65 on sowing date C and 100% irrigation treatment, while minimum values were observed for Xinyu 65 on sowing dates A and B, showing non-significant results, respectively (Figure 7).

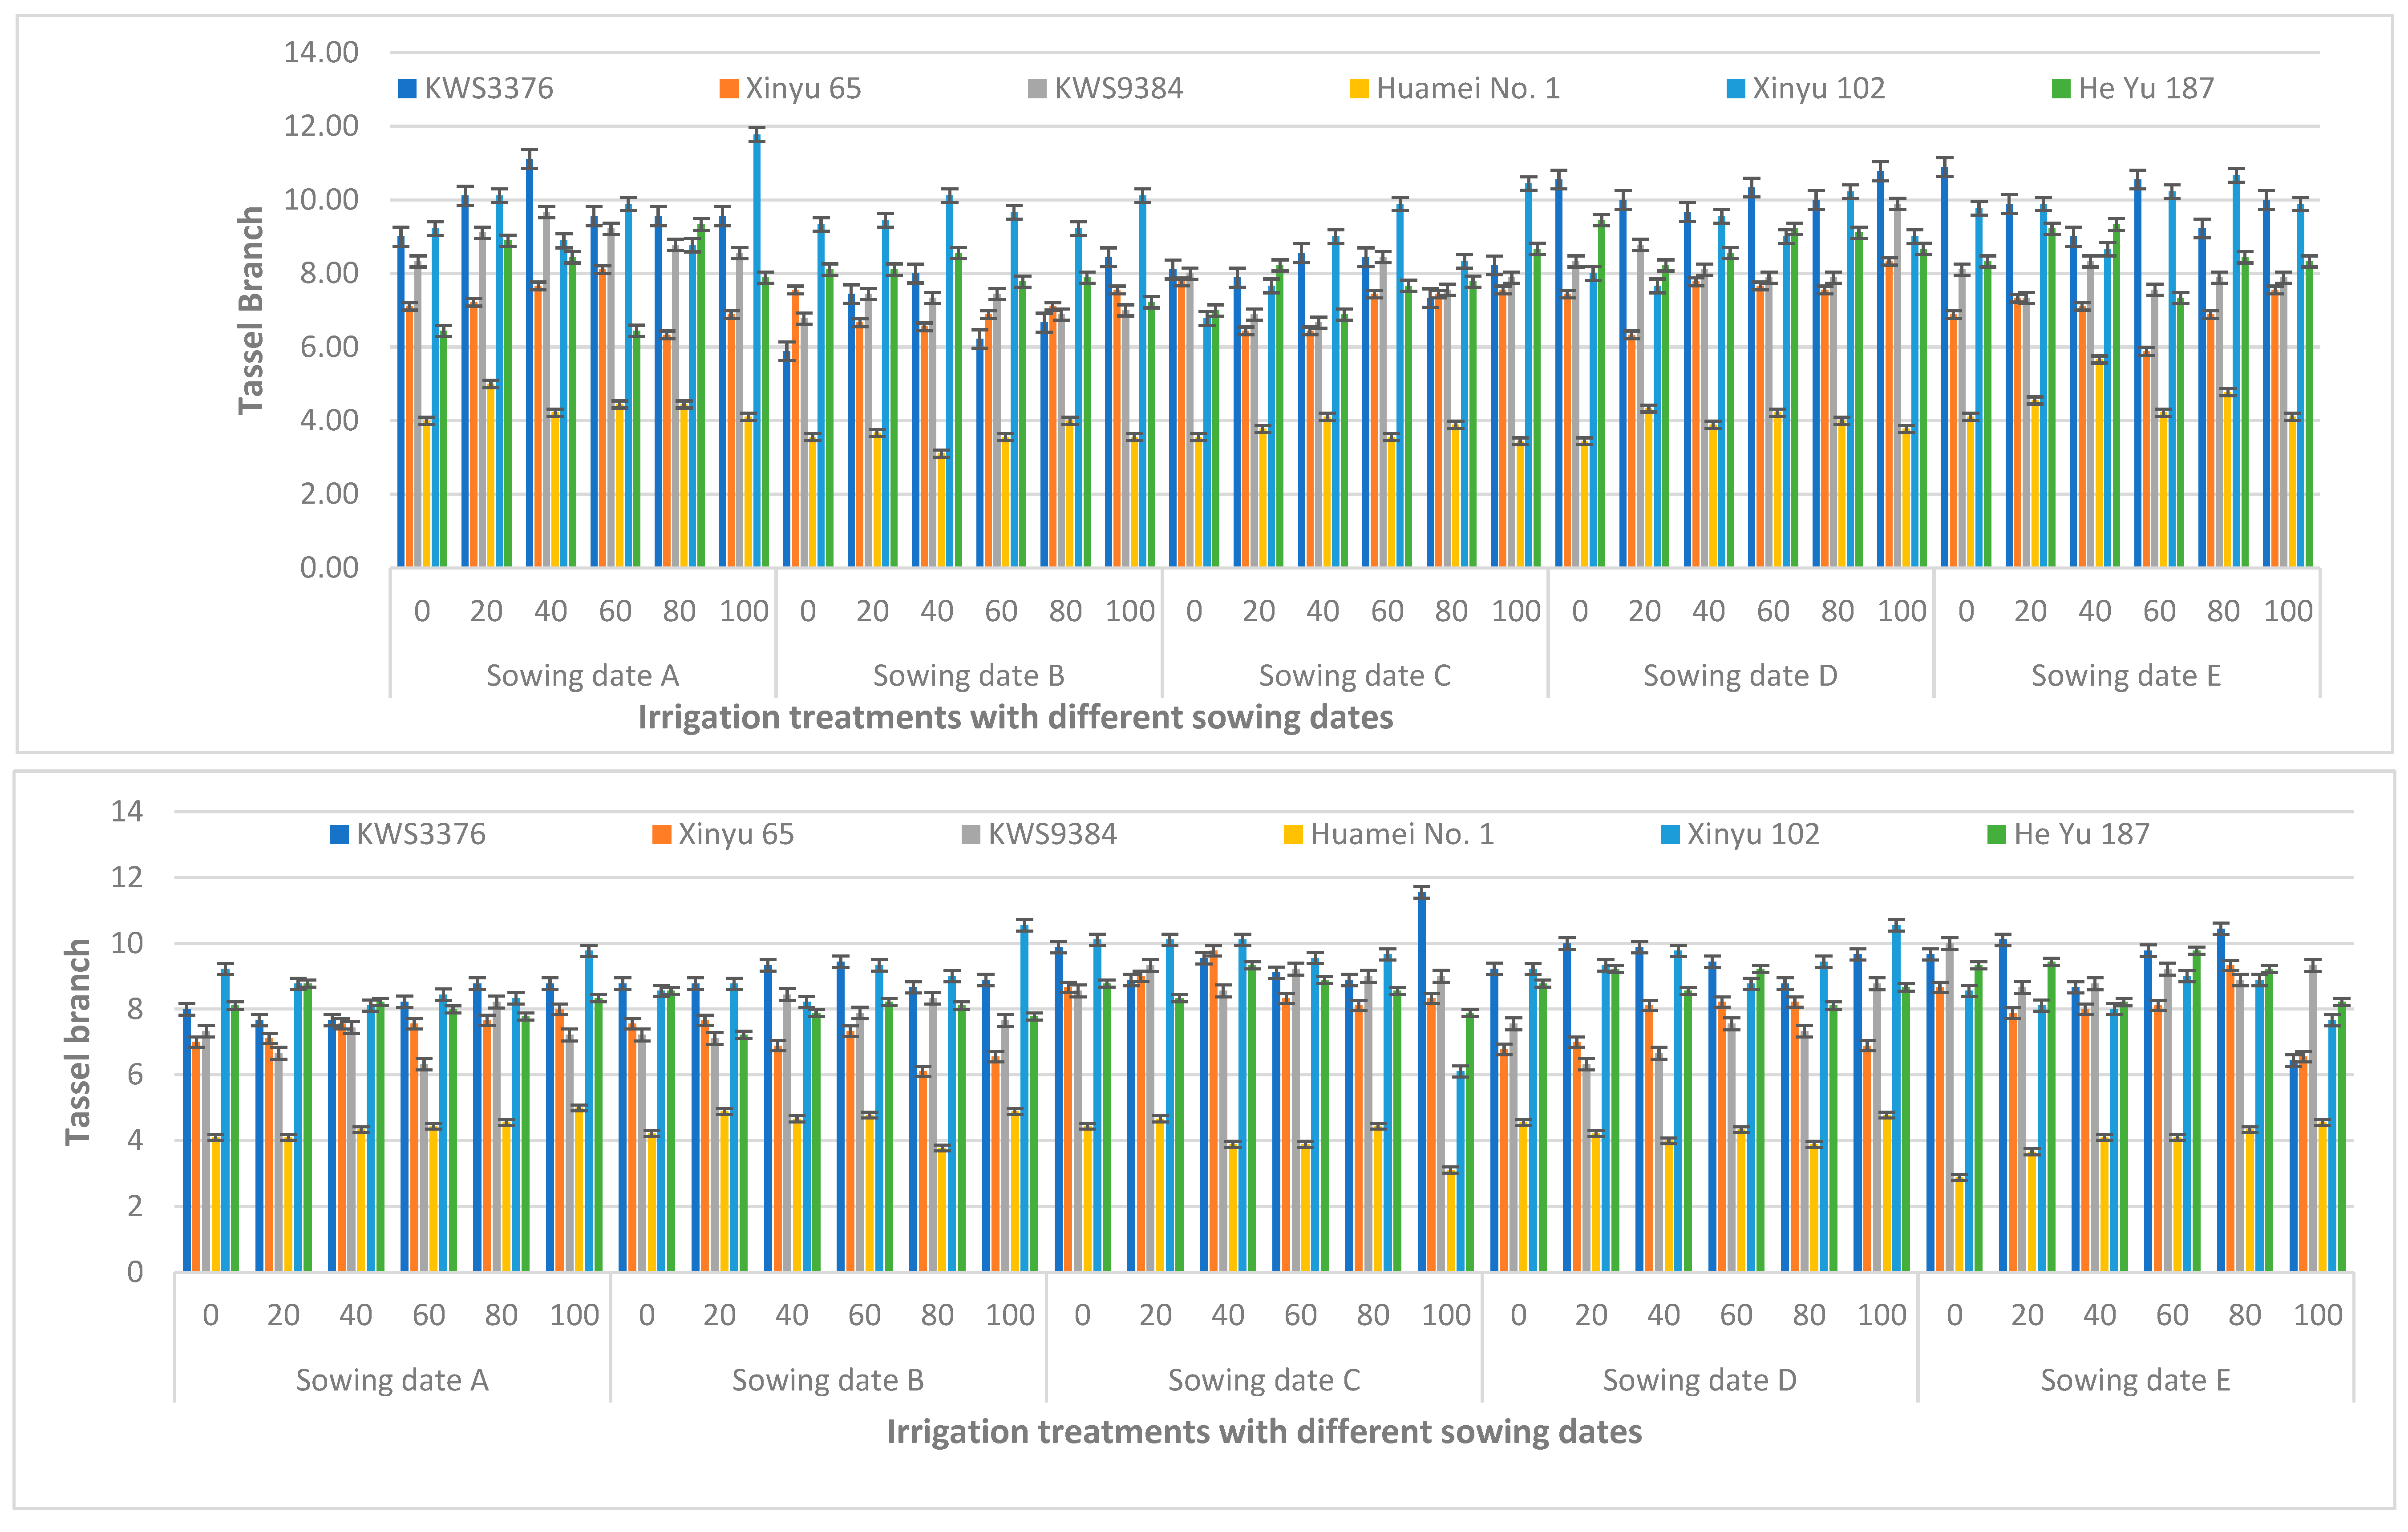
3.3. Tassel Branch and Tassel Length

Tassel branch and tassel length were significantly affected in all varieties of corn under different irrigation treatments with different sowing dates for both years (2021–2022) (Table 4). Maximum tassel branch values were observed for KWS3376 on sowing date A and 100% irrigation treatment in 2021, while the lowest tassel branch value was observed on sowing date B for Huamei No.1 at 40% irrigation treatment. In 2022, the maximum tassel branch value was seen for Xinyu 102 on sowing date C and 100% irrigation treatment, while minimum values were observed for 0% irrigation treatment on sowing date E for Huamei No. 1 (Figure 8). Maximum tassel length was observed for Xinyu 102 on sowing date A and 40% irrigation treatment in 2021, while minimum tassel length values were seen for KWS3376 on sowing date E at 40% irrigation treatment. In 2022, the maximum tassel length value was observed for He Yu187 on sowing date D at 80% of irrigation treatment, while minimum values were observed for KWS3376 on sowing date E and 100% irrigation treatment (Figure 9).

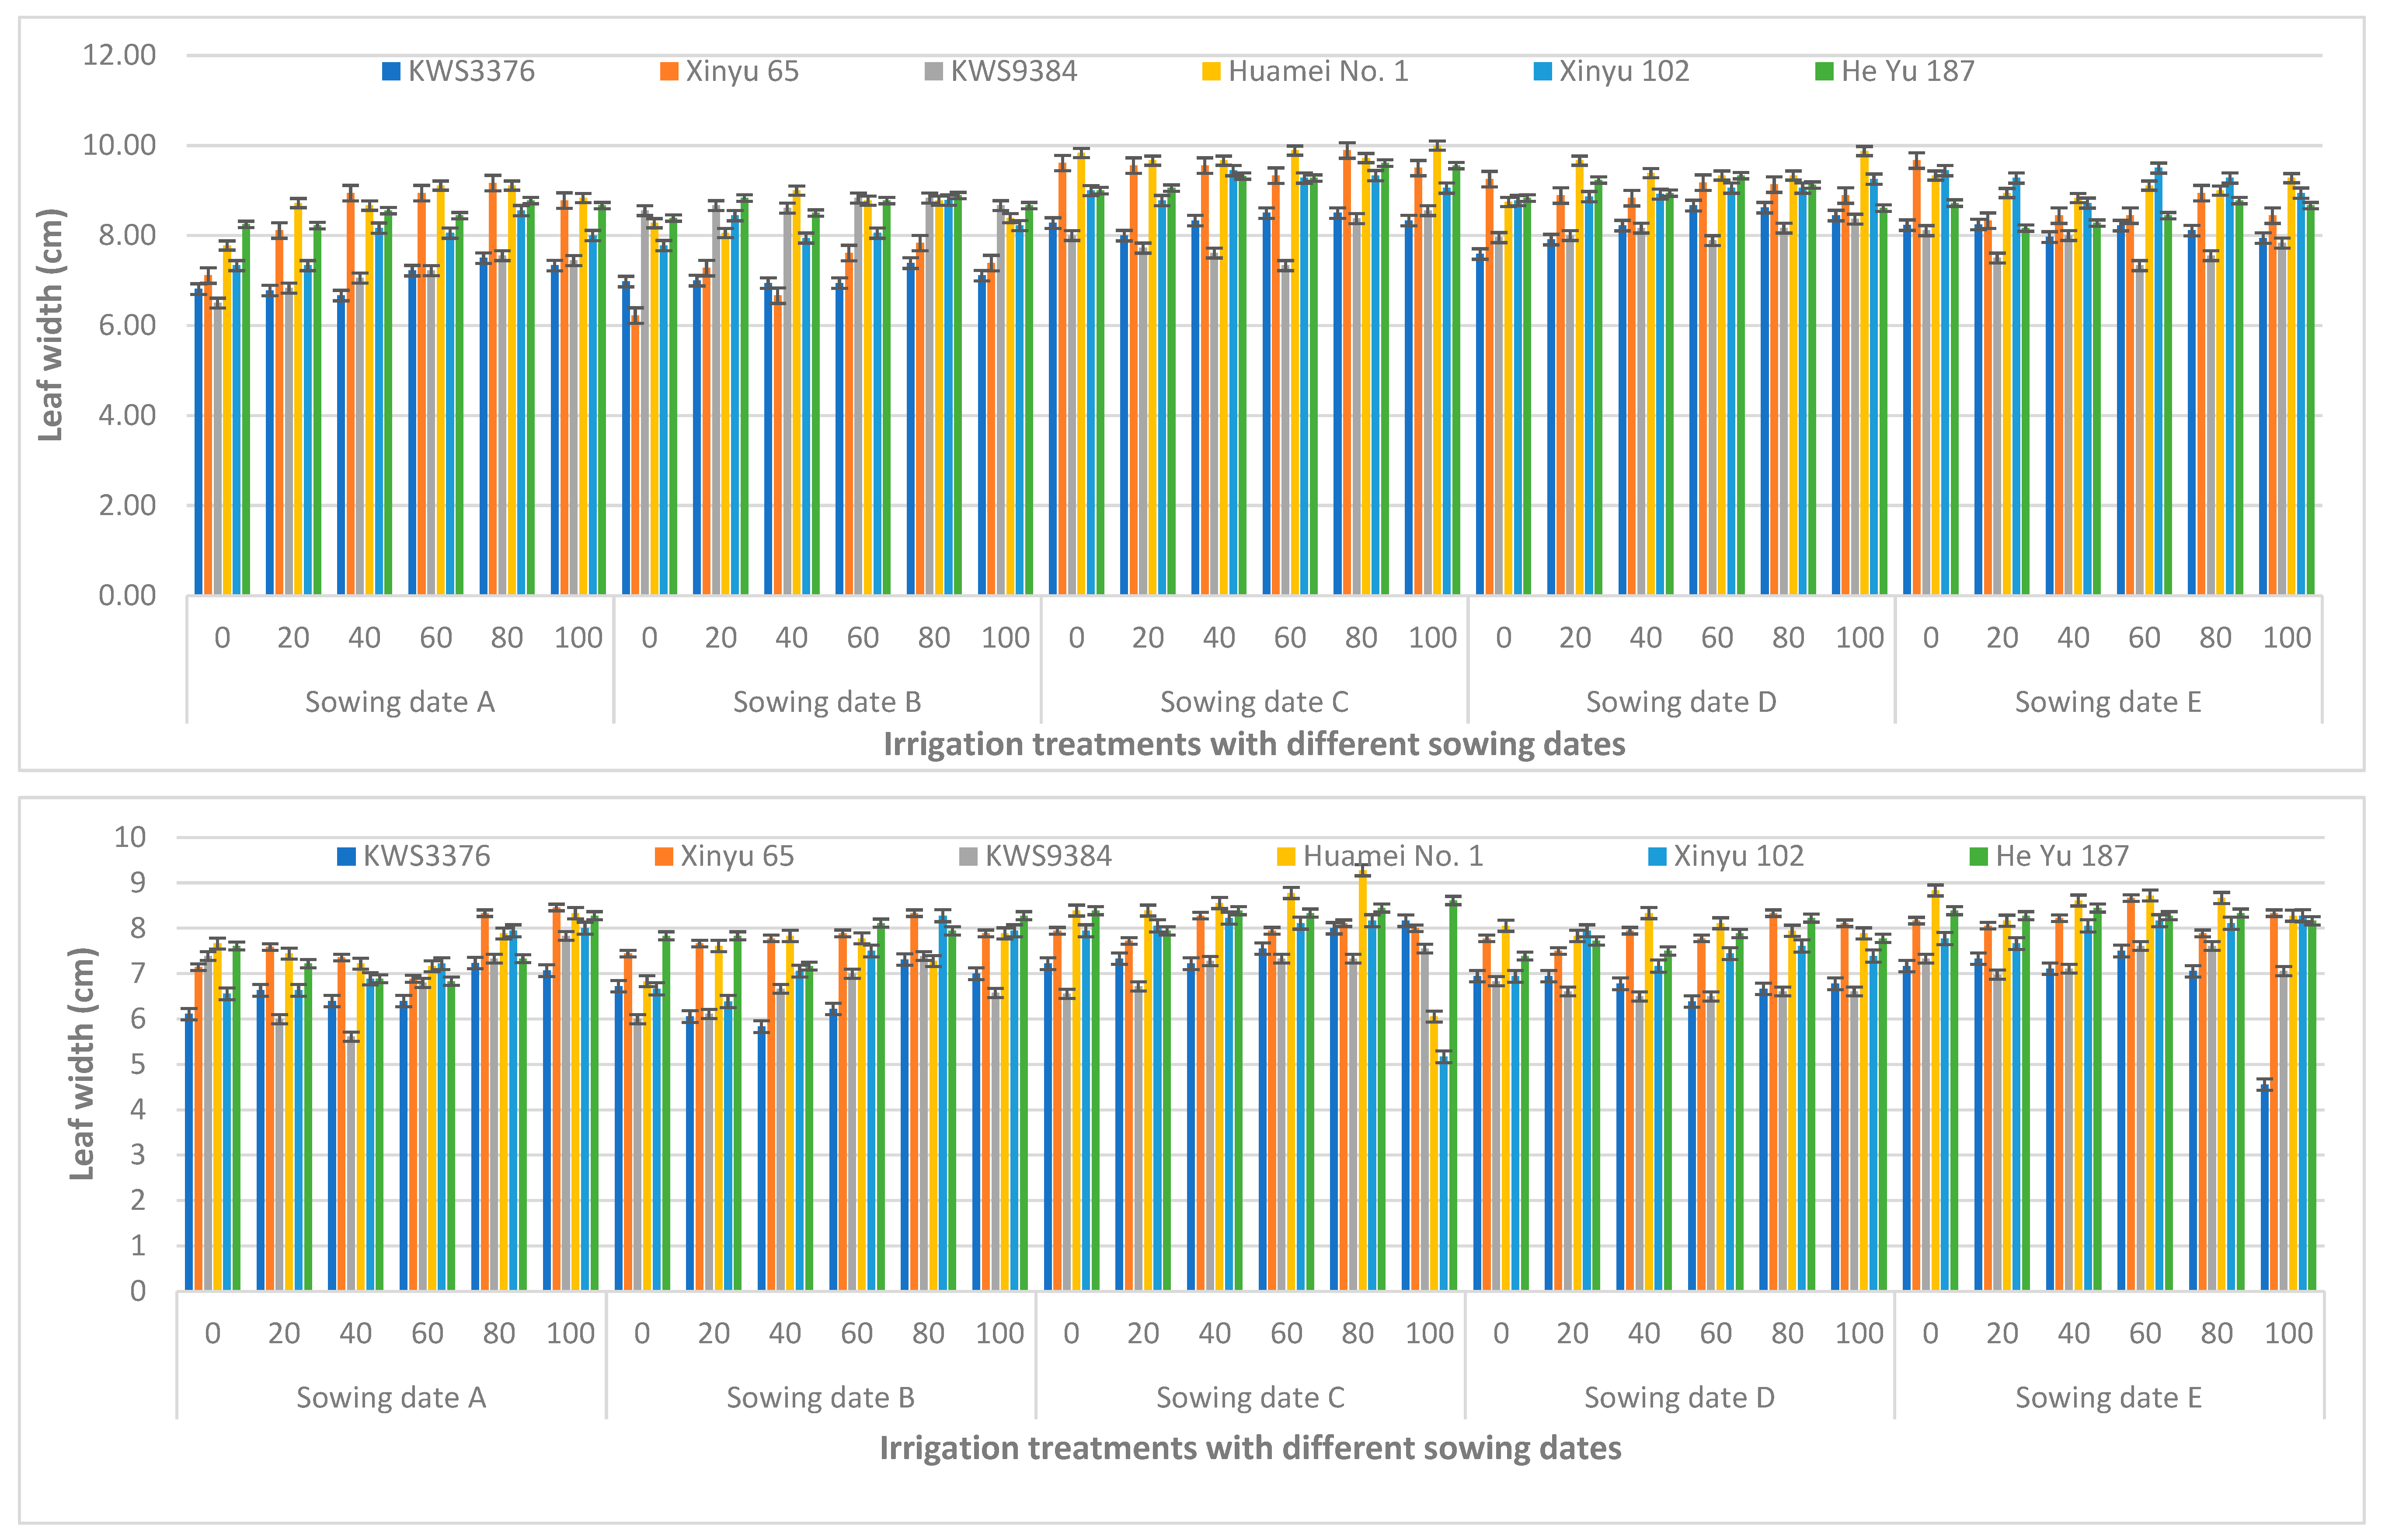
3.4. Leaf Length and Leaf Width

Leaf length and leaf width were significantly affected for all varieties of corn under different irrigation treatments with different sowing dates for both years (2021–2022) (Table 4). Maximum leaf length value was observed for KWS3376 on sowing date D and 80% irrigation treatment in 2021, while lowest leaf length value was observed on sowing date A for Huamei No.1 at 0% irrigation treatment. In 2022, the maximum leaf length value was seen for KWS3376 on sowing date C and 100% irrigation treatment, while the minimum value was observed at 100% irrigation treatment on sowing date C for Huamei No.1 corn variety (Figure 10). Maximum leaf width was observed for Huamei No.1 on sowing date C and 100% irrigation treatment in 2021, while minimum values were seen for Xinyu 65 on sowing date B in 0% irrigation treatment. In 2022, maximum value was observed for the Huamei No. 1 corn variety on sowing date C and 80% irrigation treatment, while minimum values were observed for KWS3376 on sowing date E and 100% irrigation treatment (Figure 11).

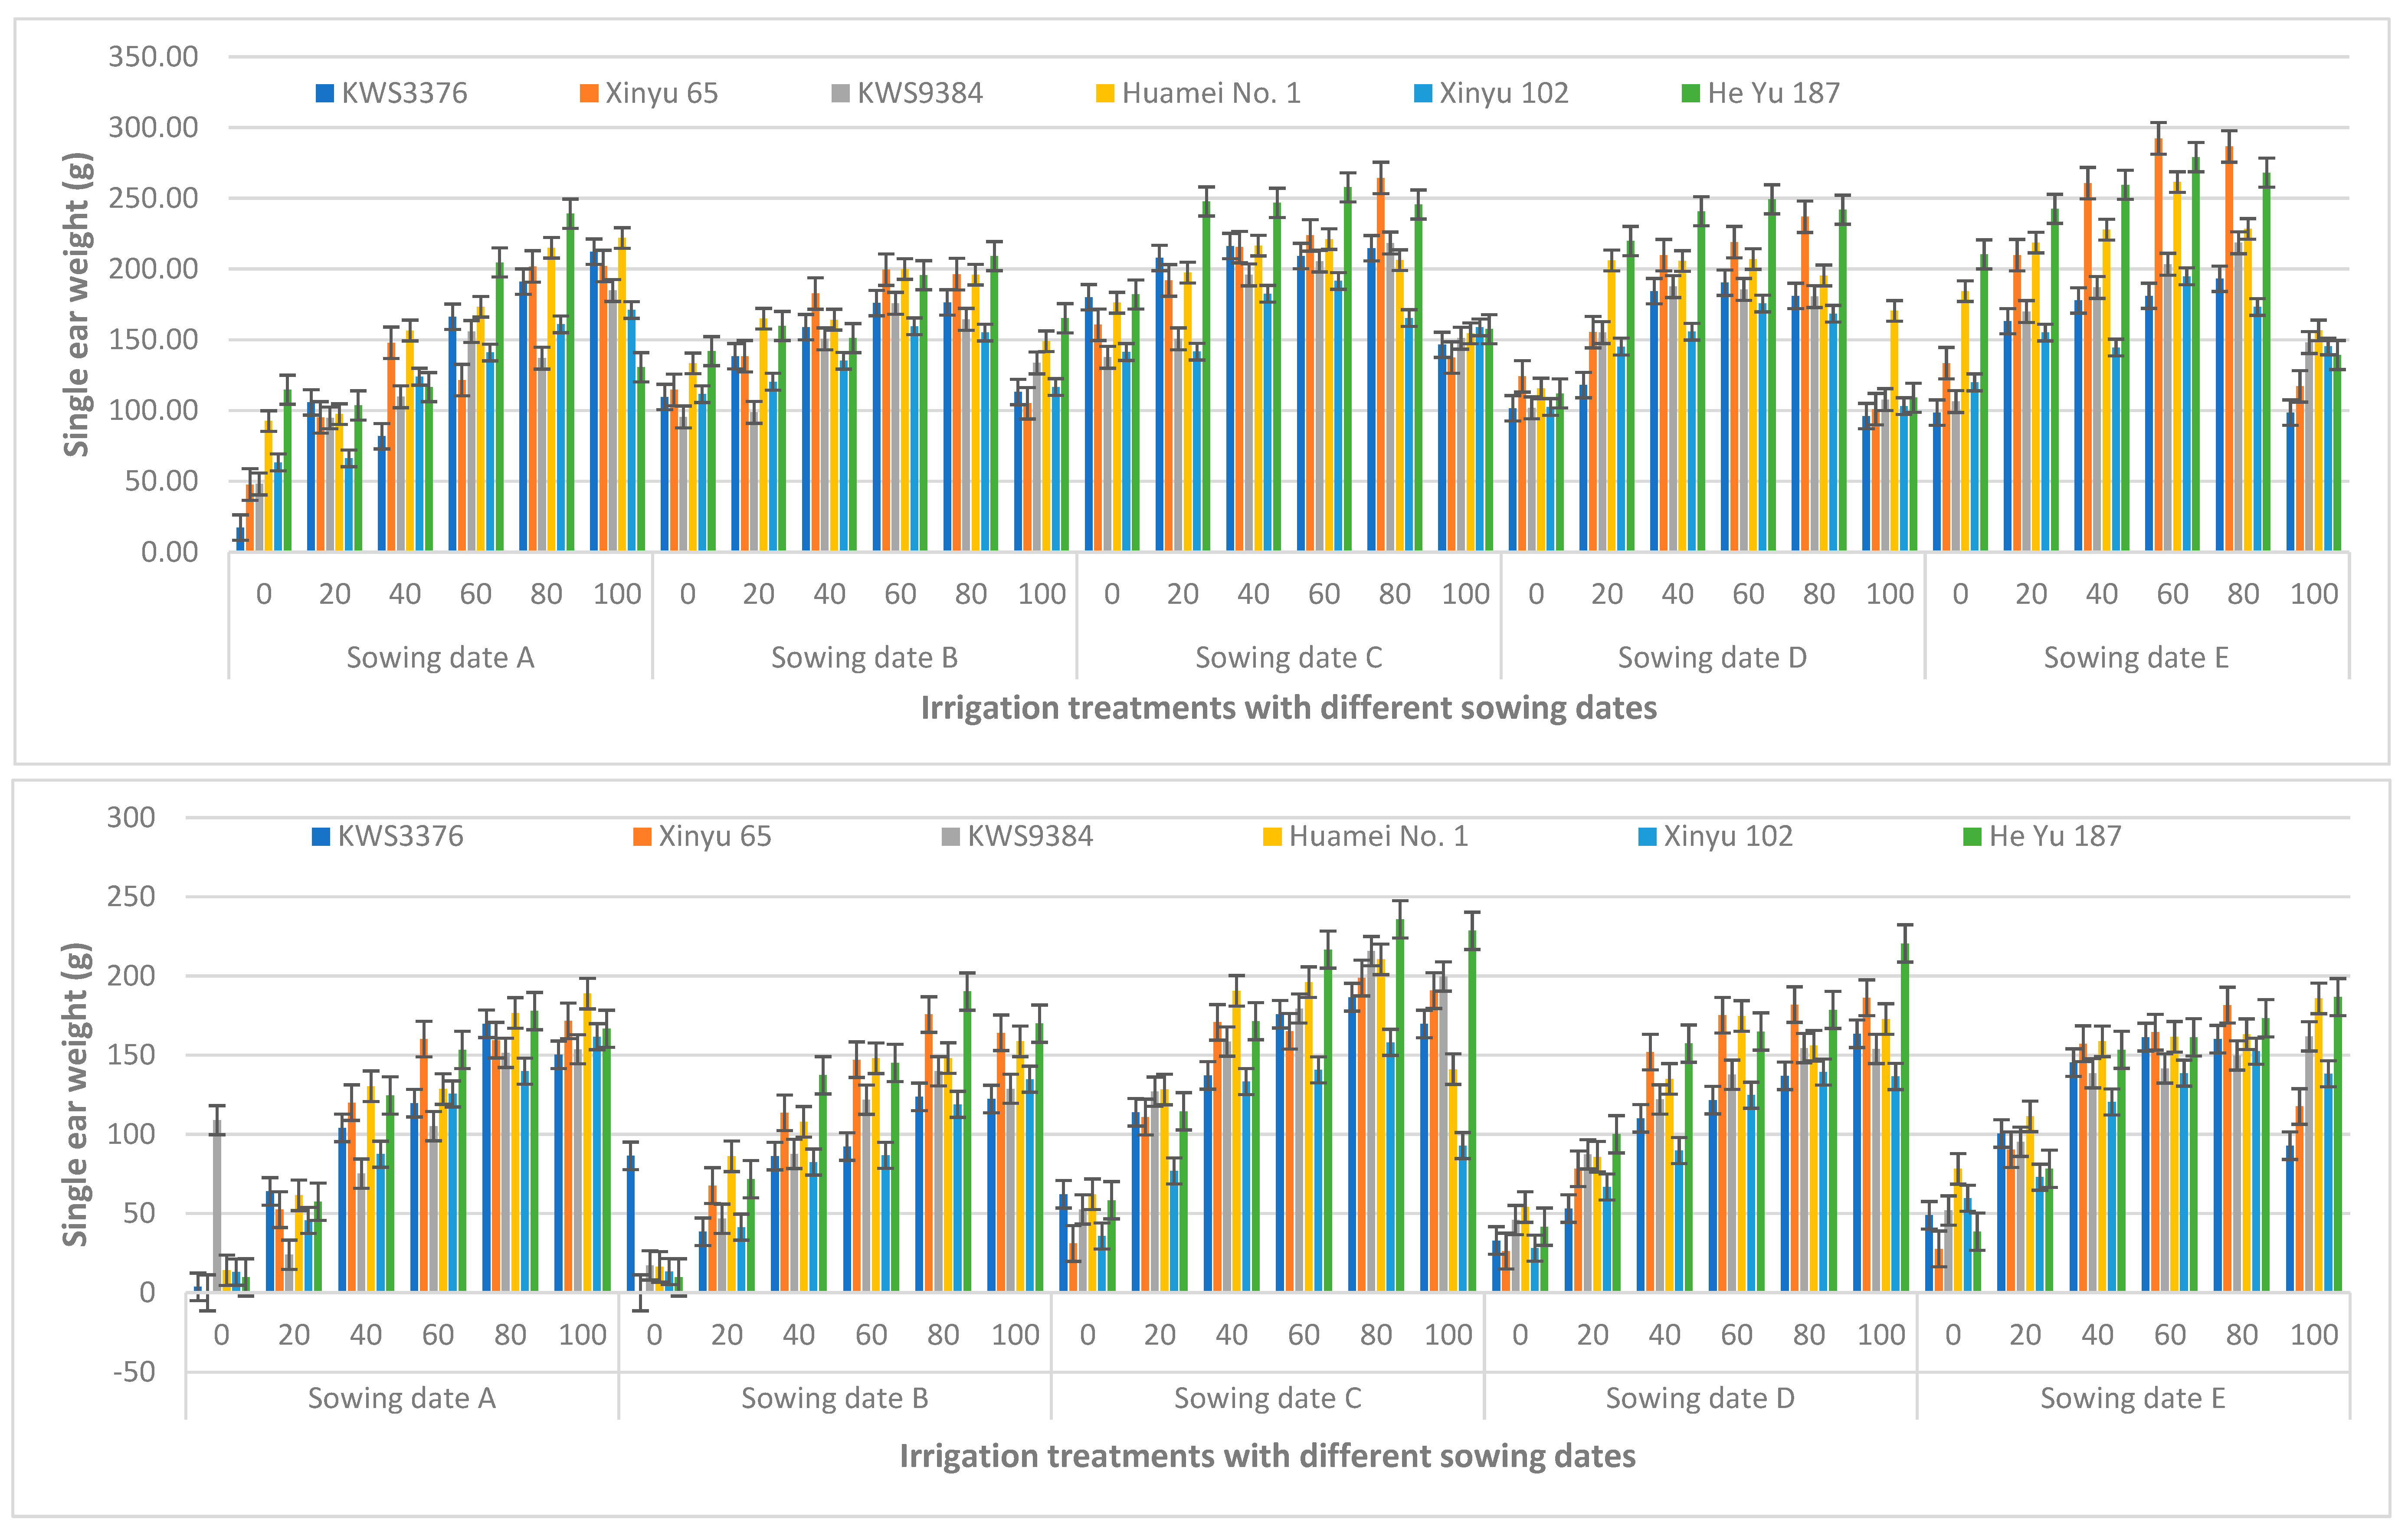
3.5. Grain Row Number and Single Ear Weight

Grain row number and single ear weight were significantly affected for all varieties of corn under different irrigation treatments with different sowing dates for both years (2021–2022) (Table 4). The maximum grain row number was observed for Xinyu 102 on sowing day A and 40% irrigation treatment, followed by sowing date D (same variety) at irrigation treatments of 60% and 80% in 2021, while the lowest grain row number was observed on sowing date A for KWS3376 in 0% irrigation treatment. In 2022, the maximum grain row number was seen for Xinyu 102 at sowing date B at 100% irrigation treatment, while the minimum grain row number was observed in 0% irrigation treatment on sowing dates A and B for the Xinyu 65 corn variety (Figure 12). Maximum single ear weight was observed for Xinyu 65 on sowing date E and 60% irrigation treatment in 2021, while minimum single ear weight was seen for the KWS3376 corn variety on sowing date A in 0% irrigation treatment. In 2022, maximum single ear weight was observed for the Huyu 187 corn variety on sowing date C at 80% irrigation treatment, while minimum single ear weight was observed for KWS3376 on sowing date A in 0% irrigation treatment (Figure 13).

3.6. Ear Length, Ear Diameter, and Ear Area

Ear length, ear diameter, and ear area were significantly affected for all varieties of corn under different irrigation treatments with different sowing dates for both years (2021–2022) (Table 4). Maximum ear length was observed for Xinyu 65 on sowing date E and 60% irrigation treatment followed by sowing date C (same variety) at 80% irrigation treatment in 2021, while the lowest ear length was observed on sowing date A for KWS3376 and 0% irrigation treatment. In 2022, the maximum ear length was seen for KWS9384 on sowing date C at 80% irrigation treatment, while minimum ear length was observed at 0% irrigation treatment on sowing dates A and B for Xinyu 65 (Figure 14). Maximum ear diameter was observed for Heyu 187 on sowing date E and 80% irrigation treatment in 2021, while minimum ear diameter was seen for KWS3376 on sowing date A at 0% irrigation treatment. In 2022, the maximum ear diameter was observed for Xinyu 65 on sowing date E and 80% irrigation treatment, while the minimum ear diameter was observed for Xinyu 65 on sowing dates A and B and 0% irrigation treatment (Figure 15). Maximum ear area was observed for Xinyu 65 on sowing date E and 80% irrigation treatment followed by sowing date E for Huamei No. 1 at 60% irrigation treatment in 2021, while the lowest ear area was observed on sowing date A for KWS3376 at 0% irrigation treatment. In 2022, the maximum ear area was seen for KWS9384 on sowing date C at the rate of 80% irrigation treatment, while the minimum ear area was observed at 0% irrigation treatment on sowing dates A and B for Xinyu 65 (Figure 16).

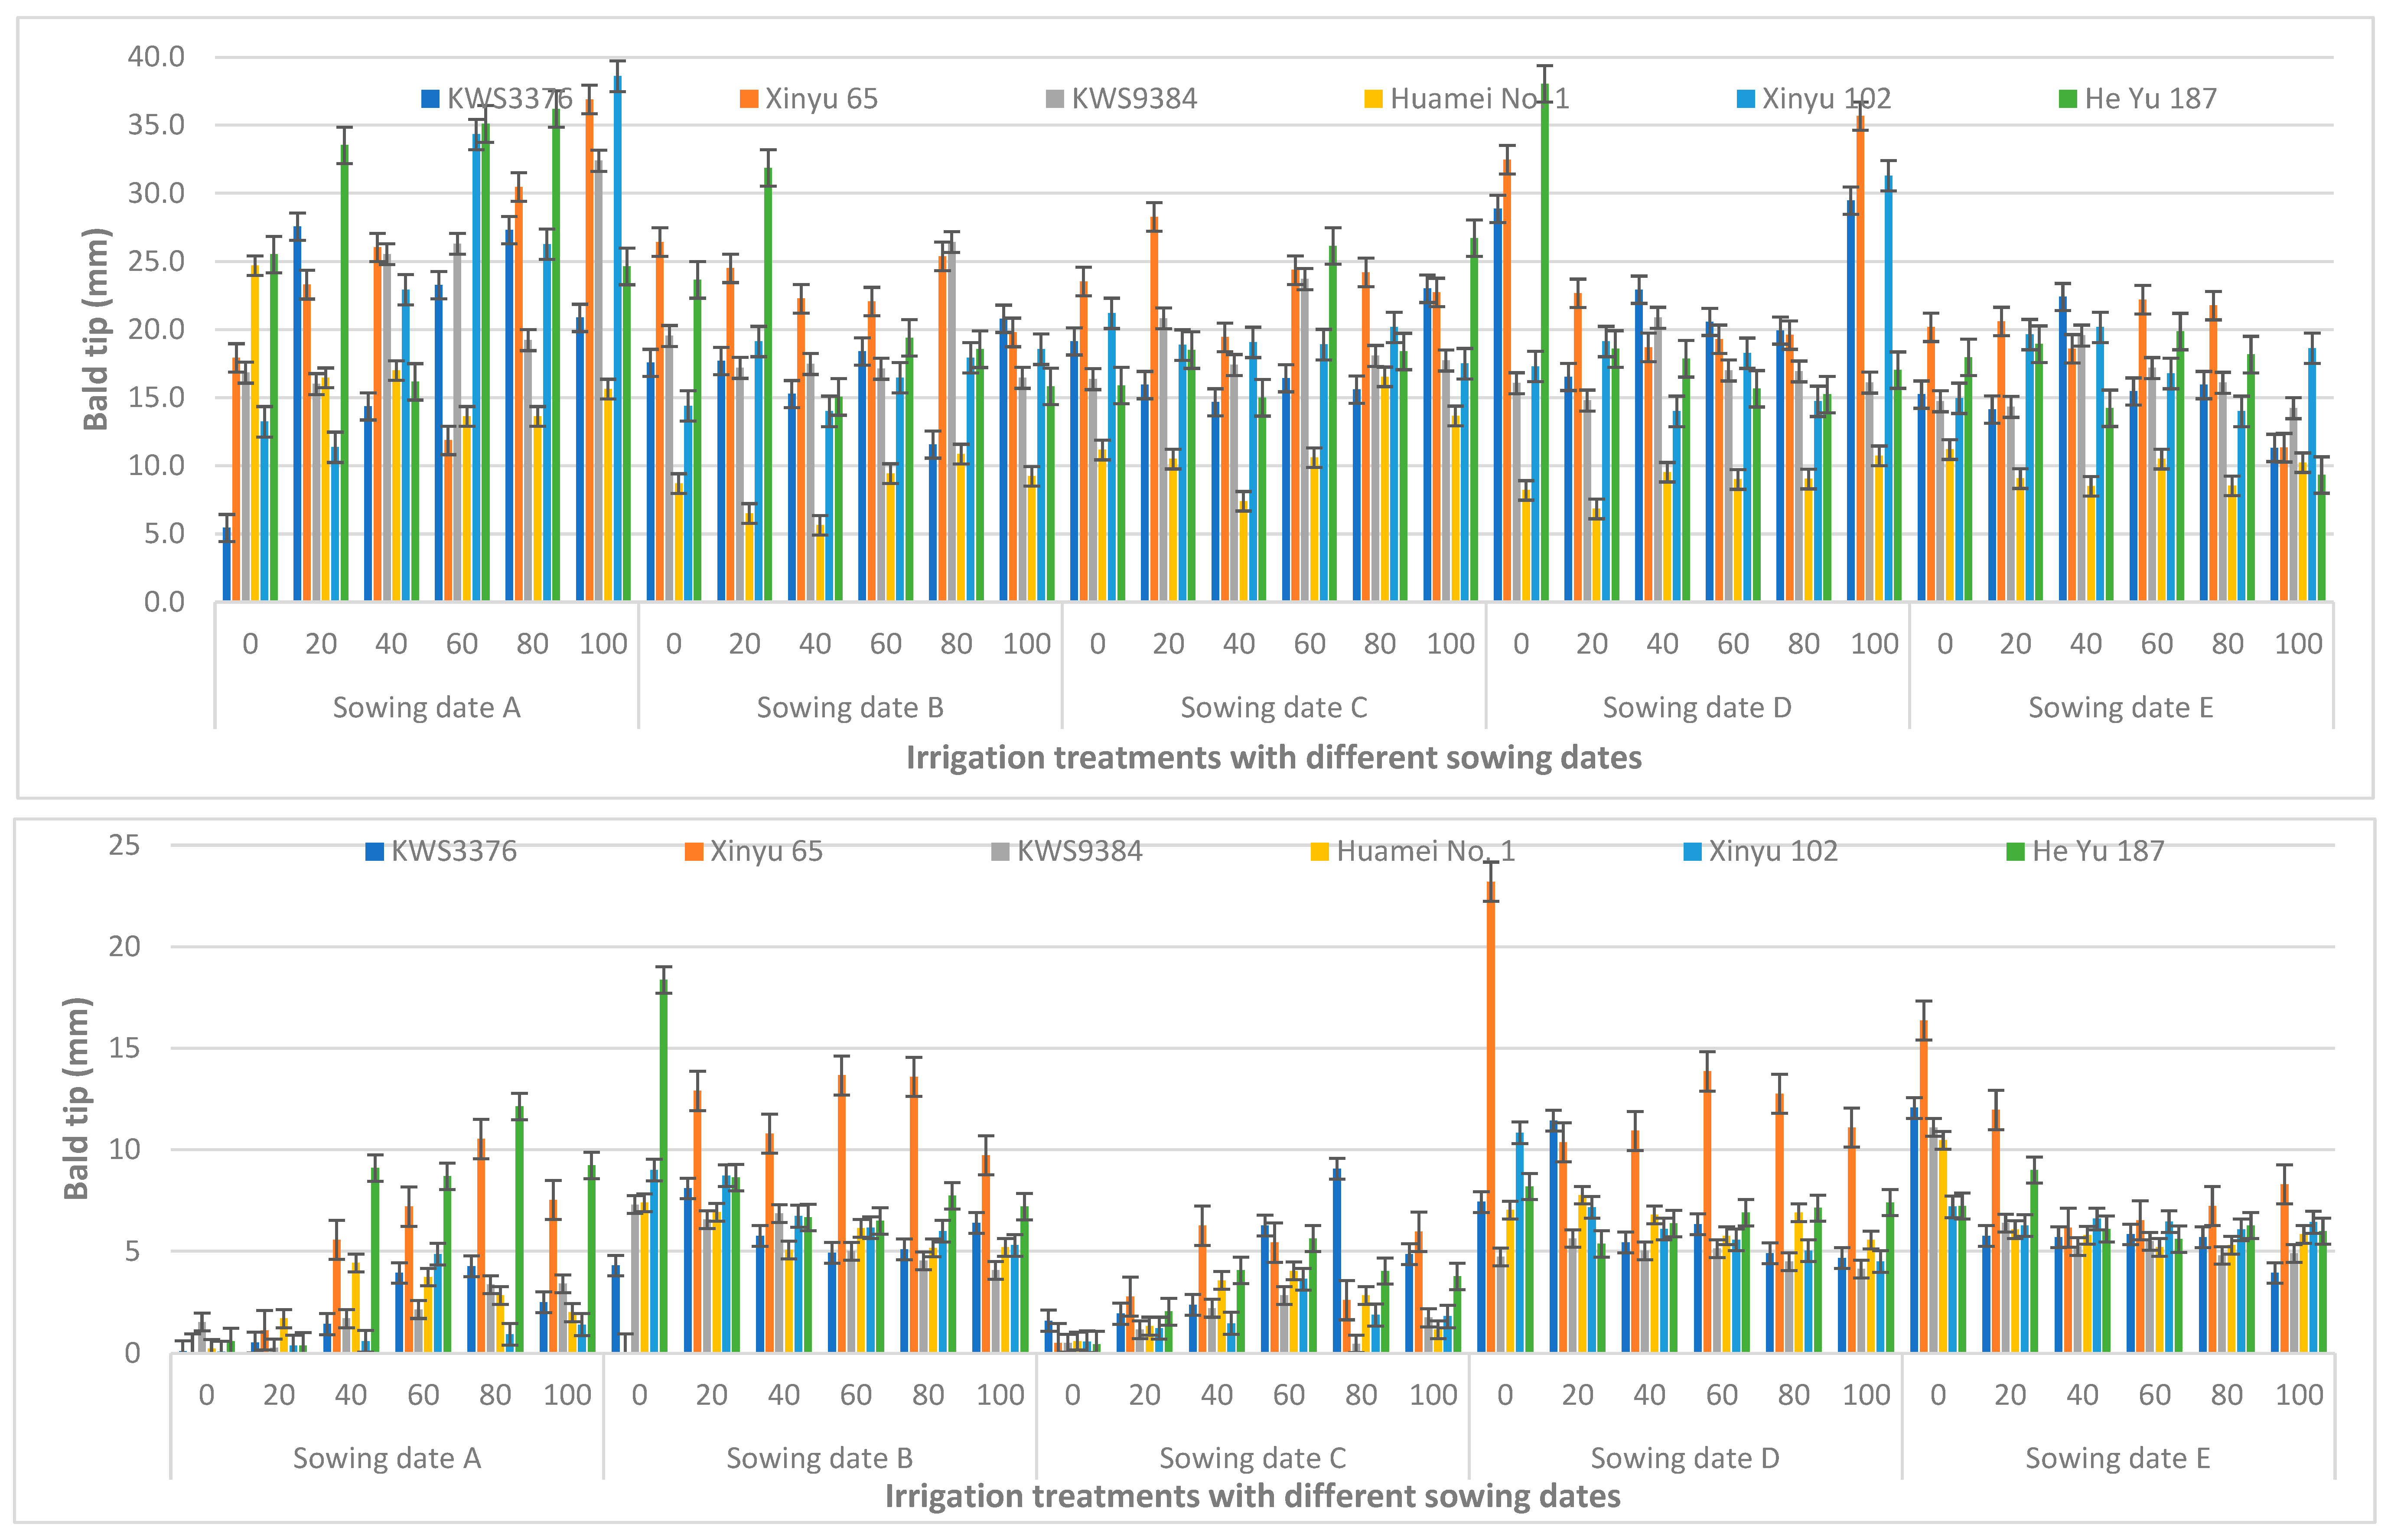
3.7. Bald Tip and Hole Percentage

Bald tip and hole percentage were significantly affected for all varieties of corn under different irrigation treatments on different sowing dates for both years (2021–2022) (Table 4). The maximum bald tip was observed for Xinyu 102 on sowing date A and 100% irrigation treatment, while the lowest bald tip was observed on sowing date A for KWS3376 and 0% irrigation treatment. In 2022, the maximum bald tip was seen for Xinyu 65 on sowing date D and 0% irrigation treatment, while the minimum bald tip was observed at 0% irrigation treatment on sowing dates A and B for Xinyu 65 (Figure 17). Maximum hole percentage was observed for Xinyu 65 on sowing date D and 100% irrigation treatment in 2021, while minimum hole percentage was seen for Huamei No. 1 on sowing date B and 80% irrigation treatment. In 2022, the maximum hole percentage was observed for Xinyu 65 on sowing date D and 0% irrigation treatment, while the minimum hole percentage was observed for Xinyu 65 on sowing date A and B in 0% irrigation treatment (Figure 18).

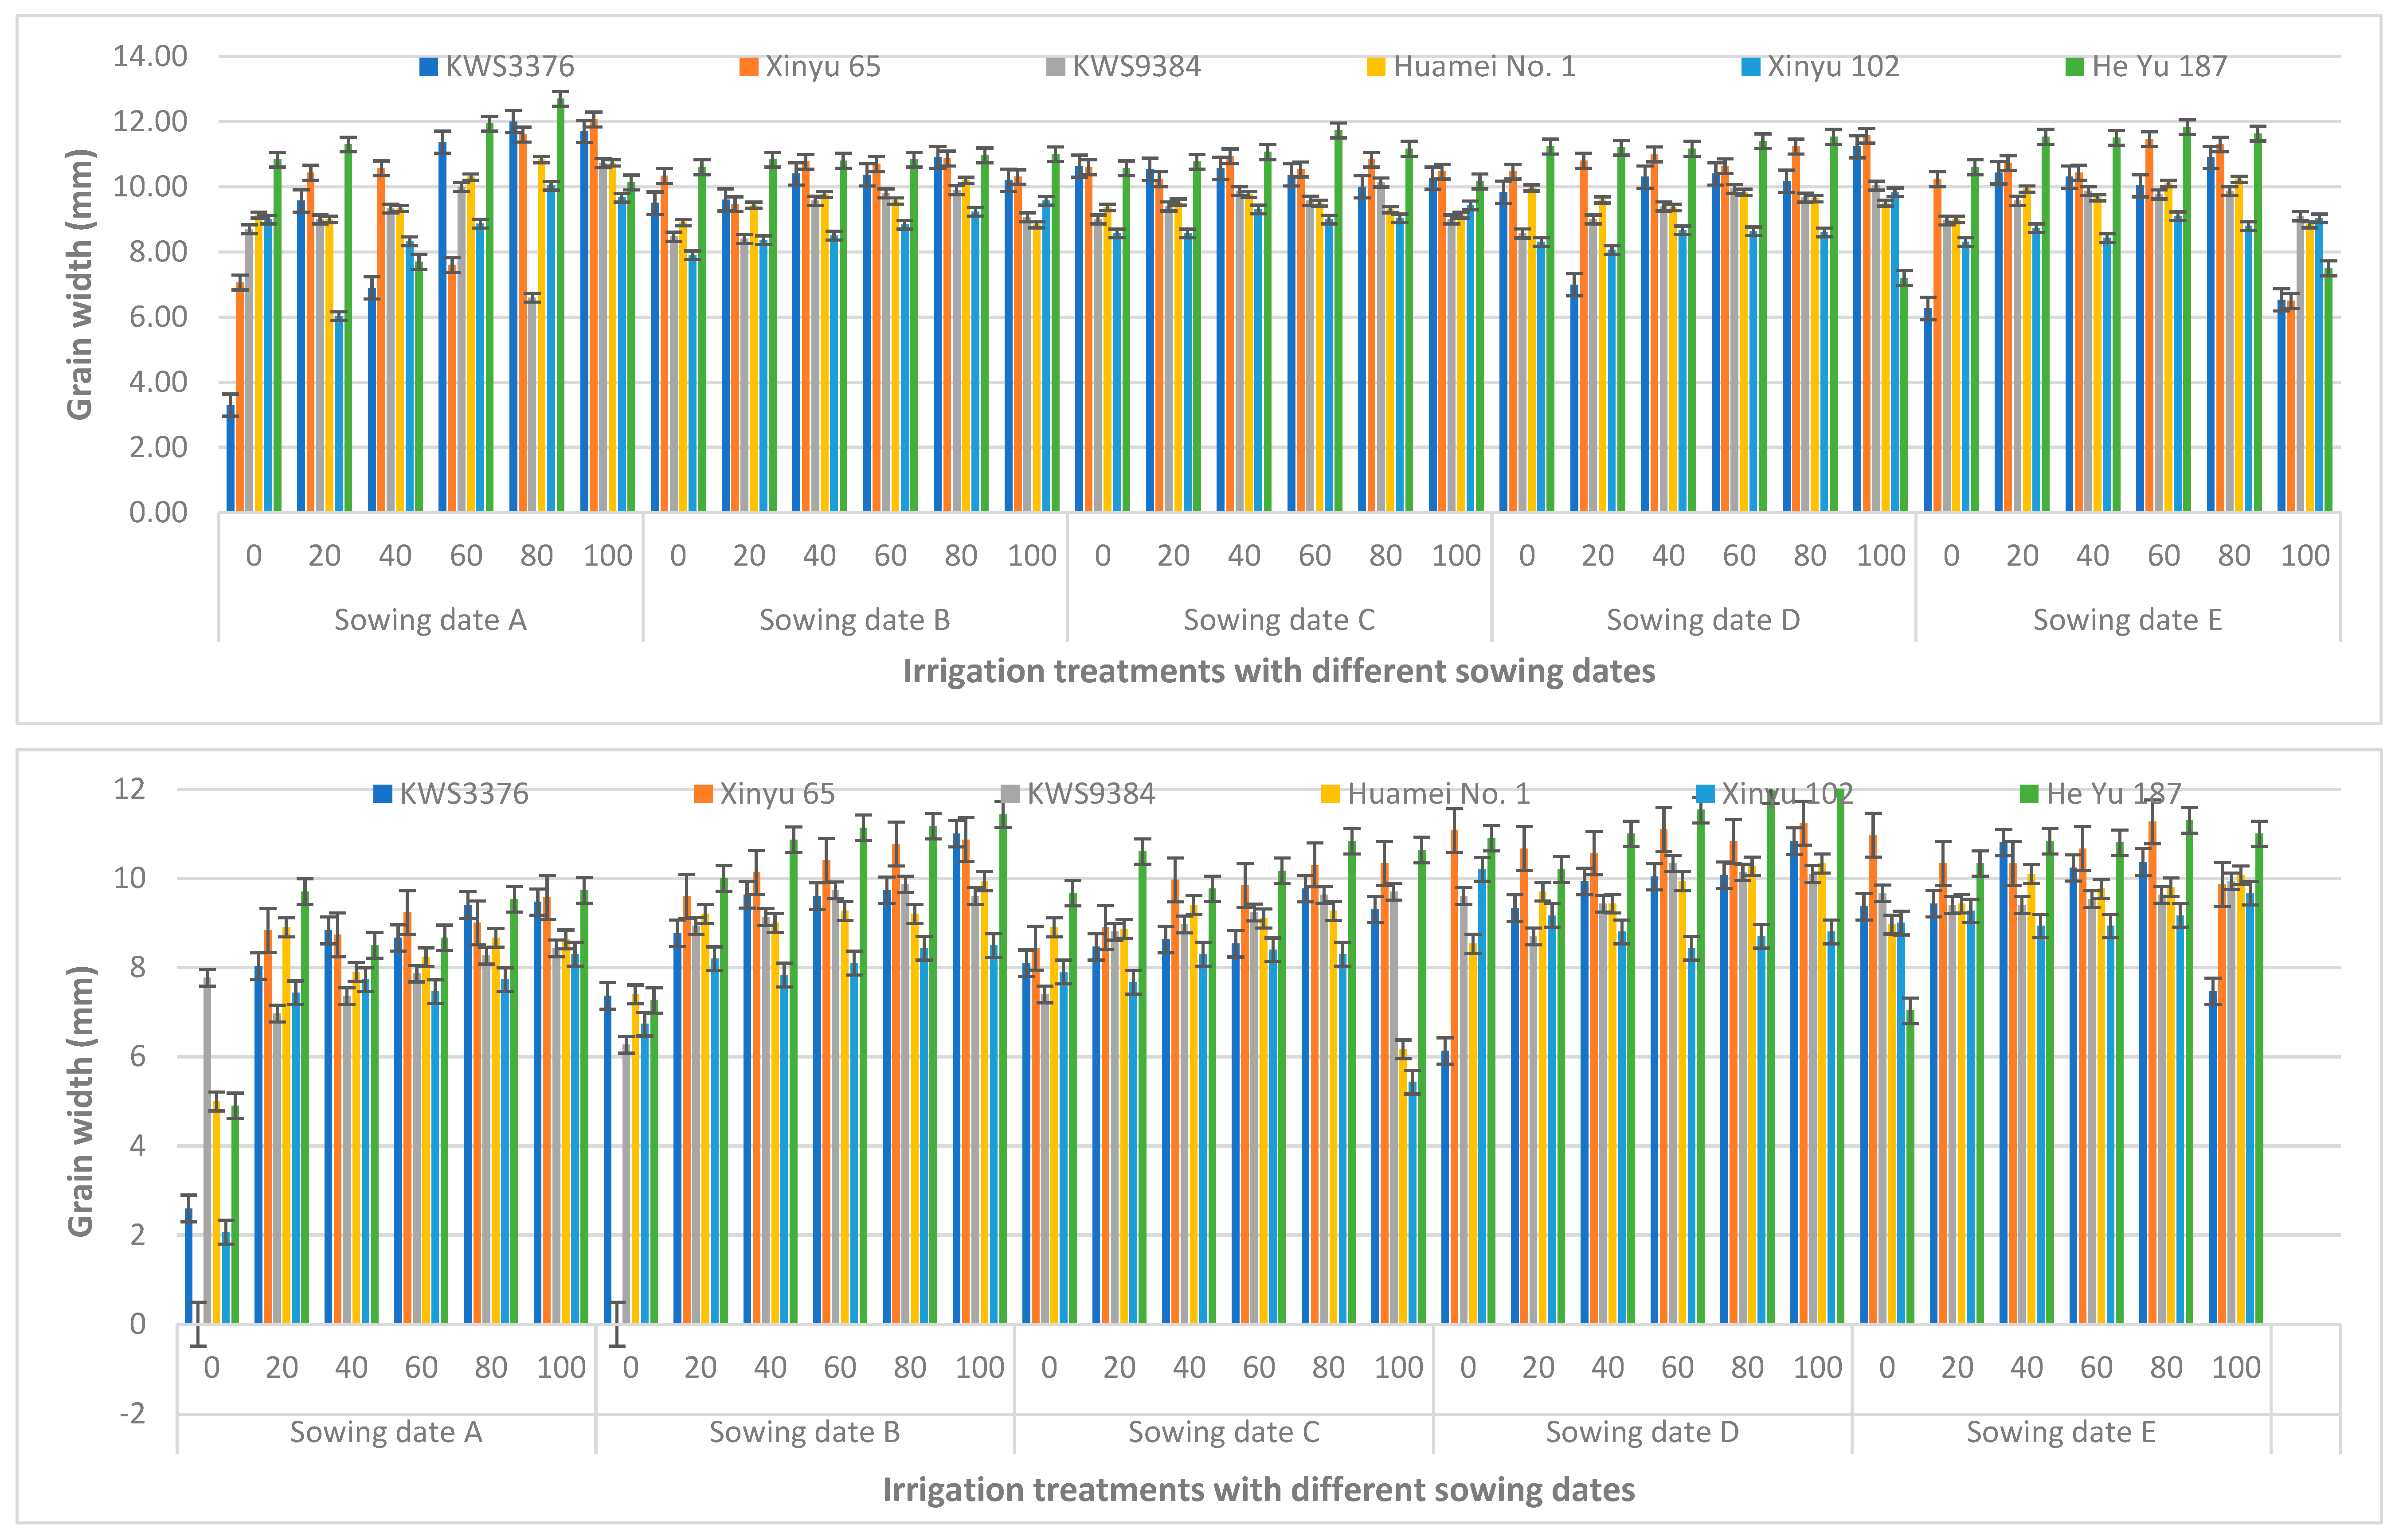
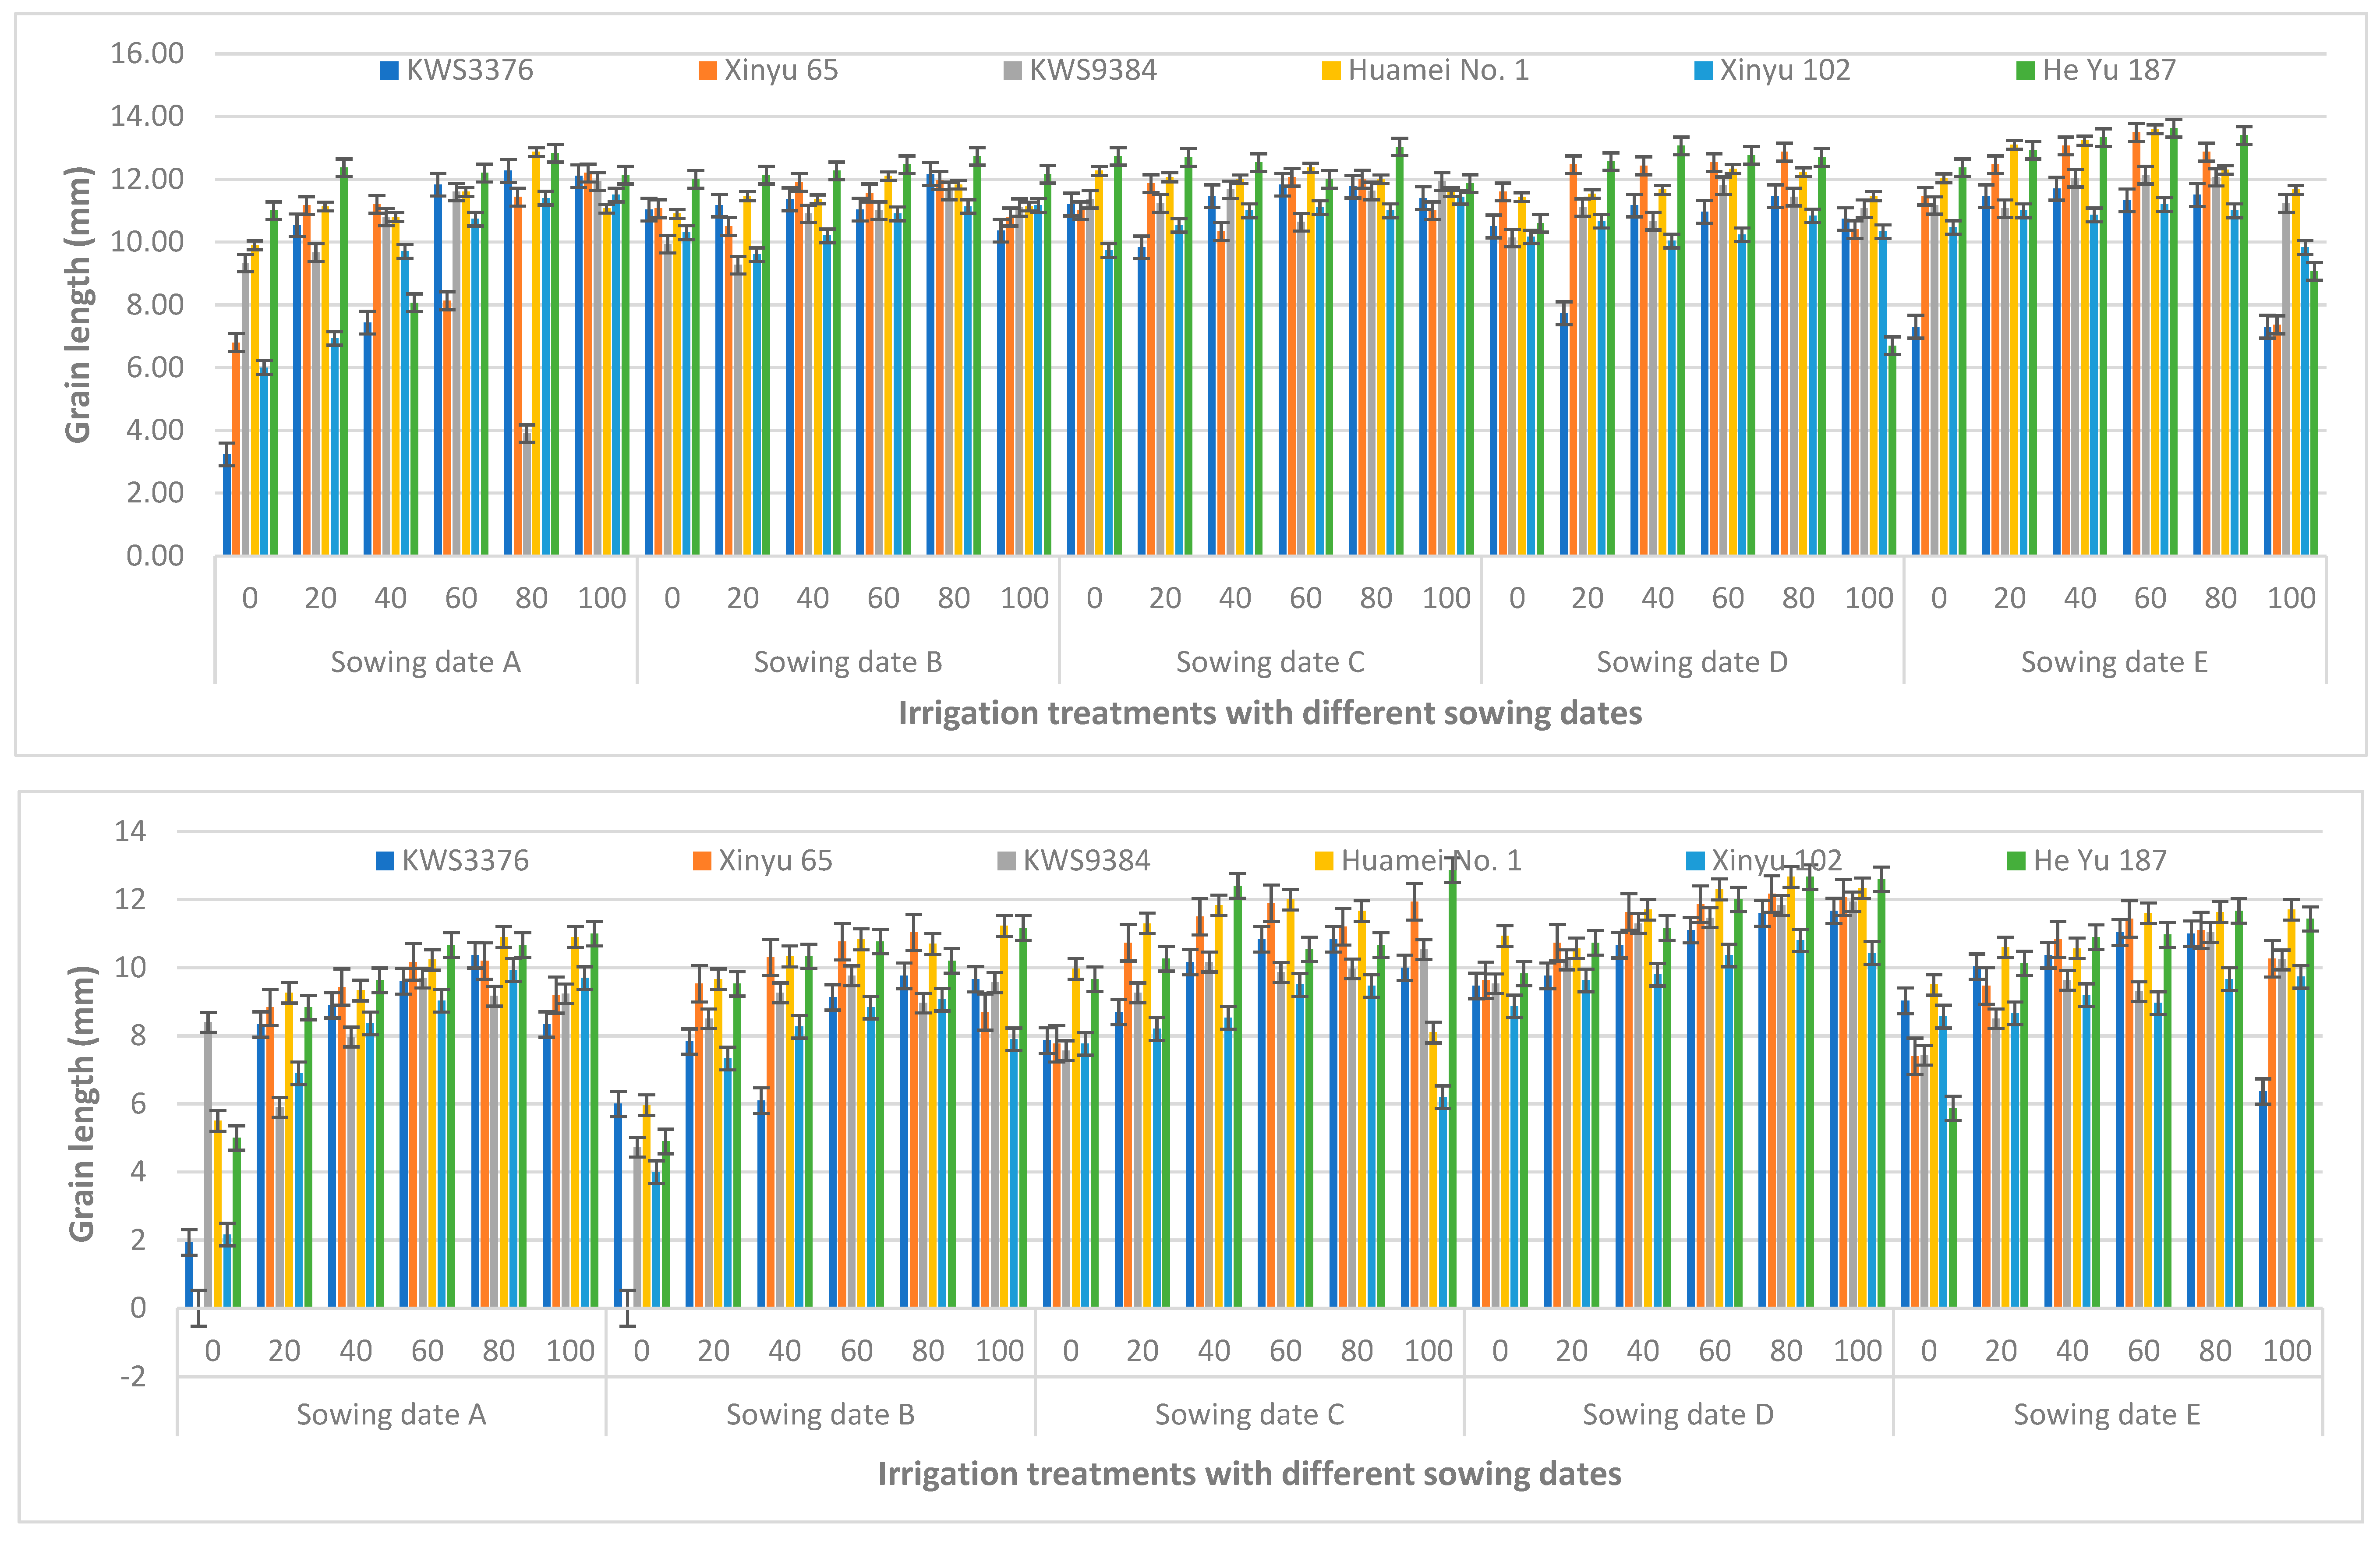
3.8. Number of Grains per Ear, Grain Width, Grain Thickness, Grain Length, and Hundred-Grain Weight

Grains per ear, grain width, grain thickness, grain length, and hundred-grain weight were significantly affected for all varieties of corn under different irrigation treatments on different sowing dates of both years (2021–2022) (Table 4). A maximum number of grains per ear was observed for Heyu 187 on sowing date E and 80% irrigation treatment, while the lowest number of grains per ear was observed on sowing date A for KWS3376 at 0% irrigation treatment (Figure 19). In 2022, the maximum number of grains per ear was seen for the Huamei No. 1 corn variety on sowing date A at 100% irrigation treatment, while the minimum number of grains per ear was observed at 0% irrigation treatment on sowing dates A and B for Xinyu 65 corn variety. Maximum grain width was observed for the Heyu 187 corn variety on sowing date A and 80% irrigation treatment in 2021, while minimum grain width was seen for the KWS3376 corn variety on sowing date A at 0% irrigation treatment (Figure 20). In 2022, maximum grain width was observed for Heyu 187 on sowing date D and 100% irrigation treatment, while minimum grain width was observed for Xinyu 65 on sowing dates A and B and 0% irrigation treatment. Maximum grain thickness was observed for Xinyu 65 on sowing date D and 0% irrigation treatment in 2021, while minimum grain thickness was seen for KWS3376 on sowing date A in 0% irrigation treatment. In 2022, maximum grain thickness was observed for Xinyu 65 on sowing date D at 0% irrigation treatment, while minimum grain thickness was observed for Xinyu 65 on sowing dates A and B and 0% irrigation treatment (Figure 21). Maximum hundred-grain weights were observed for Heyu 187 on sowing date E and 60% irrigation treatment, while the lowest hundred-grain weight was observed on sowing date A for KWS3376 and 0% irrigation treatment (Figure 22). In 2022, the maximum hundred-grain weight was seen for Huamei No. 1 on sowing date D and 80% irrigation treatment, while the minimum hundred-grain weight was observed in 0% irrigation treatment on sowing date A and B for Xinyu 65. Maximum grain length was observed for Heyu 187 on sowing date A and 80% irrigation treatment in 2021, while minimum grain length was seen for KWS3376 on sowing date A and 0% irrigation treatment. In 2022, maximum grain length was observed for Heyu 187 on sowing date D at 100% irrigation treatment, while minimum grain length was observed for Xinyu 65 on sowing dates A and B and 0% irrigation treatment (Figure 23).

4. Discussion

One of the main variables limiting maize crop output is the date of sowing, which is also a crucial component in yield determination as well as sustainable crop production. As a result, choosing the best time to plant is thought to be crucial to crop productivity, since planting dates are influenced by temperature, and a temperature rise shortens the length of the growing seasons [27,28].
Even though maize plants are vulnerable to the negative effects of climate change, such as high temperatures, precipitation, and CO2, temperature has a greater detrimental effect on crop output than other factors [29,30]. Furthermore, it has been demonstrated that higher mean temperatures shorten the time between the planting date and crop maturity because they speed up crop development. Although filling speeds up the process, the fill rate cannot make up for these temporal limitations, which lowers yields and biomass accumulation [31,32,33].
Kharazamshahi et al. [34] also reported taller and shorter plants for early and late sowing, respectively. Plant height is an important morphological characteristic that is governed, in part, by genes but also influenced by environmental conditions. A plant’s height is a reliable indicator of its level of vegetative maturity. The maximum height was seen for Xinyu 65 corn variety on sowing date A at a 100% irrigation treatment as compared to all other treatments in 2021. In 2022, Heyu 187 showed maximum height on sowing date C at 100% irrigation treatment. The lowest plant height was observed for the KWS9384 corn variety on sowing date A at 0% irrigation treatment in 2021, while Huame No.1 showed minimum plant height on sowing date B at 0% irrigation treatment. Hussain et al. [35] documented significant differences in hybrids regarding their plant height.
Our results are similar to those of Shah et al. [36] regarding small ears for delayed sowing. Maximum ear length was observed for Xinyu 65 on sowing date E followed by sowing date C (same variety) in 2021, while the lowest ear length was observed on sowing date A for the KWS3376 variety. In 2022, the maximum ear length was seen for KWS9384 on sowing date C, while the minimum ear length was observed on sowing dates A and B for the Xinyu 65. Maximum ear diameter was observed for Heyu 187 on sowing date E, while minimum ear diameter was seen for KWS3376 on sowing date A. Maximum ear area was observed for Xinyu 65 on sowing date E, followed by sowing date E for Huamei No. 1 in 2021, while lowest ear area was observed on sowing date A for KWS3376 corn; these results are close to those obtained by [37,38]. In 2022, the maximum ear area was seen for KWS9384 on sowing date C, while the minimum ear area was observed on sowing dates A and B for Xinyu 65. Buriro et al. [39] found differences in the ear length of maize hybrids and stated that genetic variations among hybrids might be the reason for the different ear lengths.
Ali et al. [40] reported fewer grains per spike when sowing was delayed. A maximum number of grains per ear was observed for Heyu 187 on sowing date E, while the lowest number of grains per ear was observed on sowing date A for the KWS3376 variety. In 2022, the maximum number of grains per ear was seen for the Huamei No. 1 variety on sowing date A, while the minimum number of grains per ear was observed on sowing dates A and B for the Xinyu 65 variety. Differences in rows per ear, ear length, ear diameter, and grains per row of different hybrids might be the reason for the differences in their grains (ear-1). Ali et al. [40] highlighted the difference in grains (ear-1) for different maize hybrids. Giunta et al. [41] stated that lower seed weight for late sowing is due to the low rate of grain development, with less assimilated translocation towards the sink. Shah et al. [36] also reported the same result for heavier and lighter grains for early and late sowing, respectively. Maximum grain weight was observed for He Yu 187 on sowing date E, while the lowest grain weight was observed on sowing date A for the KWS3376. In 2022, the maximum grain weight was seen for the Huamei No. 1 variety on sowing date D, while minimum grain weight was observed on sowing dates A and B for the Xinyu 65 variety. Differences in the genetic makeup of hybrids can indeed be a significant factor contributing to variation in the green weight of the hybrids. The genetic composition of a plant determines its growth characteristics, including traits related to biomass production such as leaf area, stem diameter, and overall plant size. Hybrids are often created by crossing two genetically distinct parent plants to combine the desirable traits of each. These traits can include factors that influence biomass production, such as photosynthetic efficiency, nutrient uptake, and growth rate. The genetic variability introduced through hybridization can result in differences in biomass accumulation among hybrid plants. Additionally, genetic factors can interact with environmental conditions to influence biomass production. For example, hybrids with genetic traits that enhance drought tolerance may outperform others in arid conditions, leading to differences in green weight under water-limited conditions. It is important to note that while genetic factors play a significant role in determining biomass production, environmental factors such as soil quality, temperature, water availability, and light intensity also play crucial roles. The interaction between genetic and environmental factors ultimately determines the green weight and overall performance of hybrid plants. Jing et al. [42] documented that the different hybrids, due to genetic variation, contain different grain weights. Sowing time, however, significantly affects grain weight but it can be compensated with a good hybrid selection. Ali et al. [40] recorded lower grain yield for delayed sowing.
The findings showed that increasing irrigation rates improve corn output. Since the yield characteristics were improved and in line with the results of [43,44,45], we assumed that this was the cause. Also, we concluded that when maize plants were exposed to water stress during the fall season, several interrelated factors could partially mitigate the effects of these conditions. For example, the plants were exposed to water stress for a relatively short period when the sowing date was moved from the middle of March to the middle of September. This allowed the plants to withstand the negative effects of the water shortage by developing an escape strategy that was based on their ability to complete their life cycle after being exposed to water stress as long as it did not surpass the critical point. Because they can adjust their reproductive and vegetative characteristics by the most advantageous phase, plants, in this instance, did not have a water deficit, which is consistent with [46]. Additionally, planting maize seeds in the fall helps to shorten the growing season, which lasts roughly 100–110 days. On the other hand, sowing maize seeds in the spring extends the growing season to 135–140 days. These explanations are supported by maize’s inherent capacity to withstand brief episodes of water stress, which keeps yield profitability at reasonable levels in the fall. These results are consistent with the study conducted by Kulczycki et al. [47].

5. Conclusions

In the context of ongoing climatic changes, adopting a strategy of planting maize seeds with varying irrigation water requirements shows promise in achieving optimal growth characteristics, maximizing grain yields, and improving irrigation water use efficiency. This approach is particularly beneficial in mitigating the impacts of water stress and conserving significant amounts of irrigation water, especially in drought-prone conditions. The experiment’s results suggest that early sowing in the season resulted in higher grain and biological yields compared to later sowing dates. Furthermore, among the selected maize hybrids, Xinyu 65 demonstrated a higher grain yield. Therefore, it is recommended to sow the maize hybrid Xinyu 65 early in the season to achieve a higher maize yield.

Author Contributions

C.L. designed the research. H.T., X.X. and L.Z. performed the experiments. H.T. analyzed the data and wrote the manuscript. C.L. edited the manuscript. All authors have read and agreed to the published version of the manuscript.

Funding

This research was funded by Xinjiang Uygur Autonomous Region key research and development Program Project, funding number 2022B02001-4; Special project for the basic scientific activities of non-profit institutes supported the government of the Xinjiang Uyghur Autonomous Region, funding number ky2021126; the Xinjiang Agriculture Research System, funding number XJARS-02; and the 14th Five-year National Key Research and Development Program Project, funding number 2021YFD1200703.

Institutional Review Board Statement

Not applicable.

Informed Consent Statement

Not applicable.

Data Availability Statement

Data will be provided on demand.

Acknowledgments

We are thankful that non-profit institutions supported the Government of Xinjiang for providing a project.

Conflicts of Interest

The authors declare no conflicts of interest.

References

  1. Ceglar, A.; Toreti, A. Seasonal climate forecast can inform the European agricultural sector well in advance of harvesting. npj Clim. Atmos. Sci. 2021, 4, 42. [Google Scholar] [CrossRef]
  2. Ciais, P.; Reichstein, M.; Viovy, N.; Granier, A.; Ogee, J.; Allard, V.; Aubinet, M.; Buchmann, N.; Bernhofer, C.; Carrara, A.; et al. Europe-wide reduction in primary productivity caused by the heat and drought in 2003. Nature 2005, 437, 529–533. [Google Scholar] [CrossRef] [PubMed]
  3. Lesk, C.; Anderson, W.; Rigden, A.; Coast, O.; Jägermeyr, J.; McDermid, S.; Davis, K.F.; Konar, M. Compound heat and moisture extreme impacts on global crop yields under climate change. Nat. Rev. Earth Environ. 2022, 3, 872–889. [Google Scholar] [CrossRef]
  4. Hussain, H.A.; Saddam, H.; Abdul, K.; Umair, A.; Anjum, S.A.; Shengnan, M.; Longchang, W. Chilling and drought stresses in crop plants: Implications, cross talk, and potential management opportunities. Front. Plant Sci. 2018, 9, 393–414. [Google Scholar] [CrossRef] [PubMed]
  5. Ostmeyer, T.; Parker, N.; Jaenisch, B.; Alkotami, L.; Bustamante, C.; Jagadish, K.S. Impacts of heat, drought, and their interaction with nutrients on physiology, grain yield, and quality in field crops. Plant Physiol. Rep. 2020, 25, 549–568. [Google Scholar] [CrossRef]
  6. Li, Y.; Guan, K.; Peng, B.; Franz, T.E.; Wardlow, B.; Pan, M. Quantifying irrigation cooling benefits to maize yield in the US Midwest. Glob. Chang. Biol. 2020, 26, 3065–3078. [Google Scholar] [CrossRef] [PubMed]
  7. Christian, J.I.; Basara, J.B.; Hunt, E.D.; Otkin, J.A.; Xiao, X. Flash drought development and cascading impacts associated with the 2010 Russian heatwave. Environ. Res. Lett. 2020, 15, 094078. [Google Scholar] [CrossRef]
  8. Xia, J.; Chen, J.; She, D. Impacts and countermeasures of extreme drought in the Yangtze River Basin in 2022. J. Hydraul. Eng. 2022, 53, 1143–1153. [Google Scholar]
  9. Liu, X.; Yuan, X.; Ma, F.; Xia, J. The increasing risk of energy droughts for hydropower in the Yangtze River basin. J. Hydrol. 2023, 621, 129589. [Google Scholar] [CrossRef]
  10. Lesk, C.; Anderson, W. Decadal variability modulates trends in concurrent heat and drought over global croplands. Environ. Res. Lett. 2021, 16, 055024. [Google Scholar] [CrossRef]
  11. Cohen, I.; Zandalinas, S.I.; Huck, C.; Fritschi, F.B.; Mittler, R. Meta-analysis of drought and heat stress combination impact on crop yield and yield components. Physiol. Plant. 2021, 171, 66–76. [Google Scholar] [CrossRef]
  12. He, Y.; Fang, J.; Shi, P. Substantial increase of compound droughts and heatwaves in wheat growing seasons worldwide. Int. J. Climatol. 2022, 42, 5038–5054. [Google Scholar] [CrossRef]
  13. Zhang, Q.; Yao, Y.; Wang, Y.; Wang, S.; Wang, J.; Yang, J.; Wang, J.; Li, Y.; Shang, J.; Li, W. Characteristics of drought in southern china under climatic warming, the risk, and countermeasures for prevention and control. Theor. Appl. Climatol. 2018, 136, 1157–1173. [Google Scholar] [CrossRef]
  14. Ren, Y.; Yue, P.; Zhang, Q.; Liu, X. Influence of land surface aridification on regional monsoon precipitation in East Asian summer monsoon transition zone. Theor. Appl. Climatol. 2021, 144, 93–102. [Google Scholar] [CrossRef]
  15. Wu, T.; Li, B.; Lian, L.; Zhu, Y.; Chen, Y. Assessment of the combined risk of drought and high-temperature heat wave events in the North China Plain during summer. Remote Sens. 2022, 14, 4588. [Google Scholar] [CrossRef]
  16. Luan, X.; Bommarco, R.; Scaini, A.; Vico, G. Combined heat and drought suppress rainfed maize and soybean yields and modify irrigation benefits in the USA. Environ. Res. Lett. 2021, 16, 064023. [Google Scholar] [CrossRef]
  17. Ray, D.K.; Gerber, J.S.; Macdonald, G.K.; West, P.C. Climate variation explains a third of global crop yield variability. Nat. Commun. 2015, 6, 5989. [Google Scholar] [CrossRef] [PubMed]
  18. Widmann, C.M.A.M.; Widmann, M.; Bevacqua, E.; Loon, A.F.V.; Maraun, D.; Vrac, M. Soil moisture drought in Europe: A compound event of precipitation and potential evapotranspiration on multiple time scales. J. Hydrometeorol. 2018, 19, 1255–1271. [Google Scholar]
  19. Dikšaitytė, A.; Viršilė, A.; Žaltauskaitė, J.; Januškaitienė, I.; Praspaliauskas, M.; Pedišius, N. Do plants respond and recover from a combination of drought and heatwave in the same manner under adequate and deprived soil nutrient conditions? Plant Sci. 2020, 291, 110333. [Google Scholar] [CrossRef]
  20. Dash, A.P.; Lenka, D.; Tripathy, S.K.; Swain, D.; Lenka, D. Character association and path analysis of grain yield and its components in Maize (Zea mays L.) under heat stress. Int. J. Curr. Microbiol. Appl. Sci. 2020, 9, 2750–2758. [Google Scholar] [CrossRef]
  21. Yang, X.; Lu, M.; Wang, Y.; Wang, Y.; Liu, Z.; Chen, S. Response mechanism of plants to drought stress. Horticulturae 2021, 7, 50. [Google Scholar] [CrossRef]
  22. Noor, J.J.; Vinayan, M.T.; Umar, S.; Devi, P.; Iqbal, M.; Seetharam, K.; Zaidi, P.H. Morpho-physiological traits associated with heat stress tolerance in tropical maize (Zea mays L.) at reproductive stage. Aust. J. Crop Sci. 2019, 13, 536–545. [Google Scholar] [CrossRef]
  23. Yan, Z.; Liu, D.; Jia, X.; Yang, Q.; Chen, Y.; Dong, P.; Wang, Q. Maize Tassel Development, Physiological Traits and Yield Under Heat and Drought Stress During Flowering Stage. Sci. Agric. Sin. 2021, 54, 3592–3608. [Google Scholar]
  24. Brás, T.A.; Seixas, J.; Carvalhais, N.; Jgermeyr, J. Severity of drought and heatwave crop losses tripled over the last five decades in Europe. Environ. Res. Lett. 2021, 16, 065012. [Google Scholar] [CrossRef]
  25. Leng, G. Maize yield loss risk under droughts in observations and crop models in the United States. Environ. Res. 2021, 16, 024016. [Google Scholar] [CrossRef]
  26. Li, E.; Zhao, J.; Pullens, J.W.M.; Yang, X. The compound effects of drought and high-temperature stresses will be the main constraints on maize yield in Northeast China. Sci. Total Environ. 2022, 812, 152461. [Google Scholar] [CrossRef] [PubMed]
  27. Harrison, L.; Michaelsen, J.; Funk, C.; Husak, G. Effects of temperature changes on maize production in Mozambique. Clim. Res. 2011, 46, 211–222. [Google Scholar] [CrossRef]
  28. Ahmad, I.; Wajid, S.A.; Ahmad, A.; Cheema, M.J.M.; Judge, J. Assessing the impact of thermo-temporal changes on the productivity of spring maize under semi-arid environment. Int. J. Agric. Biol. 2018, 20, 2203–2210. [Google Scholar]
  29. Ottman, M.J.; Kimball, B.A.; White, J.W.; Wall, G.W. Wheat growth response to increased temperature from varied planting dates and supplemental infrared heating. Agron. J. 2012, 104, 7–16. [Google Scholar] [CrossRef]
  30. Wheeler, T.; Von Braun, J. Climate change impacts on global food security. Science 2013, 341, 508–513. [Google Scholar] [CrossRef] [PubMed]
  31. Dias, A.S.; Lidon, F.C. Evaluation of grain filling rate and duration in bread and durum wheat, under heat stress after anthesis. J. Agron. Crop Sci. 2009, 195, 137–147. [Google Scholar] [CrossRef]
  32. Wang, J.; Wang, E.; Luo, Q.; Kirby, M. Modelling the sensitivity of wheat growth and water balance to climate change in Southeast Australia. Clim. Chang. 2009, 96, 79–96. [Google Scholar] [CrossRef]
  33. Asseng, S.; Foster, I.A.N.; Turner, N.C. The impact of temperature variability on wheat yields. Glob. Chang. Biol. 2011, 17, 997–1012. [Google Scholar] [CrossRef]
  34. Kharazmshahi, H.A.; Zahedi, H.; Alipour, A. Effects of sowing date on yield and yield components in sweet maize (Zea mays L.) hybrids. Biol. Forum Int. J. 2015, 7, 835–840. [Google Scholar]
  35. Hussain, N.; Zaman, Q.; Nadeem, M.A.; Aziz, A. Response of maize varieties under agroecological conditions of Dera Ismail Khan. J. Agric. Res. 2010, 48, 59–63. [Google Scholar]
  36. Shah, A.; Akmal, M.; Asim, M.; Farhatullah; Raziuddin; Rafi, A. Maize growth and yield in Peshawar under changing climate. Pak. J. Bot. 2012, 44, 1933–1938. [Google Scholar]
  37. Hassaan, M.A. Response of some yellow maize hybrids (Zea mays L.) to sowing date under Toshka conditions. J. Plant Produc. 2018, 9, 509–514. [Google Scholar] [CrossRef]
  38. Abaza, A.S.D. Effect of Irrigation Water Levels, Flter Mud Cake Application and Sowing DATES on maize Production under Tushka Conditions. Ph.D. Thesis, Faculty of Agriculture/Assiut University, El Fateh, Egypt, 2021. [Google Scholar]
  39. Buriro, M.; Bhutto, T.A.; Gandahi, A.W.; Kumbhar, I.A.; Shar, M.U. Effect of sowing dates on growth, yield and grain quality of hybrid maize. J. Basic Appl. Sci. 2015, 11, 553–558. [Google Scholar] [CrossRef]
  40. Ali, S.; Inamullah; Jan, A.; Din, M.; Habibullah, M. Yield response of maize (Zea mays L.) hybrids sown on various dates during kharif in Peshawar-Pakistan. J. Environ. Earth Sci. 2015, 5, 13–17. [Google Scholar]
  41. Giunta, F.; Prunddu, G.; Motzu, R. Radiation interception and biomass and nitrogen. Field Crops Res. 2009, 110, 76–84. [Google Scholar] [CrossRef]
  42. Jing, Q.; Bingwv, W.; Yong, M. A study on comprehensive evaluation of maize hybrids. J. Jilin Agric. Univ. 2003, 25, 139–142. [Google Scholar]
  43. Atta, Y.I. Improving growth, yield and water productivity of some maize cultivars by new planting method. Egypt J. Appl. Sci. 2007, 22, 1–16. [Google Scholar]
  44. Rekaby, S.A.; Eissa, M.A.; Hegab, S.A.; Ragheb, H.M. Effect of water stress on maize grown under drip irrigation system. Assiut J. Agric. Sci. 2017, 48, 1110–1486. [Google Scholar]
  45. Wang, F.; Xue, J.; Xie, R.; Ming, B.; Wang, K.; Hou, P.; Zhang, L.; Li, S. Assessing growth and water productivity for drip-irrigated maize under high plant density in arid to semi-humid climates. Agriculture 2022, 12, 97. [Google Scholar] [CrossRef]
  46. De Micco, V.; Aronne, G.R. Morpho-anatomical traits for plant adaptation to drought. In Plant Responses to Drought Stress; Aroca, R., Ed.; Springer: Berlin/Heidelberg, Germany, 2012. [Google Scholar] [CrossRef]
  47. Kulczycki, G.; Sacała, E.; Chohura, P.; Załuska, J. Maize and wheat response to drought stress under varied sulphur fertilisation. Agronomy 2022, 12, 1076. [Google Scholar] [CrossRef]
Figure 1. Geographical location map and the layout map of the test site.
Sustainability 16 04571 g001
Figure 2. Impact of irrigation treatments and sowing dates on days to tasseling across various maize varieties in both years (2021–2022).
Sustainability 16 04571 g002
Figure 3. Impact of irrigation treatments and sowing dates on days to anthesis across various maize varieties in both years (2021–2022).
Sustainability 16 04571 g003
Figure 4. Impact of irrigation treatments and sowing dates on days to silking across various maize varieties in both years (2021–2022).
Sustainability 16 04571 g004
Figure 5. Impact of irrigation treatments and sowing dates on ASI across various maize varieties in both years (2021–2022).
Sustainability 16 04571 g005
Figure 6. Impact of irrigation treatments and sowing dates on plant height across various maize varieties in both years (2021–2022).
Sustainability 16 04571 g006
Figure 7. Impact of irrigation treatments and sowing dates on ear height across various maize varieties in both years (2021–2022).
Sustainability 16 04571 g007
Figure 8. Impact of irrigation treatments and sowing dates on tassel branch across various maize varieties in both years (2021–2022).
Sustainability 16 04571 g008
Figure 9. Impact of irrigation treatments and sowing dates on tassel length across various maize varieties in both years (2021–2022).
Sustainability 16 04571 g009
Figure 10. Impact of irrigation treatments and sowing dates on leaf length across various maize varieties in both years (2021–2022).
Sustainability 16 04571 g010
Figure 11. Impact of irrigation treatments and sowing dates on leaf width across various maize varieties in both years (2021–2022).
Sustainability 16 04571 g011
Figure 12. Impact of irrigation treatments and sowing dates on grain row number across various maize varieties in both years (2021–2022).
Sustainability 16 04571 g012
Figure 13. Impact of irrigation treatments and sowing dates on single ear weight across various maize varieties in both years (2021–2022).
Sustainability 16 04571 g013
Figure 14. Impact of irrigation treatments and sowing dates on ear length across various maize varieties in both years (2021–2022).
Sustainability 16 04571 g014
Figure 15. Impact of irrigation treatments and sowing dates on ear diameter across various maize varieties in both years (2021–2022).
Sustainability 16 04571 g015
Figure 16. Impact of irrigation treatments and sowing fates on ear area across various maize varieties in both years (2021–2022).
Sustainability 16 04571 g016
Figure 17. Impact of irrigation treatments and sowing dates on bald tip across various maize varieties in both years (2021–2022).
Sustainability 16 04571 g017
Figure 18. Impact of irrigation treatments and sowing dates on hole percentage across various maize varieties in both years (2021–2022).
Sustainability 16 04571 g018
Figure 19. Impact of irrigation treatments and sowing dates on number of grains per ear across various maize varieties in both years (2021–2022).
Sustainability 16 04571 g019
Figure 20. Impact of irrigation treatments and sowing dates on grain width across various maize varieties in both years (2021–2022).
Sustainability 16 04571 g020
Figure 21. Impact of irrigation treatments and sowing dates on grain thickness across various maize varieties in both years (2021–2022).
Sustainability 16 04571 g021
Figure 22. Impact of irrigation treatments and sowing dates on thousand grain weight across various maize varieties in both years (2021–2022).
Sustainability 16 04571 g022
Figure 23. Impact of irrigation treatments and sowing dates on grain length across various maize varieties in both years (2021–2022).
Sustainability 16 04571 g023
Table 1. Irrigation plans for 30 treatments (m3/ha).
Sowing Date
Deal with
Moisture
Deal with
Watering Time
EmergenceJointing StageSmall Trumpet MouthBig Trumpet MouthFlowering PeriodEarly GroutingGroutingGrouting End
AWater 1675675675675675675675675
Water 2675540540540540540540540
Water 3675405405405405405405405
Water 4675270270270270270270270
Water 5675135135135135135135135
Water 66750000000
BWater 1675675675675675675675675
Water 2675540540540540540540540
Water 3675405405405405405405405
Water 4675270270270270270270270
Water 5675135135135135135135135
Water 66750000000
CWater 1675675675675675675675675
Water 2675540540540540540540540
Water 3675405405405405405405405
Water 4675270270270270270270270
Water 5675135135135135135135135
Water 66750000000
DWater 1675675675675675675675675
Water 2675540540540540540540540
Water 3675405405405405405405405
Water 4675270270270270270270270
Water 5675135135135135135135135
Water 66750000000
EWater 1675675675675675675675675
Water 2675540540540540540540540
Water 3675405405405405405405405
Water 4675270270270270270270270
Water 5675135135135135135135135
Water 66750000000
A = 21 April sowing date; B = 26 April sowing date; C = 6 May sowing date; D = 16 May sowing date; E = 26 May sowing date. Water 1 = 100% (5400 m3/ha); Water 2 = 80% (4455 m3/ha); Water 3 = 60% (3510 m3/ha); Water 4 = 40% (2565 m3/ha); Water 5 = 20% (1620 m3/ha); Water 6 = 0% (675 m3/ha).
Table 2. Effect of temperature on sowing period, flowering period, and harvesting period of maize crop.
Seeding TreatmentSowing Period and TemperatureExpected Flowering Period and TemperatureExpected Harvest Period and Temperature
Sowing PeriodSmallestAverageMaximumFlowering PeriodSmallestAverageMaximumHarvest PeriodSmallestAverageMaximum
Broadcast date 1April 214.311.919.5June 2718.125.733.3September 412.920.528.1
Broadcast period 2April 265.713.320.9July 118.426.033.6September 7th12.319.927.5
Sowing season 3May 6th8.516.123.7July 718.726.333.9September 15th10.418.025.6
Sowing season 4May 16th11.118.726.3July 14th18.926.534.1September 27th7.214.822.4
Sowing season 5May 2613.320.928.5July 2118.826.434.0October 132.510.117.7
May 3114.422.029.6July 2518.626.233.8Can’t mature
Different colors represent different temperatures during the five different sowing periods, flowering periods, and harvest periods. The darker the color shown, higher the temperature.
Table 3. Measurement of soil moisture contents in both years (2021–2022) at different depths during maize crop planting.
Sowing DatesSoil Depth (2021)
100 mm200 mm300 mm400 mm600 mm1000 mm
A15.61918.50424.15834.55434.25440.212
B16.43819.78524.17327.68533.38533.123
C11.66916.10820.78131.98532.820.646
D13.06216.425.53528.1538.10434.612
E13.56919.95415.44619.74236.83836.381
Soil Depth (2022)
A6.484.00679.393311.28722.2222.207
B5.95332.393313.8817.33316.2431.107
C9.963.9816.01316.76723.5227.273
D4.482.127.553321.57335.78737.96
E10.384.488.573310.77335.7240.773
Table 4. Analysis of variance for different attributes of maize/corn, including varieties, sowing dates, and irrigation treatments.
Parameters VarSowVar × SowVar × IrriSow × IrriVar × Sow × Irri
Days to tasseling**************
Days to anthesis**************
Days to silking****************
ASI
Plant height************NA
Ear height**************
Tassel branch**************
Tassel length**************
Leaf length****************
Leaf width**************
Grain row number**************
Single ear weight**************
Ear length**************
Ear diameter**************
Ear area**************
Bald tip****************
Hole percentage **************
Number of grains per ear**************
Grain width****************
Grain thickness**************
Hundred grain weight**************
Grain length**************
Var = varieties; Sow = sowing dates; Irri = irrigations; **, *** = highly significant; NA = non-significant.
Disclaimer/Publisher’s Note: The statements, opinions and data contained in all publications are solely those of the individual author(s) and contributor(s) and not of MDPI and/or the editor(s). MDPI and/or the editor(s) disclaim responsibility for any injury to people or property resulting from any ideas, methods, instructions or products referred to in the content.

