Article

The Coupling Mechanism between Railway Alignment Design and Resource Environment in the Southwestern Mountainous Areas of China

School of Civil Engineering, Lanzhou Jiaotong University, Lanzhou 730070, China
*
Authors to whom correspondence should be addressed.
Sustainability 2024, 16(11), 4572; https://doi.org/10.3390/su16114572
Submission received: 14 April 2024 / Revised: 19 May 2024 / Accepted: 20 May 2024 / Published: 28 May 2024
(This article belongs to the Section Sustainable Engineering and Science)

Abstract

:
Faced with the characteristics of multifactor coupling and interweaving along the railway lines in the southwestern mountainous areas of China, researching the coupling mechanism and optimizing the collaborative development path between alignment designs and the resource environment is conducive to promoting the green and sustainable development of railways in these southwestern mountainous areas. In this study, first, regarding the environmental characteristics of engineering along the railway lines in the southwestern mountainous area, the key elements of the interaction and coercion between the alignment design (internal system) and the resource environment (external system) are identified, and the interactive impact mechanism of the “alignment design–resource environment” complex is revealed. Accordingly, a nonlinear coupling mechanism between the alignment design system and the resource environment system is established using the deviation coefficient coupling degree model. Second, from a methodological perspective, following a technical path of “analyzing the coercive effects of internal and external factors–identifying coupling relationships–discovering coupling laws–screening driving factors–proposing optimization plans–achieving collaborative development goals”, we propose an overall optimization plan to solve the problem. Finally, the Chengdu Changdu section of the X railway, which is located in a southwestern mountainous area, is taken as an example for this study. The results indicate that if the state of the external system of the KL scheme is continuously improved through the regulation of the u22 (crossing the ecological protection red line length), u23 (biodiversity impact), and u24 (ecosystem impact) indicators and that the internal structure of the line design is improved by optimizing the l12 (total length of bridges and tunnels) and l13 (number of stations) indicators, effectively driving the improvement in the u31 (land resource occupation) and u43 (land development intensity) indicators, the alignment design and resource environment will exhibit a mutually reinforcing coupling evolution trend and ultimately achieve an “alignment design–resource environment” composite system with higher quality coupling.

1. Introduction

1.1. Background

The construction of high-speed railways in the southwestern mountainous areas is not only a major demand for China to “fill gaps” and “benefit people’s livelihoods” but also an important measure to promote development in the western part of the country [1]. The total length of high-speed railway projects included in medium- and long-term railway network planning in this area is approximately 15,000 km, with many of these projects being the subjects of previous studies [2].
At present, important issues facing railway development are as follows: implementing the spirit of the 20th National Congress of the CPC, adhering to ecological priorities, implementing conservation and intensification, promoting green railway development, and promoting the harmonious coexistence of railways and resources and the environment. The Southwest Mountain Railway Project is located in the “Qinghai Tibet Plateau Ecological Barrier” and “Loess Plateau Sichuan Yunnan Ecological Barrier” areas which are included in China’s ecological security strategy pattern, which mainly consists of the “Qinghai Tibet Plateau Biological Barrier”, “Loess Plateau Sichuan Yunnan Ecological Barrier”, “Northeast Forest Belt”, “Northern Sand Prevention Belt”, and “Southern Hilly and Mountainous Areas”. The terrain and geological conditions along the railway line are complex, and environmentally sensitive areas are densely intertwined [3]. Furthermore, from an engineering design perspective, facilitating the green and sustainable development of mountain railways is extremely challenging. Route selection is an important task in railway planning and design and is the primary strategy for guiding railways to achieve green and sustainable development. When faced with the characteristics of multifactor coupling and interweaving along the railway line in the southwestern mountainous areas, a major difficulty currently faced by the academic community and government decision-making departments is determining how to coordinate the relationship between alignment design and the resource environment; moreover, these are the issues that we are generally concerned about and urgently need to solve.

1.2. Literature Review

Many scholars have conducted specialized research on the design of railway lines based on the environmental characteristics of engineering along the railway lines in the southwestern mountainous areas. For instance, Wan et al. established a linear optimization model based on dominant terrain recognition to address the significant terrain height differences in the southwestern mountainous areas [4]. Song et al. incorporated the layout of large-scale auxiliary construction projects such as tunnel shafts and passages into the alignment design process to overcome the rugged terrain of the southwestern mountainous areas [5]. Pu et al. and Song et al. established a double-objective linear optimization model considering cost and geological hazards for the complex geological structures in the southwestern mountainous areas [6]. Furthermore, Deng et al. proposed an optimization method for railway routes within the vicinity of marine glaciers to prevent the marine glaciers in the southwestern region of China from posing a threat to railway subgrade facilities [7]. Song et al. established a railway alignment optimization model based on quantitative seismic risk assessment to reduce the seismic risk caused by plate activity in the southwestern mountainous areas [8]. Song et al. established a net present value model for railway alignment risk avoidance to balance construction investment and earthquake risk [9].
According to the current research status of railway alignment design in the southwestern mountainous areas, most of the existing achievements focus on “terrain route selection”, “geological route selection”, and “disaster reduction route selection” as the core design concepts, with a focus on engineering safety risks. For issues such as the ecological environment and protecting biodiversity along railway lines, research has focused primarily on the ecological environmental impact and ecological sensitivity evaluation induced by route selection [2,10,11]. There is limited theoretical and in-depth research on the interaction between alignment design and the resource environment [12,13]. However, the southwestern mountainous area has large terrain undulations, complex geological structures, frequent mountain disasters [14], densely intertwined environmentally sensitive areas, a wide range of ecological protection red lines, and diverse water environment functions. The environmental feasibility and biodiversity protection of railway projects have become major project implementation constraints. Therefore, there is objectively a very complex coercive relationship between alignment design and the resource environment. Thus, drawing on specialized research related to railway alignment design methods [15,16,17] and studying the interaction mechanisms and collaborative development optimization path between alignment design and the resource environment is a technical restriction as well as the key for the development of green and sustainable railways in the southwestern mountainous areas.

1.3. Highlights and Organization of the Paper

Coupling, as a physical concept, refers to the phenomenon where two (or more) systems interact with each other and affect each other [18,19]. When the alignment design system and the resource environment system interact and influence each other, this coupling forms an “alignment design–resource environment” composite system. Hence, to achieve collaborative development between alignment design and resource environment, it is of great practical significance to study the coupling mechanism between alignment design and resource environment and discover an alignment design that is suitable for the resource capacity and the ecological environment.
Therefore, this study focuses on the actual environmental characteristics of engineering along the southwestern mountainous area as well as the coupling mechanism and collaborative development optimization path between alignment design and the resource environment. First, the key elements and coercive effects of the interaction between alignment design (internal system) and the resource environment (external system) are identified, and the interactive impact mechanism of the “alignment design–resource environment” complex is revealed. Second, by relying on internal and external element characteristic indicators, a nonlinear coupling mechanism is established between the alignment design system and the resource environment system. Finally, taking the Chengdu Changdu section of the X railway—located in the southwestern mountainous area—as an example, this study (1) quantitatively analyzes the nonlinear coupling relationship between alignment design and the resource environment; (2) identifies the driving factors that constrain the collaborative development of internal and external systems; and (3) provides theoretical guidance for the collaborative development of internal and external systems.

2. Materials and Methods

2.1. Theoretical Framework

First, based on the classification and organization of collected information, we aimed identify the key elements of mutual coercion between alignment design and the resource environment. By sorting out the interaction paths between the external elements of the resource environment and the internal elements of the alignment design, the system revealed the interactive impact mechanism of the “alignment design–resource environment” complex, laying the foundation for us to build a coupling mechanism between alignment design and the resource environment. Based on the interactive impact mechanism of the “alignment design–resource environment” complex combined with the actual situation along the line, the nonlinear coupling relationships between the system, element, and indicator layer interactions between the alignment design and resource environment are quantitatively analyzed using the deviation coefficient coupling degree model, and a multilevel and multi-system coupling network is formed. Then, the coupling strength, type, and characteristics are identified; the evolutionary characteristics and trajectory of the coupling relationship between alignment design and the resource environment are elucidated under the influence of driving factors, thus revealing the coupling mechanism between alignment design and the resource environment in depth, and based on the coupling mechanism, the main control variables for regulating the interaction threshold between alignment design and the resource environment and the collaborative development of internal and external systems are identified. Second, considering “alignment design–resource environment” as an open system formed by interactive coupling, from a methodological perspective, following a technical path of “analyzing the coercive effects of internal and external factors–identifying coupling relationships–discovering coupling laws–revealing coupling mechanisms–screening driving factors–proposing optimization plans–achieving collaborative development goals”, an overall optimization plan is proposed to solve the problem (Figure 1). The goal of this study is to determine the optimal path for collaborative development between railway alignment design and the resource environment in southwestern mountainous areas that is driven by coupling strength.

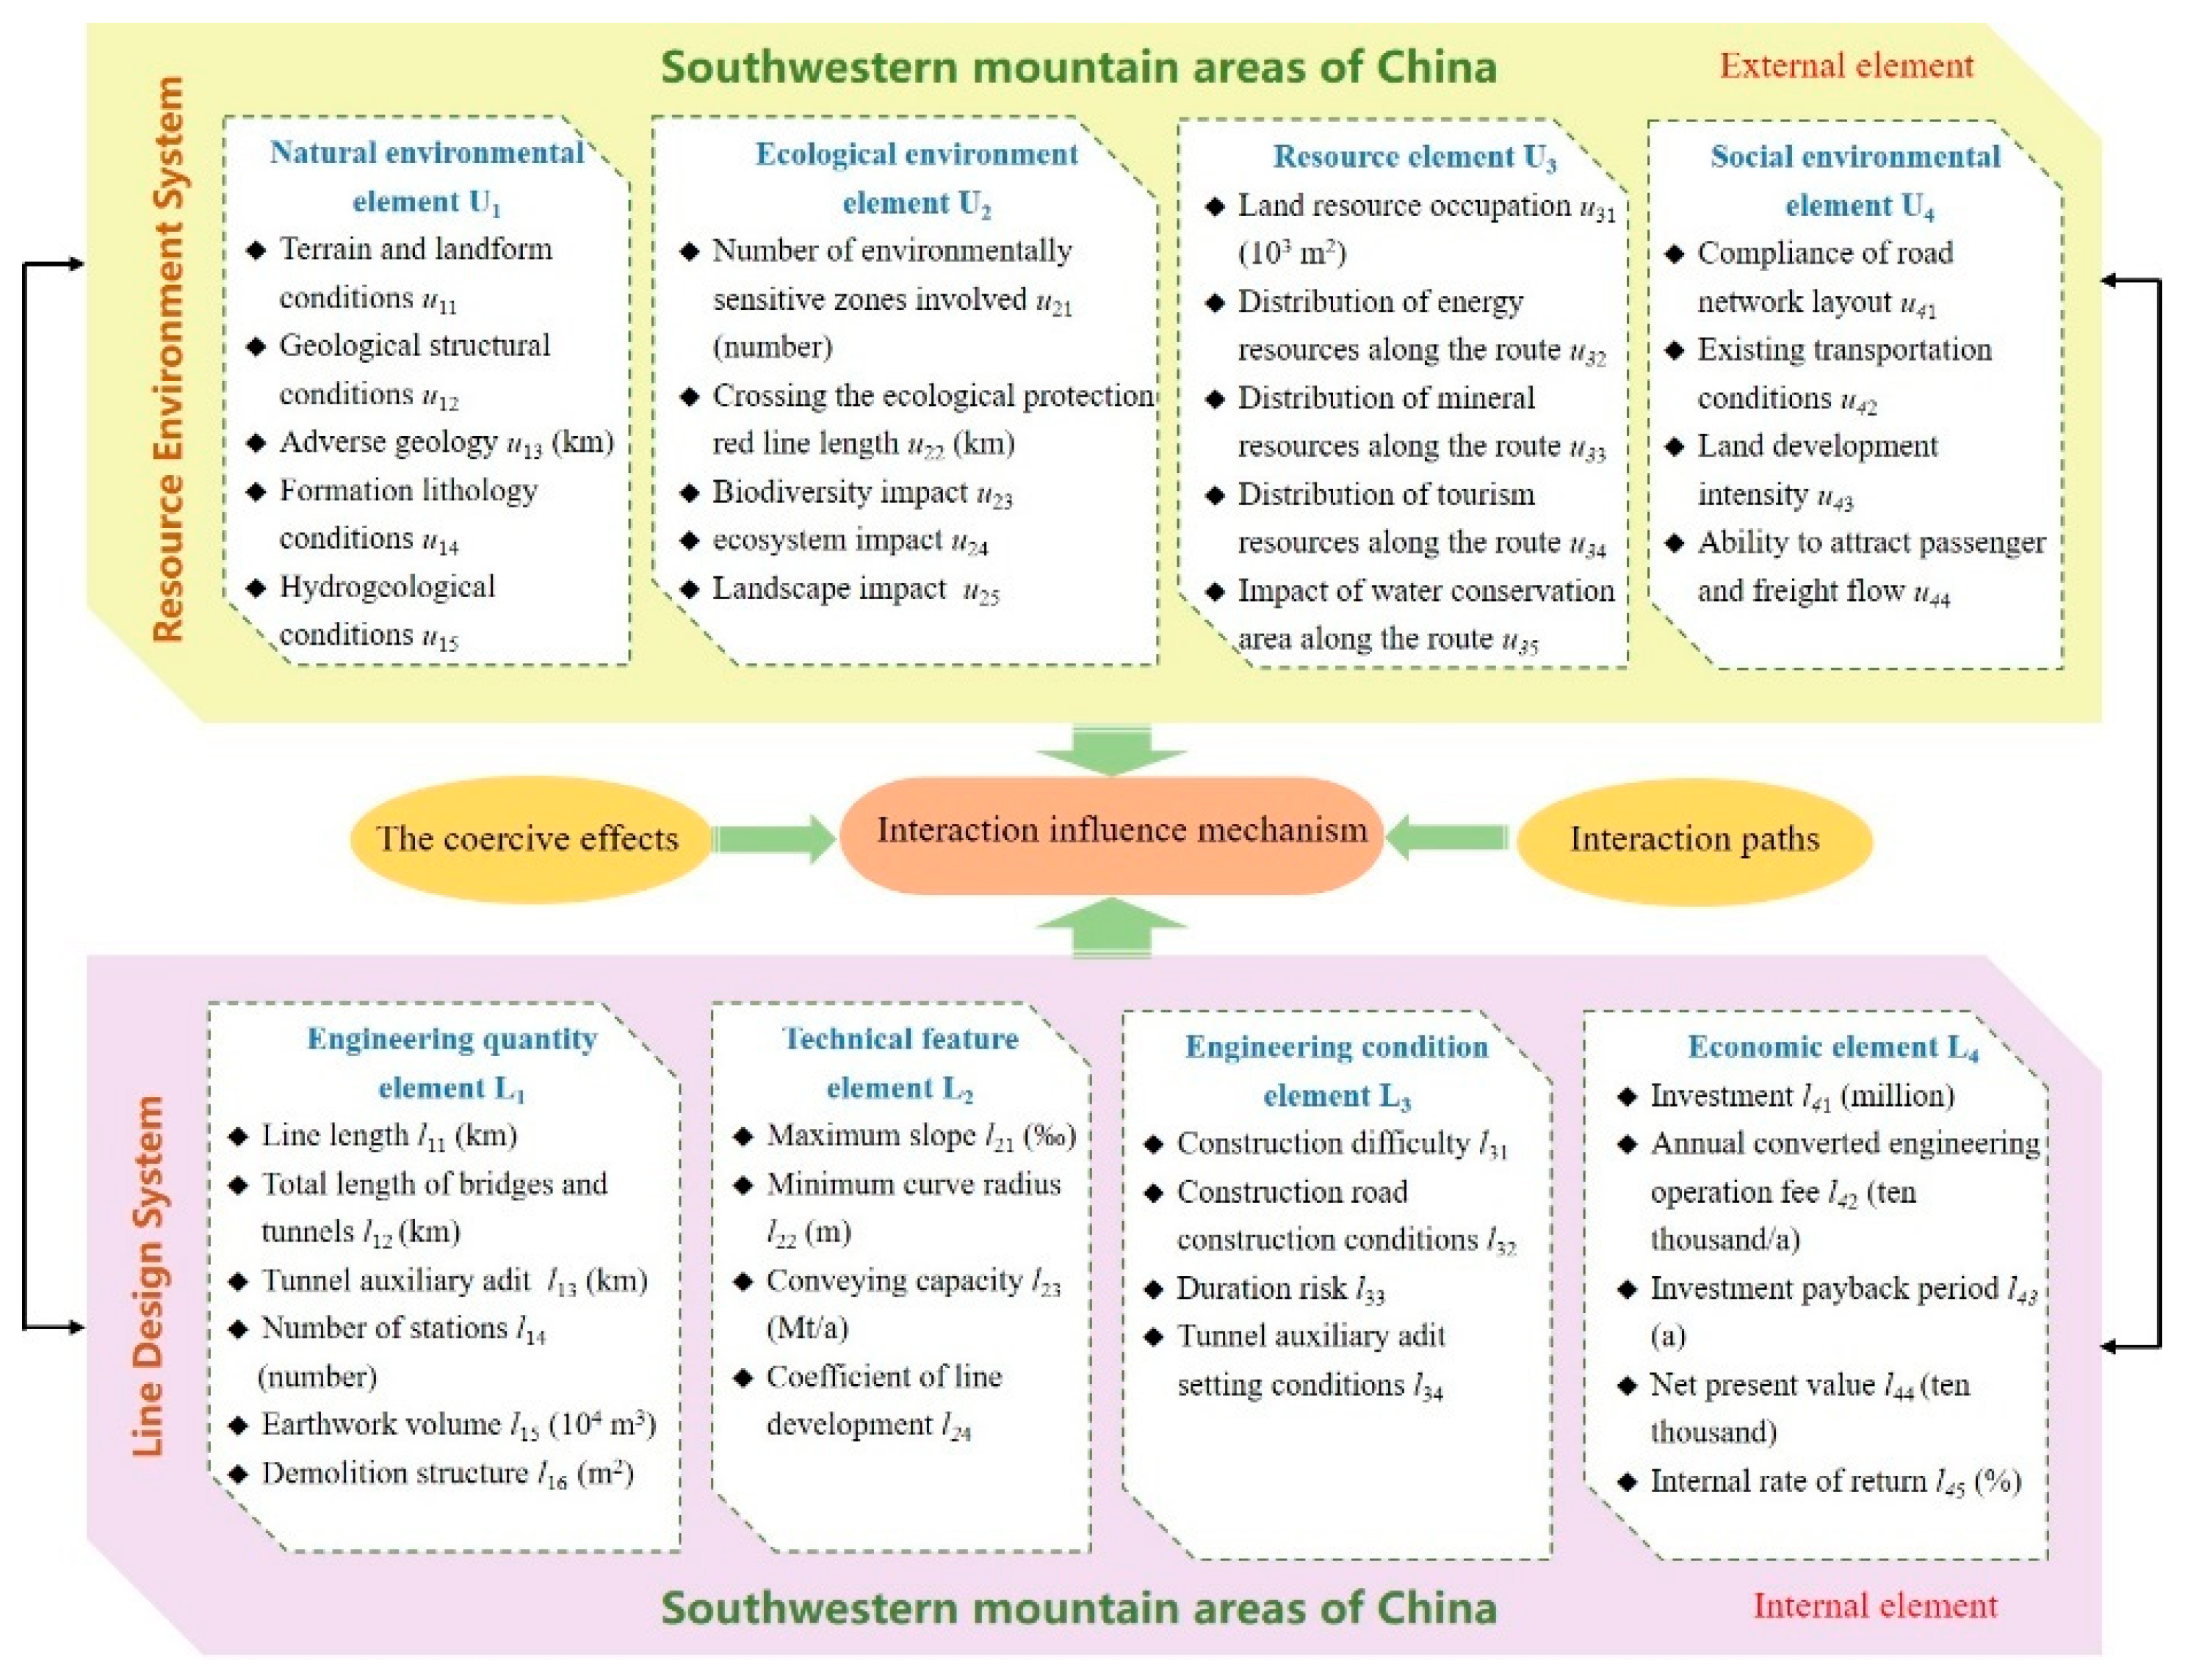
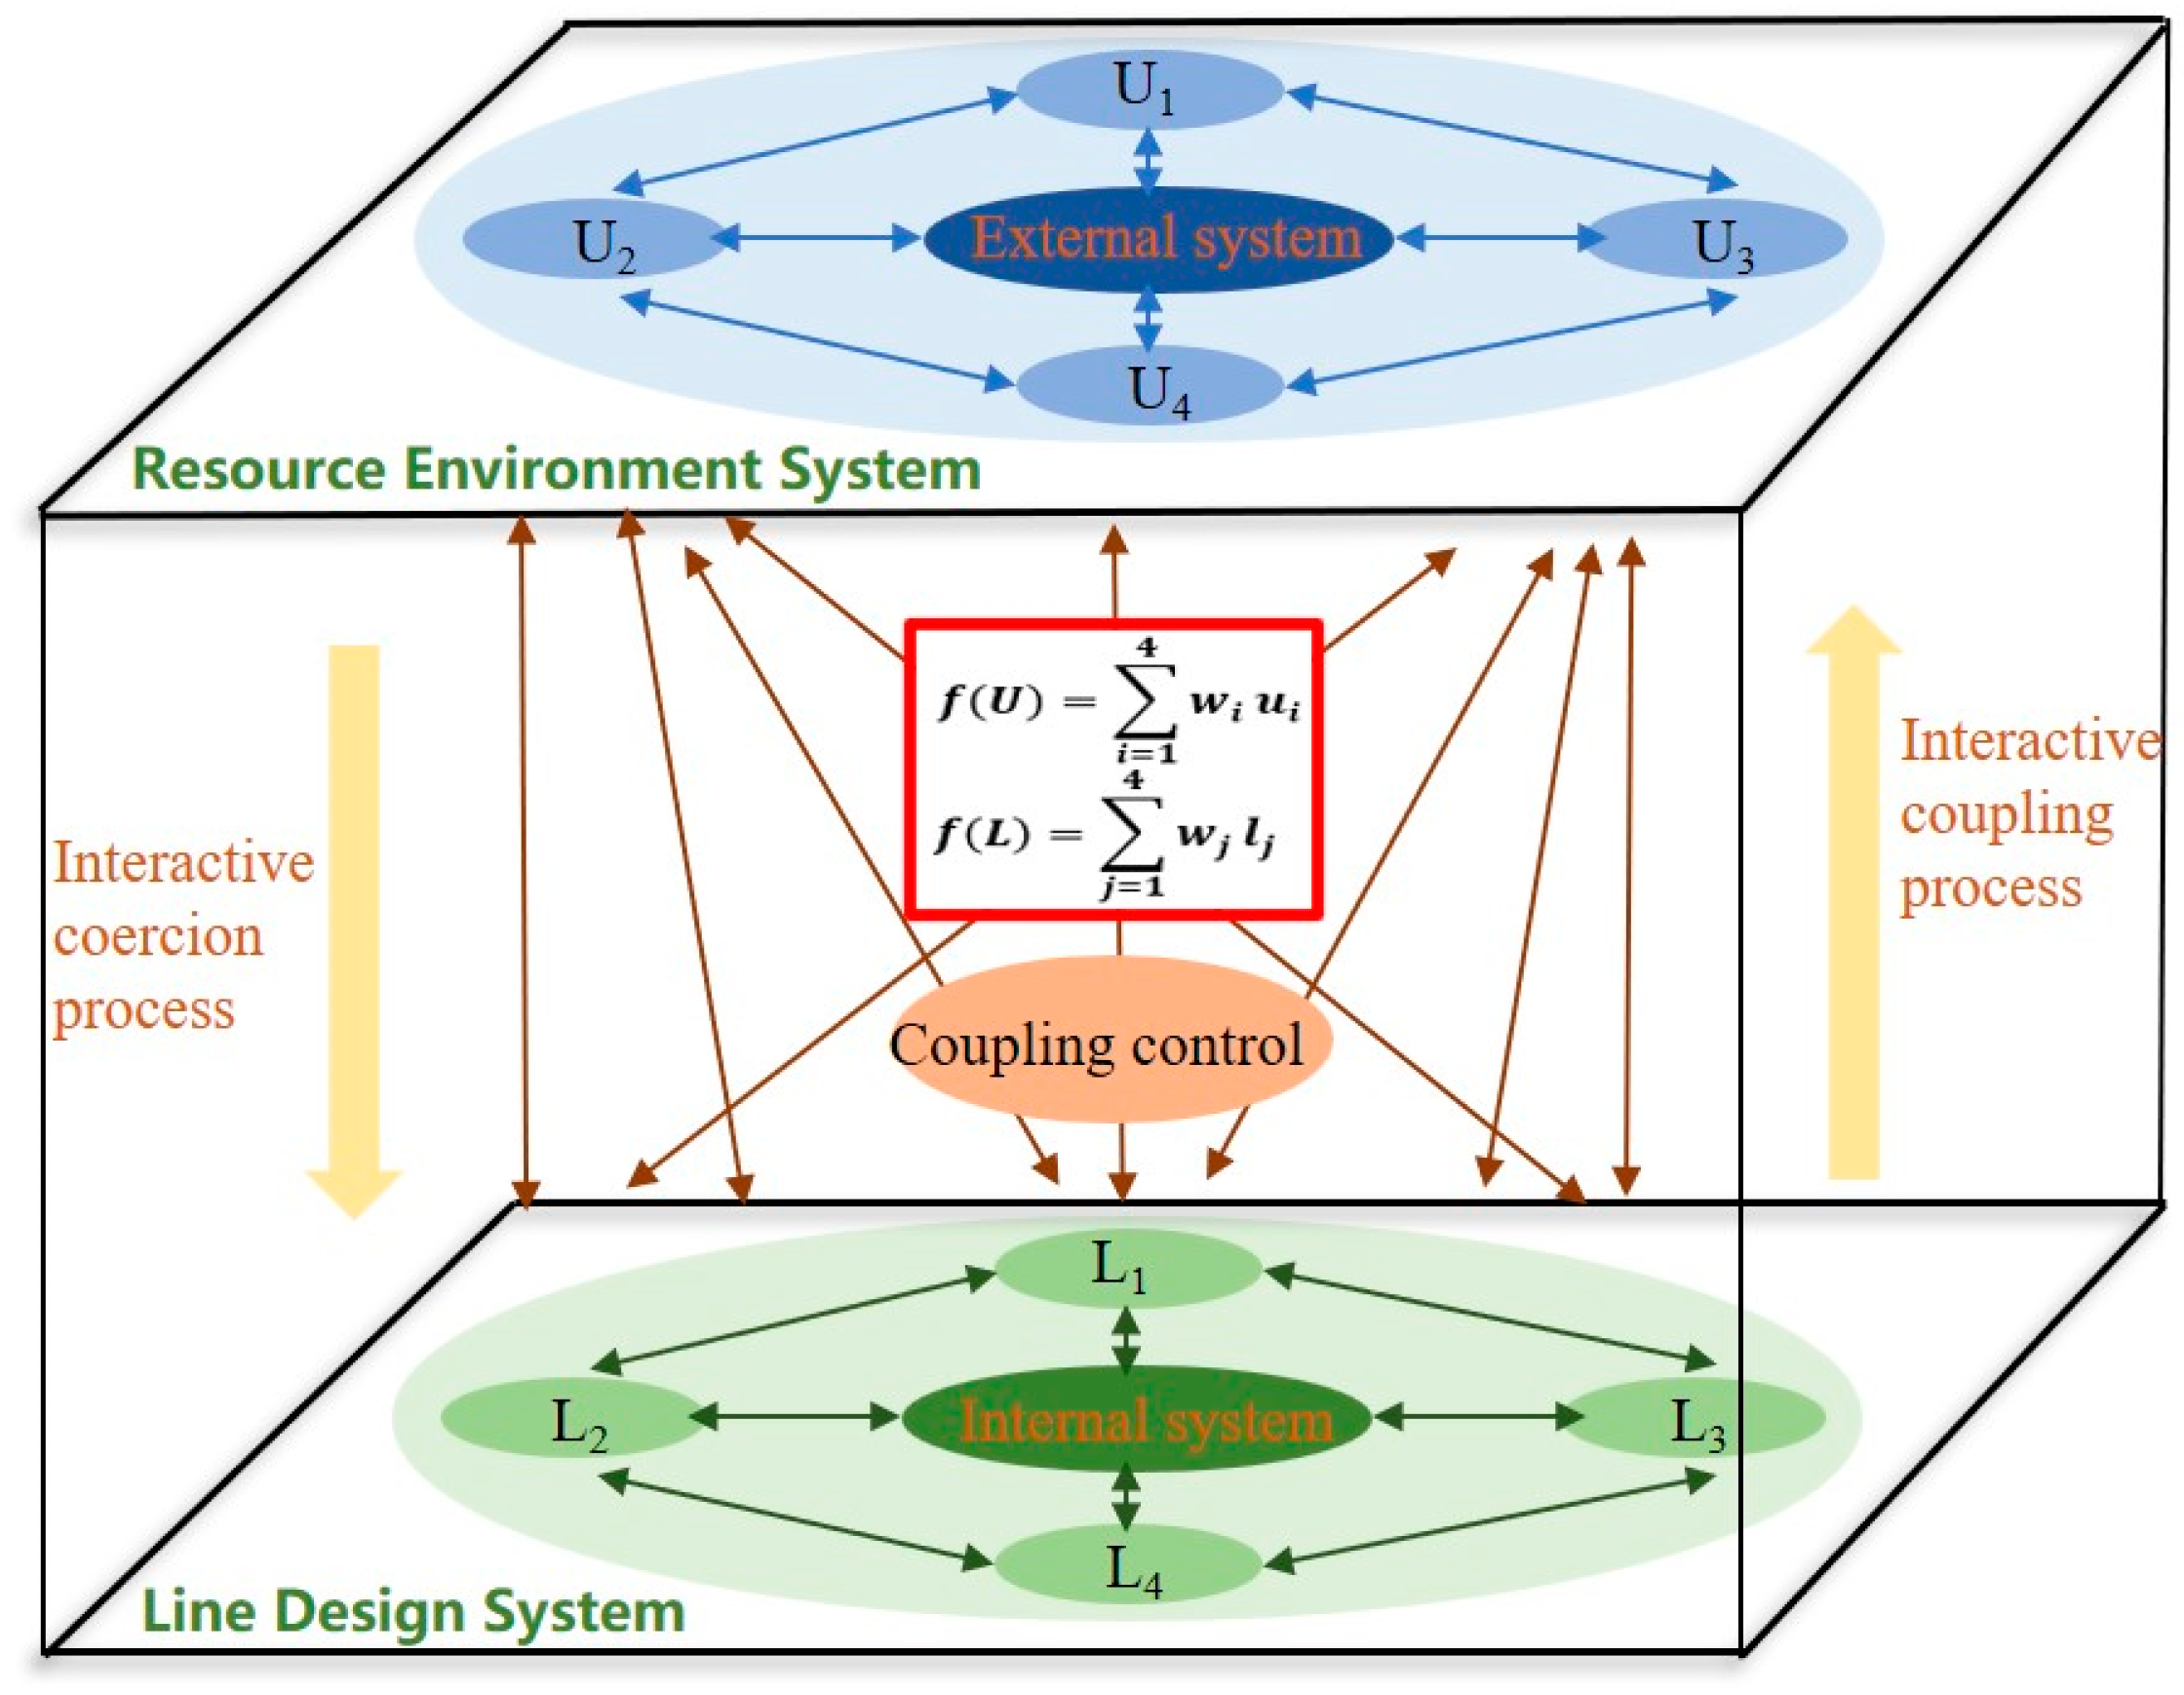
2.2. The Interactive Impact Mechanism of the “Alignment Design–Resource Environment” Complex

Through engineering data collection, research and analysis, case references, relevant literature [1,2,20,21,22,23], and current standards, and from the perspectives of the external influence and internal structure, the key elements and characteristic indicators of internal and external system’s interactions and coercive relationships are systematically screened (Table 1). Among these, external elements are the key elements constraining route selection in the resource environment along the railway, including natural environment, ecological environment, resource, and socio-economic environment elements. Internal elements are the key elements affecting the structural characteristics of a line, including technical feature elements, engineering quantity elements, engineering condition elements, and economic elements. Importantly, internal and external elements mutually coerce and influence each other. As such, external elements have a certain constraining effect on the design of the line. For example, because of natural environmental constraints such as terrain height differences, unfavorable geology, and geological structures in the research area, the design of the route needs to optimize the horizontal and vertical sections of the route and requires a reasonable layout of bridges, tunnels, and roadbed engineering to reduce engineering risks. The distribution of environmentally sensitive areas within the research area is dense, and the ecological protection red line is concentrated and contiguous. Because of the constraints of the ecological environment, the route selection design needs to avoid environmentally sensitive areas as much as possible and reduce ground engineering within the ecological protection red line area. When it is impossible to avoid this, “harmless” methods such as tunnels can be adopted to pass through environmentally sensitive areas and reduce the impact on the ecological environment. The research area in the present study has abundant mineral resources and is a fundamental source of raw materials for local economic development. The design of the line should be close to the area in which important mineral resources are distributed, which is conducive to the utilization of mineral resources along the line and thus accelerates economic development along the line. Furthermore, economic strongholds have a significant impact on the population, land area, and total economic output of a region. Further, because of the constraints of the socio-economic environment, railway lines should cover as many important economic strongholds as possible to attract local passenger and freight traffic and promote local economic development along the line. Given that the research area has rich and diverse natural and cultural tourism resources, the route design should be close to areas with a concentrated distribution of tourism resources, integrate tourism resources, increase railway transportation benefits, promote social and economic development along the route, and enhance the intensity of land development along the route. However, internal elements have a certain degree of coercive pressure on external elements. For example, the construction conditions throughout the southwestern mountainous area are harsh, the terrain is undulating, and construction particularly difficult. Given the engineering condition restrictions, numerous construction roads are needed, which can cause vegetation to be crushed and trampled, thereby damaging surface vegetation and the soil structure. As a strip project spanning hundreds to thousands of kilometers, high-speed rail construction is limited by the amount of engineering that is possible; moreover, the line causes landscape fragmentation and patchiness, which has a certain impact on the ecosystem and landscape along the line. The research area has a well-developed water system and high functional categories of water bodies. Accordingly, the occupation, compaction, and excavation of the roadbed along the route have a significant impact on the flow rate, water quality safety, and hydrological characteristics of rivers, and the research area has abundant wild rare animal and plant resources. The engineering setup damages the vegetation and wildlife habitats along the railway, thereby affecting the natural landscape and wildlife migration on both sides of the railway. Therefore, by characterizing the interaction paths between external elements of the resource environment and internal elements of route design, a mechanism to calculate the interactive impact of the “alignment design–resource environment” complex can be created (Figure 2).

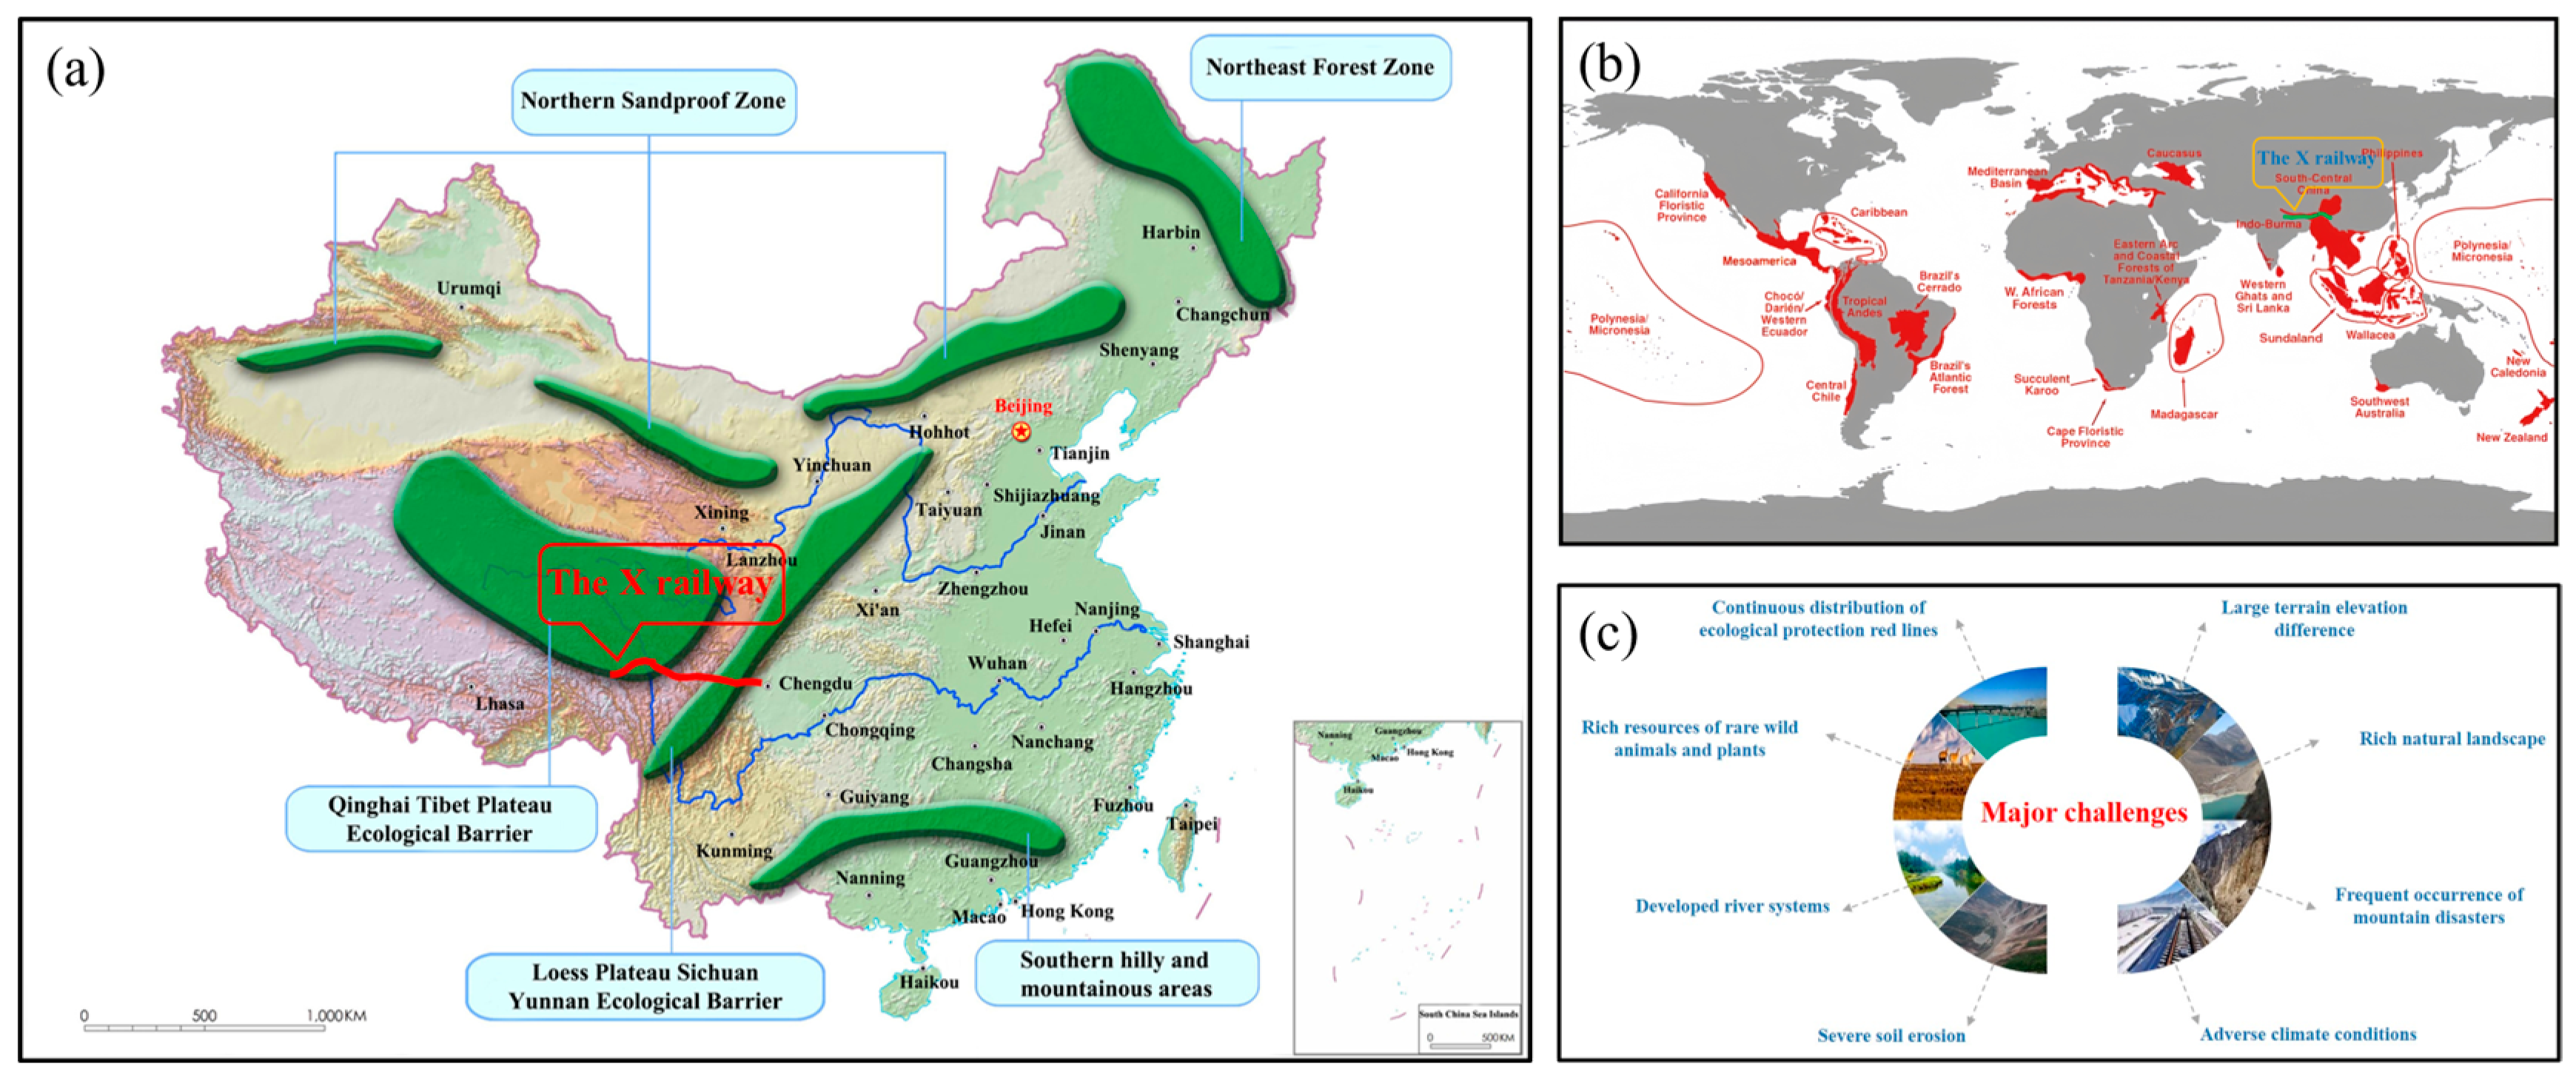
2.3. Overview of the Research Area

The X railway, which is located in Sichuan Province and the Xizang Autonomous Region, is an important part of China’s medium- and long-term railway network planning, and it is one of the main railways in Southwest China. The route starts from Chengdu in the east and goes west through Ya’an, Changdu, and Linzhi to Lhasa. The Chengdu Changdu section is an important component of the X railway that is currently undergoing preliminary work. The Chengdu Changdu section is located on the Qinghai–Tibet Plateau and crosses the northern section of the Hengduan Mountains [26,27]. The terrain along the line has significant height differences, complex geological structures, strong plate activity, frequent mountain disasters, and a fragile ecological environment. At the same time, the project passes through the “Qinghai Tibet Plateau Ecological Barrier” and “Loess Plateau Sichuan Yunnan Ecological Barrier” areas in China’s “two screens and three belts” ecological security strategic pattern (Figure 3a), crossing various types of sensitive and fragile ecosystems such as primitive forests, plateau meadows, plateau wetlands, and arid river valleys. Nature reserves, scenic spots, forest parks, and other environmentally sensitive areas along the route are densely intertwined with rich historical, cultural, and cultural landscape resources and unique ethnic cultures, making them important tourist destinations in China and even internationally. The Hengduan Mountains area that the project passes through is one of the global biodiversity hotspots recognized by Conservation International (CI) (Figure 3b), and the area is rich in rare wild animal and plant resources. Moreover, the line spans rivers—such as Yalong, Jinsha, and Dadu—and the area it passes through has a well-developed water system and a high category of water body functions. Thus, considering the above factors, the selection of engineering routes is greatly constrained, posing significant challenges to the selection of route schemes (Figure 3c).
Here, based on railway network planning, the distribution of economic strongholds, terrain, and geological conditions, and the distribution of environmentally sensitive points, five macro route schemes are studied, including the MG, KL, DG, MJ, and DX schemes (Figure 4).

2.4. Data Sources and Processing

2.4.1. Data Source

The design materials used for this study were provided by the China Railway Eryuan Engineering Group Co., Ltd. (Chengdu, China), the China Railway First Survey and Design Institute Group Co., Ltd. (Xi’an, China), and the China Railway Bridge Survey and Design Institute Group Co., Ltd. (Wuhan, China). The Institute of Geographic Sciences and Natural Resources Research, Chinese Academy of Sciences (http://www.igsnrr.ac.cn, accessed on 24 January 2024), Cold and Arid Regions Scientific Data Center (http://bdc.casnw.net, accessed on 24 January 2024), Tibetan Plateau Scientific Data Center (https://data.tpdc.ac.cn/login, accessed on 24 January 2024), Vegetation Map of China (1:1,000,000) Online system (https://www.plantplus.cn/dsite/zhibei/b12.html, accessed on 24 January 2024), geospatial data cloud (https://www.gscloud.cn, accessed on 24 January 2024), China Ecosystem Assessment and Ecological Security Pattern Database (https://www.ecosystem.csdb.cn/, accessed on 24 January 2024), and other databases were available to provide maps of the vegetation along the route, land use maps, ecological protection red line maps, environmentally sensitive area distribution maps, and other relevant environmental basic data.

2.4.2. Data Processing

The extreme value method was used to perform dimensionless processing of the original data of the feature indicators in order to enable the original data to be compared on the same scale [28]. The processed raw data must linearly change to the [0,1] interval, and the formula is as follows:
Benefit   indicators :   u i j = x i j min ( x j ) max x j min ( x j )
Cost   indicators :   u i j = max x j x i j max x j min ( x j )
In the formula, x i j represents the raw data of characteristic indicator j for the i -th scheme, while max x j and min ( x j ) represent the maximum and minimum values of characteristic indicator j for different schemes, respectively.
The entropy weight method is a commonly used objective weighting method, and the determination of weights mainly relies on the internal connections between data, with strong objectivity. Therefore, the weights of the characteristic indicators can be further determined via the entropy weight method [29,30] using the following formula:
f i j = 1 + u i j i = 1 n ( 1 + u i j )
H j = 1 ln n i = 1 n f i j ln f i j
w j = 1 H j j = 1 m 1 H j , 0 w j 1
In the formula, w j is the weight of characteristic indicator j , and the sum of the weights of each indicator is one [31].

2.5. Deviation Coefficient Coupling Degree Model

The coupling degree [32,33,34] is used to measure the degree of coordination and development between systems, and its principle covers two aspects: “coordination” and “development”. “Coordination” refers to the equilibrium state and the degree of harmony between systems, while “development” refers to the evolution process and the level of development of the system. “Coordination” and “development” are intertwined and synergistically developed, which is called “coupling”.

2.5.1. Deviation Coefficient Coordination Degree Model

It is assumed that, for a certain comprehensive development level when the system is in an ideal state of coordination, the development states of each subsystem are similar and close to the comprehensive development level of the system. According to this assumption, letting x i t be the development state value of each subsystem during period t , when the system is balanced and coordinated, the ideal state value of each subsystem is the comprehensive development state value i = 1 n x i t / n of the system. The deviation coefficient C v t is introduced to measure the distance between the actual state value and the ideal state value of each subsystem during period t . The formula is as follows:
C v t = S t 1 n i = 1 n x i t
S t = 1 n 1 i = 1 n x i t 1 n i = 1 n x i t 2
where S t is the standard deviation of the development status values of each subsystem during period t and n is the number of subsystems. Substituting Formula (7) into Formula (6), it is derived that
C v t = n 1 1 C n 2 i j x i t x j t / i = 1 n x i t / n 2 = n 1 C t
C t = 1 C n 2 i j x i t x j t / i = 1 n x i t / n 2
It is clear that, for 0 ≤ C t ≤ 1, the larger C t is, the smaller the deviation coefficient Cvt is, and the closer the system is to being in a balanced and coordinated state. Therefore, letting Cvt be the degree of coordination, to prevent highly dense and poor hierarchical calculation results, an adjustment coefficient k is introduced [35,36,37]:
C t = 1 C n 2 i j x i t x j t / i = 1 n x i t / n 2 k
C t = 4 x 1 , t x 2 , t / x 1 , t + x 2 , t 2 k , n = 2 3 x 1 , t x 2 , t + x 1 , t x 3 , t + x 2 , t x 3 , t / x 1 , t + x 2 , t + x 3 , t 2 k , n = 3

2.5.2. Coupling Degree

Because the coordination degree C v t can only reflect the equilibrium state and degree of harmony between systems at a certain moment, it is difficult to reflect the development level of the system [38]. Therefore, to prevent the result of a low system development level but achieve a high system coordination degree, the coordination degree model is supplemented as follows:
D = C × T
T = 1 n i = 1 n x i t
In the formula, D represents the coupling degree of the system, C represents the coordination degree of the system and T represents the comprehensive development degree of the system.

2.6. “Alignment Design–Resource Environment” Coupling Mechanism

The external resource environment system U (covering four elements of the natural environment U1, ecological environment U2, resource environment U3, and social environment U4) and the internal alignment design system L (covering four elements of engineering quantity L1, technical feature L2, engineering conditions L3, and economy L4) mutually coerce each other, thereby forming a dynamic coupling between U and L. Furthermore, the compound superposition and interaction between the internal and external elements determine the basic form and path of the interaction coupling between U and L (Figure 5).
Using the linear weighting method [39,40], the state functions of the internal and external systems can be expressed as
f U = i = 1 4 w i u i , ( i = 1,2 , 3,4 )
f L = j = 1 4 w j l j , ( j = 1,2 , 3,4 )
In the formula, f ( U ) and f ( L ) are the state evaluation indices of the resource environment system and the alignment design system, respectively; u i is the standard value of the external element characteristic indicator; and l j is the standard value of the internal element characteristic indicator. The original data are standardized using the extremum method and w is the weight of the feature indicator, which is determined using the entropy weight method.
Based on the coupling degree model, at this point
C = f U · f L f U + f L 2 2 k , T = 0.5 f U + 0.5 f L , D = C × T
where C represents the coordination degree of the U-L composite system, T represents the comprehensive development degree of the U-L composite system, and D represents the coupling degree within the U-L composite system.
Because a b a + b / 2 2 , 0 C 1 . The larger C is, the more coordinated the internal and external systems are. When f U = f L , C = 1 , and the U-L composite system is in a coordinated ideal state. According to the coordination degree of the U-L composite system, the median segmentation method is used to determine the degree of coordination. When C = 0 , there is severe imbalance, indicating that the systems are in an unrelated stage and exhibit disorderly development. For 0 < C ≤ 0.2, there is moderate imbalance, indicating that the systems are in a separation stage. For 0.2 < C ≤ 0.4, there is basic coordination, indicating that the systems are in an antagonistic stage. For 0.4 < C ≤ 0.6, there is moderate coordination, indicating that the systems are in the running-in stage. For 0.6 < C ≤ 0.8, there is good coordination, indicating that the various systems are in the improvement stage. For 0.8 < C ≤ 1, there is high-quality coordination, indicating that the various systems are in the coupling stage and that the systems have reached a benign coupling and are trending towards a new ordered structure.
The coupling evolution mechanism can be explained in conjunction with Figure 6. Within time t, both f ( U ) and f ( L ) show an upward trend. The smaller the coefficient of deviation (i.e., the distance between the corresponding curves) between f ( U ) and f ( L ) , the greater the coordination degree of U-L. Therefore, curve C can be used to represent the development trend in the degree of U-L coordination, and the degree of coordination at points O and P where f ( U ) intersects with f ( L ) is C0 = Cp = 1. The degree of comprehensive development TP of the U-L composite system at point P is greater than its comprehensive development degree T0 at point O, DP > DO. The trend of evolution in the degree of coupling in the U-L composite system can be represented by curve D. Based on the calculated values of the degree of coupling in the U-L composite system and the research of Dong et al. and Fang et al. [41,42], this study divides the degree of coupling into six categories: complete coupling, high-quality coupling, good coupling, intermediate coupling, primary coupling, and low-level coupling, forming the U-L coupling tower (Figure 7).

2.7. Relative Degree of Development Model

To clarify the collaborative development level of U-L, the degree of relative development model [43] is further used to determine the relative advantages of U-L coupling, and the formula is as follows:
R = f U f L R 0
In the formula, R represents the degree of relative development [44]. Combined with the classification of the coupling degree, the judgment criteria are as shown in Table 2.

2.8. Obstacle Degree Model

To identify the obstacles that affect the collaborative development of the U-L composite system, three variables, “factor deviation degree d j ”, “factor importance degree w j ”, and “obstacle degree l j ” [45], are introduced to establish an obstacle diagnosis model for the coordinated development of U-L:
l j = d j w j j = 1 m d j w j × 100 %
d j = 1 u j
In the formula, l j is the degree of the obstacles to indicator j affecting the coordinated development of U-L, w j is the weight of indicator j , and u j is the standard value of indicator j .

3. Results

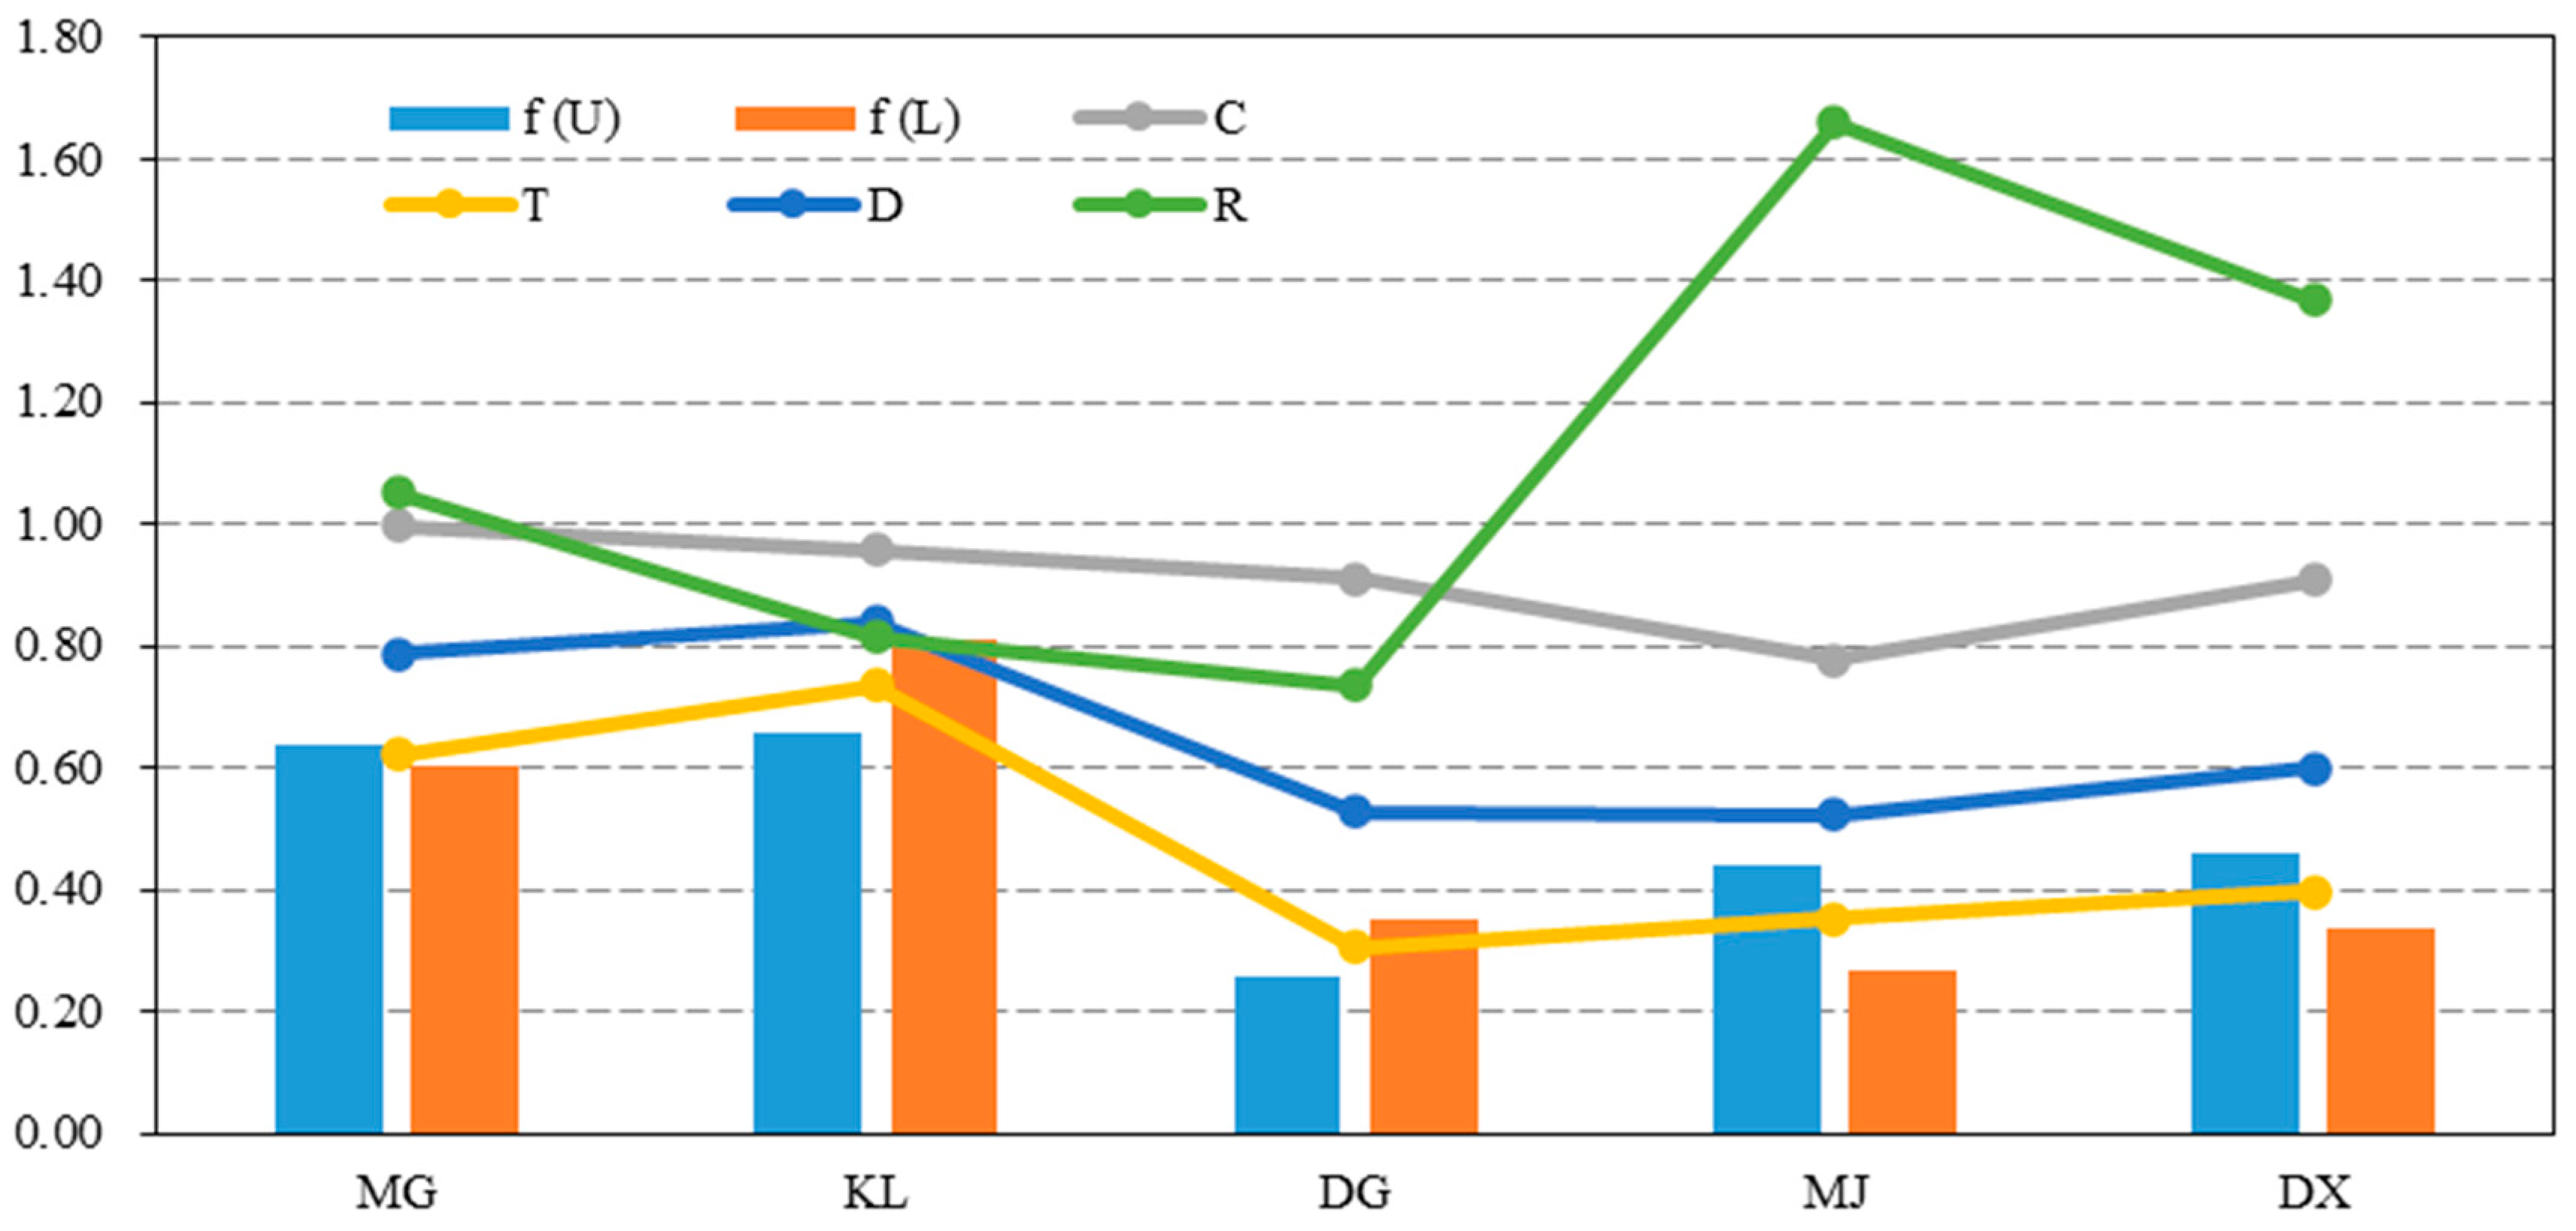
3.1. Analysis of the Degree of Coodination and the Degree of Coupling in the System Layer (U-L)

Using Formulas (14) and (15), the state evaluation indices of the internal and external systems of each scheme can be calculated. Next, using Formula (16) (according to the distribution of calculated values, k is taken as 4), the degree of coordination, the degree of comprehensive development, and the degree of coupling in the U-L composite system in each scheme can be calculated. Using Formula (17), the degree of relative development in the U-L composite system in each scheme can be calculated (Figure 8). This study finds that the state evaluation indicators of the internal and external systems of the MG scheme are close to the comprehensive state level of its U-L composite system, indicating that the internal and external systems in the MG scheme are close to the ideal balanced and coordinated state. Therefore, the degree of coordination in the MG scheme is the highest, reaching 0.997. At this point, the internal and external systems achieve benign coupling and tend towards a new ordered structure. However, because of the low degree of development and the similar development status of the internal and external systems, the MG scheme’s U-L composite system shows a good collaborative development trend, and the coupling characteristic is the good coupling–internal and external system synchronous type. Combined with the degree of development curve, the degree of comprehensive development in the U-L composite system of the KL scheme is significantly greater than that of the other schemes, reaching 0.734, which is the primary reason for the highest coupling degree of any of the U-L composite systems being found in the KL scheme. Moreover, the external system state evaluation index of the KL scheme is lower than that of the internal system state evaluation index. Therefore, the U-L composite system in the KL scheme shows a high-quality collaborative development trend, and the coupling characteristic is the high-quality coupling–external system lag type. Although the degree of coordination in the DG scheme’s U-L composite system is relatively high, its development status is the worst, with a degree of comprehensive development of only 0.305; this lead to the lowest degree of coupling being in the DG scheme’s U-L composite system, and the external system state evaluation index in this scheme is lower than the internal system state evaluation index. Therefore, the DG scheme’s U-L composite system shows a reluctantly collaborative development trend, and the coupling characteristic is the primary coupling–external system hysteresis type. Furthermore, the coordination of the MJ scheme’s U-L composite system is the worst, with a degree of coordination of only 0.776, indicating that the internal and external systems have not reached benign coupling and cannot move towards a new ordered structure, with a degree of coupling of only 0.523. The U-L composite system shows a reluctantly collaborative development trend, and the external system state evaluation index is much greater than the internal system state evaluation index. Therefore, the coupling characteristic of the MJ scheme is the primary coupling–internal system lag type. The coupling strength of the DX scheme is intermediate, and its U-L composite system shows a intermediate collaborative development trend. Given that the external system state evaluation index is greater than the internal system state evaluation index, the coupling characteristic of the DX scheme is the intermediate coupling–internal system lag type. Based on the above analysis, the KL scheme is optimal but it did not achieve complete coupling.

3.2. Analysis of the Degree of Coodination and the Degree of Coupling in the Element Layer ( U i L j )

According to the system layer calculation process, the degrees of coordination, comprehensive development, coupling, and relative development in the KL scheme’s U i L j system can be calculated separately (Figure 9). This study finds that the average degree of coupling in the U i L j system reaches 0.799, indicating a good collaborative development trend. The composite systems of “ecological environment-engineering quantity” (U2 − L1), “ecological environment-technical feature” (U2 − L2), “ecological environment-engineering conditions” (U2 − L3), and “ecological environment-economic factors” (U2 − L4) have significantly lower degrees of coupling than the mean. The degree of coupling in the “ecological environment-engineering quantity” composite system (U2 − L1) is 0.582 and the strength of the coupling is primary coupling, showing a reluctantly collaborative development trend. According to the degree of comprehensive development curve, the degree of comprehensive development in the “ecological environment-engineering quantity” composite system (U2 − L1) is significantly lower than that in the other internal and external elements composite systems, at only 0.410. This is the primary reason for the low degree of coupling in the “ecological environment engineering quantity” composite system (U2 − L1). In addition, the degree of relative development in the “ecological environment-engineering quantity” composite system (U2 − L1) is 0.538, indicating that the state level of the ecological environment element lags behind that of the engineering quantity element. The degree of coupling degree in the “ecological environment-technical feature” composite system (U2 − L2) is 0.556, and the strength of the coupling is primary coupling. The “ecological environment-technical feature” (U2 − L2) system shows a reluctantly collaborative development trend. According to the degree of coordination curve, the coordination between the ecological environment element and technical feature element is poor, with a degree of coordination of only 0.480, indicating that the ecological environment element and technical feature element are in the adaptation stage. In addition, the degree of relative development in the “ecological environment-technical feature” composite system (U2 − L2) is only 0.287, indicating that the state level of the ecological environment element lags far behind that of the technical feature element. The strength of the coupling in the “ecological environment-engineering conditions” composite system (U2 − L3) is primary coupling, showing a reluctantly collaborative development trend; the ecological environment element state evaluation index is much lower than the engineering condition element state evaluation index, indicating that the state level of the ecological environment element lags behind that of the engineering condition element. The strength of the coupling in the “ecological environment-economic factors” composite system (U2 − L4) is primary coupling, showing a reluctantly collaborative development trend. In addition, the degree of relative development in the “ecological environment-economic factors” composite system (U2 − L4) is only 0.311, indicating that the state level of the ecological environment factors lags behind that of the economic factors.
Based on the above analysis, if the external system of the KL scheme is constantly improving with the regulation of the ecological and environmental element (U2), resource element (U3), and other factors while improving the internal structure of the alignment design and effectively driving an improvement in social and environmental factors (U4) by optimizing the engineering quantity element (L1), the alignment design and resource environment will exhibit a mutually reinforcing coupling evolution trend (Figure 10). In addition, the degree of coupling between the two will continue to increase in the trend of D1, D2, D3, and D4 and is expected to eventually transform into the complete coupling type.

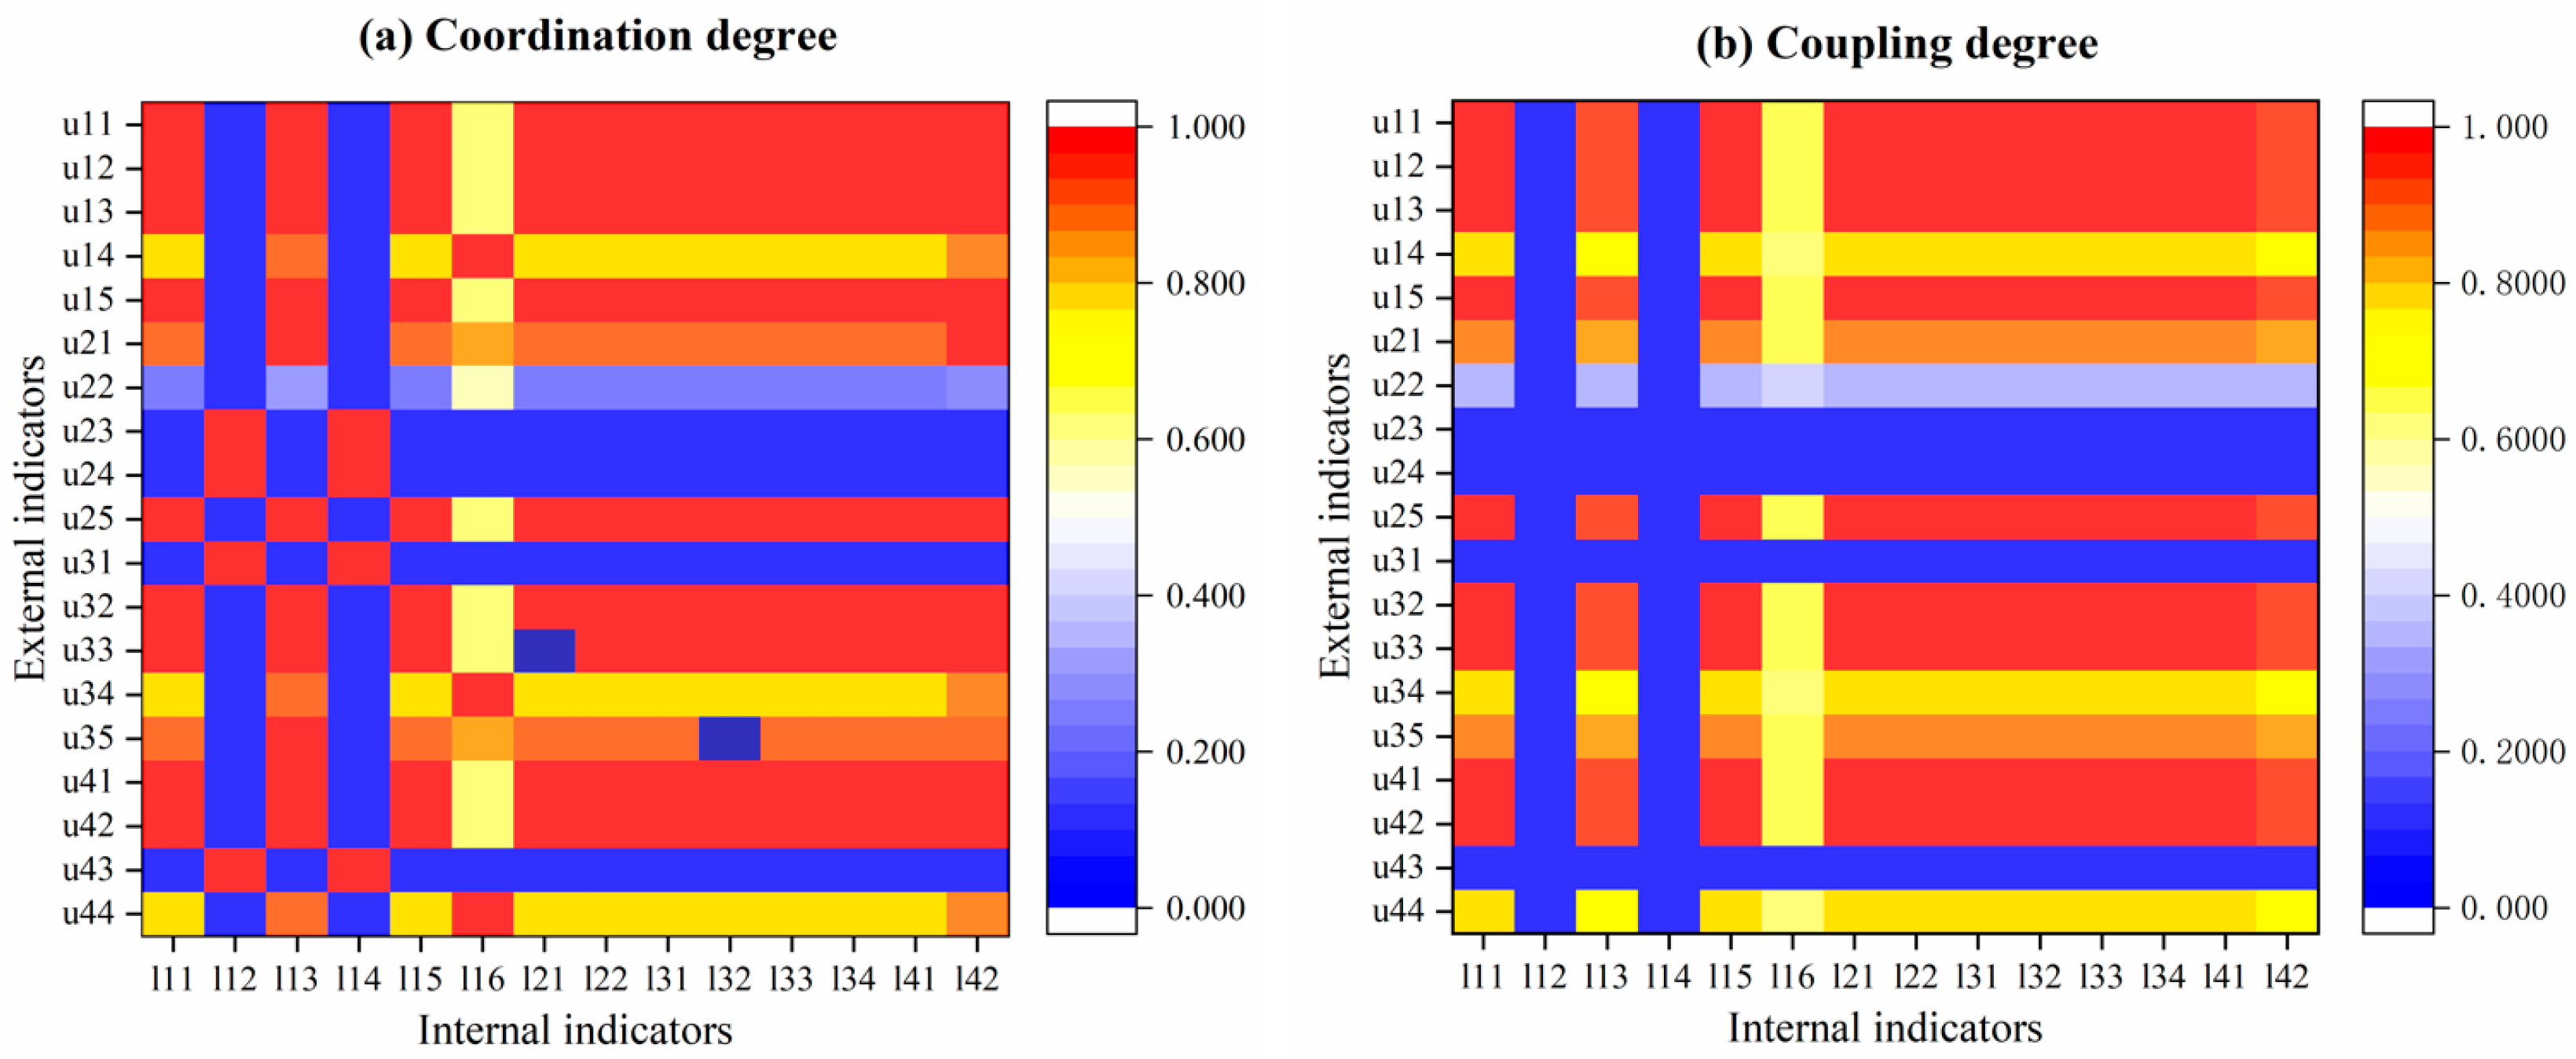
3.3. Analysis of the Degree of Coodination and the Degree of Coupling in the Indicator Layer ( U i j L i j )

The degree of coordination and the degree of coupling in the internal and external indicators of the KL scheme are calculated based on Formulas (18) and (19). To facilitate a visual analysis of the data, the degree of coordination and the degree of coupling are displayed using a heatmap (Figure 11). This study finds that for, internal systems, a low degree of coupling is mainly distributed in the ecological environment element (U2), which is consistent with the results of the element layer analysis, which is specifically reflected in the indicators u22 (crossing the ecological protection red line length), u23 (biodiversity impact), and u24 (ecosystem impact) of the ecological environment element (U2). Moreover, indicator u31 (land resource occupation) in the resource element and indicator u43 (land development intensity) in the social environmental element also reflect the phenomenon of a low degree of coupling, which indicates that the KL scheme is in a state of imbalance with the regional ecological environment and the status of the ecological environment is seriously lagging behind. The high degree of coupling is chiefly distributed within natural environmental element (U1), indicating that the KL scheme focuses on engineering safety risks and is in a harmonious symbiotic state with the regional natural environment. For the external systems, there are relatively few low degree of coupling values, which is specifically reflected in indicators l12 (total length of bridges and tunnels) and l14 (number of stations). Due to geological safety and technical standards limitations, the KL scheme crosses three ecological protection red line blocks: Qionglai Mountain Biodiversity Maintenance Ecological Protection, Daxueshan Biodiversity Maintenance Soil and Water Conservation Ecological Protection, and Shaluli Mountain Biodiversity Maintenance Ecological Protection. The length of the ecological protection red line crossing reaches 106.5 km, the range of the ecological protection red line crossing is slightly longer, and the number of surface engineering projects occupies a relatively large amount of land resources and has a significant impact on the ecological protection red line. Thus, the results of this research are also consistent with the actual transmission situation of the KL scheme, verifying the authenticity and scientific validity of the research conclusions. By comparing the heatmaps of the degree of coordination and the degree of coupling, it can be seen that there are multiple sets of data with coordination degrees greater than the coupling degree; this indicates the phenomenon of a low level of development but a high degree of coordination in the research object and further verifies the scientific validity of the coupling degree model.

3.4. Analysis of Driving Factors for the Collaborative Development of U-L

According to Formulas (18) and (19), the degree of obstacles to the collaborative development of the U-L composite in the internal system elements and external system elements can be calculated. Based on this, the obstacle degree of the indicator layer is calculated for the elements with high obstacle degrees in the internal and external systems (Figure 12). According to the calculation results, the driving factors of “alignment design-resource environment” collaborative development are analyzed in detail. For the elements of the internal system, it can be seen from the calculation results (Figure 12a) that the ecological environment element (U2) is the factor that is the greatest obstacle to the collaborative development of the U-L composite system, with the obstacle degree reaching 50.42%, followed by the social environment element (U4) and resource element (U3), with obstacle degrees of 26.38 and 18.39%. The natural environment element (U1) has the smallest obstacle degree to the collaborative development of the U-L complex system, at only 4.81%, indicating that the driving factors further promoting the collaborative development of the U-L complex system in the external system are mainly distributed in the ecological environment element (U2), social environment element (U4), and resource element (U3). For each element in the external system, it can be seen from the calculation results (Figure 12b) that the obstacle degree of the engineering quantity element (L1) is as high as 85.85%, and the degree of the obstacle to the collaborative development of the U-L composite system is much greater than that of other internal factors; this indicates that the driving factors that further promote the collaborative development of the U-L composite system in the external system are primarily distributed in the engineering quantity element (L1).
According to the obstacle degree measurement results for the internal and external system elements, the degree of the obstacles in the indicator layer can be calculated for the ecological environment (U2), resource (U3), social environment (U4), and engineering quantity elements (L1). For the ecological environment element (U2), the calculation results (Figure 12c) show that the sum of the obstacle degrees of indicator u22 (length of crossing the ecological protection red line), indicator u23 (biodiversity impact), and indicator u24 (ecosystem impact) reaches 92.18%. Indicator u24 (ecosystem impact) has the highest obstacle degree, reaching 41.85%, indicating that the driving factors for promoting the collaborative development of U-L composite systems in the ecological environment element (U2) are indicator u22 (crossing the ecological protection red line length), indicator u23 (biodiversity impact), and indicator u24 (ecosystem impact). For the resource element (U3), according to the calculation results (Figure 12d), indicators u31 (land resource occupation) and u34 (distribution of tourism resources along the route) pose a much greater obstacle degree to the collaborative development of the U-L composite system than the other indicators; this suggested that the driving factors for promoting the collaborative development of the U-L composite system in the resource element (U3) are indicators u31 (land resource occupation) and u34 (distribution of tourism resources along the route). For the social environment element (U4), according to the calculation results (Figure 12e), the obstacle degree of indicator u43 (land development intensity) is 39.02%, suggesting that the driving factor for promoting the collaborative development of the U-L composite system in the social environment element (U4) is indicator u43 (land development intensity). For the engineering quantity element (L1), according to the calculation results (Figure 12f), the sum of the obstacles of indicator l12 (total length of bridges and tunnels) and indicator l14 (number of stations) reaches 72.55%, which significantly hinders the coordinated development of the U-L composite system compared to the other indicators. This indicates that the driving factors for promoting the coordinated development of the U-L composite system in the engineering quantity element (L1) are the indicator l12 (total length of bridges and tunnels) and indicator l14 (number of stations).

4. Discussion

At present, the methodologies for calculating the degreed of coordination, coupling, relative development, and obstacle capital used in this study have been successfully applied to the coupling coordination relationship between tourism economy, social welfare, and the ecological environment [35], and the dynamic balance relationship between urbanization and the ecological environment [42], etc. However, the application of the above methodologies in the research of railway line design and the coordinated development of resources and the environment has not been reported. It can be seen from the calculation results that the degree of coordination model can be used to determine the internal balance state and degree of harmony in the system, the degree of coupling model can reflect the evolution state and collaborative development level of the system, the degree of relative development can be used to clarify the driving factors promoting the coordinated development of the system, and a quantitative analysis of the driving degree of the driving factors can be achieved with the radar map, making the analysis results more clear and concise. Therefore, this study verifies the applicability of methodologies such as the degrees of coordination degree, coupling, relative development and obstacle models in the field of railway alignment design and the collaborative development of the resource environment.
The results of the present study indicate that the key elements and their characteristic indicators identified in this article can better reflect the nonlinear coupling relationship between alignment design and the resource environment according to the characteristics of engineering environment along the southwest mountainous area. For the overall framework of the key elements identified in this paper, combined with the characteristics of the actual engineering environment along the research area, the characteristic indicators of the key elements can be directly used for the design of other railway lines and research into the collaborative development resources and the environment in the southwestern mountainous area of China after slight adjustments. Additionally, the research method constructed in this study can be used to quantitatively analyze the nonlinear coupling relationship between alignment design and the resource environment, identify the driving factors that constrain the collaborative development of internal and external systems, and provide theoretical guidance for the collaborative development of the alignment design and the resource environment in other regions. In summary, this article follows the technical path of “analyzing the coercive effects of internal and external factors–identifying coupling relationships–discovering coupling laws–revealing coupling mechanisms–screening driving factors–proposing optimization plans–achieving collaborative development goals”. An overall optimization plan is proposed to solve the problem, thus revealing the coupling mechanism of the alignment design and resource environment and the path for the optimization of collaborative development in depth. This study provides a new perspective on coordinating the relationship between alignment design and the resource environment. The research ideas and methods discussed in this article can provide references and guidance for the design of railway lines and the collaborative development of resources and environments in the southwestern mountainous areas of China.
Through the analysis of the degree of coordination and degree of coupling in the U-L composite system of each scheme, it can be seen that the KL scheme is the best, but there is room for improvement. To continuously promote the mutually promoting development of the KL scheme’s alignment design and resource environment, the key is to improve the state level of low coupling lag factors in the indicator layer, element layer, and system layer of the U-L composite system so that the alignment design and resources and environment can coordinate and progress together. The coupling relationship between the two can also evolve in the direction of highly collaborative development and complete the transition of the “alignment design-resource environment” composite system to a better coupling level and achieve the harmonious coexistence of railways and the ecological environment. It can be seen from the above analysis that, if the state level of the external system continues to rise with the regulation of the ecological environmental element, the resource environmental element, and other factors, and at the same time improves the internal structure of the alignment design and effectively promotes the improvement of the social environmental state level through optimizing the quantity of project, the alignment design and resource environment will show a mutually promoting coupling evolution trend, as shown in Figure 10. Eventually, it must be able to change to a fully coupled type. Therefore, based on the calculation results of the coupling degree of the indicator layer and combined with the analysis of driving factors, it is recommended to further reduce the interference of ecological protection red lines, strengthen biodiversity protection, reduce the impact on ecosystems, reduce land resource occupation, and enhance the intensity of national land development in the next stage of line selection and line implementation to enhance the coupling strength of the KL scheme composite system and gradually achieve coordinated progress between alignment design and the resource environment. Specifically, based on the principle of prioritizing protection, when the ecological protection red line cannot be circumvented, the main line in the project should pass through a tunnel to reduce the number of projects on the ground within the scope of the ecological protection red line area, thus saving land resources and reducing the impact of surface disturbance on the surface ecosystem during the construction process. In addition, for tunnel auxiliary adit exits, construction roads, and slag fields within the scope of ecological protection, red lines should be avoided. The transformation of inefficient forests and the restoration of abandoned land should be strengthened, the construction of ecological corridors should be strengthened, and the function of biodiversity protection should be maintained. As such, in view of the integrity of the landscape and ecosystem, construction areas on the surface should be minimized to reduce the fragmentation and patchiness of the landscape. The route should be as close as possible to the area with the highest distribution of important mineral resources, which is conducive to the development of mineral resources along the line. This enhances the intensity of national land development and accelerates economic development along the line. It should be noted that, while improving the state level of the external system, close attention should be paid to the changes in the state level of the internal system. Additionally, the state level of the resource environment along the route should be improved by optimizing the internal structure of the route design, the economic benefits of the line should be improved through an improvement in the state level of the resource environment, and the coupling mode of the two should be constantly optimized. Finally, complete coupling of the alignment design and resources and environment should be achieved.

5. Conclusions

This study is based on the characteristics of the engineering environment along a railway in the southwest mountainous area of China, and the deviation coefficient coupling degree model has been used to reveal the nonlinear coupling mechanism between the alignment design system and the resource environment system. Accordingly, combined with the degree of relative development model and obstacle degree model, an optimization path for the collaborative development of railway alignment design and the resource environment in the southwestern mountainous area has been established. Finally, taking the Chengdu Changdu section of the X railway, which is located in the southwestern mountainous area, as an example, this study quantitatively analyzed the nonlinear coupling relationship between alignment design and the ecological environment; identified the driving factors that constrain the collaborative development of internal and external systems; and proposed targeted optimization and adjustment suggestions. The main conclusions are as follows.
By calculating the degrees of coordination, comprehensive development, coupling, and relative development in each scheme’s U-L composite system, it was found that the degree of development in the KL scheme’s U-L composite system is significantly greater than that of the other schemes, reaching 0.734, resulting in the highest degree of coupling in the KL scheme’s U-L composite system reaching 0.839. This indicates that the KL scheme is the best, and its U-L composite system shows a high-quality collaborative development trend. However, due to the constraints of the degree of coordination, the KL scheme does not achieve complete coupling, and the external system state evaluation index of the KL scheme is lower than the internal system state evaluation index. Therefore, the coupling characteristic of the KL scheme is the high-quality coupling–external system lag type.
This study found that the average degree of coupling in the KL scheme’s Ui − Lj composite system reached 0.799, reflecting a good collaborative development trend. The degree of coupling in composite systems such as the “ecological environment–engineering quantity” (U2 − L1), “ecological environment–technical feature” (U2 − L2), “ecological environment–engineering conditions” (U2 − L3), and “ecological environment–economic” (U2 − L4) systems was significantly lower than the mean, the coupling characteristics were all the primary coupling, and the ecological environment element lagged behind.
Through a visual analysis of the degree of coordination and the degree of coupling of the internal and external indicators in the KL scheme, it was found that, for external systems, the low degree of coupling is mainly distributed in the ecological environment element (U2). This is specifically reflected in the indicators u22, u23, and u24 of the ecological environment element. For internal systems, there are relatively few low coupling values, which is specifically reflected in the l12 and l14. indicators Therefore, if the state level of the external system can continuously rise with the driving force of the ecological environment and other elements while optimizing the internal system structure and driving the external through internal systems, the internal and external systems will exhibit a mutually reinforcing coupling evolution trend.
According to the calculation results of the degrees of obstacles in the indicator layer and the element layer, it can be concluded that, to continuously promote the mutual promotion of alignment design and the resource environment development in the KL scheme, the important aspects are a further reduction in the ecological protection red line interference, the strengthening of the biodiversity protection, a reduction in the impacts of the ecosystem, a reduction in land resource occupation, and the enhancement of national land development intensity. In this way, alignment design and the resource environment are expected to coordinate and progress together, ultimately achieving a harmonious coexistence between railways and the ecological environment. The coupling relationship between the alignment design and resource environment can also evolve in a highly collaborative development direction, ultimately achieving a transition of the entire composite system of “alignment design–resource environment” to a higher level of coupling.
In this study, the coupling mechanism and collaborative development optimization path between railway alignment design and the resource environment in southwestern mountainous areas is explored, but there are still certain limitations. First, based on the actual characteristics of the engineering environment in the research area, the key elements of the interaction between alignment design and the resource environment are systematically screened from the perspectives of external influences and the internal structure. However, due to the limitations of the intervention time and data, a small number of element characteristic indicator data acquisition failures were not included in the study, such as the investment payback period, net present value, internal rate of return, and other indicators reflecting internal economic elements. Second, railway alignment design is an operational process that goes from large to small and from macro to micro. In this study, the coupling relationship between alignment design and the resource environment was investigated in view of the “macroscopic direction”. The research method and conclusion are applicable to the macroscopic design of routes. The coupling relationship between medium- and micro-level alignment designs and resource environments, such as “local alignment” and “engineering form”, still requires further exploration, which is also the direction of our team’s future research.

Author Contributions

Methodology, B.W.; software, B.W.; validation, X.B. and A.L.; formal analysis, B.W.; investigation, X.B.; resources, X.B.; data curation, B.W.; writing—original draft preparation, B.W.; writing—review and editing, B.W.; visualization, B.W.; supervision, X.B.; funding acquisition, X.B. All authors have read and agreed to the published version of the manuscript.

Funding

This research was funded by the National Natural Science Foundation of China (51768034), Basic Research Project of the Science and Technology Research and Development Program Laboratory of China National Railway Group Co., Ltd. (L2023Z001), and the central guides local funds for science and technology development (22ZY1QA005). We thank LetPub (www.letpub.com, accessed on 1 April 2024) for its linguistic assistance during the preparation of this manuscript.

Institutional Review Board Statement

Not applicable.

Informed Consent Statement

Not applicable.

Data Availability Statement

The data that have been used are confidential.

Conflicts of Interest

The authors declare no conflicts of interest.

References

  1. Zhang, D.; Sun, Z.; Fang, Q. Scientific problems and research proposals for Sichuan–Tibet railway tunnel construction. Undergr. Space 2022, 7, 419–439. [Google Scholar] [CrossRef]
  2. Xu, B.; Li, J.; Luo, Z.; Wu, J.; Liu, Y.; Yang, H.; Pei, X. Analyzing the spatiotemporal vegetation dynamics and their responses to climate change along the Ya’an–Linzhi section of the Sichuan–Tibet railway. Remote Sens. 2022, 14, 3584. [Google Scholar] [CrossRef]
  3. Cui, P.; Ge, Y.; Li, S.; Li, Z.; Xu, X.; Zhou, G.G.D.; Chen, H.; Wang, H.; Lei, Y.; Zhou, L.; et al. Scientific challenges in disaster risk reduction for the Sichuan–Tibet railway. Eng. Geol. 2022, 309, 106837. [Google Scholar] [CrossRef]
  4. Wan, X.; Pu, H.; Schonfeld, P.; Song, T.; Li, W.; Peng, L.; Hu, J.; Zhang, M. Mountain railway alignment optimization based on landform recognition and presetting of dominating structures. Comput.-Aided Civ. Inf. 2023, 39, 242–263. [Google Scholar] [CrossRef]
  5. Song, T.; Pu, H.; Schonfeld, P.; Liang, Z.; Zhang, M.; Hu, J.; Zhou, Y.; Xu, Z. Mountain railway alignment optimization integrating layouts of large-scale auxiliary construction projects. Comput.-Aided Civ. Inf. 2022, 38, 433–453. [Google Scholar] [CrossRef]
  6. Song, T.; Pu, H.; Schonfeld, P.; Zhang, H.; Li, W.; Hu, J.; Wang, J. Mountain railway alignment optimization considering geological impacts: A cost-hazard bi-objective model. Comput.-Aided Civ. Inf. 2020, 35, 1365–1386. [Google Scholar] [CrossRef]
  7. Deng, T.; Sharafat, A.; Wie, Y.M.; Lee, K.G.; Lee, E.; Lee, K.H. A geospatial analysis-based method for railway route selection in marine glaciers: A case study of the Sichuan-Tibet railway network. Remote Sens. 2023, 15, 4175. [Google Scholar] [CrossRef]
  8. Song, T.; Pu, H.; Schonfeld, P.; Zhang, H.; Li, W.; Hu, J.; Wang, J.; Wang, J. Bi-objective mountain railway alignment optimization incorporating seismic risk assessment. Comput.-Aided Civ. Inf. 2020, 36, 143–163. [Google Scholar] [CrossRef]
  9. Song, T.; Pu, H.; Yang, T.Y.; Schonfeld, P.; Li, W.; Hu, J. Optimizing net present values of risk avoidance for mountain railway alignments with seismic performance evaluation. Comput.-Aided Civ. Inf. 2023, 39, 944–962. [Google Scholar] [CrossRef]
  10. Liu, W.; Yang, X.; Gao, X.; Zeng, S.; Zhou, J.; Wu, X.; Zhang, J. Impacts of water surge from mountain railroad tunnels on ecological environments based on the RSEI model. Environ. Sci. Pollut. Res. 2023, 30, 120400–120421. [Google Scholar] [CrossRef]
  11. Chen, Y.; Zhang, T.; Zhou, X.; Li, J.; Yi, G.; Bie, X.; Hu, J.; Wen, B. Ecological sensitivity and its driving factors in the area along the Sichuan–Tibet railway. Environ. Dev. Sustain. 2023, 1–20. [Google Scholar] [CrossRef]
  12. Pu, H.; Cai, L.; Song, T.; Schonfeld, P.; Hu, J. Minimizing costs and carbon emissions in railway alignment optimization: A bi-objective model. Transport. Res. D-Tr. E. 2023, 116, 103615. [Google Scholar] [CrossRef]
  13. Zhang, H.; Pu, H.; Schonfeld, P.; Song, T.; Li, W.; Wang, J.; Peng, X.; Hu, J. Multi-objective railway alignment optimization considering costs and environmental impacts. Appl. Soft Comput. 2020, 89, 106105. [Google Scholar] [CrossRef]
  14. Chen, Z.; Chang, R.; Pei, X.; Yu, Z.; Guo, H.; He, Z.; Zhao, W.; Zhang, Q.; Chen, Y. Tunnel geothermal disaster susceptibility evaluation based on interpretable ensemble learning: A case study in Ya’an–Changdu section of the Sichuan–Tibet traffic corridor. Eng. Geol. 2023, 313, 106985. [Google Scholar] [CrossRef]
  15. Owais, M.; Ahmed, A.S.; Moussa, G.S.; Khalil, A.A. An optimal metro design for transit networks in existing square cities based on non-demand criterion. Sustainability 2020, 12, 9566. [Google Scholar] [CrossRef]
  16. Owais, M.; Ahmed, A.S. Frequency based transit assignment models: Graph formulation study. IEEE Access 2022, 10, 62991–63003. [Google Scholar] [CrossRef]
  17. Owais, M.; Ahmed, A.S.; Moussa, G.S.; Khalil, A.A. Design scheme of multiple-subway lines for minimizing passengers transfers in mega-cities transit networks. Int. J. Rail Transp. 2021, 9, 540–563. [Google Scholar] [CrossRef]
  18. Huang, D.; Wen, F.; Li, G.; Wang, Y. Coupled development of the urban water-energy-food nexus: A systematic analysis of two megacities in China’s Beijing-Tianjin-Hebei area. J. Clean. Prod. 2023, 419, 138051. [Google Scholar] [CrossRef]
  19. Li, C.Z.; Tam, V.W.Y.; Zhou, M.; Liu, L.; Wu, H. Quantifying the coupling coordination effect between the prefabricated building industry and its external comprehensive environment in China. J. Clean. Prod. 2024, 434, 140238. [Google Scholar] [CrossRef]
  20. Gao, T.; Li, Z.; Gao, Y.; Schonfeld, P.; Feng, X.; Wang, Q.; He, Q. A deep reinforcement learning approach to mountain railway alignment optimization. Comput.-Aided Civ. Inf. 2021, 37, 73–92. [Google Scholar] [CrossRef]
  21. Gao, Y.; Zhang, T.; Zhu, C.; Yang, S.; Schonfeld, P.; Zou, K.; Zhang, J.; Zhu, Y.; Wang, P.; He, Q. Biobjective optimization for railway alignment fine-grained designs with parallel existing railways. Comput.-Aided Civ. Inf. 2024, 39, 438–457. [Google Scholar] [CrossRef]
  22. He, Q.; Gao, T.; Gao, Y.; Li, H.; Schonfeld, P.; Zhu, Y.; Li, Q.; Wang, P. A bi-objective deep reinforcement learning approach for low-carbon-emission high-speed railway alignment design. Transport. Res. C-Emer. 2023, 147, 104006. [Google Scholar] [CrossRef]
  23. Song, T.; Pu, H.; Schonfeld, P.; Zhang, H.; Li, W.; Peng, X.; Hu, J.; Liu, W. GIS-based multi-criteria railway design with spatial environmental considerations. Appl. Geogr. 2021, 131, 102449. [Google Scholar] [CrossRef]
  24. TB 10501-2016; Railway Engineering Environmental Protection Design Specification. China Railway Publishing House: Beijing, China, 2016.
  25. TB 10504-2007; Preparation Methods of Feasibility Study and Design Documents for Pre-Feasibility Study of Railway Construction Projects. China Railway Publishing House: Beijing, China, 2007.
  26. Ren, J.; Xu, X.; Lv, Y.; Wang, Q.; Li, A.; Li, K.; Zhu, J.; Cai, J.; Liu, S. Late quaternary slip rate of the northern Lancangjiang fault zone in eastern Tibet: Seismic hazards for the Sichuan-Tibet railway and regional tectonic implications. Eng. Geol. 2022, 306, 106748. [Google Scholar] [CrossRef]
  27. Xie, S.; Zhang, X.; Pang, Y. Wind dynamic characteristics and wind tunnel simulation of subgrade sand hazard in the Shannan wide valley of the Sichuan–Tibet railway. Int. J. Environ. Res. Public Health 2022, 19, 8341. [Google Scholar] [CrossRef] [PubMed]
  28. Behboudian, M.; Anamaghi, S.; Mahjouri, N.; Kerachian, R. Enhancing the resilience of ecosystem services under extreme events in socio-hydrological systems: A spatio-temporal analysis. J. Clean. Prod. 2023, 397, 136437. [Google Scholar] [CrossRef]
  29. Ashofteh, P.-S.; Pourali Dougaheh, M. Ranking the optimal combination of low-impact urban development systems under climate change with the TODIM multi-criteria decision-making method. J. Clean. Prod. 2024, 434, 140108. [Google Scholar] [CrossRef]
  30. Ji, J.; Wang, D. Evaluation analysis and strategy selection in urban flood resilience based on EWM-TOPSIS method and graph model. J. Clean. Prod. 2023, 425, 138955. [Google Scholar] [CrossRef]
  31. Zhu, C.; Fang, C.; Zhang, L. Analysis of the coupling coordinated development of the Population–Water–Ecology–Economy system in urban agglomerations and obstacle factors discrimination: A case study of the Tianshan North Slope Urban Agglomeration, China. Sustain. Cities Soc. 2023, 90, 104359. [Google Scholar] [CrossRef]
  32. Bian, D.; Yang, X.; Xiang, W.; Sun, B.; Chen, Y.; Babuna, P.; Li, M.; Yuan, Z. A new model to evaluate water resource spatial equilibrium based on the game theory coupling weight method and the coupling coordination degree. J. Clean. Prod. 2022, 366, 132907. [Google Scholar] [CrossRef]
  33. Cheng, X.; Long, R.; Chen, H.; Li, Q. Coupling coordination degree and spatial dynamic evolution of a regional green competitiveness system—A case study from China. Ecol. Indic. 2019, 104, 489–500. [Google Scholar] [CrossRef]
  34. Jiang, L.; Wu, Y.; He, X.; Fu, Q.; Wang, Z.; Jiang, Q. Dynamic simulation and coupling coordination evaluation of water footprint sustainability system in Heilongjiang province, China: A combined system dynamics and coupled coordination degree model. J. Clean. Prod. 2022, 380, 135044. [Google Scholar] [CrossRef]
  35. Sui, G.; Wang, H.; Cai, S.; Cui, W. Coupling coordination analysis of resources, economy, and ecology in the Yellow River Basin. Ecol. Indic. 2023, 156, 111133. [Google Scholar] [CrossRef]
  36. Sun, J.; Zhai, N.; Mu, H.; Miao, J.; Li, W.; Li, M. Assessment of urban resilience and subsystem coupling coordination in the Beijing-Tianjin-Hebei urban agglomeration. Sustain. Cities Soc. 2024, 100, 105058. [Google Scholar] [CrossRef]
  37. Yin, Z.; Tang, Y.; Liu, H.; Dai, L. Coupling coordination relationship between tourism economy-social welfare-ecological environment: Empirical analysis of Western Area, China. Ecol. Indic. 2023, 155, 110938. [Google Scholar] [CrossRef]
  38. Bian, H.R.; Liu, Y. A deep graph learning-enhanced assessment method for industry-sustainability coupling degree in smart cities. Sustainability 2023, 15, 1226. [Google Scholar] [CrossRef]
  39. Fan, S.; Liu, G.; Tu, Y.; Zhu, J.; Zhang, P.; Tian, Z. Improved multi-criteria decision-making method integrating machine learning for patent competitive potential Evaluation: A case study in water pollution abatement technology. J. Clean. Prod. 2023, 403, 136896. [Google Scholar] [CrossRef]
  40. Zhang, R.; Yang, J.; Ma, X.; Xiao, X.; Xia, J. Optimal allocation of local climate zones based on heat vulnerability perspective. Sustain. Cities Soc. 2023, 99, 104981. [Google Scholar] [CrossRef]
  41. Dong, G.; Ge, Y.; Liu, J.; Kong, X.; Zhai, R. Evaluation of coupling relationship between urbanization and air quality based on improved coupling coordination degree model in Shandong Province, China. Ecol. Indic. 2023, 154, 110578. [Google Scholar] [CrossRef]
  42. Fang, C.; Cui, X.; Li, G.; Bao, C.; Wang, Z.; Ma, H.; Sun, S.; Liu, H.; Luo, K.; Ren, Y. Modeling regional sustainable development scenarios using the Urbanization and Eco-environment Coupler: Case study of Beijing-Tianjin-Hebei urban agglomeration, China. Sci. Total Environ. 2019, 689, 820–830. [Google Scholar] [CrossRef]
  43. Wu, S.; Wang, D.; Yan, Z.; Wang, X.; Han, J. Coupling or contradiction? The spatiotemporal relationship between urbanization and urban park system development in China. Ecol. Indic. 2023, 154, 110703. [Google Scholar] [CrossRef]
  44. Sui, Y.; Hu, J.; Zhang, N.; Ma, F. Exploring the dynamic equilibrium relationship between urbanization and ecological environment—A case study of Shandong Province, China. Ecol. Indic. 2024, 158, 111456. [Google Scholar] [CrossRef]
  45. Lu, M.; Duan, Y.; Wu, X. Evaluation of the coupling and coordination degree of eco-cultural tourism system in the Jiangsu-Zhejiang-Shanghai-Anhui region. Ecol. Indic. 2023, 156, 111180. [Google Scholar] [CrossRef]
Figure 1. Theoretical framework.
Sustainability 16 04572 g001
Figure 2. The interactive impact mechanism of “alignment design–resource environment”.
Sustainability 16 04572 g002
Figure 3. Location and current situation of the study area. (a) The project passes through the “Qinghai Tibet Plateau Ecological Barrier” and “Loess Plateau Sichuan Yunnan Ecological Barrier” regions in China’s “two screens and three belts” ecological security strategic pattern. (b) The study area is one of the global biodiversity hotspots recognized by Conservation International (CI). (c) The major challenges faced by the project.
Sustainability 16 04572 g003
Figure 4. Route schemes.
Sustainability 16 04572 g004
Figure 5. Dynamic coupling between “alignment design” and “resource environment”.
Sustainability 16 04572 g005
Figure 6. “Alignment design–resource environment” coupling evolution mechanism.
Sustainability 16 04572 g006
Figure 7. The U-L coupling tower.
Sustainability 16 04572 g007
Figure 8. The coordination degree and coupling degree of U-L composite system for each scheme.
Sustainability 16 04572 g008
Figure 9. The degree of coordination and degree of coupling in the element layer ( U i L j ) of the KL scheme.
Sustainability 16 04572 g009
Figure 10. Coupling evolution trend.
Sustainability 16 04572 g010
Figure 11. The coordination degree and coupling degree of the internal and external indicators in the KL scheme.
Sustainability 16 04572 g011
Figure 12. The obstacle degree of various factors in the element layer and indicator layer.
Sustainability 16 04572 g012
Table 1. The key elements and characteristic indicators of the effects of interactive coercion on “alignment design–resource environment”.
System LayerElement LayerIndicator LayerTypeNatureSource
Resource
Environment System
Natural
environmental element U1
Terrain and landform conditions u11QualitativePositiveEngineering data;
Field investigation;
References [1,2,20,21,22,23]
Geological structural conditions u12QualitativePositive
Adverse geology (km) u13QualitativeNegative
Formation lithology conditions u14QualitativePositive
Hydrogeological conditions u15QualitativePositive
Ecological
environment
element U2
Number of environmentally sensitive
zones involved u21 (number)
QuantitativeNegative
Crossing the ecological protection red
line length u22 (km)
QuantitativeNegative
Biodiversity impact u23QualitativePositive
ecosystem impact u24QualitativePositive
Landscape impact u25QualitativePositive
Resource
element U3
Land resource occupation u31 (103 m2)QuantitativeNegative
Distribution of energy resources
along the route u32
QualitativePositive
Distribution of mineral resources
along the route u33
QualitativePositive
Distribution of tourism resources
along the route u34
QualitativePositive
Impact of water conservation area
along the route u35
QualitativePositive
Social
environmental
element U4
Compliance of road network layout u41QualitativePositive
Existing transportation conditions u42QualitativePositive
Land development intensity u43QualitativePositive
Ability to attract passenger and
freight flow u44
QualitativePositive
Line
Design
System
Engineering quantity
element L1
Line length l11 (km)QuantitativeNegative
Total length of bridges and tunnels l12 (km)QuantitativePositive
Tunnel auxiliary adit l13 (km)QuantitativeNegative
Number of stations l14 (number)QuantitativePositive“TB 10501-2016
Railway Engineering Environmental
Protection Design Specification”;
“Method for
Preparation of
Feasibility Study and Design Documents for Railway
Construction Goals”
References [24,25]
Earthwork volume l15 (104 m3)QuantitativeNegative
Demolition structure l16 (m2)QuantitativeNegative
Technical
feature
element L2
Maximum slope l21 (‰)QuantitativeNegative
Minimum curve radius l22 (m)QuantitativePositive
Conveying capacity l23 (Mt/a)QuantitativePositive
Coefficient of line development l24QuantitativePositive
Engineering condition
element L3
Construction difficulty l31QualitativePositive
Construction road constructionconditions l32QualitativePositive
Duration risk l33QualitativePositive
Tunnel auxiliary adit setting conditions l34QualitativePositive
Economic
element L4
Investment l41 (million)QuantitativeNegative
Annual converted engineering operation fee l42 (ten thousand/a)QuantitativeNegative
Investment payback period l43 (a)QuantitativePositive
Net present value l44 (ten thousand)QuantitativePositive
Internal rate of return l45 (%)QuantitativePositive
Table 2. U-L coupling degree classification system and relative development advantage judgment criteria.
DCoupling StrengthCoupling TypeRCoupling Characteristics
[0.900,1.000]Complete
coupling
Highly
collaborative
development
0 < R ≤ 0.9Highly coupled–external system lag type
0.9 < R < 1.1Highly coupled–internal and external system synchronous type
R ≥ 1.1Highly coupled–internal system lag type
[0.800,0.899]High-quality couplingHigh-quality
collaborative
development
0 < R ≤ 0.9High-quality coupling–external system lag type
0.9 < R < 1.1High-quality coupling–internal and external system synchronous type
R ≥ 1.1High-quality coupling–internal system lag type
[0.700,0.799]Good
coupling
Good
collaborative
development
0 < R ≤ 0.9Good coupling–external system lag type
0.9 < R < 1.1Good coupling–internal and external system synchronous type
R ≥ 1.1Good coupling–internal system lag type
[0.600,0.699]Intermediate couplingIntermediate
collaborative
development
0 < R ≤ 0.9Intermediate coupling–external system lag type
0.9 < R < 1.1Intermediate coupling–internal and external system synchronous type
R ≥ 1.1Intermediate coupling–internal system lag type
[0.500,0.599]Primary
coupling
Reluctantly
collaborative
development
0 < R ≤ 0.9Primary coupling–external system hysteresis type
0.9 < R < 1.1Primary coupling–internal and external system synchronous type
R ≥ 1.1Primary coupling–internal system lag type
[0.000,0.499]Low-level
coupling
Imbalanced
recessional
0 < R ≤ 0.9Low-level coupling–external system lag type
0.9 < R < 1.1Low-level coupling–internal and external system synchronous type
R ≥ 1.1Low-level coupling–internal system lag type
Disclaimer/Publisher’s Note: The statements, opinions and data contained in all publications are solely those of the individual author(s) and contributor(s) and not of MDPI and/or the editor(s). MDPI and/or the editor(s) disclaim responsibility for any injury to people or property resulting from any ideas, methods, instructions or products referred to in the content.

