
Mining Associations between Air Quality and Natural and Anthropogenic Factors


Information Technology and Management Program, Ming Chuan University, No. 5 De-Ming Road, Gui-Shan District, Taoyuan City 333321, Taiwan
Sustainability 2024, 16(11), 4614; https://doi.org/10.3390/su16114614
Submission received: 30 April 2024
/
Revised: 25 May 2024
/
Accepted: 26 May 2024
/
Published: 29 May 2024
(This article belongs to the Special Issue Sustainable Low–Cost Air Pollution Monitors and Air Quality)
Abstract
:The urbanization and industrialization of human society boost the socioeconomic growth but yet inevitably result in unprecedented damages to environment and organisms. One of the threats is the air pollution produced from anthropogenic activities. Moreover, the pollution concentrates longer in certain meteorological phenomena and exacerbates the impact on nature species and human health. This paper presents an association mining approach to identify the influential factors which result in a high volume of air pollution concentration, in particular, the particulate matter with aerodynamic diameter ≤ 2.5 μm (PM2.5). Since the literature showed that the identified factors are location and spatial-scale dependent, we chose a basin geography, Puli township, Taiwan, and inferred the association relationships with two different-scaled monitoring stations. The government-built supersite at Puli estimates the PM2.5 concentration for the entire township of the area around 150 km2, while the participatory microsites monitor air quality in a smaller region of a hundred thousand square meters. Our research was conducted with relevant data during 2017–2019. The mining result has unique findings as compared to the literature. The relative humidity, precipitation, wind speed and direction, which were identified as major factors in many previous studies, have less impact on air quality of our studied field than temperature and atmospheric pressure. The remarkable distinction is mainly attributed to the special weather patterns of basin geography. We investigated the impact of all national festivals and identified the most significant ones. The probability of observing PM2.5 concentrations greater than 35 μg/m3 in the activity hours of New Year’s Eve is 50% which is significantly greater than 11.74%, the probability of observing the same concentration range over all days in the investigated years, while the Tomb Sweeping Day (TSD) has a varying impact on air quality depending on the order of the TSD date within the long holiday. The increase of PM2.5 concentration is remarkably more significant if the TSD is the last day in the long holiday than if it is the middle day. This finding can be taken into consideration when the government agent makes schedules for national festivals. Finally, it was learned in our study that different landmarks and land uses have various significant impacts on micro-scale air quality. The microsites monitor high PM2.5 concentrations at particular landmarks with a greater confidence than the mean confidence over all microsites. These pollution-associated landmarks with the confidence ranked from highest to lowest are night markets, crossroads, paper mills, temples, and highway exits. It is worth noting that the PM2.5 increase contributed by temples is negligible, which may be attributed to the citizen action for promoting reduction in joss paper and incense stick burning. The land uses have diverse impacts on air quality. Anthropogenic activities contribute higher PM2.5 concentrations in business districts and residential areas. The PM2.5 concentration monitored at high lands and agricultural lands is lower than the overall background due to fewer mass gathering and combustion activities in these land uses.
1. Introduction
The industrialization and urbanization of human society have inevitably posed environmental hazards in our water, land, and air. The conflict between pollution reduction and economic growth needs to be resolved by establishing a prudent strategy for sustainable development. In particular, several core actions to facilitate the Sustainable Development Goals (SDGs) [1], such as clean water and sanitation, affordable and clean energy, sustainable cities and communities, responsible consumption and production, and climate action, have been taking place internationally to reach such an equilibrium between development and sustainability.
Researchers have shown the impacts of particulate matter with aerodynamic diameter ≤ 2.5 μm (PM2.5) emissions on many aspects, such as climate change [2], atmospheric visibility [3], plant species mortality [4], and human health [5]. PM2.5 consists of complex compounds which are inhaled into human lungs and cause chronic and acute respiratory diseases [6,7]. Even worse, some of the compounds are poisonous and have potential pathways to develop cancers [8,9]. The World Health Organization (WHO) has reported that ambient PM2.5 emissions were estimated to cause 4.2 million premature deaths worldwide in 2019 [10]. However, the sources of PM2.5 emissions come from various anthropogenic activities and the natural environment, and the volume of source concentrations further depends on external factors such as meteorological conditions and land terrains. It is challenging to quantify the impact of each influential factor on every air pollution episode.
To facilitate quantification analysis, the infrastructure of PM2.5 monitoring stations needs to be built up. There are two categories of such stations, supersites and microsites. The supersites are able to analyze the chemical compositions of the captured pollutants and are thus expensive. Usually, supersites are invested by government and deployed at hotspots of pollution-emitting sources, such as industrial districts, petrochemical complexes, or power generation plants, so the government air-quality agency can collect evidence when air pollution is detected. Another usage is to settle supersites at a few open spaces to monitor the overall air quality of cities for providing air quality information to citizens, and also, the researchers can use this public information for analyzing cross-city transportation of air pollution. However, as the supersites are expensive and it is not economical to densely deploy them everywhere, an alternative is to build microsites which are low cost and can be built with a higher density. The microsites are not capable of analyzing the PM2.5 apportionment but only measure the mass concentrations. Due to its simple hardware, the microsite needs to be calibrated by reference to a nearby supersite before the monitoring task is on operation. The PM2.5 concentration measured by microsites is easily influenced by local emissions within a short distance to the microsites. So the PM2.5 measure obtained from microsites can be considered as an indication of local emerging pollution. Therefore, supersites and microsites have complementing applications, and it is promising to analyze the influential factors on air pollution from the perspectives of large and small scales of both types of monitoring stations.
As of end of 2023, the Taiwan Ministry of Environment (MOENV) has built up 86 supersites nationwide (see Figure 1a), most of which were installed on the west coast of Taiwan where it is most populated. These supersites report hourly air quality index (AQI)-related measures such as PM2.5, PM10, CO, O3, SO2, NO2, wind speed and direction, and rainfall. The AQI data measured at supersites are applicable in describing the air quality on a large spatial scale such as 2 km × 2 km. It is not suitable for characterizing local emissions within a place with only hundreds of square meters. On the other hand, the Taiwan Digital Construction Design Project for construction of the IoT of low-cost sensors has consolidated several participating organization units to deploy more than 9600 microsites in Taiwan by the end of 2023 (see Figure 1b). Although the low-cost microsites cannot identify the chemical components in the pollutants, they do offer an opportunity for higher-density air pollution analysis, especially for local emissions of occasional events.
Located in the west coast cities in central Taiwan are several fire-combustion power plants and large petrochemical complexes, which are considered to be among the suspicious sources causing air pollution episodes in these coastal cities. The emissions of PM2.5 not only spoil the air quality but also have been an issue of debate raised in recent election campaigns. Several studies have been conducted to investigate the impact of these production activities on the air quality and citizens’ health, such as [8,11].
Due to the geography and monsoons along the west coast of central Taiwan, the PM2.5 emissions are easily trapped by particular meteorological scenarios in an adjacent mountain basin, the Puli township, which accommodates about 76,000 citizens in 162 km2 and sits to the east of the coast cities. Nevertheless, most existing case studies are focused on the west coast areas with dense population and neglect the necessity to investigate Puli township. In addition to a viable case study for analyzing external pollutants, Puli is also an appropriate candidate for conducting influential factor analysis for local emissions because the socioeconomic activities in this small town are mostly routine, such as commuting, administration and office works, night markets, temple rituals, and local leading economies like agriculture and the pulp and paper industry, in contrast to diverse socioeconomic events and various sectors in the west coast cities.
1.1. Natural and Anthropogenic Factors Affecting Air Quality
As previously noted, natural and anthropogenic factors are two major contributing factors for air pollution. However, the way these factors influence air quality is not linear, but dependent on locations and time periods of the subject. Therefore, studies have been conducted in many different places and time spans to disclose the relationship. For the study of the impact of meteorological factors, Wang et al. [12] investigated the impact of five meteorological variables on PM2.5 pollution during January 2017 in the 14 most polluted cities in China. The result shows that planetary boundary layer height, wind speed, and precipitation have highly linear trends with the PM2.5 concentration, while temperature and the water vapor mixing ratio have positive impacts on pollution but only under certain conditions. Chen et al. [8] investigated variations of 22 PM2.5-bound polycyclic aromatic hydrocarbons (PAHs) species in relation to meteorological factors at four monitoring supersites located in Changhua County in central Taiwan from 2014 to 2015. The Pearson correlation measure shows that the PAHs volume has a significantly negative correlation with temperature and relative humidity but a positive correlation with atmospheric pressure. Hsu and Cheng [11] studied the influence of meteorological indicators on PM2.5 concentrations at four monitoring supersites in Yunlin County, Taiwan. Six meteorological clusters are identified by using hourly precipitation, temperature, wind direction, and wind speed. The PM2.5 concentrations of each cluster on those days are analyzed. It is concluded that the clusters with a continental anticyclone or a stagnant local circulation produce high PM2.5 concentrations, while low PM2.5 concentrations occur in the cluster associated with a strong southwesterly monsoonal flow. Dhyani et al. [13] developed a PM2.5 concentration prediction model along an urban highway in Delhi, India. The vehicle variables, such as types, sizes, and ages, motorized or non-motorized, together with meteorology variables, such as wind speed and direction, relative humidity, temperature, solar isolation, and cloud cover, are incorporated into the California Line Sources Dispersion (CALINE 4) prediction model. It was found that little linear correlation existed between traffic variables and PM2.5 concentrations, attributed to the dynamics of meteorology variables. Lee et al. [14] analyzed the relationship between the indoor PM2.5 infiltrated from the outdoor PM2.5 in Boston. Linear regression models were used to determine the most significant factor in a set of meteorology variables, and it was found that increases in temperature are highly associated with increased PM2.5 infiltration. Yin et al. [15] predicted daily PM2.5 concentration from PM10 and meteorological factors in Beijing. The most influential variables are PM10 and relative humidity identified by a multiple nonlinear regression model. A case study for the prediction of PM2.5 in Sanandaj, Iran was conducted in [16]. Independent variables including the previous day PM2.5, PM10, SO2, NO2, CO, O3, minimum temperature, maximum temperature (Max T), atmospheric pressure, precipitation, wind speed (WS), and relative humidity were tested by four machine learning models. It was identified that PM2.5, PM10, SO2, O3, Max T, and WS are the most significant variables among all. Niska et al. [17] proposed a multi-objective genetic algorithm (MOGA) prediction system for airborne maximum pollutant concentrations in Helsinki, Finland, by selecting the most important inputs from a large set of meteorological variables, such as temperature, atmospheric pressure, precipitation, wind speed, relative humidity, solar radiations, cloudiness, moisture parameter, etc. Then, the prediction system was developed by the multi-layer perceptron (MLP) using the MOGA-selected inputs. These noted studies all share the common implication that the meteorological factors have significant relationships with increases in air pollution and the relationships are location-dependent.
In addition to meteorological factors, some studies showed that anthropogenic events held on festivals affect the compositions of air pollutants and worsen the air quality. Tsai et al. [18] studied the impact on air quality from evening barbeque events at the Mid-Autumn Festival in southern Taiwan. It was found that 37.6–44.5% of the PM2.5 mass concentration is composed of inorganic salts and 26.3–42.8% is from total carbon. Although a noticeable amount of aerosols was produced in the festival, the impact on air quality is discounted by the onshore air current. Chen et al. [19] conducted a case study for First-God Birthday, a traditional festival on 9 January of the lunar calendar. In the midnight hour of this festival, religious believers will burn incense sticks and joss papers for worshipping the first-god in Tao. During the event time span, the PM2.5 mass concentration rises up rapidly in Tao temples and households.
The impact of land use on air pollution is studied in literature. In Yousefi et al. [20], for long-term PM2.5 trends during 1980–2020, China was divided into six regions according to concentration mass and land cover types. The findings disclose there is a trend of PM2.5 mass increase during 1980–2007 mainly due to urbanization and deforestation. The trend changes during 2007–2020 to decreasing PM2.5 concentrations attributed to air pollution control policies enforced in the 11th, 12th, and 13th national Five-Year-Plans during 2005–2020. Zhao et al. [21] conducted a deep learning simulation for investigating the effects of urban land use and meteorological conditions on PM2.5 concentration. The study field covers all of Wuhan, which is an industrial city in China, and the data in 2016 are collected. The simulation results show that PM2.5 concentration caused by construction land such as industrial, residential, transportation, logistics and warehousing, commercial, utilities, and public service sequentially decreases. With the floor area ratio (FAR), which is the ratio of the total building area to the land area, it shows a reverse relationship between FAR and PM2.5 pollution in most northern regions in Wuhan. Di et al. [22] incorporated meteorological variables, land use terms, and spatiotemporal-lagged terms for PM2.5 mass concentration prediction. The land use terms are used to capture smaller spatial scale emission variations which may not be captured by supersites on a wider scale. These land use terms, in particular, percentage of urban areas, population density, road density, elevation, and distance to the nearest monitoring site, are useful for characterizing local emissions. Habermann et al. [23] chose socioeconomic factors, namely, the altitude, distance to industrial districts, distance to expressways, traffic flow, and demographics to model NO2 concentration by multiple linear regression. Liu et al. [24] applied spatial linear regression on neighboring monitoring sites and socioeconomic variables in the Yangtze River Economic Belt from 2000 to 2016. The employed socioeconomic variables include vegetation coverage, population density, gross domestic product, secondary industry sectors, and energy consumption. Based on analysis results, policy implications for local government were proposed in their work. Yang et al. [25] applied spatial regression with a quadratic expression to disclose the contribution of urbanization, industrialization, and green land area, to the accumulation of PM2.5 concentrations. Their result manifests that there was a positive correlation between urbanization and PM2.5 concentrations, and it shows a negative correlation between urbanization and PM2.5 variations. The result implies that more urbanized areas have relatively constant high PM2.5 concentrations.
1.2. PM2.5 Supersites and Microsites
Depending on the application and cost of building the PM2.5 monitoring stations, supersites and microsites are candidates for deployment. Supersites are applicable for analyses of PM2.5 apportionment and long-term concentration trends which are the focus of traditional air pollution research [26,27]. However, supersites are expensive and are not constructed with a high density but only in populated areas and pollution hotspots. Taiwan MOENV has deployed two types of supersites, namely, the manual and automatic monitoring stations, see https://airtw.moenv.gov.tw/CHT/EnvMonitoring/Central/spm.aspx (accessed on 20 April 2024). There are 31 manual supersites deployed and each of them requires human labor to set up filters, collect samples, maintain and measure the particulate matter every three days, which is laborious and not suitable for real-time analysis, while the automatic supersites apply the beta ray attenuation method to automatically gauge the PM2.5 mass concentrations in air. A glass-material filter paper with a sieve is used to collect airborne particulate matter less than 2.5 μm in diameter. By emitting Carbon-14 (14C) radiation to pass through the filter paper with and without samples, the beta ray decrement can be gauged separately. The difference of decrement is used to calculate the particle mass.
Low-cost and low-power microsites are a complementary solution to supersites to offer denser coverage of the monitoring field which does not require the information of chemical components. Microsite sensors need to be calibrated by reference to supersites in order to remedy the physical limitations of the low-cost instrument [28,29]. Unlike supersites which must be deployed at a fixed location, microsites can be either fixed or mobile. Due to high mobility, microsites can be used as a complement to fixed location supersites for estimating a continuous PM2.5 concentration surface [30,31]. Because of their low cost and low power, microsites can be deployed with fine-grained resolutions and in rural areas where power supply is usually limited. For example, Keyes et al. [32] calibrated low-cost sensors by reference to state-sponsored supersite monitors to achieve satisfactorily accurate readings. Then, the authors identified potential driving factors of elevated readings of low-cost sensors located in the chosen micro-scale community area which is overlooked by macro-scale analyses with supersite readings. Chen et al. [19] deployed more than 2500 microsites in Taiwan and 29 other countries. Quartz crystal microbalance (QCM) and laser light scattering (LLC) are the two main techniques for developing microsite sensors. The particulate matters concentrate on the QCM oscillator will cause a difference in mass loading and alter the frequency of QCM. The mass difference and frequency change are used to estimate the particle mass density. The working principle of LLC is to use a laser to illuminate the suspended particles in air to generate light scattering. The scattered light is then collected at a certain angle to estimate the particle size and the number of particles of each measure size per unit volume.
1.3. Association Rule Mining
Association rule mining (also termed as market basket analysis) is a very useful approach in business intelligence and this approach has been successfully applied in recommendation systems for various business domains such as catalog design, commodity display arrangement, joint-sale promotion, cross marketing, and loss-leader strategy [33,34]. Association rule mining finds confident associations or strong correlation relationships among data items contained in a large transaction database. These relationships, represented as rules, can help decision makers to build strategies. The association rules with high confidence indicate the consensus over many transactions on shared items. For our air-pollution application, the confident rules release the influential factors resulting in various categories of air quality.
Agrawal et al. [35,36] proposed the first algorithms for mining association rules in a large database, in particular, the Apriori algorithm which finds frequent itemsets through an iterative join-and-prune process. The frequent itemsets are constructed from those containing exactly one item. A minimum support threshold is used to prune the itemsets which appear less than the threshold. Hence, the size of the candidate frequent itemsets can be kept as minimal as possible. The frequent 1-itemsets are then merged to generate candidate 2-itemsets which are again subject to the pruning process with the same minimum support threshold. The join-and-prune process is iterated until no larger-size frequent itemsets can be generated. Finally, the significant association rules having confidence greater than a minimum confidence threshold can be yielded from all the frequent itemsets previously generated.
Several algorithms were proposed for improving the computational efficiency of the Apriori algorithm. For example, Savasere et al. [37] proposed a partition-based Apriori algorithm which partitions the transaction repository into several segments. For each segment, the local frequent itemsets are first produced. Then, all local frequent itemsets are merged to generate genuine global frequent itemsets. The algorithm reduces the computational burden by putting off the merge process to the last step; however, the incurred storage size for temporarily storing the local frequent itemsets could be significantly larger than that required by the original Apriori algorithm. Pei and Han [38] proposed an FP-Growth algorithm to add more constraints on frequent itemsets which share a common prefix. The FP-Growth algorithm consists of two phases. In the first phase, the FP-tree tallies the support information of all item sequences according to the descending order of the support value of the items. The support information of frequent itemsets sharing the same prefix can be saved by only storing once their common subtree stemming at the root of the FP-tree. In the second phase, the FP-tree is scanned in a bottom-up order to generate all prefix FP-paths excluding the leaves. The common prefix FP-paths, if their support is no less than the minimum support threshold, can be merged with the leaf item to produce the true frequent itemsets. When the merging process is completed, all the leaves are removed from the FP-tree. The bottom-up scanning for the new FP-tree is repeated until the FP-tree has only one root which is also a frequent item.
1.4. Research Problem, Contributions and Limitations
The research problem of our paper aims at how to automatically identify influential natural and anthropogenic factors on air quality. Our paper contrasts existing works in several aspects which constitute its contributions as follows.
- As the potential factors vary in spatial scales of air quality-influencing areas, we propose a two-scale analysis framework which includes PM2.5 data from both the Puli supersite and microsites as air-quality indications in terms of coarse and fine resolutions, as a contrast to the single-scale approach adopted by most existing literature.
- To the best of our knowledge, our paper is the first work proposing an association rule mining approach for disclosing the relationship between PM2.5 concentrations and natural and anthropogenic factors. The most relevant literature focused on finding association rules between PM2.5 and PM10 [39] or PM2.5 and diseases [40]. Our research further extends the application reign of using association rule mining in air-quality research.
- The mining task is conducted from the perspective of both macro and micro points of view. The macro-scale association mining aims at gauging the influence on supersite reading variations from wider-area global factors such as meteorological conditions and nation-wide festivals. The micro-scale, on the other hand, infers the association between microsite-tallied PM2.5 concentrations and local landmarks and land uses, where the ancillary activities have impacts on air quality within a smaller area.
- Association rule mining enables us to conduct an exploratory research which broadly explores a large pool of potential factors with minimal human efforts. The mining process automatically scans the cross-sectional data and digs out the significant rules. These rules provide valuable insights for the government to design air-quality control policies and urban development plans. As the microsites are located near citizens’ households, our micro-scale analyses identify the most influential anthropogenic activities in the community. The findings encourage the citizens to take actions against the pollution and increase their willingness to join the deployment of participatory microsites, which further improve the density and applicability of the microsites in the future.
Due to the practical constraints, our research has the following limitations. Firstly, the microsites were deployed at the houses of participatory citizens, so they are not evenly distributed in Puli. For the areas without operating microsites within proximity, Gaussian imputation is applied to estimate the PM2.5 concentration, which may introduce bias in the analysis results for these areas. Secondly, because the participatory citizens are not always able to immediately restart the sensors after unexpected shutdowns, the data missing rate for some microsites could be high. Some implicit but significant microsite-associated rules may be overlooked due to low support rate in some instances. Thirdly, both short-term and long-term analysis approaches have been conducted in the literature and the choice depends on the research goals or data availability. The data used in our research were collected during 2017–2019 mainly because the investigated microsites were installed in 2017 and they were not well maintained after 2019 since COVID appeared. The three-year data are used to identify potential driving factors for elevating PM2.5 readings; the data may not be suitable for conducting long-term spatiotemporal analysis of PM2.5 variations which usually spans over a decade.
2. Proposed Methods
2.1. Data Collection
To explore the co-occurrence relationships between air quality and the natural and anthropogenic factors, the acquired data are downloaded from several open data repositories for conducting experiments. The datasets include air-quality PM2.5 concentration measures, weather condition measures, dates of nation-wide festivals, human-constructed landmarks, land uses, and altitudes. The content of the datasets is described as follows.
Our studied field is at the Puli township which is a basin (as shown in Figure 2a) at the geographical center of Taiwan. The metropolitan Taichung City is to the west of Puli, and Highway 6 passing through the north of Puli is the main transportation route the citizens will take for commuting or vacation. Our air-quality datasets are prepared with two spatial scales, macro-level and micro-level. The macro-level dataset is transformed from the single Puli supersite of Taiwan MOENV at https://airtw.moenv.gov.tw/ (accessed on 20 April 2024) which is located at the Puli downtown center (as marked by the red star in Figure 2a) and reports one measure of PM2.5 mean concentration within every hour. The Puli supersite installed the PM2.5 sensor model Met-One Instruments BAM-1020 which applies the beta ray attenuation method to gauge the PM2.5 mass concentrations. The micro-level dataset is generated from the hourly PM2.5 measure at the 29 participatory microsites as indicated by blue bullet marks as shown in Figure 2b, which is maintained by the AIRQ laboratory at National Chi Nan University [29]. All the microsite sensors are the same product model Plantower G7 PMS7003 which applies laser light scattering for concentration measurement. In our previous work [28], we applied ensemble-learning method for calibration of these microsite sensors against the Puli supersite to ensure the quality of microsite readings. As the 29 microsites are not uniformly distributed in Puli, we divide the Puli township area into grids (see Figure 2b) with each grid of 800 × 800 m2. Within each grid, we calculate the mean PM2.5 concentration if there are more than one microsites in the grid. For the grid without any microsites deployed in it, we estimate its concentration by the Gaussian imputation method [41]. The time span of both macro-level and micro-level air-quality datasets is the hourly PM2.5 concentration data between 1 January 2017 and 31 December 2019.
Figure 3 shows the histogram of distributions of the hourly PM2.5 for the supersite and microsite datasets. There are several discrepancies between the two datasets. (1) The range of PM2.5 concentration measured at microsites lies in greater values than the observation at the supersite. The mean value for the PM2.5 concentration is 27 and 21 μg/m3 for microsite and the supersite datasets, respectively. This is because most of the microsites are deployed in downtown area and they are easily influenced by local anthropogenic activities, ranging from halting vehicles at the crossroads, incense stick burning at temples, outdoor cooking at markets, among others. Hence, microsites are potentially good indicators for detecting local emerging pollution events. (2) The PM2.5 concentrations of the single supersite have a quasi-normal distribution, while the overall PM2.5 distributions of the 29 microsites are mixtures of more diverse ones. This phenomenon indicates that the PM2.5 supersite which was deployed in a large open space can serve as an air-quality indicator for the entire Puli township, while the PM2.5 concentration measured at the microsites is sensitive to diverse local scenarios such as land use, schools, highway exits, crossroads, markets, and temples. (3) It is seen that the mean data missing rate for microsites is over 38% which is significantly higher than 1.6% for the supersite. This is because those microsites are maintained by participatory citizens and they cannot immediately restart the sensors after the shutdowns because these participators may not be at home. With this high missing rate, it is likely some implicit but significant association rules are overlooked by microsites due to low support rate in some instances.
To disclose meaningful association rules according to the particular properties of the air-quality datasets, we will use the supersite dataset for mining relationships between air pollution and the global factors influencing most areas of Puli township. The microsite dataset will be used to infer the relationships between air pollution and the local activities in the proximity within 250 m to the microsite sensor. The maximum proximity distance is determined based on preliminary experiments of microsite sensitivity with various distance settings.
Our weather data are mainly obtained from the MOENV which tallies the hourly meteorological measures for temperature, relative humidity, wind speed and direction. To prepare rich weather data for association rule analysis, we further include the data for atmospheric pressure and precipitation from the Taiwan Central Weather Administration, https://codis.cwa.gov.tw/StationData (accessed on 20 April 2024). The distributions of these weather indicators are shown in Figure 4. The collected weather data are sufficient for association rule mining because the data missing rate for both weather datasets is lower than 1%. In order to disclose meaningful association rules, the numerical weather data are divided into three value ranges according to data distributions as will be noted.
For the dataset about anthropogenic factors, we record the following features, the dates of national festivals, the locations of temples, crossroads, paper mills, highway exit, night markets, elementary schools, land use planning, and the land altitude. To save space, some of the features are shown in Figure 5. In Figure 5a, temples are marked by red position markers; the three highway exits are located at blue stars. In Figure 5b, the red position markers indicate the paper mills, while the two blue stars display the locations of the night markets. In Figure 5c, the land use data are obtained from the Land Use Query System at https://luz.tcd.gov.tw/WEB/ (accessed on 20 April 2024) maintained by the Construction and Planning Agency of Taiwan Ministry of the Interior. Various land uses are assigned with different colors. For example, the land for schools is colored by purple, the land for agriculture is colored by yellow, and the land for business is colored by dark red. The planning of land use significantly influences the type of anthropogenic activities on the land. For instance, there are fewer pollution-producing anthropogenic activities on agricultural land, and air pollution easily concentrates at the business district at meal times or during traffic hours. In Figure 5d, the land altitude shows the terrains which implicitly affect the volume of anthropogenic activities. Higher land area is less populated, and its air quality is usually cleaner than that observed in lower land which is densely populated and producing more anthropogenic activities.
2.2. Data Processing
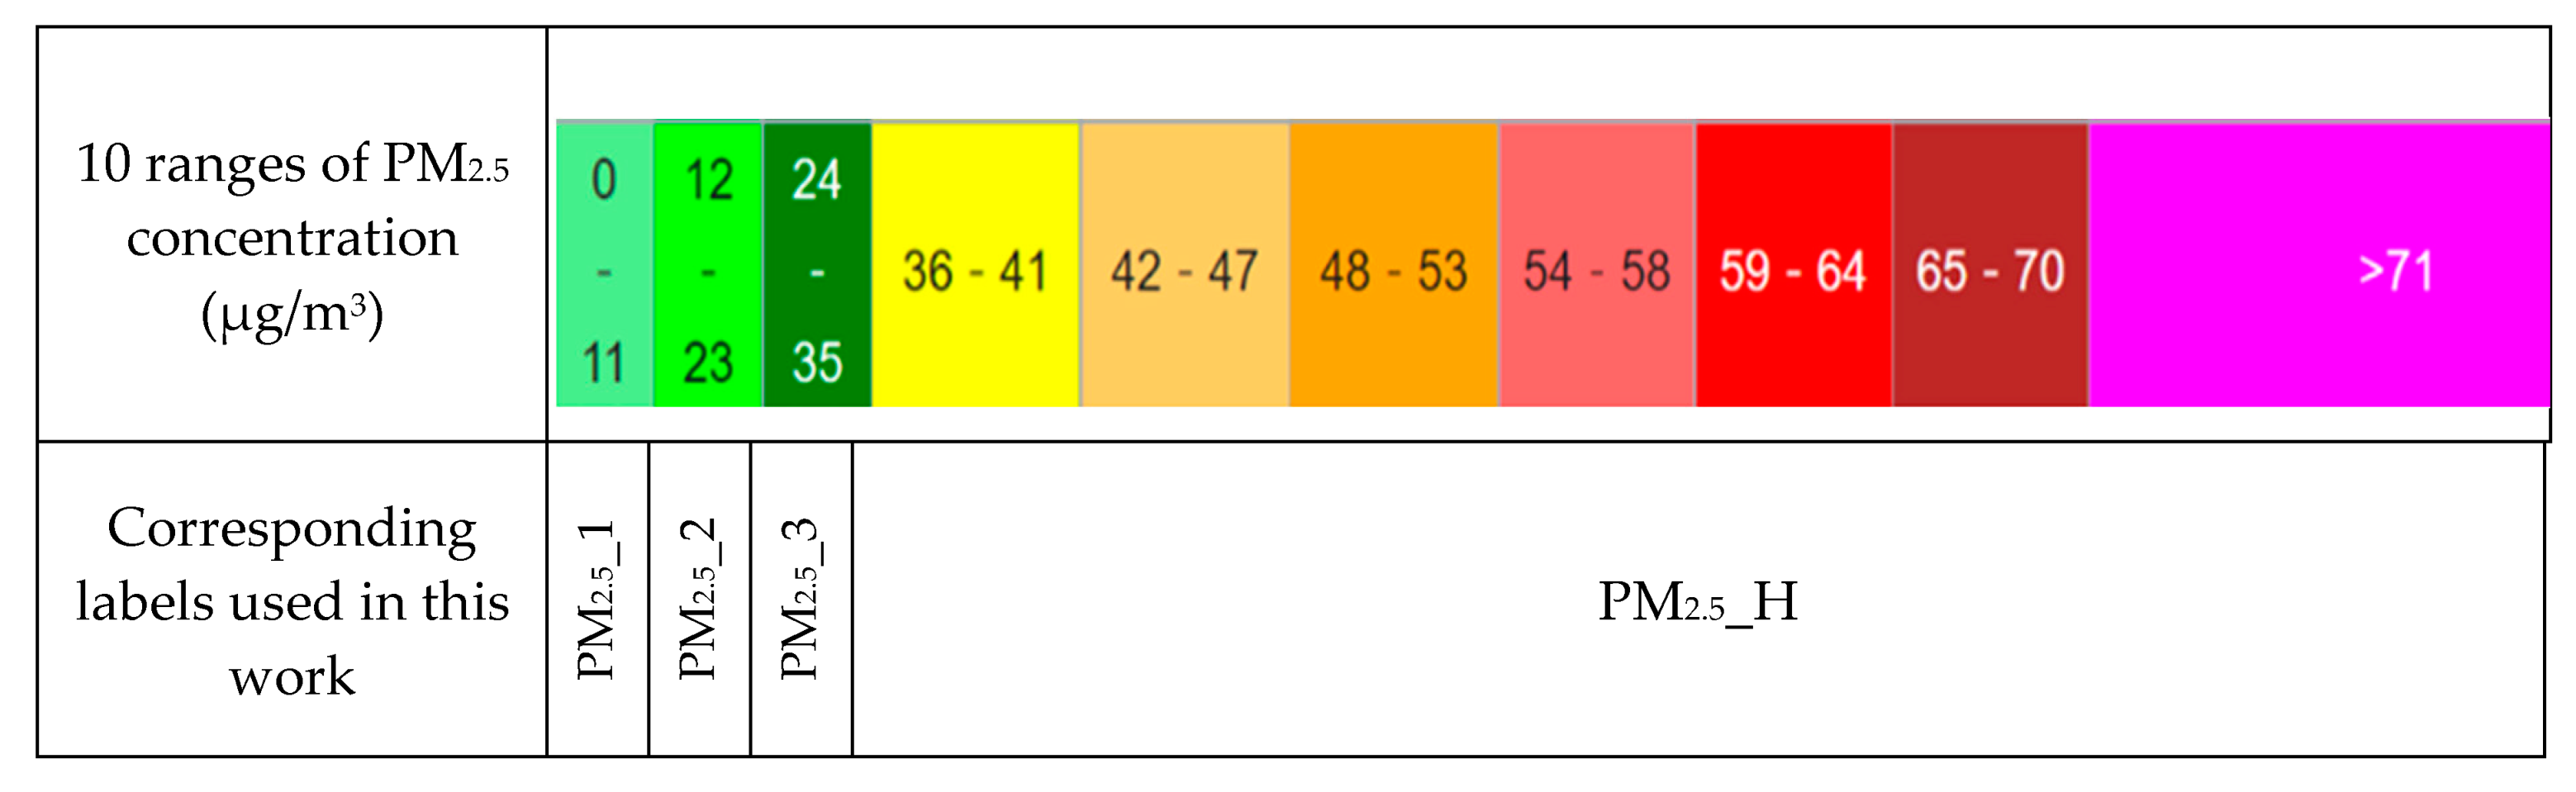
In order to disclose meaningful association rules, the numerical data need to be transformed to categorical data. The numerical data include PM2.5 concentrations and some weather metrics. The categorization process is to divide the numerical data into several value ranges and assign each range a label. As shown in Figure 6, we categorize the PM2.5 concentration values with four labels based on the 10 air-quality alert levels announced by the air-quality government agency supervising Puli township, namely, the Nantou County Environmental Protection Bureau of Taiwan (NCEPB) [42]. Our labels, PM2.5_1, PM2.5_2, PM2.5_3, and PM2.5_H, indicate the PM2.5 concentration (μg/m3) falling in the ranges of (0, 11), (12, 23), (24, 35), and (greater than 35), respectively. Although the data ratios in the four ranges to the overall data volume are not equal, the used ranges retain the correspondence to the referred 10 air-quality alert levels and our analysis results can be easily perceived by the public.
For numerical meteorological indicators, the temperature (TP), relative humidity (RH), wind speed (WS), and atmospheric pressure (AP) are divided into three value ranges according to data distributions such that each range contains data which has a similar proportion to its overall data amount in order to avoid inference bias. However, 92.33% of the precipitation (Prec) data are less than 0.1 mm (see Figure 4f), so we can only make the remaining two ranges have similar proportions and perform the association rule mining for Prec separately. The threshold values derived for each meteorological indicator are listed in Table 1. The thresholds divide each indicator into three ranges which are labeled as ‘L’, ‘M’, and ‘H’ to indicate low, medium, and high value ranges, respectively. For example, label ‘TP_H’ indicates the data category referring to a record in the high temperature range. The original wind direction data are already in alphabetical form as ‘N’, ‘NE’, ‘E’, ‘SE’, ‘S’, ‘SW’, ‘W’, and ‘NW’, to represent the eight main directions of the wind flow. We thus retain the original wind direction data to conduct association rule mining.
2.3. Association Rule Mining
The association rule mining conducted in this paper considers the hourly cross-sectional records from previously noted multiple datasets as transaction data. The analysis for macro- and micro-level mining is conducted separately. The macro-level mining uses MOENV air quality dataset and the global factor datasets including meteorology indicators and dates of national festivals, while the micro-level mining uses AIRQ air quality dataset and the local anthropogenic factor datasets. For both mining levels, the air-quality dataset is used as the source for rule consequents and the factor dataset is used for rule antecedents. The procedure for both mining levels is the same. In general, given a full itemset A = {i1, i2, …, in} where ij can be an instance of air-quality labels or factor labels as described in Section 3.2. A hourly cross-sectional record I is defined as a non-empty subset of A, i.e., I ⊆ A. In a three-year time span, our transaction dataset T = {I1, I2, …, Im} contains m = 3 × 8760 records. Some records may contain ‘NaN’ label due to the missing values from sensors; such records are removed from our transaction dataset for avoiding bias. In association rule mining, the support of an itemset is defined as the probability the itemset appears as a subset of any record of T. Let sup(I) denote the support of itemset I. A frequent itemset is an itemset whose items would occur in records of T with a probability no less than min_sup, the minimum support threshold specified by the user. Formally, I is called frequent if sup(I) ≥ min_sup. Agrawal et al. [35] proposed the Apriori algorithm which can find frequent itemsets through a join-and-prune hierarchical process. The algorithm starts with all frequent 1-itemsets which contain exactly one item and have a support value no less than min_sup. The frequent 1-itemsets are joined to create plausible frequent 2-itemsets, which are then pruned to produce genuine frequent 2-itemsets by discarding those 2-itemsets with a support value less than min_sup. The join-and-prune hierarchical process is conducted to produce frequent itemsets with more items until no frequent itemsets can be found further.
The association rules are produced from the frequent itemsets. Let I be a frequent itemset, X and Y be a bipartition of I, i.e., X ⊆ I, Y ⊆ I, X Y = Ø and X Y = I. The confidence of an association rule indicates the conditional probability of observing Y in any frequent itemset I given that X is also contained in I. Formally, the confidence of an association rule , denoted by , is calculated as follows.
An association rule is called confident if its confidence is no less than min_conf, the minimum confidence threshold specified by the user. To validate if the confidence of this rule is more significant than that of seeing Y in a draw-straw record from the transaction dataset T, a measure is defined as follows.
Hence, the association rule is meaningful if ; otherwise, the association rule is no more significant than a random draw-straw and should be discarded.
With the association rule mining algorithm, we are able to find confident rules with a lift value greater than one. Our interested rules are those which contain factor labels in the rule antecedents and the air-quality label as the rule consequent in order to explain the relationship between influential factors and the air quality alert categories.
3. Results
After data processing, our datasets contain only categorical data which are ready for conducting association rule mining. The mining is performed separately from the macro- and micro-level points of view. On the one hand, the macro-level mining is focused on the air quality of the entire Puli township and global factors. The macro-level air quality is described by using the Puli supersite dataset. The indicators contained in the meteorological dataset and the dates of national festivals are considered as global factors because the weather conditions within the entire Puli township are nearly homogeneous, and the town activities on national festival dates such as New Year fireworks, barbeque on Mid-Autumn festivals, and temple worship incur heavy traffic and celebrating activities over all streets in this small town. On the other hand, the micro-level mining uses the microsite dataset to infer the relationships between air pollution and the local anthropogenic activities in the proximity within 250 m to the microsite sensor. The local anthropogenic activities which have potential impact on the air quality are strongly related to local constructions or terrains such as temples, crossroads, paper mills, highway exits, night markets, elementary schools, land use, and land altitude, to name a few. We will elucidate the association rule mining between potential factors and air quality in both macro- and micro-level in the following.
3.1. Macro-Level Pollution Episodes at Supersites
In this section, we present the macro-level air pollution mining discussions with two global factors, the meteorological indicators and the dates of festivals.
3.1.1. Associations between Air Quality and Meteorological Indicators
A substantial number of studies [8,11,12,13,14,15,16,17] have evidenced the close relationships between air quality and meteorological indicators. In light of this, we conduct the association rule mining between the macro-level PM2.5 supersite dataset and our weather dataset. As previously noted, 92.33% of the precipitation (Prec) data are less than 0.1 mm and are labeled as Prec_L (low precipitation), so we will deal with the association for precipitation separately from the other meteorological indicators as will be noted. To disclose the most influential meteorological factors for various air quality categories, we set the support threshold to 0.1 and the mined association rules should contain only the air-quality label as the rule consequent and the rule lift value is greater than one. Grouped by the air-quality label, the three most significant rules are tabulated in Table 2 in a decreasing order of confidence. It is seen that the most influential meteorological factors incurring PM2.5_H (high PM2.5 concentrations) are RH_M (medium relative humidity) and TP_L (low temperature), the rule confidence is 0.2485 and the lift is 2.17; both are significant. AP_H (high atmospheric pressure) also contributes to high PM2.5 concentrations when it comes with RH_M. The mined rules conform to the claims made by existing literature [8,15,16,17]. For the PM2.5_3 (with PM2.5 concentration between 24 and 35 μg/m3), the most influential factors in the top three rules are also RH_M, AP_H, and TP_L. The rules’ confidence is between 0.3499 and 0.3588. Although the rule confidence in group PM2.5_3 is higher than that in group PM2.5_H, the lift is inferior to its counterpart. This is because the PM2.5 measure appears more often in PM2.5_3 (with support 0.2448) than in PM2.5_H (with support 0.1174). Note that the factor WD_W appears in one of the top three rules; it has less influencing power than the other factors because WD_W is the dominant wind direction in all years (see Figure 4c). The common factor relating to cleaner air quality (groups PM2.5_2 and PM2.5_1) is low atmospheric pressure (AP_L), while the temperature factor is either high (TP_H) or medium (TP_M). The high wind speed (WS_H) is not a dominating factor because it appears only once in the rules. The air quality is less sensitive to relative humidity in Puli township. We found RH_M in the top three rules for PM2.5_H, PM2.5_3, and PM2.5_2, and RH_H appearing only in the top rules for PM2.5_1 (with concentration less than 12 μg/m3).
As previously noted, most of the precipitation (Prec) data are labeled as Prec_L due to the extreme distributions in the original data (see Figure 4f), so we did not include Prec in the itemsets for association rule mining to avoid inference bias. Instead, we calculate the confidence of observing various air-quality label Y given a particular Prec label X, namely, , in Table 3, and vice versa , in Table 4. For comprehensive explanations, we also tabulate the support for each label in the corresponding heading. It is seen in Table 3 that as the Prec level varies from low (L) to high (H), the probability of observing the cleanest air quality (PM2.5_1) increases from 27.4% to 54.66% and 56.74%. The probability of observing cleaner air quality (in PM2.5_1 or PM2.5_2) also increases from 68.72% to 86.98% and 89.88%. On the other hand, Table 4 shows that as the air quality varies from the highest PM2.5 concentration range (PM2.5_H) to the lowest (PM2.5_1), the probability of observing the highest precipitation range (Prec_H) increases from 5.8%, 9.75 to 11.66% and 17.97%, and the probability of observing Prec_L (almost no precipitation) drops from 81.14%, 79.12 to 74.12% and 60.12%, while the probability of observing Prec_M (with precipitation between 0.1 and 1.5 mm) is neutral. The influence of precipitation on air quality is remarkable, however, as 92.3% of the hourly precipitation is in Prec_L (almost no precipitation), which reduces the forecasting power of precipitation on air quality.
In summary, from the macro-supersite point of view, air quality is less sensitive to variations of RH, WD, and WS. The most influential meteorological factors incurring worse air quality (PM2.5_H and PM2.5_3) are low temperature (TP_L) and high atmospheric pressure (AP_H), while cleaner air quality (PM2.5_1 and PM2.5_2) is usually observed with high confidence in the weather conditions involving medium or high temperature (TP_M or TP_H) and low atmospheric pressure (AP_L). The high correlation between precipitation and air quality is obvious from our investigation. However, due to the mass distributions lying in the low range (Prec_L), the precipitation has little forecasting power for air quality.
3.1.2. Associations between Air Quality and Festivals
It is worth studying the associations between air quality and national festivals because many citizens will attend social events on these holidays. The social events range from cultural festivals, religion ceremonies, sightseeing, to outdoor BBQ and fireworks. It is likely that more PM2.5 concentrations are emitted from the social activities on these festivals than weekdays. We thus analyze the confidence of observing various PM2.5 categories over all 15 national festivals in each of the years during 2017–2019. The percentage of the national festivals among all days in these years is around 4%. It is seen in Table 5 that the probability of observing PM2.5_H and PM2.5_3 on festivals is 0.1328 and 0.3683 which is substantially higher than 0.1174 and 0.2448 over all days in the investigated years, and therefore the probability of observing cleaner air PM2.5_2 and PM2.5_1 on festivals is less than that on regular days. This manifests that the anthropogenic activities held on festivals do have an impact on intensifying the PM2.5 concentrations in the entire Puli township. The impact is more significant if we further investigate the major activity hours on the festivals. For example, on Lunar New Year Eve (around the period between 3 pm and 1 am midnight), many Taiwanese will burn joss paper and set off firecrackers according to tradition. The combustion activities inevitably emit carbon elements into the air and contribute to increases in air pollution. As seen from Table 5, the confidence of observing PM2.5_H during the major activity hours on Lunar New Year Eve is more than triple to that of all investigated years, and the opportunity for observing very clean air of PM2.5_1 is very rare with a probability of just 0.05. The investigation of New Year Eve activity hours shows a similar trend but with a more significant probability of 0.5 incurring high pollution of PM2.5_H than the probability of 0.375 observed during Lunar New Year activities. This may be due to people setting off high sky fireworks which scatter over a large region, while on Lunar New Year Eve, people burn joss paper and set off small firecrackers in front of their houses and these emissions significantly form local pollution.
In addition to the Lunar New Year, the Tomb Sweeping Day (TSD) is the second longest festival spanning three to five days off adjusting to the adjacent weekend. On TSD, most Taiwanese families go to their ancestors’ graves to sweep the tomb and burn joss paper. Some families even remove wild plants by combustion, which emits a serious amount of pollution. The TSD is on the fifteenth day after the middle day in the fourth solar term (Spring) on the lunar calendar, so its date is not fixed on the Gregorian calendar. The TSD was the last day in the four days off in 2017, the second day in the five days off in 2018, and the second day in the four days off in 2019. Our mining analysis shows that the TSD has varying confidences of observing pollution during 2017–2019. Firstly, Table 6 shows the increase in mean confidence of observing worse pollution on TSD in 2017–2019 as compared to the mean confidence in all days in the three years. It confirms that the TSD contributes to increasing the pollution due to the festival activities. Moreover, the TSD in 2017 has higher confidence with PM2.5_H and PM2.5_3 than in the other two years. This could be attributed to the TSD having been the last day in the four days offs in 2017 and most people have to rush back home for work or school after the tomb sweeping, which exacerbates the pollution. While in 2018 and 2019, the TSD was on the second day of the long festival, so people could sweep the tomb during the entire day without the need to rush back home. This distributive pattern of the combustion activity reduces the concentration of pollution and the confidence of observing worse air quality on TSD. The mining result offers information to the government agent which makes schedule planning of the national festivals.
3.2. Micro-Level Pollution Episodes at Microsites
3.2.1. Associations between Local Air Quality and Landmarks
It should be first noted that microsite PM2.5 sensors are easily influenced by nearby activities such as burning, cooking, car emissions, etc., so the sensors may often measure high PM2.5 concentrations if local air pollution arises. Such local air pollution is suspiciously related to particular landmarks ranging from temples, crossroads, paper mills, highway exits, night markets, to name a few. It is thus interesting to investigate the associations between various categories of air-pollution alert and different landmarks suspiciously producing such pollution. We calculate the frequency of itemsets for observing a PM2.5 category at a microsite and any interesting landmarks within 250 m to the microsite location. Table 7 shows the confidence of seeing each PM2.5 category with a proximity of interesting landmarks. For comparison with the background PM2.5 concentration, we also report the confidence observed at all microsites with or without neighboring landmarks. Firstly, we see that the confidence of observing more serious PM2.5 pollution over all microsites is higher than that of observing cleaner air. In particular, the confidence of observing PM2.5_H, PM2.5_3, PM2.5_2, and PM2.5_1 at all microsites is 0.3147, 0.2639, 0.2298, and 0.1916, respectively. This phenomenon contrasts to the situation observed at the supersite which reports the highest confidence for PM2.5_2 and the lowest for PM2.5_H as shown in Table 2. This is because the microsite sensors are prone to detect high PM2.5 measures if a nearby pollution activity is taking place. However, the supersite is installed at a large open place, and it is less sensitive to local pollution emissions but is tailored to detect global air quality of a greater area.
Secondly, for the association between local air quality and landmarks, it is seen that the night market has the highest influence on local air quality among all investigated landmarks in this study. In Puli township, night markets are open at around 6 pm until midnight and the outdoor cooking activities and vehicle emissions deteriorate the air quality. The confidence of observing PM2.5_H and PM2.5_3 at night markets is 0.3866 and 0.3217, which are significantly higher than the background air quality observed at all microsites. On the other hand, the confidence of observing the cleanest air PM2.5_1 at night markets is just 0.0721 which is very low as compared to 0.1916 observed overall. The next landmark we investigated is crossroads where the vehicles may stop at the stop line due to light traffic control. Depending on the volume of traffic, there may be many vehicles producing emissions while waiting at the stop line. The confidence of observing various air quality categories reflects this phenomena. The confidence of observing PM2.5_H is raised up to 0.3615 and the confidence of sensing PM2.5_2 and PM2.5_1 are both dropped by about two percent. Puli is one of the major towns for nourishing a paper industry in Taiwan. However, the paper mills release PM2.5 during production operations. The result in Table 7 shows that the impact magnitude on variations of air quality from paper mills is comparable to that from crossroads. Temples and highway exits have less significant impact on air quality than the previously noted landmarks. This could be due to some phenomena as follows. Since 2016, there have been several citizen rallies held in Puli in the hope of promoting air-quality improvement by volume reduction in joss paper and incense stick burning at temples, which increase the public awareness for taking appropriate actions against air pollution. For highway exits in Puli, great traffic volume is usually seen only during commuting time or long weekends, so the impact of highway exits is not as significant as that of daily activities from night markets, crossroads, and paper mills. Finally, it is worth investigating whether children studying at elementary schools inhale fresh air. As shown in Table 7, the confidence of observing various air-quality categories at elementary schools is nearly the same as that for the background emissions. The result is attributed to the fact that the elementary schools are located throughout the residential area for the convenience of walking between schools and homes. It might be suggested to the local government to reallocate the elementary schools to a planned land district so the students can study in places with cleaner air quality.
3.2.2. Associations between Local Air Quality and Land Uses
The planning of land use indirectly influences the air quality at different places. For example, more restaurants gather in business district and residential areas than in agricultural and high lands and the cooking combustions may intensify the carbon emissions. We investigated the impact on air quality from four major categories of land uses in Puli (see Figure 5c), namely, the business district, residential area, agricultural field, and high lands with altitude more than 600 m. We investigated high land because Puli is a basin; there are no other natural factors such as lake and coast. For each land-use purpose, we identified all microsites allocated in the specified area and calculated their mean confidence of observing various air-quality categories. Table 8 shows that the business district has the greatest impact on increases in air pollution. The confidence values of observing PM2.5_H and PM2.5_3 are 0.4467 and 0.3008, which are both remarkably higher as compared to the background emissions. The result is clearly anticipated because there are many pollution-emitting sources in the business district such as traffic, factories, and restaurants. The residential area has a mild impact on air quality by increasing the confidence of PM2.5_H to 0.3346 which is a bit higher than the background emissions. The high land has lower confidence of observing PM2.5_H than the background emissions. High land mostly consists of forests and it is less populated and is not suitable for mass gatherings. There are less traffic and anthropogenic activities in high land due to the high altitude and slope of the mountains, so its air quality is usually cleaner than that observed in lower land which is densely populated and incurring more anthropogenic activities. Finally, the agricultural land enjoys the best air quality among all studied land uses. The confidence of observing PM2.5_H in agricultural land is just 0.2488 which is significantly less than 0.3147 in the background emissions, and the confidence of sensing PM2.5_2 and PM2.5_1 are 0.2731 and 0.2366 which are both greatly higher than those observed in the background. The result indicates that there are few farming activities spoiling the air quality and the location of agricultural land is distant from potential emission sources.
4. Conclusions
In this paper, we have proposed a data-mining approach for finding the associations between air quality and natural and anthropogenic factors in Puli township, Taiwan. To characterize the impacts of the factors on different scales of spatial sizes, we experimented with the air-quality datasets collected from both macro-scale supersites and micro-scale microsites. The global factors included are the meteorological variables, such as temperature, relative humidity, wind speed and direction, atmospheric pressure, precipitation, and dates of national festivals. The local factors are human-constructed landmarks, land uses, and altitudes. The raw data from diverse sources are preprocessed to fit into the appropriate format required by association rule mining. The categorization of numerical data is facilitated by either government-announced labels or equal-proportional divisions of the raw data distribution. Our analysis result shows interesting findings that are unique as compared to existing literature. The air quality at Puli is less sensitive to variations of relative humidity, wind speed and direction, which show unique patterns due to basin geography. The result is in contrast to most literature where the three meteorological variables have been found to significantly influence the PM2.5 concentration. Also, due to the extremely biased precipitation distributions of basin geography, the rule implying low precipitation in the days with worse air quality cannot be applied since the lift measure is very low. For the influence of festivals, we found that the probability of observing PM2.5 concentrations greater than 35 μg/m3 in major activity hours on New Year Eve is 50% which is significantly greater than 11.74%, the probability of observing the same concentrations over all days in the investigated years, while the Tomb Sweeping Day (TSD) has a varying impact on air quality depending on the order of the TSD date within the long holiday. The increase of PM2.5 concentration is remarkably more significant if the TSD is the last day in the long holiday than it if is the middle day. This finding can be taken into consideration when the government agent makes schedules for national festivals. Finally, it was learned in our study that different landmarks and land uses have various significant impacts on micro-level air quality. The microsites monitor high PM2.5 concentrations at the proximity of 250 m of particular landmarks with a greater confidence than the mean confidence over all microsites. These landmarks with the confidence ranked from highest to lowest are night markets, crossroads, paper mills, temples, and highway exits. It is worth noting that the PM2.5 increase contributed by temples is negligible, which may be attributed to the citizen action for promoting reduction in joss paper and incense stick burning. The land uses have diverse impacts on local air quality. Anthropogenic activities contribute higher PM2.5 concentrations in business districts and residential areas. The PM2.5 concentration monitored at high lands and agricultural lands is lower than the overall background due to fewer mass gatherings and combustion activities in these land uses.
The analysis obtained from this paper has several implications. Firstly, the influential factors resulting in worse air quality are location-dependent. Significant differences of impact of some factors are found by this study and the literature. Secondly, the influential factors should be identified through both macro- and micro-spatial scales points of view. Large-scale supersites and finer-scale microsites are fruitful for this purpose of analysis as conducted in this paper. Thirdly, the released confident associations between worse air quality and influential factors offer suggestions to government agencies for policy making of air-quality control, festival date scheduling, and urban planning of land uses.
Funding
This research was funded by National Science and Technology Council of ROC, grant number NSTC 110-2410-H-130-055-MY2.
Institutional Review Board Statement
Not applicable.
Informed Consent Statement
Not applicable.
Data Availability Statement
The raw data supporting the conclusions of this article will be made available by the authors on request.
Acknowledgments
The authors are grateful to Rong-Fuh Day for providing the dataset and Pei-Ru Wang for her code development of the proposed algorithms.
Conflicts of Interest
The author declares no conflict of interest.
References
- United Nations. Consensus Reached on New Sustainable Development Agenda to Be Adopted by World Leaders in September, 2015. Available online: https://www.un.org/sustainabledevelopment/blog/2015/08/ (accessed on 17 April 2024).
- IPCC. Climate Change 2007: The Scientific Basis, Contribution of Working Group I to the Third Assessment Report of the Intergovernmental Panel on Climate Change; Houghton, J.T., Ding, Y., Griggs, D.J., Noguer, M., Vander Linden, P.J., Dai, X., Maskell, K., Johnson, C.A., Eds.; Cambridge University: New York, NY, USA, 2007. [Google Scholar]
- Liu, Y.-J.; Zhang, T.-T.; Liu, Q.-Y.; Zhang, R.-J.; Sun, Z.-Q.; Zhang, M.-G. Seasonal Variation of Physical and Chemical Properties in TSP, PM10 and PM2.5 at a Roadside Site in Beijing and Their Influence on Atmospheric Visibility. Aerosol Air Qual. Res. 2014, 14, 954–969. [Google Scholar] [CrossRef]
- Mo, L.; Ma, Z.; Xu, Y.; Sun, F.; Lun, X.; Liu, X.; Chen, J.; Yu, X. Assessing the Capacity of Plant Species to Accumulate Particulate Matter in Beijing, China. PLoS ONE 2015, 10, e0140664. [Google Scholar] [CrossRef]
- Song, C.; He, J.; Wu, L.; Jin, T.; Chen, X.; Li, R.; Ren, P.; Zhang, L.; Mao, H. Health burden attributable to ambient PM2.5 in China. Environ. Pollut. 2017, 223, 575–586. [Google Scholar] [CrossRef] [PubMed]
- Kumar, M.; Singh, R.; Banerjee, T. Associating airborne particulates and human health: Exploring possibilities. Environ. Int. 2015, 84, 201–202. [Google Scholar] [CrossRef] [PubMed]
- Banerjee, T.; Singh, N. Book review: Air pollution and health effects. Curr. Sci. 2016, 110, 1108. [Google Scholar]
- Chen, Y.-C.; Chiang, H.-C.; Hsu, C.-Y.; Yang, T.-T.; Lin, T.-Y.; Chen, M.-J.; Chen, N.-T.; Wu, Y.-S. Ambient PM2.5-bound polycyclic aromatic hydrocarbons (PAHs) in Changhua County, central Taiwan: Seasonal variation, source apportionment and cancer risk assessment. Environ. Pollut. 2016, 218, 372–382. [Google Scholar] [CrossRef] [PubMed]
- Han, X.; Liu, Y.; Gao, H.; Ma, J.; Mao, X.; Wang, Y.; Ma, X. Forecasting PM2.5 induced mail lung cancer morbidity in China using satellite retrieved PM2.5 and spatial analysis. Sci. Total Environ. 2017, 607–608, 1009–1017. [Google Scholar] [CrossRef] [PubMed]
- WHO, Ambient (Outdoor) Air Pollution. 2022. Available online: https://www.who.int/en/news-room/fact-sheets/detail/ambient-(outdoor)-air-quality-and-health (accessed on 30 October 2017).
- Hsu, C.-H.; Cheng, F.-Y. Classification of weather patterns to study the influence of meteorological characteristics on PM2.5 concentrations in Yunlin County, Taiwan. Atmos. Environ. 2016, 144, 397–408. [Google Scholar] [CrossRef]
- Wang, J.; Han, J.; Li, T.; Wu, T.; Fang, C. Impact analysis of meteorological variables on PM2.5 pollution in the most polluted cities in China. Heliyon 2023, 9, e17609. [Google Scholar] [CrossRef]
- Dhyani, R.; Sharma, N.; Maity, A.K. Prediction of PM2.5 along urban highway corridor under mixed traffic conditions using CALINE4 model. J. Environ. Manag. 2017, 198, 24–32. [Google Scholar] [CrossRef]
- Lee, W.C.; Shen, L.; Catalano, P.J.; Mickley, L.J.; Koutrakis, P. Effect of future temperature change on PM2.5 infiltration in the greater Boston area. Atmos. Environ. 2017, 150, 98–105. [Google Scholar] [CrossRef]
- Yin, Q.; Wang, J.; Hu, M.; Wong, H. Estimation of daily PM2.5 concentration and its relationship with meteorological conditions in Beijing. J. Environ. Sci. 2016, 48, 161–168. [Google Scholar] [CrossRef] [PubMed]
- Ausati, S.; Amanollahi, J. Assessing the accuracy of ANFIS, EEMD-GRNN, PCR, and MLR models in predicting PM2.5. Atmospheric Environ. 2016, 142, 465–474. [Google Scholar] [CrossRef]
- Niska, H.; Hiltunen, T.; Karppinen, A.; Kolehmainen, M. Evolutionary design and evaluation of modeling system for forecasting urban airborne maximum pollutant concentrations. In Adaptive and Natural Computing Algorithms; Ribeiro, B., Albrecht, R.F., Dobnikar, A., Pearson, D.W., Steele, N.C., Eds.; Springer: Berlin/Heidelberg, Germany, 2005; pp. 181–188. [Google Scholar]
- Tsai, Y.I.; Sopajaree, K.; Kuo, S.-C.; Yu, S.-P. Potential PM2.5 impacts of festival-related burning and other inputs on air quality in an urban area of southern Taiwan. Sci. Total. Environ. 2015, 527-528, 65–79. [Google Scholar] [CrossRef] [PubMed]
- Chen, L.-J.; Ho, Y.-H.; Lee, H.-C.; Wu, H.-C.; Liu, H.-M.; Hsieh, H.-H.; Huang, Y.-T.; Lung, S.-C.C. An Open Framework for Participatory PM2.5 Monitoring in Smart Cities. IEEE Access 2017, 5, 14441–14454. [Google Scholar] [CrossRef]
- Yousefi, R.; Shaheen, A.; Wang, F.; Ge, Q.; Wu, R.; Lelieveld, J.; Wang, J.; Su, X. Fine particulate matter (PM2.5) trends from land surface changes and air pollution policies in China during 1980–2020. J. Environ. Manag. Part B 2023, 326, 116847. [Google Scholar]
- Zhao, L.; Zhang, M.; Cheng, S.; Fang, Y.; Wang, S.; Zhou, C. Investigate the effects of urban land use on PM2.5 concentration: An application of deep learning simulation. J. Affect. Disord. 2023, 242, 110521. [Google Scholar] [CrossRef]
- Di, Q.; Koutrakis, P.; Schwartz, J. A hybrid prediction model for PM2.5 mass and components using a chemical transport model and land use regression. Atmospheric Environ. 2016, 131, 390–399. [Google Scholar] [CrossRef]
- Habermann, M.; Billger, M.; Haeger-Eugensson, M. Land use Regression as Method to Model Air Pollution. Previous Results for Gothenburg/Sweden. Procedia Eng. 2015, 115, 21–28. [Google Scholar] [CrossRef]
- Liu, X.J.; Xia, S.Y.; Yang, Y.; Wu, J.F.; Zhou, Y.N.; Ren, Y.W. Spatiotemporal dynamics and impacts of socioeconomic and natural conditions on PM2.5 in the Yangtze River Economic Belt. Environ. Pollut. 2020, 263, 114569. [Google Scholar] [CrossRef]
- Yang, D.; Chen, Y.; Miao, C.; Liu, D. Spatiotemporal variation of PM2.5 concentrations and its relationship to urbanization in the Yangtze river delta region, China. Atmos. Pollut. Res. 2020, 11, 491–498. [Google Scholar] [CrossRef]
- Liang, C.-S.; Duan, F.-K.; He, K.-B.; Ma, Y.-L. Review on recent progress in observations, source identifications and countermeasures of PM2.5. Environ. Int. 2016, 86, 150–170. [Google Scholar] [CrossRef] [PubMed]
- Singh, N.; Murari, V.; Kumar, M.; Barman, S.; Banerjee, T. Fine particulates over South Asia: Review and meta-analysis of PM2.5 source apportionment through receptor model. Environ. Pollut. 2017, 223, 121–136. [Google Scholar] [CrossRef] [PubMed]
- Yin, P.-Y.; Tsai, C.-C.; Day, R.-F.; Tung, C.-Y.; Bhanu, B. Ensemble learning of model hyperparameters and spatiotemporal data for calibration of low-cost PM2.5 sensors. Math. Biosci. Eng. 2019, 16, 6858–6873. [Google Scholar] [CrossRef] [PubMed]
- Day, R.F.; Yin, P.Y.; Huang, Y.C.T.; Wang, C.Y.; Tsai, C.C.; Yu, C.H. Concentration-temporal multilevel calibration of PM2.5 low-cost sensor. Sustainability 2022, 14, 10015. [Google Scholar] [CrossRef]
- Hu, K.; Rahman, A.; Bhrugubanda, H.; Sivaraman, V. HazeEst: Machine Learning Based Metropolitan Air Pollution Estimation From Fixed and Mobile Sensors. IEEE Sensors J. 2017, 17, 3517–3525. [Google Scholar] [CrossRef]
- Miksys, M. Predictions of PM2.5 and PM10 Concentrations Using Static and Mobile Sensors; Technical Report; School of Informatics, University of Edinburgh: Edinburgh, UK, 2016. [Google Scholar]
- Keyes, T.; Domingo, R.; Dynowski, S.; Graves, R.; Klein, M.; Leonard, M.; Pilgrim, J.; Sanchirico, A.; Trinkaus, K. Low-cost PM2.5 sensors can help identify driving factors of poor air quality and benefit communities. Heliyon 2023, 9, e19876. [Google Scholar] [CrossRef] [PubMed]
- Han, J.; Kamber, M. Data Mining: Concepts and Techniques; Morgan Kaufmann Publishers: San Francisco, CA, USA, 2001. [Google Scholar]
- Diaz-Garcia, J.A.; Ruiz, M.D.; Martin-Bautista, M.J. A survey on the use of association rules mining techniques in textual social media. Artif. Intell. Rev. 2023, 56, 1175–1200. [Google Scholar] [CrossRef] [PubMed]
- Agrawal, R.; Imieliński, T.; Swami, A. Mining association rules between sets of items in large databases. In Proceedings of the ACM-SIGMOD, International Conference on Management of Data, Washington, DC, USA, 26–28 May 1993; pp. 207–216. [Google Scholar]
- Agrawal, R.; Srikant, R. Fast algorithm for mining association rules. Proceedings of Conference on Very Large Data Bases, Santiago, Chile, 12–15 September 1994; pp. 487–499. [Google Scholar]
- Savasere, A.; Omiecinski, E.; Navathe, S. An efficient algorithm for mining association rules in large databases. In Proceedings of the 21st International Conference on Very Large Data-Bases, Zurich, Switzerland, 11–15 September 1995; pp. 432–444. [Google Scholar]
- Pei, J.; Han, J. Can we push more constraints into frequent pattern mining? Proceedings of sixth ACM SIGKDD International Conference on Knowledge Discovery and Data Mining, Boston, MA, USA, 20–23 August 2000; pp. 350–354. [Google Scholar]
- Qin, S.; Liu, F.; Wang, C.; Song, Y.; Qu, J. Spatial-temporal analysis and projection of extreme particulate matter (PM10 and PM2.5) levels using association rules: A case study of the Jing-Jin-Ji region, China. Atmos. Environ. 2015, 120, 339–350. [Google Scholar] [CrossRef]
- Sadat, Y.K.; Karimipour, F.; Sadat, A.K. Investigating the relation between prevalence of asthmatic allergy with the characteristics of the environment using association rule mining. In Proceedings of the 1st ISPRS International Conference on Geospatial Information Research, Tehran, Iran, 15–17 November 2014; pp. 169–174. [Google Scholar]
- Yin, P.-Y. Spatiotemporal retrieval and feature analysis of air pollution episodes. Math. Biosci. Eng. 2023, 20, 16824–16845. [Google Scholar] [CrossRef]
- Nantou County Environmental Protection Bureau (NCEPB), 10 Air-Quality Alert Levels. Available online: https://www.ntepb.gov.tw/eng/news/Details.aspx?Parser=9,15,95,,,,15197,,,,1 (accessed on 15 March 2024).
Figure 1.
Taiwan air quality monitoring supersites and microsites. (a) Eighty-six government-built PM2.5 supersites, https://airtw.moenv.gov.tw/ENG/default.aspx (accessed on 20 April 2024). (b) A total of 9600+ participatory PM2.5 microsites, https://wot.moenv.gov.tw/ (accessed on 20 April 2024).
Figure 1.
Taiwan air quality monitoring supersites and microsites. (a) Eighty-six government-built PM2.5 supersites, https://airtw.moenv.gov.tw/ENG/default.aspx (accessed on 20 April 2024). (b) A total of 9600+ participatory PM2.5 microsites, https://wot.moenv.gov.tw/ (accessed on 20 April 2024).
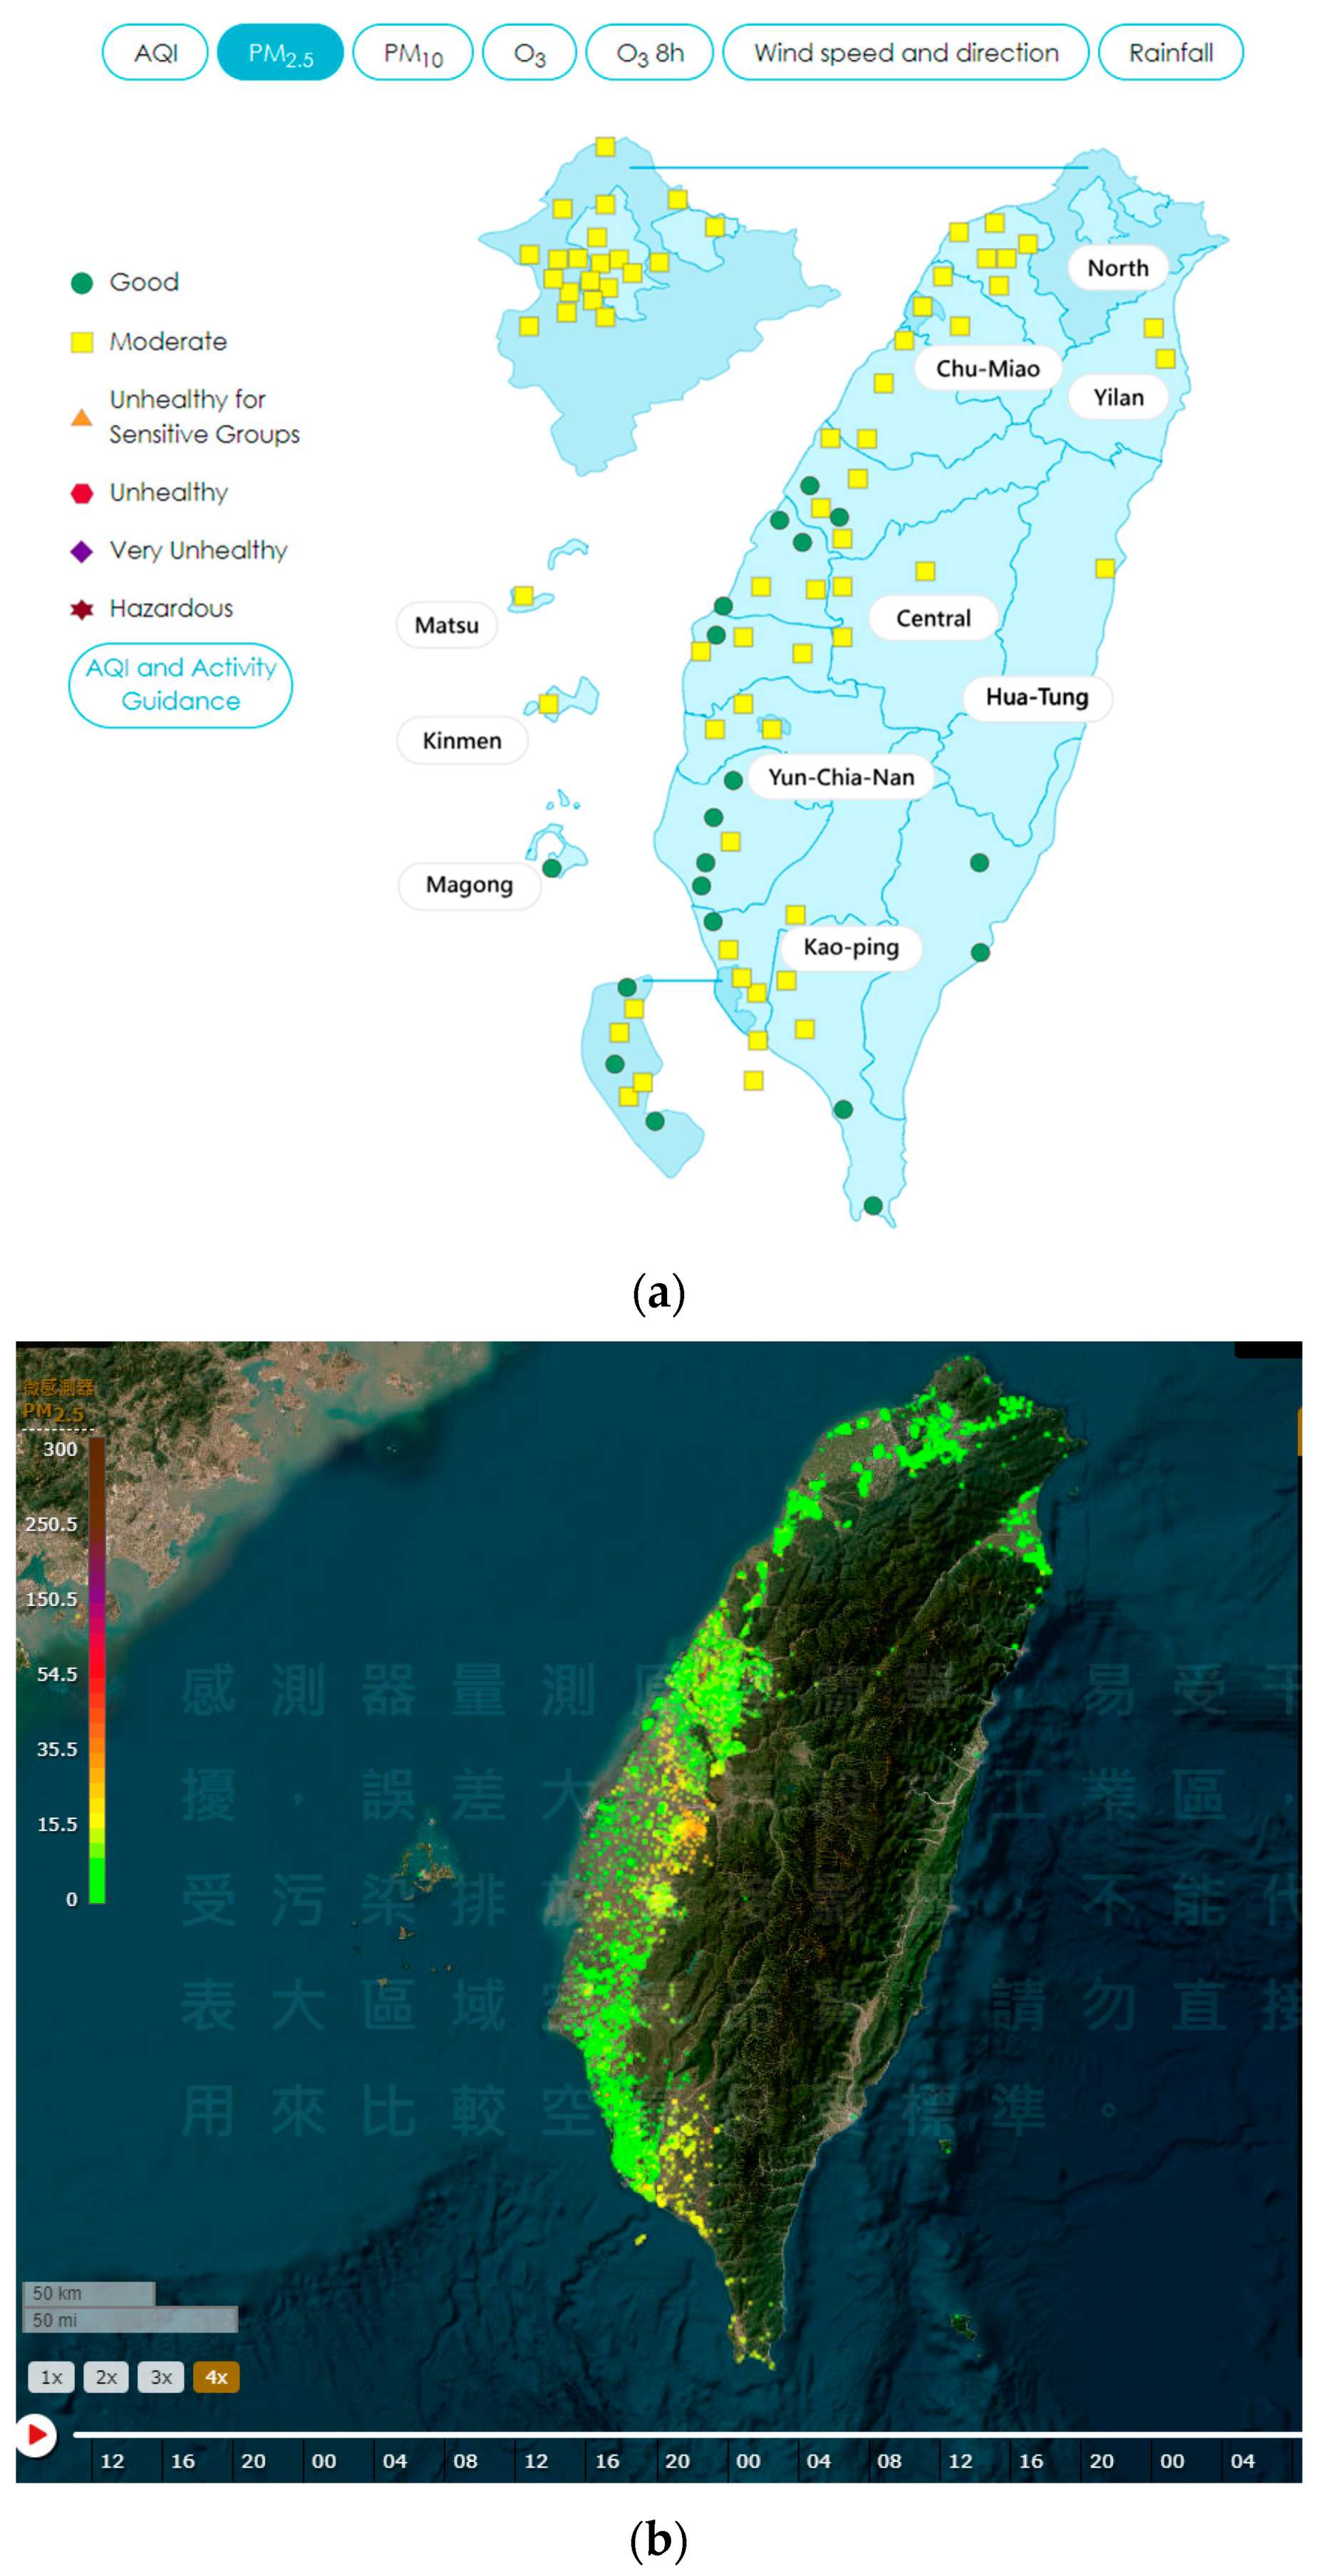
Figure 2.
Studied field in this paper. (a) Puli basin geography and the PM2.5 supersite marked by red star. (b) Grid divisions of Puli and the PM2.5 microsites marked by blue bullets.
Figure 2.
Studied field in this paper. (a) Puli basin geography and the PM2.5 supersite marked by red star. (b) Grid divisions of Puli and the PM2.5 microsites marked by blue bullets.
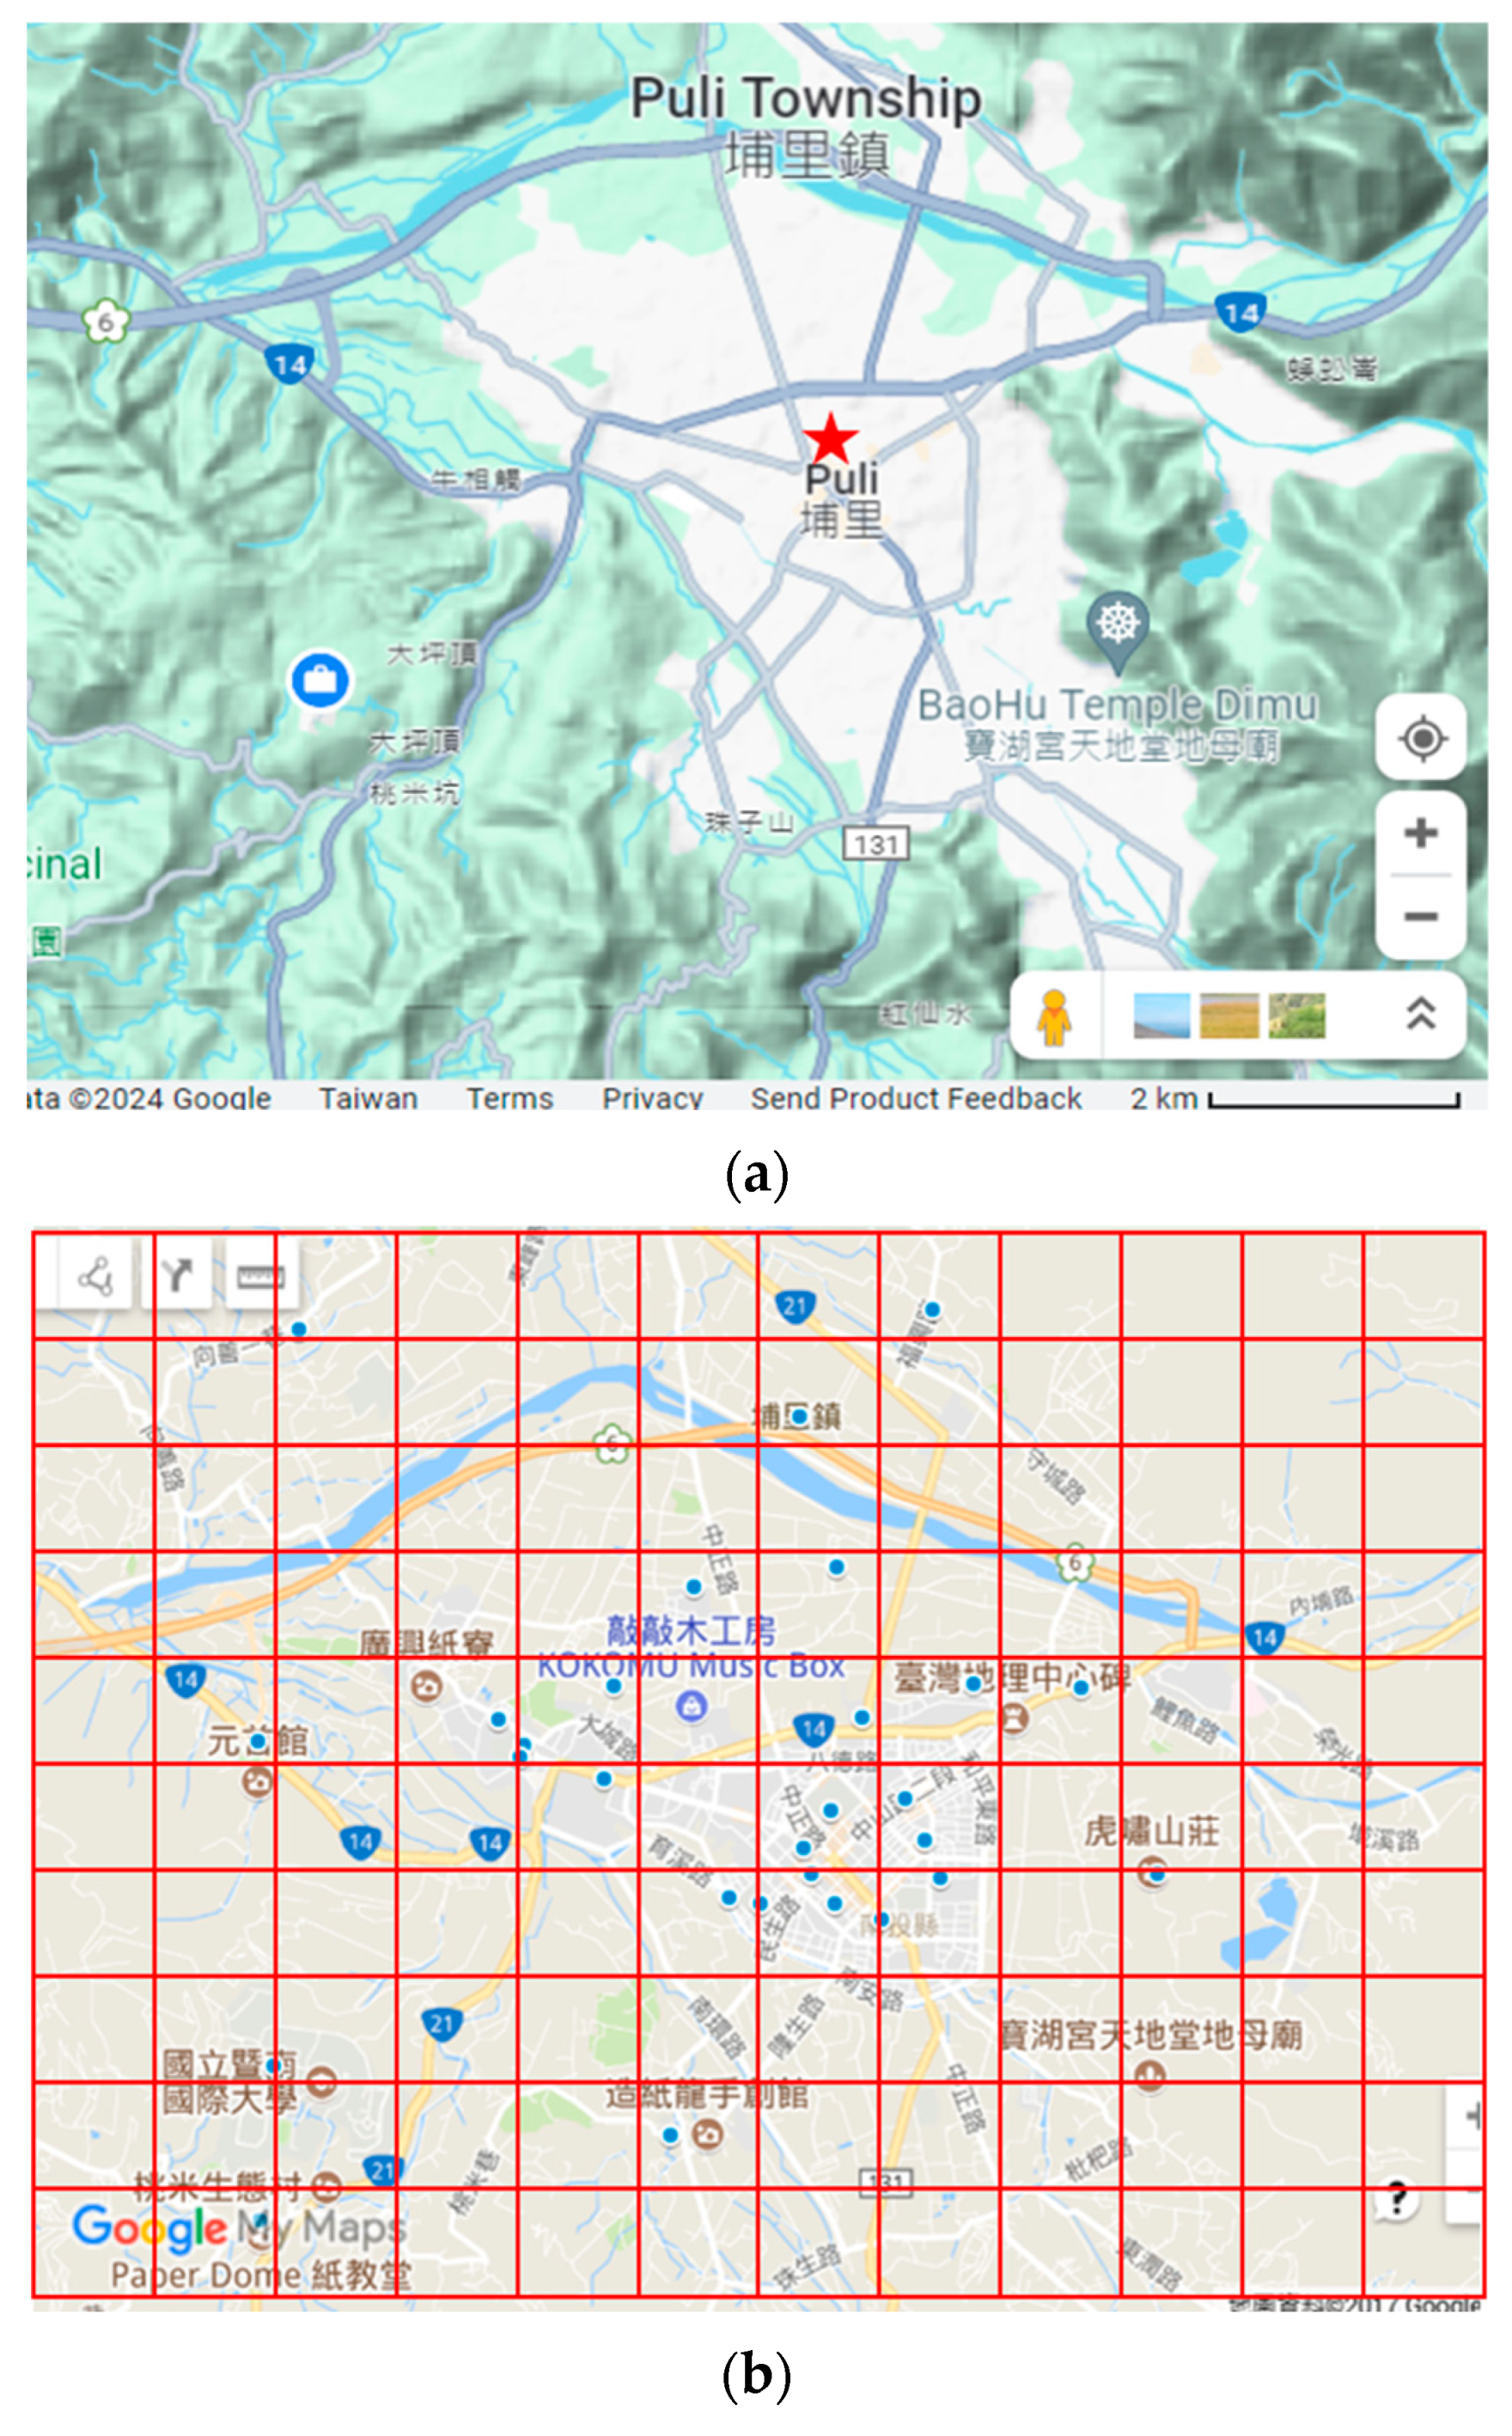
Figure 3.
Histogram of the hourly PM2.5 concentration distributions. (a) Single Puli supersite. (b) Over all 29 microsites.
Figure 3.
Histogram of the hourly PM2.5 concentration distributions. (a) Single Puli supersite. (b) Over all 29 microsites.
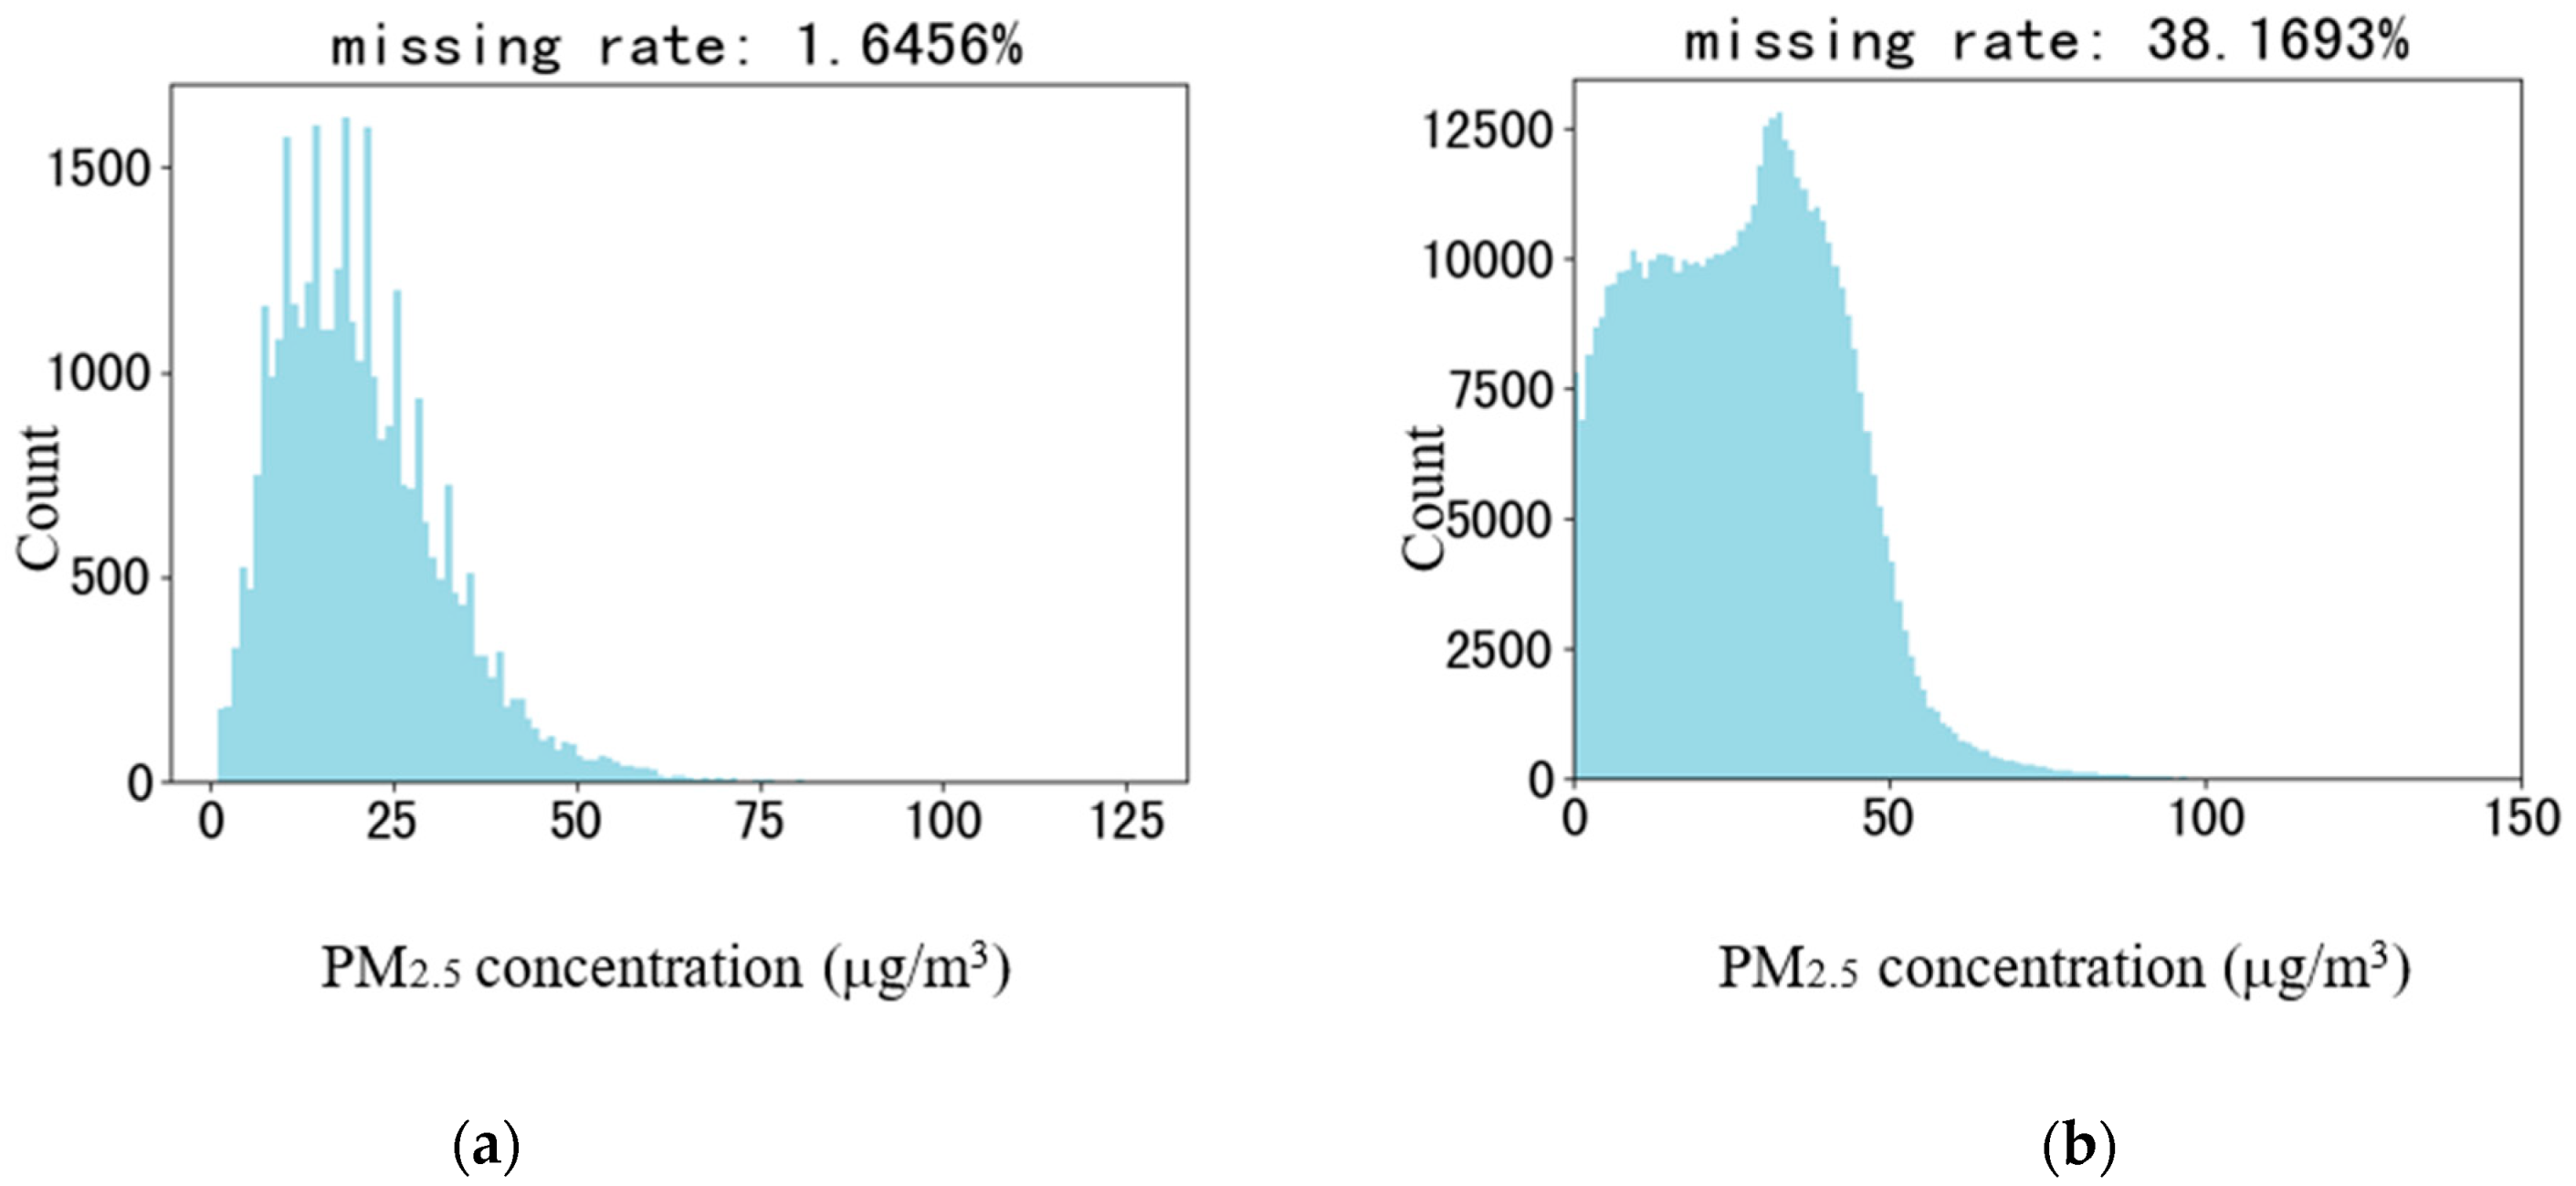
Figure 4.
Distributions of weather indicators: (a) temperature, (b) relative humidity, (c) wind direction, (d) wind speed, (e) atmospheric pressure, (f) precipitation.
Figure 4.
Distributions of weather indicators: (a) temperature, (b) relative humidity, (c) wind direction, (d) wind speed, (e) atmospheric pressure, (f) precipitation.

Figure 5.
Landmarks, land uses, and altitudes: (a) temples and highway exits, (b) paper mills and night markets, (c) land uses, (d) land altitudes.
Figure 5.
Landmarks, land uses, and altitudes: (a) temples and highway exits, (b) paper mills and night markets, (c) land uses, (d) land altitudes.
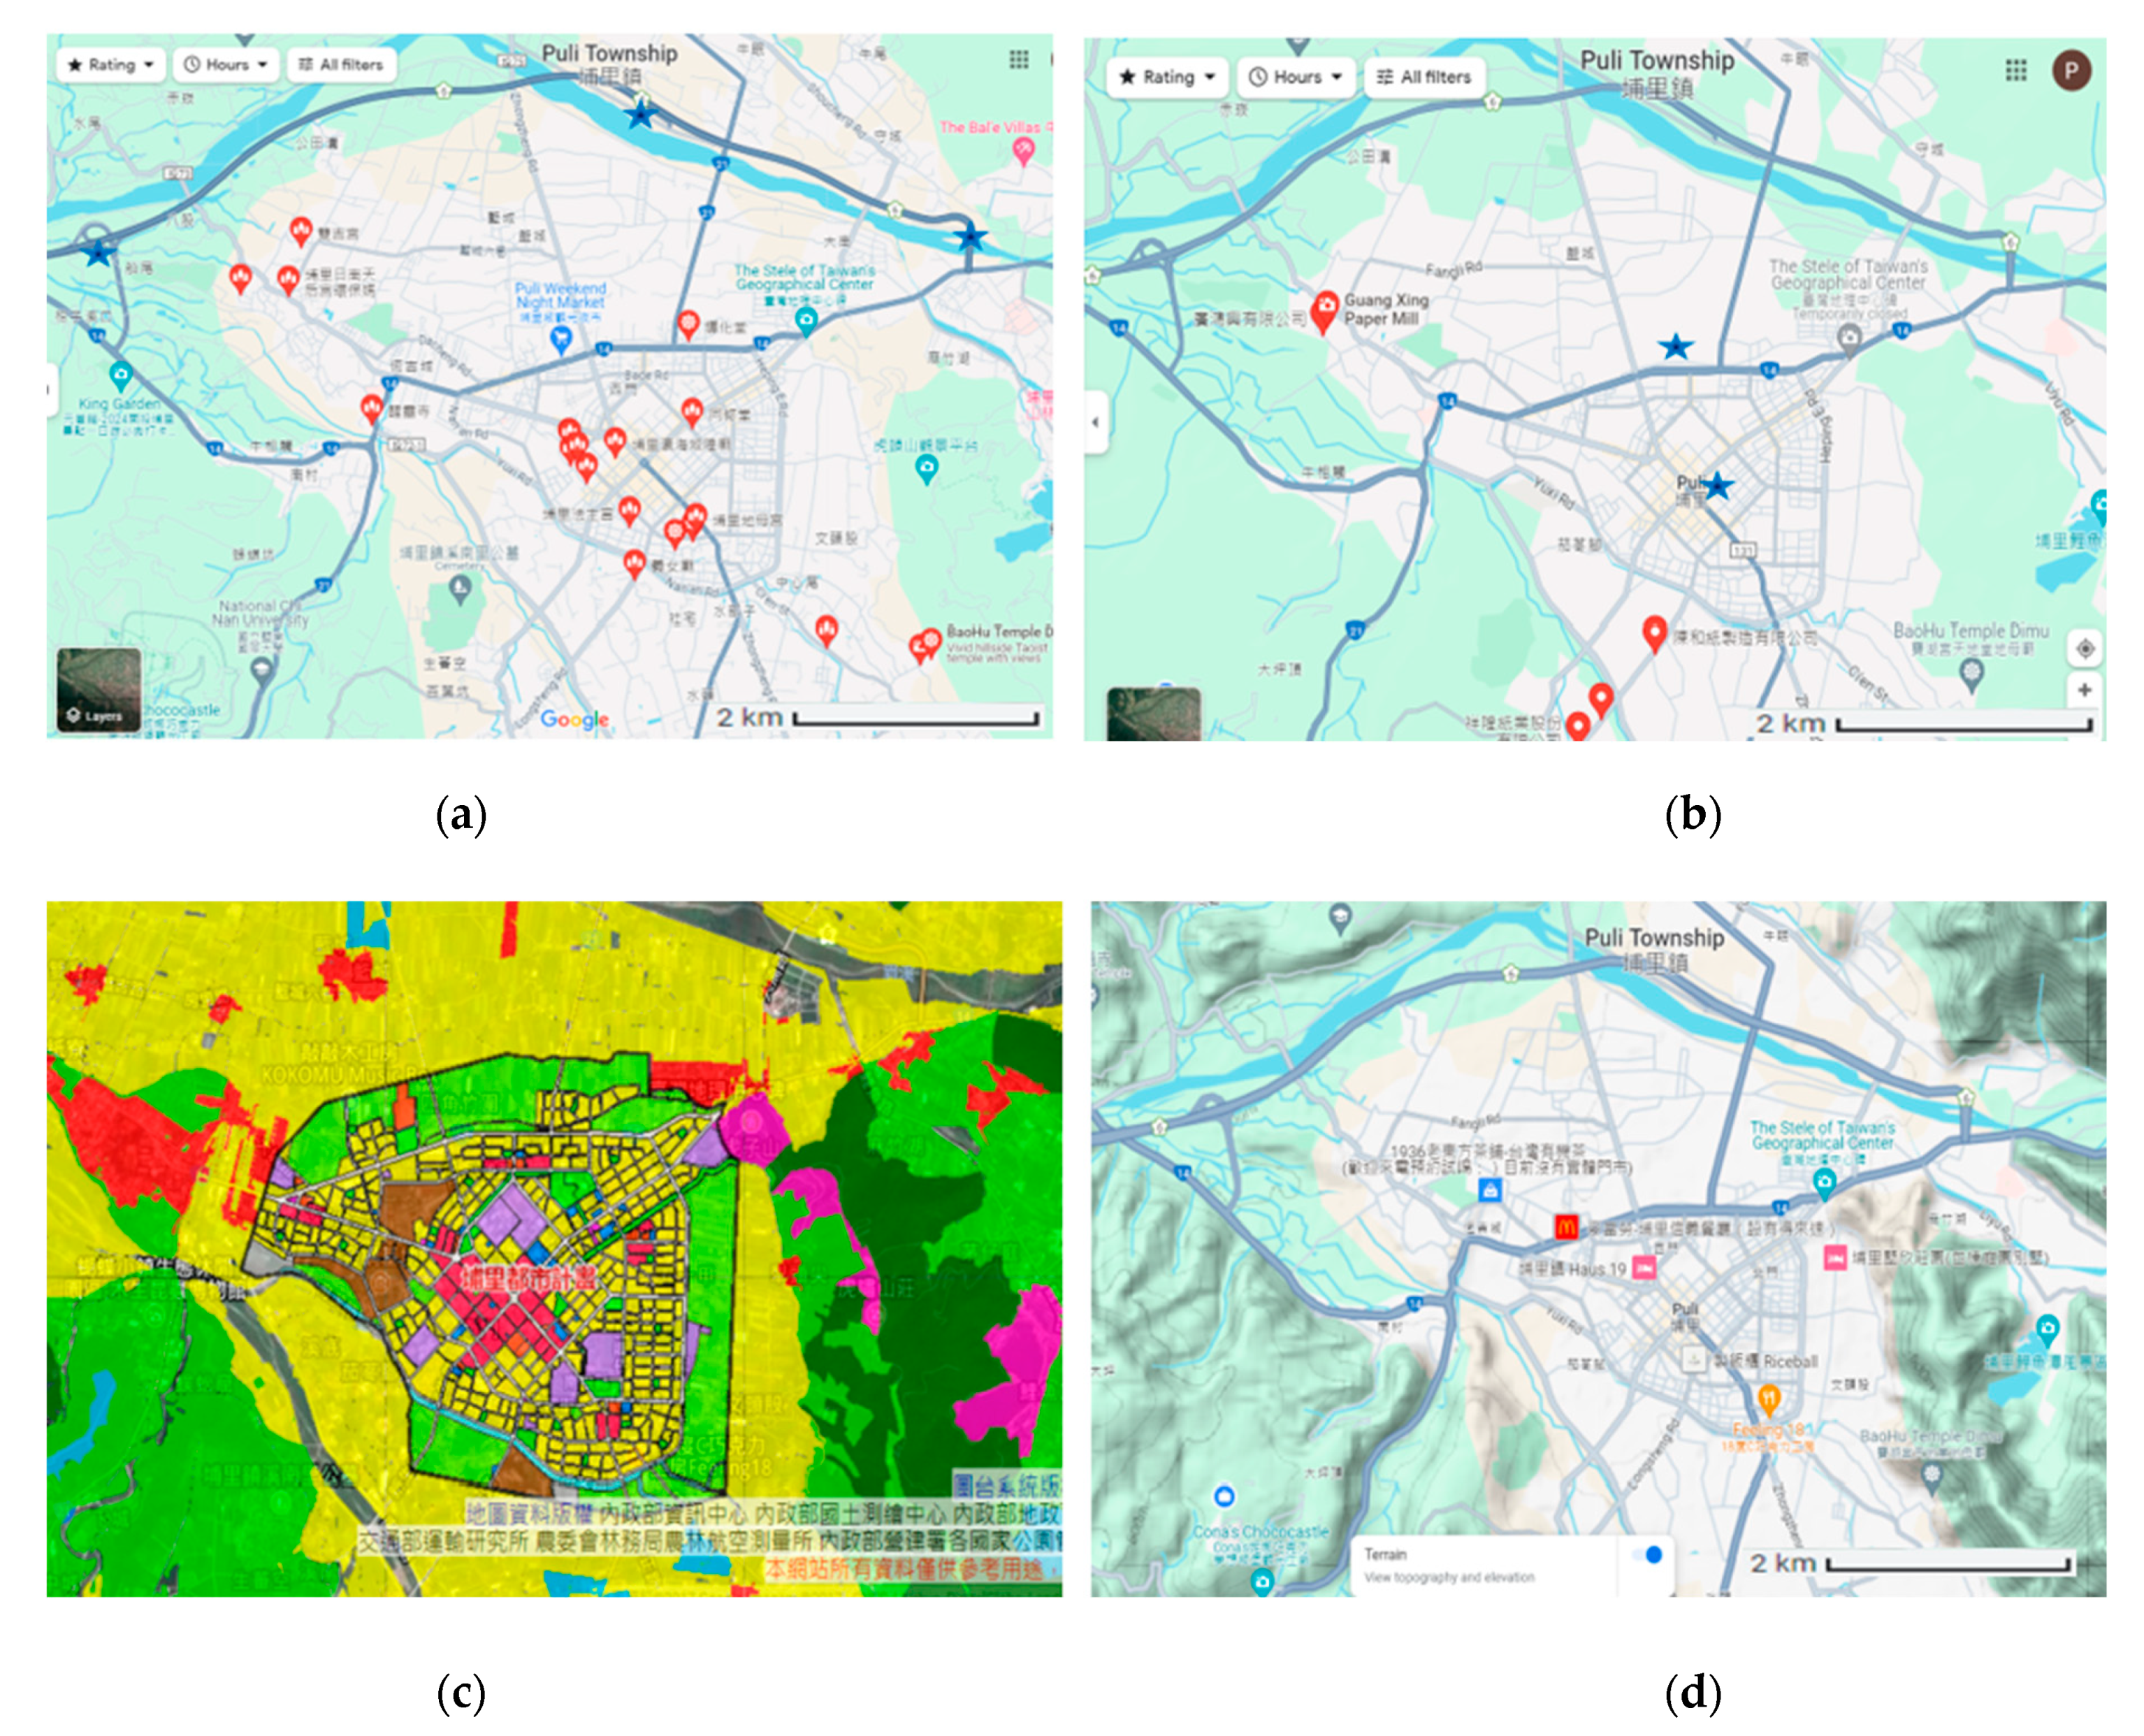
Figure 6.
The correspondence between the 10-level air-quality alert levels (NCEPB, 2024) and the four air-quality labels used in this work.
Figure 6.
The correspondence between the 10-level air-quality alert levels (NCEPB, 2024) and the four air-quality labels used in this work.

Table 1.
Categorization threshold values for each meteorological indicator.
| TP (Celsius) | RH (%) | WS (m/s) | AP (hPA) | Prec (mm) | |
|---|---|---|---|---|---|
| H | >24.7 | >93 | >0.9 | >964.9 | >1.5 |
| M | 20.8~24.7 | 76~93 | 0.4~0.9 | 960.5~964.9 | 0.1~1.5 |
| L | ≤20.8 | ≤76 | ≤0.4 | ≤960.5 | ≤0.1 |
Table 2.
Association rules between meteorological indicators and various air-quality labels.
| Ant. | Con. | Sup(Ant.) | Sup(Con.) | Con.) | Confidence | Lift |
|---|---|---|---|---|---|---|
| RH_M, TP_L | PM2.5_H | 0.1536 | 0.1174 | 0.0382 | 0.2485 | 2.17 |
| RH_M, TP_L, AP_H | PM2.5_H | 0.1154 | 0.1174 | 0.0278 | 0.2412 | 2.05 |
| RH_M, AP_H | PM2.5_H | 0.1387 | 0.1174 | 0.0332 | 0.2394 | 2.04 |
| RH_M, AP_H | PM2.5_3 | 0.1387 | 0.2448 | 0.0498 | 0.3588 | 1.47 |
| WD_W, TP_L, AP_H | PM2.5_3 | 0.1154 | 0.2448 | 0.0411 | 0.3563 | 1.46 |
| RH_M, TP_L | PM2.5_3 | 0.1536 | 0.2448 | 0.0537 | 0.3499 | 1.43 |
| AP_L, TP_H | PM2.5_2 | 0.1835 | 0.4063 | 0.0904 | 0.4927 | 1.21 |
| AP_L, TP_H, WS_H | PM2.5_2 | 0.1074 | 0.4063 | 0.0526 | 0.4899 | 1.21 |
| AP_L, TP_H, RH_M | PM2.5_2 | 0.1105 | 0.4063 | 0.0541 | 0.4898 | 1.21 |
| TP_M, AP_L | PM2.5_1 | 0.1368 | 0.2172 | 0.0701 | 0.5167 | 2.38 |
| RH_H, TP_M | PM2.5_1 | 0.1448 | 0.2172 | 0.0726 | 0.5017 | 2.31 |
| RH_H, AP_L | PM2.5_1 | 0.1182 | 0.2172 | 0.0591 | 0.5002 | 2.30 |
Table 3.
Confidence of observing various air-quality labels given a particular Prec label.
| Prec_L (0.923) | Prec_M (0.043) | Prec_H (0.034) | |
|---|---|---|---|
| PM2.5_H (0.1174) | 0.0873 | 0.0457 | 0.0241 |
| PM2.5_3 (0.2448) | 0.2255 | 0.0844 | 0.0771 |
| PM2.5_2 (0.4063) | 0.4132 | 0.3232 | 0.3314 |
| PM2.5_1 (0.2172) | 0.2740 | 0.5466 | 0.5674 |
Table 4.
Confidence of observing various Prec labels given a particular air-quality label.
| Prec_L (0.923) | Prec_M (0.043) | Prec_H (0.034) | |
|---|---|---|---|
| PM2.5_H (0.1174) | 0.8114 | 0.1306 | 0.0580 |
| PM2.5_3 (0.2448) | 0.7912 | 0.1113 | 0.0975 |
| PM2.5_2 (0.4063) | 0.7412 | 0.1423 | 0.1166 |
| PM2.5_1 (0.2172) | 0.6012 | 0.2191 | 0.1797 |
Table 5.
Confidence of observing various PM2.5 categories within each specified time span.
| PM2.5 Categories | 2017~2019 | All Festivals in 2017~2019 | Lunar New Year Eve (15:00~01:00) | New Year Eve (15:00~01:00) |
|---|---|---|---|---|
| PM2.5_H | 0.1174 | 0.1328 | 0.375 | 0.500 |
| PM2.5_3 | 0.2448 | 0.3683 | 0.375 | 0.250 |
| PM2.5_2 | 0.4063 | 0.3597 | 0.200 | 0.225 |
| PM2.5_1 | 0.2172 | 0.1392 | 0.050 | 0.025 |
Table 6.
Confidence of observing various PM2.5 categories on TSD in each year.
| PM2.5 Categories | TSD in 2017~2019 | TSD in 2017 | TSD in 2018 | TSD in 2019 |
|---|---|---|---|---|
| PM2.5_H | 0.264 | 0.458 | 0.333 | 0.0 |
| PM2.5_3 | 0.639 | 0.458 | 0.667 | 0.792 |
| PM2.5_2 | 0.097 | 0.084 | 0.0 | 0.208 |
| PM2.5_1 | 0.0 | 0.0 | 0.0 | 0.0 |
Table 7.
Confidence of observing various PM2.5 categories with proximity landmarks.
| PM2.5 Category | 2017~2019 | Night Market | Crossroad | Paper Mill | Temple | Highway Exit | Elem. School |
|---|---|---|---|---|---|---|---|
| PM2.5_H | 0.3147 | 0.3866 | 0.3615 | 0.3562 | 0.3347 | 0.3308 | 0.3139 |
| PM2.5_3 | 0.2639 | 0.3217 | 0.2640 | 0.2670 | 0.2632 | 0.2983 | 0.2729 |
| PM2.5_2 | 0.2298 | 0.2196 | 0.2062 | 0.2118 | 0.2213 | 0.2287 | 0.2270 |
| PM2.5_1 | 0.1916 | 0.0721 | 0.1683 | 0.1650 | 0.1808 | 0.1423 | 0.1862 |
Table 8.
Confidence of observing various PM2.5 categories at the places of different land uses.
| PM2.5 Category | 2017~2019 | Business | Resident | High Land | Agriculture |
|---|---|---|---|---|---|
| PM2.5_H | 0.3147 | 0.4467 | 0.3346 | 0.2975 | 0.2488 |
| PM2.5_3 | 0.2639 | 0.3008 | 0.2582 | 0.2604 | 0.2415 |
| PM2.5_2 | 0.2298 | 0.1684 | 0.2228 | 0.2340 | 0.2731 |
| PM2.5_1 | 0.1916 | 0.0841 | 0.1844 | 0.2080 | 0.2366 |
Disclaimer/Publisher’s Note: The statements, opinions and data contained in all publications are solely those of the individual author(s) and contributor(s) and not of MDPI and/or the editor(s). MDPI and/or the editor(s) disclaim responsibility for any injury to people or property resulting from any ideas, methods, instructions or products referred to in the content. |
© 2024 by the author. Licensee MDPI, Basel, Switzerland. This article is an open access article distributed under the terms and conditions of the Creative Commons Attribution (CC BY) license (https://creativecommons.org/licenses/by/4.0/).
Share and Cite
MDPI and ACS Style
Yin, P.-Y. Mining Associations between Air Quality and Natural and Anthropogenic Factors. Sustainability 2024, 16, 4614. https://doi.org/10.3390/su16114614
AMA Style
Yin P-Y. Mining Associations between Air Quality and Natural and Anthropogenic Factors. Sustainability. 2024; 16(11):4614. https://doi.org/10.3390/su16114614
Chicago/Turabian StyleYin, Peng-Yeng. 2024. "Mining Associations between Air Quality and Natural and Anthropogenic Factors" Sustainability 16, no. 11: 4614. https://doi.org/10.3390/su16114614
Note that from the first issue of 2016, this journal uses article numbers instead of page numbers. See further details here.