Article

How Can Financial Innovation Curb Carbon Emissions in China? Exploring the Mediating Role of Industrial Structure Upgrading from a Spatial Perspective

1
School of Finance, Jilin University of Finance and Economics, Changchun 130117, China
2
School of Business and Management, Jilin University, Changchun 130015, China
*
Author to whom correspondence should be addressed.
Sustainability 2024, 16(11), 4618; https://doi.org/10.3390/su16114618
Submission received: 23 April 2024 / Revised: 25 May 2024 / Accepted: 28 May 2024 / Published: 29 May 2024

Abstract

:
Within the sustainability framework, technological innovation’s impact is acknowledged. However, the environmental implications of institutional innovation, a crucial component of the innovation system, remain unclear, necessitating further research. This paper focuses on financial innovation as a representative of institutional innovation, exploring its relationship with carbon emissions. Utilizing panel data from 30 Chinese provinces spanning 2011 to 2022, we establish a spatial Durbin model and a mediating effects model to delve into the intricate relationships among financial innovation, industrial structure upgrading, and carbon emissions. Our findings reveal that: (1) Financial innovation significantly contributes to the upgrading of industrial structures both locally and in neighboring regions; (2) Both financial innovation and industrial structure upgrading effectively mitigate carbon emissions, with the latter playing a mediating role; (3) All three studied factors exhibit spatial clustering effects; (4) The suppressive effect of financial innovation on carbon emissions exhibits a notable spatial spillover. Compared to recent studies, this work innovatively explores the mediating impact mechanism of financial innovation suppressing carbon emissions, particularly demonstrating the spatial spillover characteristics of the mediating effect among the three variables. As China is a major carbon emitter and emerging economy, these insights offer valuable insights for global carbon governance.

1. Introduction

Global climate change poses a shared threat to sustainable economic growth worldwide. Addressing this challenge requires not only the active management of greenhouse gas emissions but also a keen focus on the economic implications of carbon reduction efforts. Innovation-driven development serves as a constant catalyst for the green and low-carbon transformation of economies [1]. While much literature has examined the environmental benefits of technological advancements, such as the impact of green technologies on fostering a low-carbon economy [2,3,4], institutional innovation has received less attention. Gradually, questions about its ecological effects and mechanisms of action have emerged as crucial research topics [5,6]. Among these, financial innovation, a prototypical example of institutional innovation, plays a pivotal role in promoting carbon emission reduction, yet its impact remains controversial and divisive.
On the one hand, institutional innovation theory argues that financial innovation can further propel technological advancements, thereby decreasing energy consumption per unit of GDP and mitigating carbon dioxide (CO2) emissions [7,8,9,10]. On the other hand, financial development theory suggests that financial innovation might exacerbate carbon emissions. For instance, financial development has facilitated easier access to financing for firms, enabling production expansion and subsequently increasing carbon emissions from the industrial sector [11,12,13]. Additionally, financial innovation has enabled consumers to engage in over-consumption, fueling consumer desires and demands, which also contributes to higher carbon emissions [14]. As such, there seems to be a paradoxical crossover in theory regarding the impact of financial innovation on carbon emissions. Deeper research is needed to quantify the strength of these effects and provide further evidence to resolve this paradox.
However, as the concept of financial innovation has undergone a transformation, diverse hypotheses have emerged regarding the nexus between the financial sector and carbon emissions [15]. The burgeoning development of Environment, Social, and Governance (ESG) finance, along with the pursuit of a green and low-carbon economy, has imposed heightened demands on the financial sector. This has compelled traditional financial institutions, which have stood the test of time for centuries, to deliberate on innovative strategies that align with the urgent call for sustainable development and ecological preservation [16]. Consequently, numerous scholars have begun to delve into the intricacies of financial innovation.

1.1. Financial Innovation and Carbon Emissions

Some scholars argue that financial innovation differs from financial development in that the former emphasizes qualitative enhancements, whereas the latter primarily concerns quantitative expansion [17,18,19]. Frame and White (2004) defined financial innovation as the creation of novel financial products and mechanisms that serve the real economy more efficiently [20]. Eriksonv and Johnson (2020) further stated that financial innovation involves the transformation of the existing financial system and the introduction of new financial instruments, leading to potential profits [21]. This process is gradual and continuous, driven by the profit motive. In recent years, scholars have begun to focus on the impact of financial innovation on carbon emissions, drawing insights from institutional innovation theory, and have made noteworthy discoveries. Existing studies have concluded that financial innovation can effectively mitigate carbon emissions. Firstly, innovations in financial products and institutions will foster the further advancement and optimization of carbon trading and carbon finance [22,23], thereby leveraging the capital market effectively and redirecting capital towards green and low-carbon industries.
Simultaneously, financial innovation holds the potential to enhance the financing structure and foster technological advancements, ultimately leading to energy conservation and emission reduction [24]. Secondly, the efficient allocation of financial resources is pivotal in driving the ongoing development of the financial industry. A higher overall level of financial development and a more mature capital market often correlate with a stronger environmental protection mindset among enterprises. These entities are more likely to uphold their corporate image by embracing social responsibilities such as energy conservation and emission reduction [25,26]. Thirdly, an increase in financial market innovation reduces information asymmetry between transaction parties, thereby reducing enterprise financing costs. This, in turn, enables high-polluting enterprises and others to embark on green technological innovation, vigorously pursue clean technology research and development, and effectively curb carbon emissions from both energy production and consumption sides [27,28,29]. Drawing from the comprehensive literature review and theoretical analysis conducted, this study proposes the following hypothesis:
Hypothesis 1. 
Financial innovation exerts a significant negative impact on carbon emissions.

1.2. Industrial Structure Upgrading and Carbon Emissions

To achieve the strategic objective of energy conservation and emission reduction, there is a preliminary consensus on three major paths: industrial structure upgrading, energy structure optimization, and technological progress [30]. While the positive impacts of energy structure optimization and technological progress are widely accepted in academic circles, scholars remain divided on the conclusion regarding the effects of industrial structure upgrading on carbon emissions. Morshedy et al. (2022) contended that the primary reason for China’s carbon emission decline is the enhancement of energy efficiency across various industries, specifically the reduction in industrial energy intensity, rather than the impact of industrial structure changes, which are minimal or even insignificant [31]. However, the majority of scholars maintain that industrial structure upgrading is beneficial in reducing carbon emissions [23,32]. Casotto et al. (2015) discovered that industrial restructuring contributed approximately 60% to China’s phased carbon reduction target through the establishment of a dynamic input–output model [33].
Industrial structure upgrading is a capital-, technology-, and human resource-intensive process, carrying significant costs. Herein, financial innovation emerges as a crucial catalyst. While some scholars have explored the nexus between financial innovation, industrial structure upgrading, and carbon emissions [34,35], there is a dearth of studies that delve into the “financial innovation–industrial structure upgrading–carbon emissions” pathway through mediating effects. Furthermore, spatial econometric analysis remains underutilized in this domain. Therefore, clarifying the intricate relationships among these three factors holds both innovative and valuable implications. A large number of empirical studies have proved that upgrading the industrial structure will increase the proportion of the tertiary sector, which will jointly reduce the demand for energy from the production side and the consumption side, thus reducing carbon emissions. In addition, upgrading the industrial structure can promote the development of high-tech enterprises and service industries, promote technological innovation and improve the energy consumption structure [36]. Increasing the research, development and use of clean energy can also improve the consumption and living habits of residents, thereby reducing carbon emissions [37]. Accordingly, we propose the second hypothesis of this paper.
Hypothesis 2. 
Industrial structure upgrading has a significant negative effect on carbon emissions.

1.3. Mediating Role of Industrial Structure Upgrading

There is a paucity of literature, especially empirical studies, that explore industrial structural upgrading through the lens of its mediating role. Nevertheless, theoretical mechanisms suggest specific paths of action. In the pursuit of a low-carbon economy, financial innovation emerges as a pivotal driver supporting the upgrading of industrial structures. Conversely, the evolution of this industrial structure has profound implications for regional carbon emissions. Financial innovation optimizes the allocation of financial resources, steering capital towards high-tech industries promising high investment returns. This redirection prompts enterprises to innovate and undergo transformative changes, fostering technological advancements and accelerating the upgrading of the industrial structure. This, in turn, serves as a catalyst for regional carbon emission reduction [38]. Moreover, from the demand perspective, financial innovation alters the consumption patterns and demands of residents. As financial products continue to innovate and integrate into residents’ lives, particularly through the emergence of Internet finance, the diversification of consumption demand and subsequent changes in consumption structure trigger industrial structure adjustments, driving its upgrading [39,40].
Additionally, financial innovation addresses the financing challenges associated with industrial structure upgrading. By reducing information asymmetry between financing parties, it mitigates financing risks and costs for enterprises. This, in turn, fulfills the diverse financing needs of enterprises and provides crucial financial backing for industrial structure upgrading [41]. A study conducted on BRICS nations revealed that financial innovation significantly contributes to promoting industrial structure upgrading [42]. A reasonable industrial structure can promote economic development, and there is a clear interactive relationship between the two [43]. According to economic theory, economic growth is always accompanied by the evolution of industrial structure. The continuous optimization of industrial structure will promote economic growth, change the mode of economic structure, and effectively improve the “quality and efficiency” of economic growth [44]. Under the concept of a low-carbon economy, economic growth should be based on sustainable development, pursuing both the speed and quality of development, while saving energy, reducing emissions, and protecting the environment. Achieving a low-carbon economy requires optimizing and upgrading the industrial structure [45]. Over 70% of carbon emissions are attributed to the industrial structure, which serves as both a “resource converter” and an “environmental controller.” Adjusting the industrial structure is the top priority for China to achieve its goal of energy conservation and emission reduction [46].
Therefore, based on theoretical deductions, it becomes evident that financial innovation can exert an influence on carbon emissions by shaping the upgrading of the industrial structure. This intricate relationship offers profound insights into how various economic forces interact to shape environmental outcomes. Based on the above theoretical analysis, we propose the following hypotheses.
Hypothesis 3. 
Financial innovation has a significant positive effect on industrial structure upgrading.
Hypothesis 4. 
Industrial structural upgrading plays a mediating role in the process of financial innovation affecting carbon emissions.
Drawing from the preceding theoretical analysis and comprehensive literature review, this paper meticulously crafts a research framework that elucidates the mediating mechanism among the three variables. This framework, depicted in Figure 1, offers a clear and comprehensive understanding of the intricate relationships and interactions among the variables, providing a solid foundation for further exploration and analysis.

1.4. Discussion on Existing Literature

Although the existing literature has made significant contributions to the related research on financial innovation and sustainable development, there are still some aspects worthy of further study.
First, the existing literature rarely includes the upgrading of industrial structure in developing countries in the relevant research field, especially rarely considering its mediating role. Unlike the relatively stable industrial structure of developed countries, there is still much room for upgrading the industrial structure of developing countries, especially in China. Over the past four decades, China has witnessed rapid industrialization and unprecedented economic growth, but this progress has come at a steep environmental cost. In 2020, China accounted for 30.7% of global CO2 emissions, ranking first worldwide, and is now facing mounting international pressure to reduce its carbon footprint. China’s industrial structure remains heavily weighted towards secondary industries, with nearly 40% of GDP attributed to this sector. Moreover, coal consumption comprises approximately 60% of the country’s energy mix, pointing to a coal-reliant energy system and a heavy industrial base as the primary drivers of China’s substantial CO2 emissions. Consequently, there is an urgent imperative to expedite the reduction in coal and petroleum’s share in the energy mix, significantly ramp up the utilization of renewable energy sources, and fine-tune the industrial structure while ensuring sustained economic growth.
Secondly, existing research has analyzed the impact of industrial structure on carbon emissions in the local and neighboring regions, arguing that industrial structure upgrading has a spatial spillover effect on carbon emission reduction. Specifically, industrial structure upgrading can promote carbon emission reduction by reducing carbon emissions in both the local and adjacent regions. In addition, Bhatti et al. (2023) point out that there are also significant spatial effects on carbon emissions (PM2.5) in China [47]. In this context, given the spatial spillover effects resulting from industrial structural upgrading and carbon dioxide emissions, it is plausible to infer that financial innovation’s impact may exhibit similar spatial dimensions. Nevertheless, the existing literature seldom delves into the spatial effects of financial innovation on sustainable development and industrial structure.
Addressing a critical research gap, this paper delves into the intricate relationship between financial innovation, industrial structure upgrading, and carbon emissions. We empirically analyze their potential spatial spillover effects, offering fresh insights. Key contributions include: (1) Innovatively proposing a mechanism through which financial innovation impacts carbon emissions, with industrial structure upgrading as a mediating variable. This complements the focus on technological innovations and underscores the significance of institutional innovation in environmental protection. (2) Using factor analysis and entropy value methods, we scientifically measure financial innovation and industrial structure levels in China, providing a valuable reference for future research. (3) Incorporating spatial characteristics, we adopt the spatial Durbin model to reveal spatial aggregation and spillover effects among variables. (4) Focusing on the world’s largest carbon emitters, our findings provide a theoretical grounding for controversial hypotheses and practical guidance for global carbon emissions governance.

2. Materials and Methods

To present the logic of the methodology section in a clearer manner, we created a flowchart, as shown in Figure 2.

2.1. Models

2.1.1. Spatial Durbin Model

Traditional linear regression models may lead to errors in the empirical results due to the neglect of their spatial spillover effects [48]. Therefore, this paper adopts a spatial econometric model to conduct an empirical study. The spatial econometric model includes a spatial lag model (SLM), a spatial error model (SEM) and a spatial Durbin model (SDM). First, the SLM is a crucial concept in spatial econometrics, used to describe spatial correlation and spatial dependence. Spatial lag refers to the influence of economic variables in one region being affected by the same variables in neighboring regions. In the study of economic and social phenomena, many variables are influenced not only by their own factors but also by the surrounding regions. Therefore, when analyzing and predicting these variables, it is necessary to consider such spatial effects. The SLM provides researchers with an effective tool to better understand and predict the changing trends of economic variables. In this study, the SLM contains the spatial lag term of the independent variables. Secondly, the SEM is used to study the effects between dependent variables in adjacent regions. In the field of sustainability research, the SEM can assist researchers in better assessing and managing environmental changes, as well as correlating the potential impacts of those changes. Thirdly, the SDM is a mathematical model that describes the relationship between different characteristics and their representation in high-dimensional spaces. This model can better capture the nonlinear relationships among data features, thereby enhancing the predictive performance of the model. The SDM has a wide range of applications, including environmental science, sociology, economics, and other fields. For instance, in the field of environmental science, it can be used to study the impact of environmental pollution and predict the impact of pollution in one region on another region. The spatial Durbin model, on the other hand, considers the spatial correlation of both the independent and dependent variables, which is superior to the other models [49]. Therefore, we chose the spatial Durbin model for our empirical study, which is shown in Equation (1).
C E it = β 0 + ρ 1 i = 1 n w i j C E j t + β 1 F I i t + ρ 2 i = 1 n w i j F I j t + β 2 I S U i t + ρ 3 i = 1 n w i j I S U j t + δ X i t + λ i = 1 n X j t + u i + ξ i t
In Equation (1), i and j are different neighboring provinces; t stands for year; C E represents carbon emissions; F I and I S U are financial innovation and industrial structure upgrading, respectively; β 0 β 2 is the estimated coefficient; ρ 1 ρ 3 and λ are spatially lagged term regression coefficients; X i t is the control variable; w i j is the spatial weight matrix; u i is the spatial fixed effect; and ξ i t is the residual term. In this paper, the spatial adjacency weight matrix is used. Let i = 1 when a province has a common boundary with the other province, and conversely i = 0 .

2.1.2. Mediation Models with Spatial Effect

In order to study the mediating role of industrial structure upgrading in financial innovation and carbon emissions, we constructed a mediating model with spatial effects as Equations (2) and (3).
C E i t = α 0 + π 1 i = 1 n w i j C E j t + α 1 F I i t + π 2 i = 1 n w i j F I j t + φ X i t + π 3 i = 1 n w i j X j t + v i + ζ i t
I S U i t = η 0 + θ 1 i = 1 n w i j I S U j t + η 1 F I i t + θ 2 i = 1 n w i j F I j t + γ X i t + θ 3 i = 1 n w i j X j t + μ i + τ i t
α and η in the equation are estimated coefficients; π 1 π 3 and θ 1 θ 3 are the regression coefficients of the spatial lag term; v i and μ i are the spatial fixed effect; ζ i t and τ i t are the residual term. Equation (2) is used to test whether financial innovation affects carbon emissions, while Equation (3) can test whether there is a mediating role of industrial structural upgrading.

2.2. Selection and Measurement of Variables

2.2.1. Dependent Variable

China’s carbon emissions mainly originate from the consumption of fossil energy [50,51]. Referring to Hailemariam et al. (2020) and Wu et al. (2023), carbon emissions per capita was selected as the dependent variable [52,53]. Higher carbon emissions per capita indicate more serious carbon pollution. There are a total of 31 provinces in mainland China. Except for Tibet, where data are missing and cannot be included in the statistics, the data from the remaining 30 provinces serve as the sample for this study. In addition, this paper involves collecting data across 36 dimensions, and China’s financial innovation began around 2011. Therefore, considering the availability of data and the integrity requirements of panel data for the measurement model, we selected 12 years of data from 2011 to 2022 as the sample, while ensuring the completeness and updating of the data to the greatest extent possible. The relevant data were obtained from the public information of the China National Bureau of Statistics, and the carbon emission indicator was noted as CE.

2.2.2. Independent Variable

On the basis of summarising previous research on financial innovation evaluation systems, we take full account of the availability and objectivity of data and construct a rational evaluation index system for financial innovation from a quantitative perspective. It provides a measurement tool for evaluating the financial innovation capacity in developing countries. We divide financial innovation into five specific dimensions, which are foundations of innovation [54], research and development (R&D) strength [55], technological advancement [56], market growth [57], and input–output indicators for innovation [58]. Details are shown in Table 1.
Data in Table 1 are derived from annual reports published by typical representative samples of financial firms in 30 provinces of China from 2011 to 2022. In order to provide a comprehensive measure of the level of financial innovation, it is necessary to downscale the 23 measurement indicators and ensure that the indicators reflect the vast majority of the original information by assigning weights. In this paper, an exponential fit of financial innovation was performed using factor analysis, which extracted and obtained five factors from 23 indicators with rotated variance explanations of (0.287, 0.203, 0.134, 0.120, 0.102). The cumulative explanatory rate of the factors reached 84.63%. The KMO value of the factor analysis is 0.806 and the p-value of the Bartlett test is 0.000, both of them proving the appropriateness of the factor analysis. Therefore, the evaluation index of financial innovation, denoted as FI, is calculated by assigning corresponding weights to each factor separately and weighting them.

2.2.3. Mediating Variable

Industrial structure upgrading is the mediating variable and is noted as ISU. Drawing on the research results of Westerholm et al. (2019) [59], we use the entropy method to construct an evaluation index system and measure the level of industrial structure upgrading from three aspects: rationalization, advancement and efficiency of industrial structures (Table 2).
The rationalization of industrial structures focuses on the degree of coordinated development of each industry; the advancement of industrial structures focuses on the evolution of the industrial structures from lower to higher levels; and the efficiency of industrial structures focuses more on the efficiency of industrial development. Scholars generally use the Theil index to measure the level of industrial rationalization. Thiel index takes into account the relative weights of different types of industries, and the measurement result is more accurate than the industrial structure deviation [60]. In this paper, we refer to the study of Bickenbach et al. (2019) [61] and use the Theil index (TL) to measure the level of industrial structure rationalization, as in Equation (4). TL is the industrial structure rationalization index; Yi and Li represent the value of GDP (billion) and the number of people employed (10,000) in each province’s i-th industries, respectively. The value of the Theil index is greater than 0. The closer it is to 0, the more reasonable is the industrial structure, which is an inverse indicator.
T L = i = 1 3 ( Y i Y ) ln ( Y i L i Y L )
In Table 2, all indicators, except the Thiel index, can be calculated by the statistical yearbook. We applied the entropy value method to calculate the indicator weights as in Equations (5)–(10).
  • Standardization of data. In order to evaluate the financial innovation capacity, the individual indicators need to be standardized. The specific methods of processing are Equation (5) for positive indicators and Equation (6) for inverse indicators.
Z i = X i X min X max X min
Z i = X max X i X max X min
  • Varying indicators for weighting. Xij denotes the value of the j-th indicator of the sample. m and n represent the number of samples and the number of indicators, respectively, as shown in Equation (7).
s i j = x i j i = 1 n x i j
  • Calculating the entropy value of each indicator.
h j = i = 1 n s i j ln s i j
  • Standardizing entropy values.
a j = max h j h j
  • Calculating the weights for indicator Xj.
ω j = a j j = 1 m a j

2.2.4. Control Variables

To ensure the reliability of the model, we draw on the research of Li and Wei (2021) [62] and select openness level (OL), energy intensity (EI), urbanization level (UL), technological advances (TA), economic growth (EG) and environmental regulation (ER) as control variables. The relevant data are available through the Statistical Yearbook. Table 3 shows the definitions of all control variables. Table 4 gives the mean and the standard deviation of the variables over the study period.

3. Results

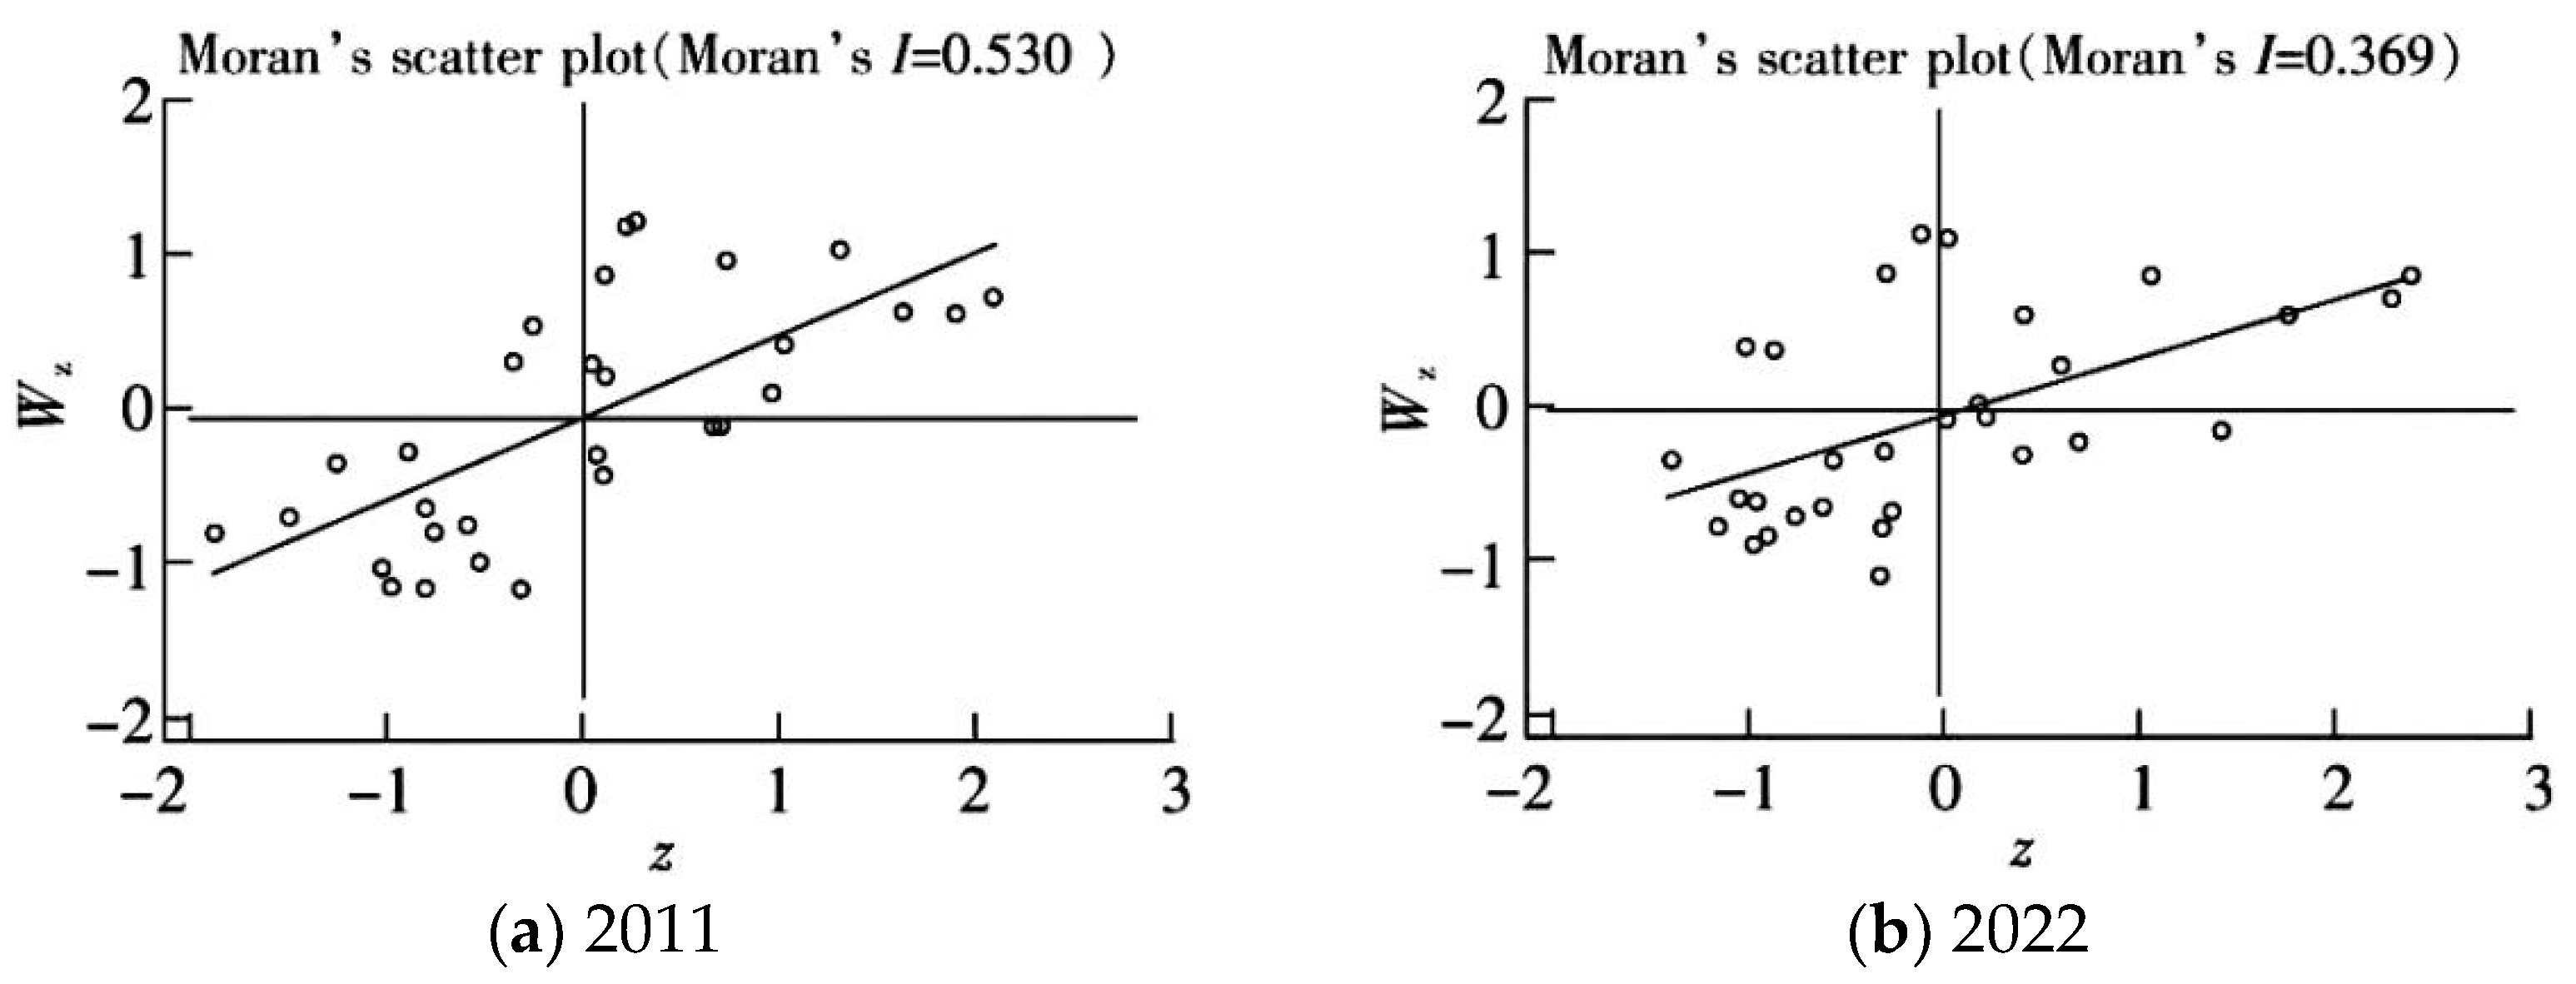
3.1. Spatial Clustering Analysis

The first step is to test the spatial clustering effects of the main variables. We used the natural breakpoint grading method in Arcgis 10.2 software to classify carbon emissions per capita into three categories, namely low carbon emission zones, medium carbon emission zones and high carbon emission zones. Subsequently, the Global Moran’s Index (Moran’s I) for financial innovation, industrial structure upgrading and carbon emissions was measured (Table 5). It can be seen that Moran’s I for financial innovation, industrial structure upgrading and carbon emissions passed the significance test in all years except 2021. It indicates that there is significant spatial clustering of financial innovation, industrial structure upgrading and carbon emissions at province levels.
Secondly, the spatial clustering of carbon emissions was further analyzed. In this paper, the 30 provinces are classified into four categories based on the type of spatial association, namely high-high clustering, low-low clustering, low-high clustering and high-low clustering of carbon emissions. Figure 3 shows the Moran’s I scatter of carbon emissions for China’s 30 provinces in 2011 and 2022. It can be seen that most of the province’s carbon emissions are in quadrant 1 and quadrant 3, which indicates the spatial clustering characteristics of carbon emissions among the provinces. The high-high clusters are mostly concentrated in the central and western regions such as Inner Mongolia, Ningxia and Shanxi, which have high per capita carbon emissions and are surrounded by neighboring high-carbon emitting regions. The low-low clusters are mainly concentrated in the eastern regions of Guangdong and Hunan, where both these provinces and their neighboring provinces have low carbon emissions. Only a few provinces are located in quadrants 2 and 4, i.e., low-high and high-low clusters, suggesting that these provinces’ own carbon emissions are not attractive to other provinces. Based on the above analysis, it can be seen that there is a significant spatial clustering of financial innovation, industrial structure upgrading and carbon emissions among the provinces.

3.2. Overall Regression Analysis of Fixed Panel Data based on Spatial Durbin Model

Firstly, we used Stata 15.0 to make a judgment on the specific choice of spatial econometric model. We performed the LM test, the LR test and the Wald test, all of which were within the 1% significance level and rejected the null hypothesis, indicating that the spatial Durbin model is not degradable to a spatial lag model or a spatial error model. Secondly, we carried out Hanusman tests on the models, and their p-values were all 0.000, rejecting the hypothesis of random effects. Therefore, we chose the fixed-effects spatial Durbin model. And thirdly, based on comparing the R2 and Log-likelihood values of the three spatial Durbin models, we found that the fixed-effects spatial model had the best model fit (Table 6). Thus, we focused on the regression results for the spatially fixed panel Durbin model.
As evidenced in Table 6, the regression coefficient of FI on CE is negative at the 5% significance level, indicating that financial innovation effectively reduces carbon emissions. This empirical finding is supported by some existing literature. For example, financial innovation has an inhibitory effect on carbon emissions through resource allocation [63] and financial factor innovation [64]. Hypothesis 1 is verified. The estimated coefficients of ISU and CE are negatively correlated at the 1% significance level, which proves that industrial structure upgrading can effectively reduce carbon emissions. Developing countries can significantly reduce carbon emissions by adjusting the ratio of the three major industrial structures, changing the layout of the industrial structure, reducing energy demand and promoting technological progress [65]. Therefore, Hypothesis 2 is verified.
In terms of control variables, energy intensity, urbanization, and economic growth all contribute significantly to regional carbon emissions. The level of regional openness did not have a significant effect on carbon emissions. The estimated coefficient of environmental regulation is significantly and positively correlated with carbon emissions. It suggests that environmental policies have produced results that are contrary to the policy objectives, confirming Smulders’ view of the ‘Green Paradox’ [66]. The insignificant impact of technological advances on carbon emissions is consistent with the findings of several existing studies [67,68]. The study by Irshaid et al. (2021) concluded that new technologies are subject to both structural and scale effects [69]. Measuring only the quantity of new technologies while ignoring their structure may make it difficult to detect their impact on environmental protection.
To further investigate the spatial spillover effect of financial innovation and industrial structure upgrading on carbon emissions, we decomposed the average total effect into direct effects and indirect effects (Table 7). The direct effect of FI on CE is significantly negative at the 5% level, indicating that financial innovation is effective in reducing carbon emissions in the region. However, the indirect effect between the two is negative and insignificant. The reason for this result may be the current low level of financial innovation in the regions [70]. The direct effect of ISU on CE is significantly negative, and the indirect effect is positive but not significant, indicating that the upgrading of industrial structure promotes carbon emission reduction in the region. As the industrial structure of the region is upgraded, some of the highly polluting and intensive industrial industries will be transferred to neighboring areas, thereby reducing local carbon emissions [71]. The spatial spillover effects between variables are shown in Table 7.

3.3. Test for Mediating Effect

According to the results in Table 6 and Table 7, it can be found that both financial innovation and industrial structure upgrading have a negative effect on carbon emissions. We further test for the mediating role of industrial structure upgrading in this section. The results of the primary estimates and secondary tests are presented in Table 8 and Table 9. Table 8 shows that in the model with ISU as the dependent variable (Model I), FI is significantly and positively correlated with ISU at the 1% level, which indicates that there is a positive impact of financial innovation on industrial structure upgrading to a certain extent, and there is a spatial spillover effect on neighboring regions. Financial innovation provides a favorable financial basis for the structural transformation of industries through a variety of innovative instruments [72]. Hypothesis 3 is tested.
In the model with CE as the dependent variable (Model II), ISU is significantly negatively correlated with CE, and the regression result between FI and CE is still significantly negative. It indicates that financial innovation can directly reduce carbon emissions, and industrial structure upgrading shows a partial mediating role in financial innovation influencing carbon emissions. On the one hand, financial innovation can directly suppress carbon emissions; on the other hand, financial innovation may reduce carbon emissions by influencing the upgrading of industrial structures. Hypothesis 4 is tested.
To further test the spatial clustering effect between FI, ISU and CE, we added observations on the direct, indirect and total effects among the variables in Table 8. As can be seen, in Model II, both the direct and indirect effects of financial innovation on carbon emissions are negatively correlated at the 1% significance level, proving that financial innovation not only has a suppressive effect on local carbon emissions, but also promotes carbon reduction in neighbouring regions. From the test results of Model I, it is clear that financial innovation influences the upgrading of the industrial structure of the region while also promoting the upgrading of the industrial structure of neighboring regions. In addition, Model II is a spatial Durbin model with mediating effects that we constructed, which reflects significantly higher levels of significance for direct, indirect and total effects compared to the results in Table 7. It proves that the spatial Durbin model has significant advantages.
In order to test the mediating effects again, we applied the bootstrap method and put FI, ISU and control variables into a Bootstrap test model with CE as the dependent variable. The sampling size was chosen as 1000 [73]. The results (Table 9) show that FI significantly positively influenced ISU (a = 0.036 ***) and both FI and ISU significantly negatively influenced CE (c = −0.065 **; b = −0.698 ***), with ISU playing a significant partial mediating role. First, the 95% BootCI for a × b is (−0.017–0.048), where the number 0 is excluded, indicating that ISU plays a significant mediating role. Secondly, the mediating effect value for a × b is −0.025, and the value for a × b/c is 0.385 which is less than 1. Also considering that c’ is significant, ISU plays a partial mediating role in the process of FI acting on CE [74]. And we measured the mediating effect of ISU as 38.5%. Hypothesis 4 is formally tested, namely that industrial structure upgrading plays a mediating role in the process of financial innovation affecting carbon emissions, although this mediating role is partial rather than complete.

3.4. Robustness Test

To ensure the robustness of the model, the original spatial matrix is replaced by the geographical weight matrix and the economic weight matrix in this paper. The effect of FI on CE and the mediating role of ISU were tested again. According to Table 10, it can be seen that the analysis results and the significance of the data are generally consistent with the previous section, which indicates that our empirical results are stable and reliable.

4. Discussion

4.1. Research Findings

The issue of environmental protection in the context of innovation is increasingly becoming a topic of lively debate among scholars. Research insights in this area are of great value, both for sustainable development and for the theoretical interpretation of practical issues. This paper focuses on the relationship between financial innovation, carbon emissions and industrial structure upgrading. The research findings better explain the relevant prior literature and corroborate the hypotheses of scholars.
Firstly, we find a new path for financial innovation to influence carbon emissions. The empirical study demonstrates that financial innovation can both directly inhibit carbon emissions and indirectly act on carbon emissions reduction by positively influencing industrial structure upgrading. This is supported by two previous scholarly hypotheses: the significant positive effect of financial innovation on industrial structural upgrading [17]; and the negative effect of industrial structural upgrading on carbon emissions [30]. We link these two prior studies and surprisingly find a mediating effect of industrial upgrading. These findings can well explain the results of previous scholars at the level of theoretical mechanisms.
Secondly, our study examines the spatial clustering effect of the variables and the spillover effect of their influences on each other from a spatial perspective. We find that financial innovation, industrial structure upgrading and carbon emissions all have spatial clustering effects, which verified the hypothesis of previous work [70]. We also find that the influences of financial innovation on both carbon emissions and industrial structure upgrading have spatial spillover effects. However, the suppression of carbon emissions by industrial upgrading appears to exist only in the region without geographical diffusion. These findings, obtained through empirical analysis, better explain the theoretical hypothesis of scholars on the role of innovation in ecology from the spatial dimension [49,50].
Finally, the empirical results on the control variables in the models also validate the findings of scholars on openness level, energy intensity, urbanization level, technological advances, economic growth and environmental regulation, including empirical support for the “Green Paradox” [62,66,69]. These findings will further consolidate and improve the existing knowledge base.

4.2. Contribution

Firstly, in the literature on the impact of innovation on environmental protection, scholars have generally focused on the role of traditional technological innovations such as new technologies and processes. However, institutional innovation, as an important part of the innovation theory system, has not received high priority. This paper adds to the collection of studies on the impact of institutional innovation on ecology, using financial innovation as a typical representative.
Secondly, it has been pointed out in the literature that financial innovation and industrial structure upgrading are important factors influencing carbon emissions [17,29]. Existing studies have respectively explored the theoretical mechanisms of action between financial innovation and carbon emissions, as well as between industrial structural upgrading and carbon emissions. On the one hand, these studies lack empirical support, and on the other hand, there is a fragmentation of the paths of action between variables. We combine the two mechanisms and empirically identify the paths of action between the three variables and the mediating effects of industrial structural upgrading. These findings can better open up the “black box” of variables and enhance the explanatory power of the theoretical hypotheses.
Thirdly, the financial innovations studied in this paper possess greater exploratory value and applicability compared to the existing literature that predominantly focuses on novel financial products, such as green bonds [75,76]. Although existing studies have extensively explored the positive impact of green bonds or green project investments on sustainable development, they are relatively new financial products that are more associated with corporate social responsibility sentiment and government guidance. In contrast, this work focuses on financial innovation, which differs significantly from the aforementioned financial product innovations. Financial innovation refers to the change of existing financial systems and the introduction of new financial instruments, representing a profit-driven, gradual, and continuous development process. Therefore, due to the profit-driven nature and characteristics of this continuous process, financial innovation may allow financial institutions to set aside the burden of CSR and legitimacy, and can contribute more to environmental protection in the long run.
Fourthly, in terms of the measurement of variables, we innovatively constructed a system of indicators for financial innovation and industrial upgrading. Foremost, differing from the existing literature that measures financial innovation solely through novel financial products or digital finance and other emerging business models, this study has constructed an evaluation index system for financial innovation encompassing four dimensions: the overall development level of the financial industry, innovation in financial markets, innovation in financial products and processes, and allocation of financial resources, comprising a total of 15 specific indicators. In the design of the variables, we highlighted the reasonableness of the indicators and the availability of data. We used factor analysis and entropy methods with multiple indicators to measure the variables. The design of this paper distinguishes from the single indicator approach of the existing literature and may provide a more complete measure of financial innovation and industrial structural upgrading. At the same time, the results of our empirical study support the rationality of these indicators. Our method of evaluating indicators on financial innovation and industrial structure upgrading can provide a reference for subsequent studies, especially those from developing countries.
Fifthly, several scholars have highlighted the exploration of relationships between variables in the spatio-temporal dimension in future research directions [77,78]. Our study takes full account of the time-fixed, spatially-fixed and time-space-dual fixed effects of the model. Optimal models were selected. Spatial clustering effects of variables and spatial spillover effects of impact mechanisms were observed. These findings can more adequately respond to the outlook of the existing literature.

4.3. Limitations and Prospects

Due to data availability, this paper has only conducted an empirical study on samples from China. Although the findings can be useful for financial innovation, industrial structure upgrading and carbon emissions in developing countries, there is still the problem of insufficient coverage. The energy structure, industrial structure and financial freedom of developed countries are significantly different from those of developing countries. These differences may lead to a lack of universality and robustness of the research findings. Future research could focus more on the effects of financial innovation on carbon emissions in developed countries under freer financial markets, thus providing a strong addition and discussion to the literature.

5. Conclusions

Sustainability is an important issue for all mankind. According to Balsa-Barreiro et al. (2019), CO2 emissions are highly correlated with GDP [79]. Compared with Western countries, developing countries have lower resource utilization efficiency. China is the largest developing country and the second-largest economy in the world. Accordingly, raising China’s level of environmental sustainability will benefit the world. Moreover, relevant experience provides a valuable reference for other developing countries. From the perspective of population dynamics, the marginal utility of carbon-reduction effects will be much higher in the East than in the West. This study provides some inspiration for global environmental governance and green development.
This study explains the effect of financial innovation on carbon emissions from a spatial perspective and analyses the mediating role of industrial structure upgrading. There is a significant spatial correlation between financial innovation, industrial structure upgrading and carbon emissions in 30 provinces of China. Financial innovation and industrial structure upgrading can effectively reduce carbon emissions in the region. The impact of financial innovation on carbon emissions has a significant spatial spillover effect, and it has a negative effect on carbon emissions in neighboring regions. Financial innovation not only promotes the upgrading of industrial structures in local and neighbouring regions, but also indirectly reduces regional carbon emissions through industrial structure upgrading. Industrial structure upgrading plays a significant and partially mediating role.
Based on this study, we propose the following practical implications. In order to effectively promote carbon emission reduction, provinces should pay attention to the role of financial innovation in carbon emission reduction in local and neighboring regions. The pace of financial innovation should be accelerated, green financial products should be vigorously developed, and linkage innovation in neighboring provinces should be promoted. Thus, the allocation of financial resources can be optimized to stimulate the vitality of enterprise technological innovation, control energy consumption from the production side and promote the development of low-carbon industries. Meanwhile, the upgrading of industrial structures should be accelerated to reduce carbon emissions in all aspects across the board.

Author Contributions

Conceptualization, J.A. and H.D.; methodology, J.A.; software, J.A.; validation, J.A. and H.D.; formal analysis, H.D.; investigation, J.A.; resources, H.D.; data curation, J.A.; writing—original draft preparation, J.A.; writing—review and editing, H.D.; visualization, H.D.; supervision, H.D.; project administration, H.D.; funding acquisition, J.A. All authors have read and agreed to the published version of the manuscript.

Funding

This research was funded by the Scientific Research Project of Jilin Provincial Department of Education (No. JJKH20231246SK), National Statistical Science Research Programme of China (No. 2023LY006), and the Science and Technology Development Program of Jilin Provincial Department of Science and Technology (No. 20230601021FG).

Institutional Review Board Statement

Not applicable.

Informed Consent Statement

Not applicable.

Data Availability Statement

The data that support the findings of this study are available from the corresponding author, He Di, upon reasonable request.

Conflicts of Interest

The authors declare no conflict of interest.

References

  1. Wilson, C. Disruptive low-carbon innovations. Energy Res. Soc. Sci. 2018, 37, 216–223. [Google Scholar] [CrossRef]
  2. Markandya, A.; Arto, I.; Gonzalez-Eguino, M.; Roman, M.V. Towards a green energy economy? Tracking the employment effects of low-carbon technologies in the European Union. Appl. Energy 2016, 179, 1342–1350. [Google Scholar] [CrossRef]
  3. Manaf, N.A.; Abbas, A. Economic and environmental sustainability of low-carbon power generation: Relevancy in the Malaysia green technology master plan (GTMP). J. Chem. Technol. Biotechnol. 2019, 94, 1425–1432. [Google Scholar] [CrossRef]
  4. Naqi, A.; Jang, J.G. Recent progress in green cement technology utilizing low-carbon emission fuels and raw materials: A review. Sustainability 2019, 11, 537. [Google Scholar] [CrossRef]
  5. Azam, A.; Rafiq, M.; Shafique, M.; Yuan, J. Mitigating carbon emissions in China: The role of clean energy, technological innovation, and political-institutional quality. Front. Environ. Sci. 2022, 10, 814439. [Google Scholar] [CrossRef]
  6. Zhang, M.; Liu, Y. Influence of digital finance and green technology innovation on China’s carbon emission efficiency: Empirical analysis based on spatial metrology. Sci. Total Environ. 2022, 838, 156463. [Google Scholar] [CrossRef] [PubMed]
  7. Zhang, W.; Xu, H. Effects of land urbanization and land finance on carbon emissions: A panel data analysis for Chinese provinces. Land Use Policy 2017, 63, 493–500. [Google Scholar] [CrossRef]
  8. Okere, K.I.; Onuoha, F.C.; Muoneke, O.B.; Oyeyemi, A.M. Towards sustainability path in Argentina: The role of finance, energy mix, and industrial value-added in low or high carbon emission-application of DARDL simulation. Environ. Sci. Pollut. Res. 2021, 28, 55053–55071. [Google Scholar] [CrossRef] [PubMed]
  9. Yuan, G.; Ye, Q.; Sun, Y. Financial innovation, information screening and industries’ green innovation-industry-level evidence from the OECD. Technol. Forecast. Soc. 2021, 171, 120998. [Google Scholar] [CrossRef]
  10. Ullah, H.; Wang, Z.; Mohsin, M.; Jiang, W.; Abbas, H. Multidimensional perspective of green financial innovation between green intellectual capital on sustainable business: The case of Pakistan. Environ. Sci. Pollut. Res. 2022, 29, 5552–5568. [Google Scholar] [CrossRef]
  11. Zhang, W.; Zhu, Z.R.; Liu, X.M.; Cheng, J. Can green finance improve carbon emission efficiency? Environ. Sci. Pollut. Res. 2022, 29, 68976–68989. [Google Scholar] [CrossRef] [PubMed]
  12. Dogan, E.; Seker, F. The influence of real output, renewable and non-renewable energy, trade and financial development on carbon emissions in the top renewable energy countries. Renew. Energy 2016, 60, 1074–1085. [Google Scholar] [CrossRef]
  13. Song, X.L.; Yao, Y.M.; Wu, X.K. Digital finance, technological innovation, and carbon dioxide emissions. Econ. Anal. Policy 2023, 80, 482–494. [Google Scholar] [CrossRef]
  14. Hsu, P.-H.; Tian, X.; Xu, Y. Financial development and innovation: Cross-country evidence. J. Financ. Econ. 2014, 112, 116–135. [Google Scholar] [CrossRef]
  15. Frame, W.S.; White, L.J. Empirical studies of financial innovation: Lots of talk, little action. J. Econ. Lit. 2004, 42, 116–144. [Google Scholar] [CrossRef]
  16. Laeven, L.; Levine, R.; Michalopoulos, S. Financial innovation and endogenous growth. J. Financ. Intermed. 2015, 24, 1–24. [Google Scholar] [CrossRef]
  17. Hall, S.; Foxon, T.J.; Bolton, R. Investing in low-carbon transitions: Energy finance as an adaptive market. Clim. Policy 2017, 17, 280–298. [Google Scholar] [CrossRef]
  18. Ben Arfi, W.; Hikkerova, L.; Sahut, J.-M. External knowledge sources, green innovation and performance. Technol. Forecast. Soc. 2018, 129, 210–220. [Google Scholar] [CrossRef]
  19. Cegarra-Navarro, J.-G.; Reverte, C.; Gomez-Melero, E.; Wensley, A.K.P. Linking social and economic responsibilities with financial performance: The role of innovation. Eur. Manag. J. 2016, 34, 530–539. [Google Scholar] [CrossRef]
  20. Oskouei, Z.H. Linking social and economic responsibilities and financial performance: The assisting role of innovation for an oil engineering and development company. Int. J. Financ. Econ. 2019, 24, 1345–1354. [Google Scholar] [CrossRef]
  21. Erikson, S.L.; Johnson, L. Will financial innovation transform pandemic response? Lancet Infect. Dis. 2020, 20, 529–530. [Google Scholar] [CrossRef] [PubMed]
  22. Hussain, M.; Papastathopoulos, A. Organizational readiness for digital financial innovation and financial resilience. Int. J. Prod. Econ. 2022, 243, 108326. [Google Scholar] [CrossRef]
  23. Li, Z.; Sun, L.; Geng, Y.; Dong, H.; Ren, J.; Liu, Z.; Tian, X.; Yabar, H.; Higano, Y. Examining industrial structure changes and corresponding carbon emission reduction effect by combining input-output analysis and social network analysis: A comparison study of China and Japan. J. Clean. Prod. 2017, 162, 61–70. [Google Scholar] [CrossRef]
  24. Dong, B.; Xu, Y.; Fan, X. How to achieve a win-win situation between economic growth and carbon emission reduction: Empirical evidence from the perspective of industrial structure upgrading. Environ. Sci. Pollut. Res. 2020, 27, 43829–43844. [Google Scholar] [CrossRef] [PubMed]
  25. Liu, Y.; Tang, L.; Liu, G. Carbon dioxide emissions reduction through technological innovation: Empirical evidence from Chinese provinces. Int. J. Environ. Res. Public Health 2022, 19, 9543. [Google Scholar] [CrossRef] [PubMed]
  26. Zheng, Y.; Xiao, J.; Huang, F.; Tang, J. How do resource dependence and technological progress affect carbon emissions reduction effect of industrial structure transformation? Empirical research based on the rebound effect in China. Environ. Sci. Pollut. Res. 2022, 30, 81823–81838. [Google Scholar] [CrossRef] [PubMed]
  27. Jing, L.; Jia, W.; Bo, Z. Are industrial structure adjustment and technical progress conducive to environmental improvement? J. Glob. Inf. Manag. 2022, 30. [Google Scholar] [CrossRef]
  28. Chen, L.; Xu, L.; Xu, Q.; Yang, Z. Optimization of urban industrial structure under the low-carbon goal and the water constraints: A case in Dalian, China. J. Clean. Prod. 2016, 114, 323–333. [Google Scholar] [CrossRef]
  29. Wang, K.; Wu, M.; Sun, Y.; Shi, X.; Sun, A.; Zhang, P. Resource abundance, industrial structure, and regional carbon emissions efficiency in China. Resour. Policy 2019, 60, 203–214. [Google Scholar] [CrossRef]
  30. Tian, X.; Bai, F.L.; Jia, J.H.; Liu, Y.; Shi, F. Realizing low-carbon development in a developing and industrializing region: Impacts of industrial structure change on CO2 emissions in southwest China. J. Environ. Manag. 2019, 233, 728–738. [Google Scholar] [CrossRef]
  31. Morshedy, A.S.; Taha, M.H.; El-Aty, D.M.A.; Bakry, A.; El Naggar, A.M.A. Solid waste sub-driven acidic mesoporous activated carbon structures for efficient uranium capture through the treatment of industrial phosphoric acid. Environ. Technol. 2021, 21, 101363. [Google Scholar] [CrossRef]
  32. Sun, J.; Tang, D.; Kong, H.; Boamah, V. Impact of industrial structure upgrading on green total factor productivity in the Yangtze river economic belt. Int. J. Environ. Res. Public Health 2022, 19, 3718. [Google Scholar] [CrossRef]
  33. Casotto, C.; Silva, V.; Crowley, H.; Nascimbene, R.; Pinho, R. Seismic fragility of Italian RC precast industrial structures. Eng. Struct. 2015, 94, 122–136. [Google Scholar] [CrossRef]
  34. Borgersen, T.-A.; King, R.M. Industrial structure and jobless growth in transition economies. Post-Communist Econ. 2016, 28, 520–536. [Google Scholar] [CrossRef]
  35. Frizziero, L.; Donnici, G.; Liverani, A.; Alessandri, G.; Menozzi, G.C.; Varotti, E. Developing innovative crutch using IDES (industrial design structure) methodology. Appl. Sci. 2019, 9, 5032. [Google Scholar] [CrossRef]
  36. Hu, W.; Tian, J.; Chen, L. An industrial structure adjustment model to facilitate high-quality development of an eco-industrial park. Sci. Total Environ. 2021, 766, 142502. [Google Scholar] [CrossRef] [PubMed]
  37. Nezhad, N.G.; Abd Rahman, R.N.Z.R.; Normi, Y.M.; Oslan, S.N.; Shariff, F.M.; Leow, T.C. Thermostability engineering of industrial enzymes through structure modification. Appl. Microbiol. Biotechnol. 2022, 106, 4845–4866. [Google Scholar] [CrossRef] [PubMed]
  38. Busch, T. Industrial ecology, climate adaptation, and financial risk. J. Ind. Ecol. 2020, 24, 285–290. [Google Scholar] [CrossRef]
  39. Khan, H.H.; Ahmad, R.B.; Gee, C.S. Market structure, financial dependence and industrial growth: Evidence from the banking industry in emerging Asian economies. PLoS ONE 2016, 11, e0160452. [Google Scholar] [CrossRef] [PubMed]
  40. Jiang, M.; Luo, S.; Zhou, G. Financial development, ofdi spillovers and upgrading of industrial structure. Technol. Forecast. Soc. 2020, 155, 119974. [Google Scholar] [CrossRef]
  41. Gong, Q.; Lin, J.Y.; Zhang, Y. Financial structure, industrial structure, and economic development: A new structural economics perspective. Manch. Sch. 2019, 87, 183–204. [Google Scholar] [CrossRef]
  42. Yumei, H.; Iqbal, W.; Irfan, M.; Fatima, A. The dynamics of public spending on sustainable green economy: Role of technological innovation and industrial structure effects. Environ. Sci. Pollut. Res. 2022, 29, 22970–22988. [Google Scholar] [CrossRef] [PubMed]
  43. Jiang, H.; Chen, Z.H.; Liang, Y.W.; Zhao, W.C.; Liu, D.; Chen, Z.Y. The impact of industrial structure upgrading and digital economy integration on China’s urban carbon emissions. Front. Ecol. Evol. 2023, 11. [Google Scholar] [CrossRef]
  44. Gu, R.D.; Li, C.F.; Yang, Y.Y.; Zhang, J.; Liu, K. Impact of digital economy development on carbon emission intensity in the Beijing-Tianjin-Hebei region: A mechanism analysis based on industrial structure optimization and green innovation. Environ. Sci. Pollut. Res. 2023, 30, 41644–41664. [Google Scholar] [CrossRef] [PubMed]
  45. Zhu, B.; Zhang, T.L. The impact of cross-region industrial structure optimization on economy, carbon emissions and energy consumption: A case of the Yangtze River Delta. Sci. Total Environ. 2021, 778, 146089. [Google Scholar] [CrossRef] [PubMed]
  46. Chang, H.; Ding, Q.Y.; Zhao, W.Z.; Hou, N.; Liu, W.W. The digital economy, industrial structure upgrading, and carbon emission intensity-empirical evidence from China’s provinces. Energy Strategy Rev. 2023, 50, 101218. [Google Scholar] [CrossRef]
  47. Bhatti, U.A.; Marjan, S.; Wahid, A.; Syam, M.S.; Huang, M.X.; Tang, H.; Hasnain, A. The effects of socioeconomic factors on particulate matter concentration in China’s: New evidence from spatial econometric model. J. Clean. Prod. 2023, 417, 137969. [Google Scholar] [CrossRef]
  48. An, H.; Xu, J.; Ma, X. Does technological progress and industrial structure reduce electricity consumption? Evidence from spatial and heterogeneity analysis. Struct. Chang. Econ. Dynam. 2020, 52, 206–220. [Google Scholar] [CrossRef]
  49. Ciminelli, J.T.; Love, T.; Wu, T.T. Social network spatial model. Spat. Stat. 2019, 29, 129–144. [Google Scholar] [CrossRef]
  50. Liu, L.; Chen, C.; Zhao, Y.; Zhao, E. China’s carbon-emissions trading: Overview, challenges and future. Renew. Energy 2015, 49, 254–266. [Google Scholar] [CrossRef]
  51. Miao, X.; Feng, E.H.; Siu, Y.L.; Li, S.S.; Wong, C.W.Y. Can China’s carbon intensity constraint policies improve carbon emission performance? Evidence from regional carbon emissions. J. Environ. Manag. 2023, 348, 119268. [Google Scholar] [CrossRef]
  52. Hailemariam, A.; Dzhumashev, R.; Shahbaz, M. Carbon emissions, income inequality and economic development. Empir. Econ. 2020, 59, 1139–1159. [Google Scholar] [CrossRef]
  53. Wu, Y.Z.; Shi, K.F.; Cui, Y.Z.; Liu, S.R.; Liu, L.L. Differentiated effects of morphological and functional polycentric urban spatial structure on carbon emissions in China: An empirical analysis from remotely sensed nighttime light approach. Int. J. Digit. Earth 2023, 16, 532–551. [Google Scholar] [CrossRef]
  54. Allen, F.; Walther, A. Financial Architecture and Financial Stability. Annu. Rev. Financ. Econ. 2021, 13, 129–151. [Google Scholar] [CrossRef]
  55. Pitluck, A.Z. The interpretive and relational work of financial innovation: A resemblance of assurance in Islamic finance. J. Cult. Econ. 2023, 16, 793–811. [Google Scholar] [CrossRef]
  56. Shiller, R.J. Capitalism and financial innovation. Financ. Anal. J. 2013, 69, 21–25. [Google Scholar] [CrossRef]
  57. Wei, S.P.; Jiang, F.X.; Pan, J.W.; Cai, Q.H. Financial innovation, government auditing and corporate high-quality development: Evidence from China. Financ. Res. Lett. 2023, 58, 104567. [Google Scholar] [CrossRef]
  58. Hardy, B.; Sever, C. Financial crises and innovation. Eur. Econ. Rev. 2021, 138, 103856. [Google Scholar] [CrossRef]
  59. Westerholm, M.; Castillo, M.D.P.; Andersson, A.C.; Nilsen, P.J.; Schnurer, A. Effects of thermal hydrolytic pre-treatment on biogas process efficiency and microbial community structure in industrial- and laboratory-scale digesters. Waste Manag. 2019, 95, 150–160. [Google Scholar] [CrossRef] [PubMed]
  60. Atsu, F.; Adams, S. Financial development and innovation: Do institutions and human capital matter. Heliyon 2023, 9, e19015. [Google Scholar] [CrossRef]
  61. Bickenbach, F.; Mbelu, A.; Nunnenkamp, P. Is foreign aid concentrated increasingly on needy and deserving recipient countries? An analysis of Theil indices, 1995–2015. World Dev. 2019, 115, 1–16. [Google Scholar] [CrossRef]
  62. Li, G.; Wei, W. Financial development, openness, innovation, carbon emissions, and economic growth in China. Energy Econ. 2021, 97, 105194. [Google Scholar] [CrossRef]
  63. Ali, R.; Meraj, M.; Mubarik, M.S. In the pursuit of financial innovation-Led financial inclusion: A proposed construct for financial trust. Borsa Istanb. Rev. 2023, 23, 1399–1413. [Google Scholar] [CrossRef]
  64. Babus, A.; Hachem, K. Markets for financial innovation. J. Econ. Theory 2023, 208, 105615. [Google Scholar] [CrossRef]
  65. Fang, H.; Jiang, C.; Hussain, T.; Zhang, X.; Huo, Q. Input digitization of the manufacturing industry and carbon emission intensity based on testing the world and developing countries. Int. J. Environ. Res. Public Health 2022, 19, 12855. [Google Scholar] [CrossRef] [PubMed]
  66. Kollenbach, G.; Schopf, M. Unilaterally optimal climate policy and the green paradox. J. Environ. Econ. Manag. 2022, 113, 102649. [Google Scholar] [CrossRef]
  67. Sovacool, B.K.; Newell, P.; Carley, S.; Fanzo, J. Equity, technological innovation and sustainable behaviour in a low-carbon future. Nat. Hum. Behav. 2022, 6, 326–337. [Google Scholar] [CrossRef] [PubMed]
  68. Wahab, S. Does technological innovation limit trade-adjusted carbon emissions? Environ. Sci. Pollut. Res. 2021, 28, 38043–38053. [Google Scholar] [CrossRef] [PubMed]
  69. Irshaid, J.; Mochizuki, J.; Schinko, T. Challenges to local innovation and implementation of low-carbon energy-transition measures: A tale of two Austrian regions. Energy Policy 2021, 156, 112432. [Google Scholar] [CrossRef]
  70. Sun, Z.; Cao, C.; He, Z.; Feng, C. Examining the coupling coordination relationship between digital inclusive finance and technological innovation from a spatial spillover perspective: Evidence from China. Emerg. Mark. Financ. Trade 2023, 59, 1219–1231. [Google Scholar] [CrossRef]
  71. Zhou, Y.; Kong, Y.; Sha, J.; Wang, H. The role of industrial structure upgrades in eco-efficiency evolution: Spatial correlation and spillover effects. Sci. Total Environ. 2019, 687, 1327–1336. [Google Scholar] [CrossRef] [PubMed]
  72. Chishti, M.Z.; Sinha, A. Do the shocks in technological and financial innovation influence the environmental quality? Evidence from BRIGS economies. Technol. Soc. 2022, 68, 101828. [Google Scholar] [CrossRef]
  73. Gonzalez, O.; Millechek, J.R.; Georgeson, A.R. Estimating latent baseline-by-treatment interactions in statistical mediation analysis. Struct. Equ. Model. 2023, 30, 914–925. [Google Scholar] [CrossRef]
  74. Qin, X. An introduction to causal mediation analysis. Asia Pac. Educ. Rev. 2024. [Google Scholar] [CrossRef]
  75. Alamgir, M.; Cheng, M.C. Do green bonds play a role in achieving sustainability? Sustainability 2023, 15, 10177. [Google Scholar] [CrossRef]
  76. Teti, E.; Baraglia, I.; Dallocchio, M.; Mariani, G. The green bonds: Empirical evidence and implications for sustainability. J. Clean. Prod. 2022, 366, 132784. [Google Scholar] [CrossRef]
  77. Isensee, J.; Datseris, G.; Parlitz, U. Predicting spatio-temporal time series using dimension reduced local states. J. Nonlinear Sci. 2020, 20, 713–735. [Google Scholar] [CrossRef]
  78. Harikumar, E.; Panja, S.K.; Rajagopal, V. Time-space noncommutativity and casimir effect. Nucl. Phys. B 2020, 950, 114842. [Google Scholar] [CrossRef]
  79. Balsa-Barreiro, J.; Li, Y.; Morales, A.; Pentland, A.S. Globalization and the shifting centers of gravity of world’s human dynamics: Implications for sustainability. J. Clean. Prod. 2019, 239, 117923. [Google Scholar] [CrossRef]
Figure 1. Theoretical framework.
Sustainability 16 04618 g001
Figure 2. Methodology flowchart.
Sustainability 16 04618 g002
Figure 3. Moran’s I scatter plots for carbon emissions in 2011 and 2022.
Sustainability 16 04618 g003
Table 1. Indicator system for the evaluation of financial innovation capacity.
DimensionsIndicatorsUnit
Foundations of InnovationNon-performing loan ratio%
Current ratio%
Capital adequacy ratio%
New local financial regulation documentspcs
Number of non-compliant financial institutions in the jurisdictionpcs
R&D StrengthPercentage of R&D staff%
Percentage of middle and senior technical staff%
Success rate of R&D%
Incentive actions by companies for innovationpcs
Technological AdvancementValue of annual financial innovation as a percentage of R&D expenses%
Number of joint developments of innovative financial productspcs
Replacement rate by e-commerce%
Replacement rate by Internet finance%
Number of financial patentspcs
Number of financial papers publishedpcs
Market GrowthMarket capacity for new productsBillion¥
Market share of new products%
Growth rate of operating income from new products%
Ratio of operating income from new products to total revenue%
Input–output Indicators for InnovationGrowth rate of R&D expenses%
R&D expenses as a percentage of operating income%
R&D expenses as a percentage of net profit%
Growth rate of profit from new products%
Table 2. Evaluation index system for the level of industrial structure upgrading.
DimensionsIndicatorsUnitWeights Determined by Entropy Method
Rationalization of Industrial StructuresTheil index/0.133
Advancement of Industrial StructuresGDP of high-tech industries as a percentage of total GDP
GDP of secondary and tertiary sectors as a percentage of total GDP
%0.156
%0.114
Efficiency of
Industrial Structures
Input–output ratio of the secondary sector
Input–output ratio of the tertiary sector
Output per capita in the secondary sector
Output per capita in the tertiary sector
/0.085
/0.187
Billion¥/10,000 people0.149
Billion¥/10,000 people0.176
Table 3. Qualitative representation of the variables.
CategoriesVariablesNotesCalculations
Dependent VariableCarbon emissionsCENatural log of carbon emissions per capita
Independent VariableFinancial innovationFICalculated by factor analysis
Mediating VariableIndustrial structure upgradingISUCalculated by the entropy method
Control VariablesOpenness levelOLTotal imports and exports/GDP
Energy intensityEITotal energy consumption/GDP (units of 10,000)
Urbanization levelULUrban population as a percentage of total
Technological advancesTANatural log of the number of patents granted
Economic growthEGNatural log of GDP per capita
Environmental regulationERNatural log of industrial governance investment
Table 4. Descriptive statistics of the variables.
VariablesNotesMeanStandard Deviation
Carbon emissionsCE2.040.16
Financial innovationFI71.270.78
Industrial structure upgradingISU0.390.09
Openness levelOL0.370.04
Energy intensityEI0.610.10
Urbanization levelUL0.640.19
Technological advancesTA12.480.32
Economic growthEG9.070.25
Environmental regulationER15.730.24
Table 5. Spatial clustering analysis based on Moran’s I.
YearFIISUCE
Moran’s IpMoran’s IpMoran’s Ip
20110.1870.0220.1080.0920.5300.000
20120.1450.0390.1390.0580.5000.000
20130.1530.0320.1950.0190.5070.000
20140.2460.0050.1980.0180.4830.000
20150.2500.0050.2040.0160.4720.000
20160.2920.0020.2100.0140.4410.000
20170.2460.0040.1950.0190.4400.000
20180.2890.0010.1730.0320.4190.000
20190.2140.0110.1840.0270.4020.000
20200.2030.0150.2080.0150.3780.000
2021−0.0070.3960.2040.0170.3760.000
20220.1940.0210.2540.0050.3690.000
Table 6. Results of spatially fixed panel regression analysis.
Variables Non-Spatially Fixed
Effect Model
Spatial Durbin Model
Time Fixed Spatial Fixed Double Fixed in Time and Space
FI−0.063 ***−0.164 ***−0.054 **−0.063 **
(−2.07)(−3.00)(−2.05)(−2.41)
ISU−0.665 ***−0.924 ***−0.780 ***−0.750 ***
(−3.03)(−2.03)(−4.33)(−3.84)
OL0.129 *−0.1260.0420.070
(1.95)(−1.40)(0.76)(1.20)
EI0.281 ***0.483 ***0.309 ***0.334 ***
(6.82)(20.06)(7.81)(8.39)
UL0.023 ***0.021 ***0.016 ***0.020 ***
(5.52)(5.00)(4.07)(4.92)
TA0.007−0.057 ***0.011−0.005
(0.27)(−1.92)(0.46)(−0.18)
EG−0.0510.416 ***0.318 **0.197
(0.748)(4.91)(2.06)(1.25)
ER0.023 *0.180 ***0.024 **0.025 *
(1.92)(9.58)(2.42)(1.88)
R20.570.150.530.23
Log-likelihood21.8751.32364.66375.93
Rho 0.1100.465 ***0.394 ***
(1.48)(7.11)(5.58)
Note: ***, ** and * denote 1%, 5% and 10% significance levels, respectively, as below.
Table 7. Test results for spatial spillover effects.
VariablesDirect EffectsIndirect EffectsTotal Effect
Coefficientst-ValueCoefficientst-ValueCoefficientst-Value
FI−0.067 **−2.18−0.171−1.51−0.237 ***−1.80
ISU−0.753 ***−4.110.4460.92−0.309−0.54
OL0.0500.920.0260.200.0760.49
EI0.305 ***8.03−0.043−0.400.263 **2.23
UL0.017 ***4.340.0090.670.026 *1.73
TA0.0251.040.155 *2.070.180 **2.22
EG0.284 **1.97−0.324−1.05−0.040−0.14
ER0.025 ***2.610.0130.480.0391.26
Note: ***, ** and * denote 1%, 5% and 10% significance levels, respectively, as below.
Table 8. Regression estimation of the mediating role of ISU.
VariablesSpatial Durbin Model
ISU (Model I)CE (Model II)
FI0.020 ***−0.061 **
ISU −0.553 ***
Control VariablesYESYES
R20.640.52
Log-likelihood613.12354.91
Rho0.248 ***0.433 ***
Direct effects0.028 ***−0.078 ***
Indirect effects0.151 ***−0.237 ***
Total effect0.179 ***−0.315 ***
Note: *** and ** denote 1% and 5% significance levels, respectively, as below.
Table 9. Bootstrap test for mediating effect.
caba × ba × b (p-Value)a × b
(95% BootCI)
c′Conclusion
−0.065 **0.036 ***−0.698 ***−0.0250.000 ***−0.187~−0.347−0.058 **Partial mediating role
Note: “c” represents the coefficient of effect of FI on CE; “a” represents the coefficient of effect of FI on ISU; “b” represents the coefficient of effect of ISU on CE; “c′” represents the coefficient of the effect of FI on CE after adding the mediating variable (ISU) in the model. *** and ** denote 1% and 5% significance levels, respectively, as below.
Table 10. Results of the robustness test.
VariablesWeighting Matrix for Geographical DistanceWeighting Matrix for Economic Distance
CECEISUCECEISU
FI−0.053 *−0.063 **0.020 ***−0.052 *−0.077 ***0.018 **
ISU−0.612 *** −0.600 ***
Control VariablesYESYESYESYESYESYES
R20.540.500.530.590.560.55
Rho0.400 ***0.409 ***0.251 ***0.178 *0.300 ***0.434 ***
Note: ***, ** and * denote 1%, 5% and 10% significance levels, respectively, as below.
Disclaimer/Publisher’s Note: The statements, opinions and data contained in all publications are solely those of the individual author(s) and contributor(s) and not of MDPI and/or the editor(s). MDPI and/or the editor(s) disclaim responsibility for any injury to people or property resulting from any ideas, methods, instructions or products referred to in the content.

