Abstract
Qualtra, an innovative 10 MW geothermal power plant proposal, employs a closed-loop design to mitigate emissions, ensuring no direct release into the atmosphere. A thorough assessment utilizing energy and exergy analysis, life cycle assessment (LCA), exergo-economic analysis, and exergo environmental analysis (EevA) was conducted. The LCA results, utilizing the ReCiPe 2016 midpoint methodology, encompass all the spectrum of environmental indicators provided. The technology implemented makes it possible to avoid direct atmospheric emissions from the Qualtra plant, so the environmental impact is mainly due to indirect emissions over the life cycle. The result obtained for the global warming potential indicator is about 6.6 g CO2 eq/kWh, notably lower compared to other conventional systems. Contribution analysis reveals that the construction phase dominates, accounting for over 90% of the impact for almost all LCA midpoint categories, excluding stratospheric ozone depletion, which is dominated by the impact from the operation and maintenance phase, at about 87%. Endpoint indicators were assessed to estimate the single score value using normalization and weighting at the component level. The resulting single score is then used in an Exergo-Environmental Analysis (EEvA), highlighting the well system as the most impactful contributor, constituting approximately 45% of the total impact. Other substantial contributions to the environmental impact include the condenser (21%), the turbine (17%), and the HEGeo (14%). The exergo-economic analysis assesses cost distribution across major plant components, projecting an electricity cost of about 9.4 c€/kWh.
1. Description of the Qualtra Geothermal Project
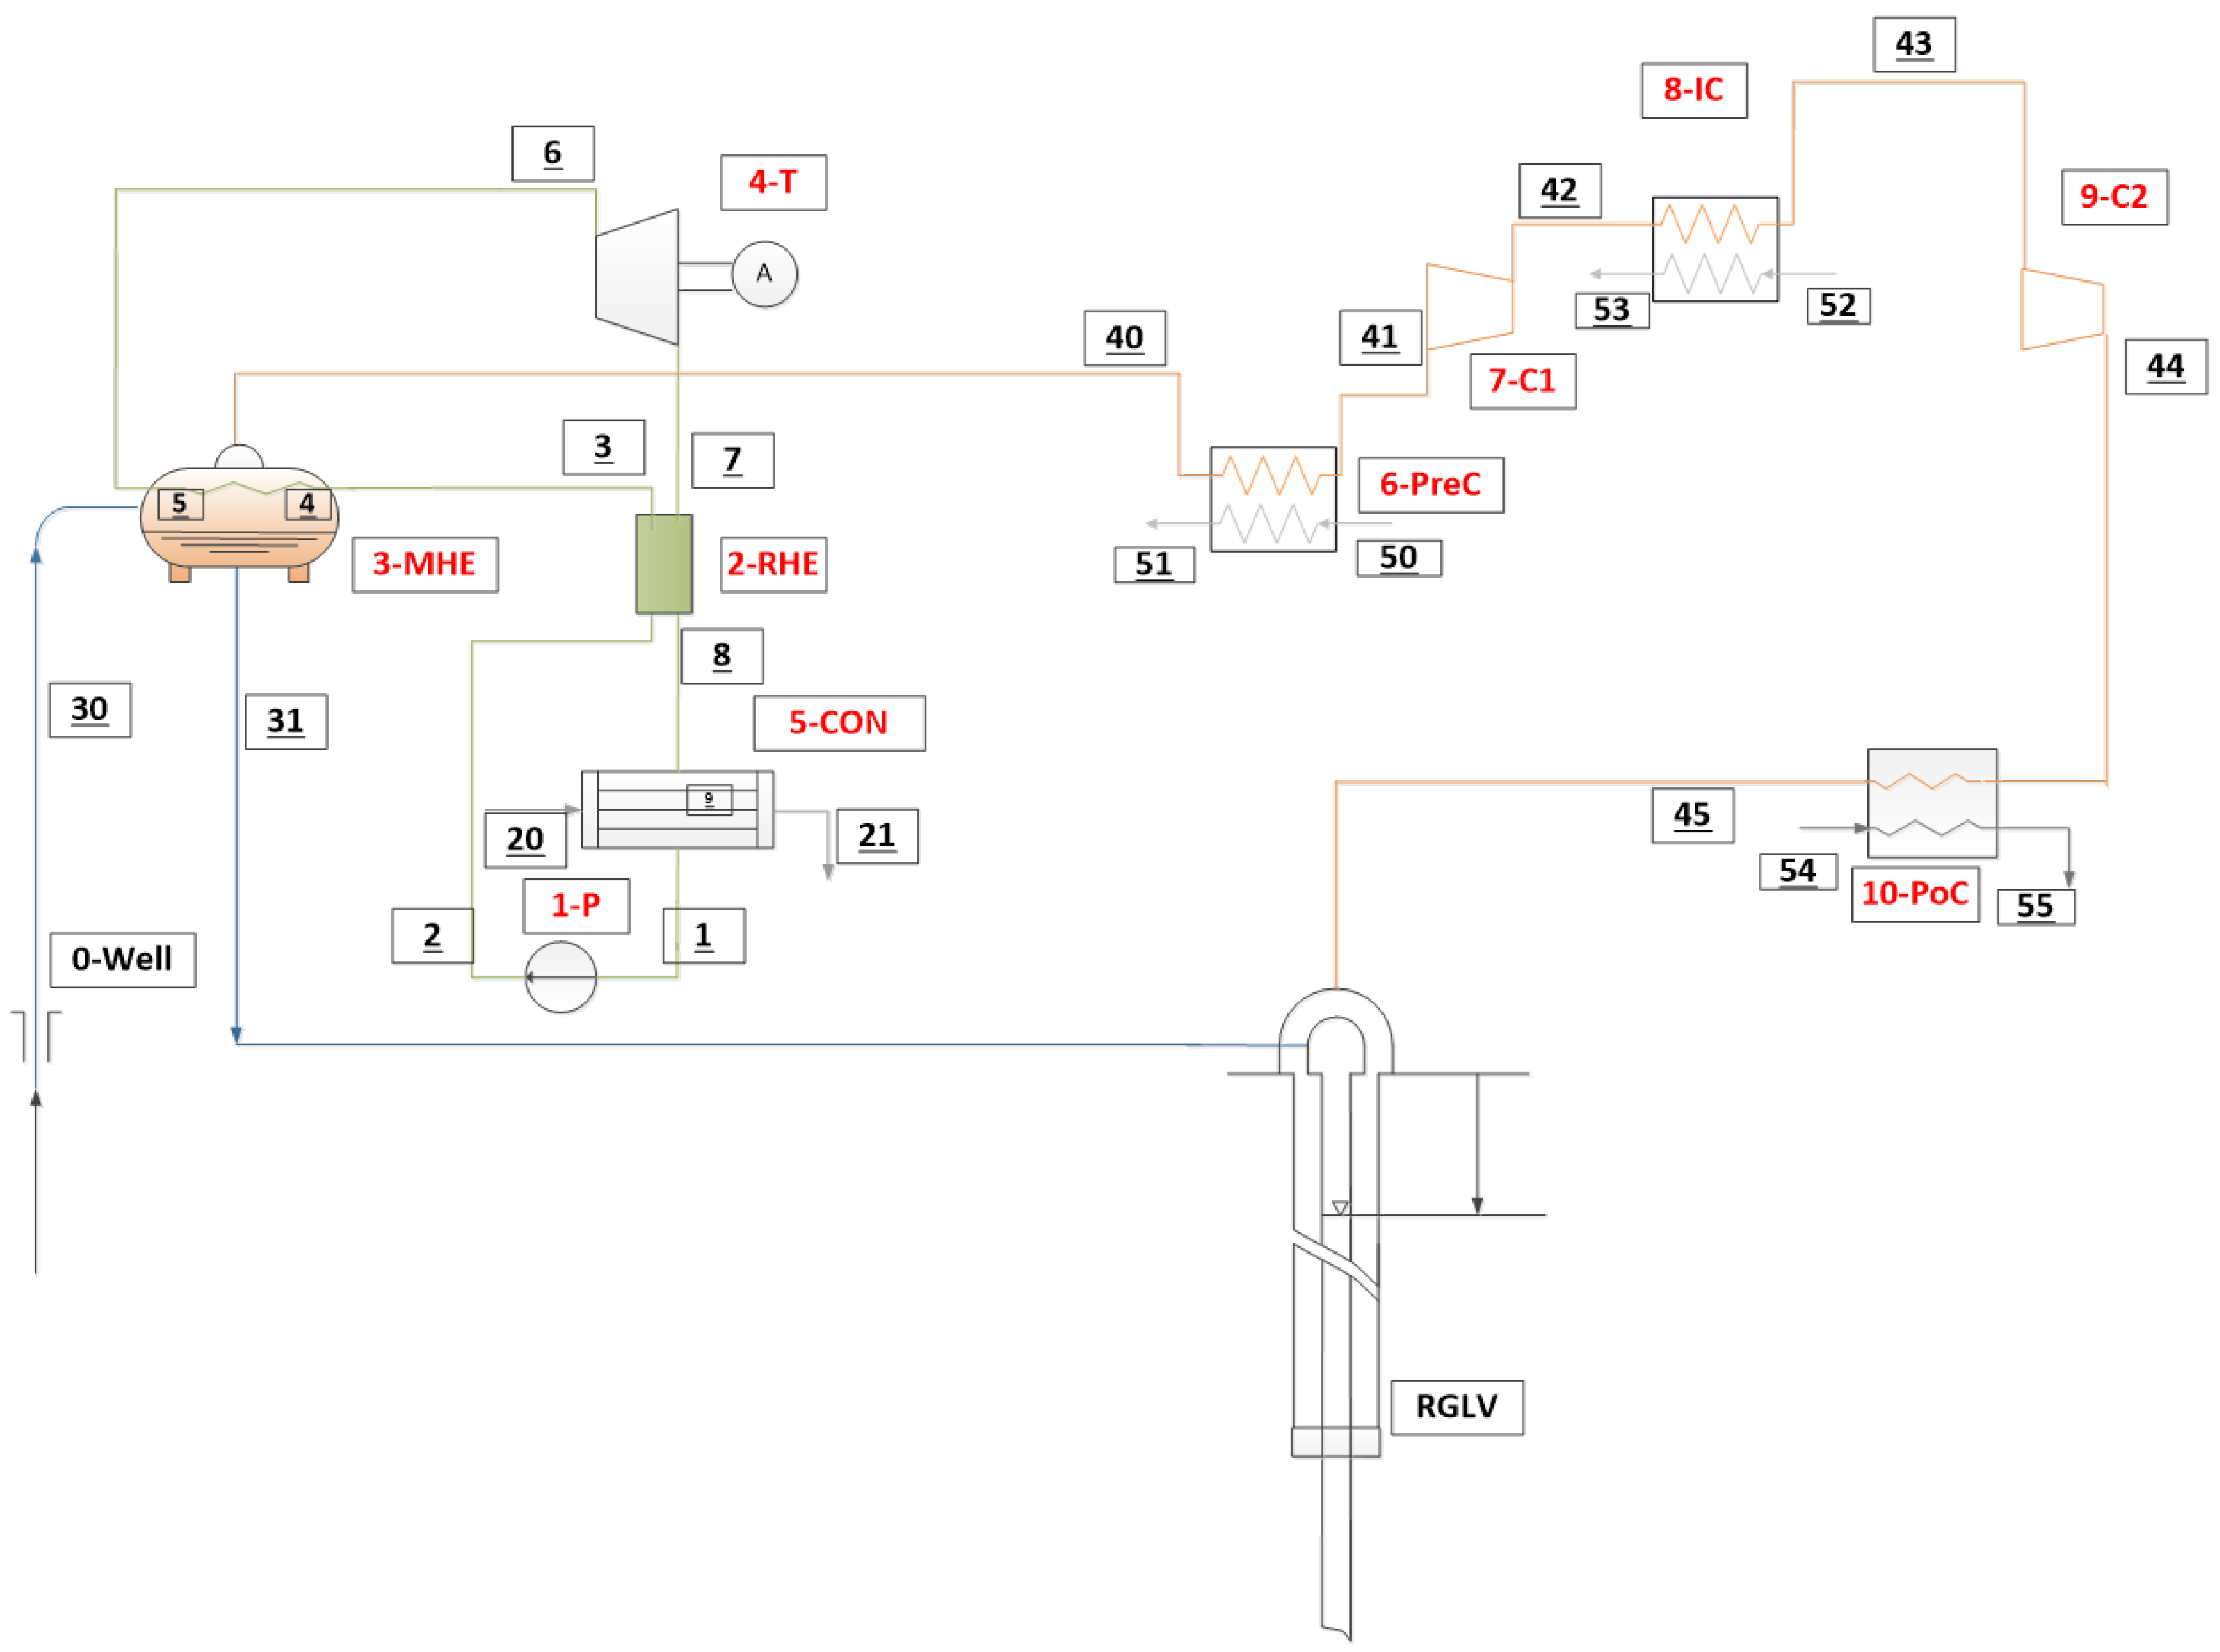
Qualtra is an innovative proposal for a modern geothermal power plant (GPP), applying for the first time a closed-loop operation [1], that is, avoiding emissions into the atmosphere. The technology applied relies on a binary cycle approach. As is shown in Figure 1, the geothermal resource (superheated steam at 10 bar and 180 °C is expected at this specific site, with a flow rate of 32.96 kg/s) heats the working fluid (R1233zd(E) in this specific case—a modern synthetic fluid with limited impact in case of release to the environment), which is then directed to the turbine of the Rankine cycle. An air-cooled condenser is applied to recover the condensate working fluid, which is then pressurized by a pump and sent back to the main heat exchanger (MHE). In this final stage, the resource undergoes condensation under pressurized conditions, approximately 10 bars. During this process, the liquid brine is recovered, subcooled to preheat the working fluid, and directed for re-injection into the reservoir. The NCG stream is collected at the dome of the MHE and extracted using a set of intercooled compressors (water is recovered at the first intercoolers along the compressor line). The high-pressure NCG stream (mainly CO2) is directed to the innovative re-injection well. This operates following a new concept: two-phase flow re-injection (the liquid brine + the compressed NCG stream) is realized by mixing the streams at substantial depths using a coaxial pipe arrangement and one or more reverse-gas lift valves, which allow the gas (which passes across the external annulus) into the inner pipe, delivering the brine [1]. The mixing conditions at depth take place at high pressure, and accurate two-phase flow models were realized in WP2 and 4 of the GECO Project to demonstrate that the two-phase flow regime would be stable (including transients of operation, such as well startup or closure) and ensure that the NCG stream is proceeding downwards into the reservoir. Long-term reservoir simulations have shown that if the reservoir is large enough (as is expected in the Qualtra location), there will not be an excessive buildup of CO2 inside the reservoir over a substantial lifetime (20 years). The two-phase flow re-injection technology allows to re-inject in the reservoir much larger flow rates than what is possible using the carryover of dissolved NCGs within the liquid stream. The solubility of CO2 in the liquid brine depends on the nature of dissolved salts and the mixing pressure, and is anyway limited, making it feasible for a complete re-injection of the NCGs, even in the challenging conditions expected for the Qualtra project site (10% NCGs in mass).
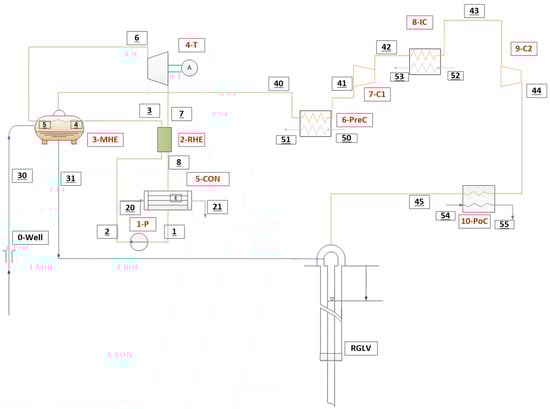
Figure 1.
Diagram of the Qualtra power plant configuration. MHE—main heat exchanger; RHE—regenerative heat exchanger; T—turbine; CON—air-cooled condenser; P—pump; RGLV—reverse gas lift valve; PreC—pre-cooler; C1—compressor 1; IC—intercooler; C2—compressor 2; PoC—post-cooler.
The complete re-injection of the NCGs is the main innovative feature of the proposed plant making feasible a complete closed-cycle operation. Current GPPs using direct expansion of the resource (either flash or direct steam technology) release the NCGs (usually at the cooling tower), and also binary plants function the same, as the solubility of NCGs in water (even using a closed circuit for the working fluid) decreases with temperature so that the gas phase accumulates in the upper part of the main heat exchanger and is usually vented to the atmosphere. The two-phase re-injection technology allows re-injecting all the NCGs using the extracted liquid flow rate, while experience in gas re-injection in the liquid phase requires considerable use of additional water resources as the solubility of the gas phase in the liquid is limited [2]. The NCGs are mainly CO2 (determining greenhouse effects), but may contain contaminants (in this specific region, H2S, Hg, CH4, and B). It is thus expected that these matters are adequately addressed by a life cycle assessment.
2. Life Cycle Assessment
2.1. Life Cycle Assessment of Geothermal Power Plants
The life cycle analysis of GPPs has recently evolved from the pilot applications [3,4,5,6,7] to the proposal of a standardized approach [8]. The present analysis is set following the approach recommended in [8], which is compliant with the general framework for LCA [9,10]. A standard sheet for collecting the life cycle inventory applied in several other geothermal projects “https://www.geoenvi.eu/ (accessed on 26 May 2024)” was used, and information about the number, size, profile, and depth of the wells was provided by the project developer (MagmaEnergy Italia). The recommendations in [8] are limited to selected relevant categories referring to the midpoint evaluation level (environmental impacts). To conduct the exergo-environmental analysis, it is necessary to evaluate the single score following the processes of normalization and weighting [11]. To achieve this, the ReCiPe 2016 method was employed. Additionally, a distinct Life Cycle Assessment (LCA) was executed for each primary component of the plant, enabling the calculation of individual single-score values for these components.
2.2. Life Cycle Inventory (LCI) for the Qualtra Plant
The system boundaries are confined solely to the power plant, encompassing the production and re-injection wells, surface machinery, plant infrastructure, operational and maintenance phases, and the closure of geothermal wells. Consequently, systems associated with the energy transport network and material transportation to the site are disregarded. For this reason, the processes that were modeled and which constitute the LCI are drilling wells, wellhead, piping, building, machinery, operation and maintenance, and well closure.
In this section, the life cycle inventory, referred to as the main process of the Qualtra GPP, is briefly reported (Table 1, Table 2 and Table 3). The complete view of LCI can be found in the Supplementary Materials.

Table 1.
LCI—Main parameter.
Table 2.
LCI—geothermal drilling.
Table 3.
LCI—machinery. [1] = pump; [2] = recuperator; [3] = heat exchanger geothermal; [4] = turbine; [5] = condenser; [6] = pre-cooler; [7] = compressor I; [8] = intercooler; [9] = compressor II; [10] = post-cooler.
2.3. Midpoint Life Cycle Impact Analysis (LCIA) for the Qualtra Plant
The LCIA was performed using OpenLCA 2.0 [12], with secondary data sourced through the EcoInvent 3.6 database [13] and applying the ReCiPe 2016 midpoint methodology. The functional unit is the kWh produced by the Qualtra geothermal system, estimating a useful life of 30 years. The results obtained from the LCIA analysis are reported in the table below. Table 4 shows 18 different environmental impacts, reported as impact categories. Each unit is specific to its environmental indicator, and it is related to the functional unit, which, in this context, pertains to the production of one kilowatt-hour (kWh) of energy over a 30-year lifespan of the power plant. It is crucial to underscore that the Qualtra power plant, as detailed earlier, employs a complete re-injection process for the geothermal fluid, leading to zero direct emissions into the atmosphere. Consequently, certain categories, such as GWP, TAP, HTPc, and HTPnc, related to emitted gases, present results solely based on indirect emissions throughout the life cycle. The GWP indicator is highlighted as a reference point, with a fixed value of 6.56 g CO2 eq/kWh. This indicator serves as a benchmark for assessing the environmental impact associated with greenhouse gas emissions, providing a standardized measure for comparative analysis within the specified context. Particular significance arises when comparing it with the various scenarios analyzed by Frick et al. (2010) [6] for a standard ORC geothermal plant. The worst-case scenario has a variable impact in the range between 500 and 750 g COeq/kWh, while the best-case scenario has a variable range between 6 and 12 g CO2/eq. This indicates that the Qualtra power plant achieves environmental performance comparable to the best installed ORC solutions.
Table 4.
Qualtra impact analysis table.
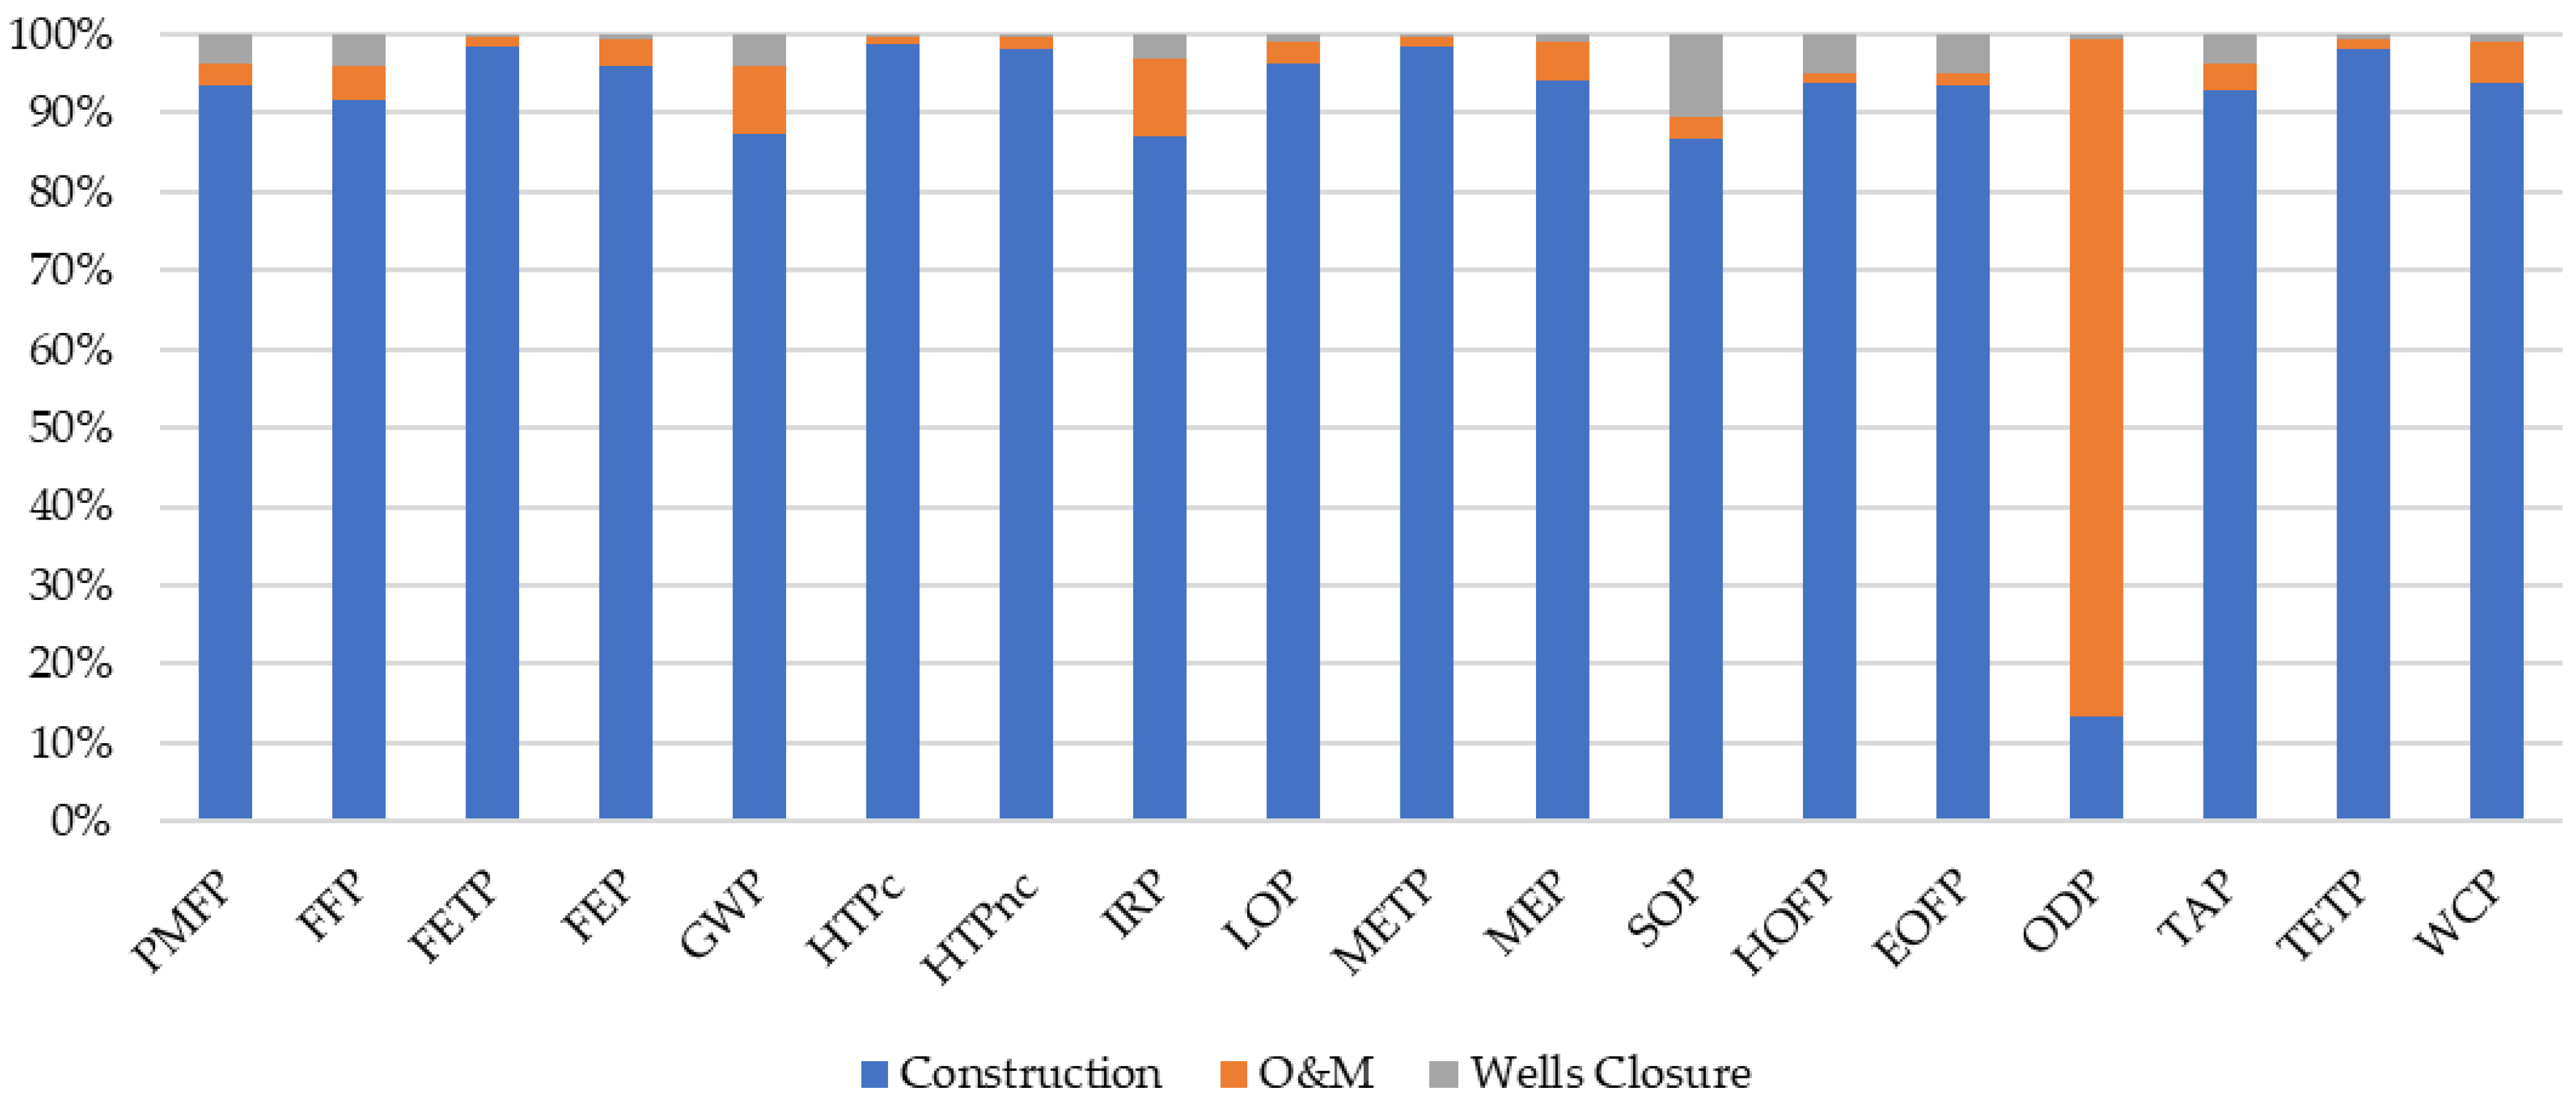
An analysis of the contributions for each category of the ReCiPe midpoint 2016 methodology was performed. The contributions from the plant phases were highlighted: construction, operation and maintenance, and wells closure. Figure 2 shows how for each category the main impact comes from the construction phase, in fact it exceeds 90% of the impacts for all categories excluding GWP, IRP, SOP, and ODP. For GWP, IRP, and SOP, it covers a very considerable percentage, about 85–87%, whereas for ODP it is restricted to 12%. Furthermore, for ODP there is a different trend, in fact, the operation and maintenance phase is the most impactful phase, covering about 85% of impacts due to the use of organic working fluid. The well closure phase covers a very low percentage for all categories, reaching a maximum of 10% for SOP.
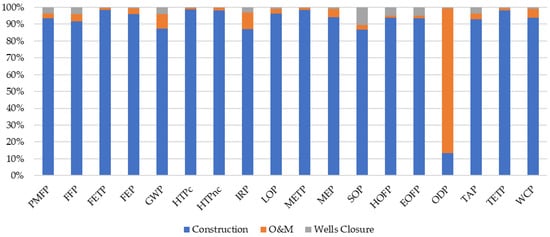
Figure 2.
Qualtra contribution analysis macroprocesses (phases).
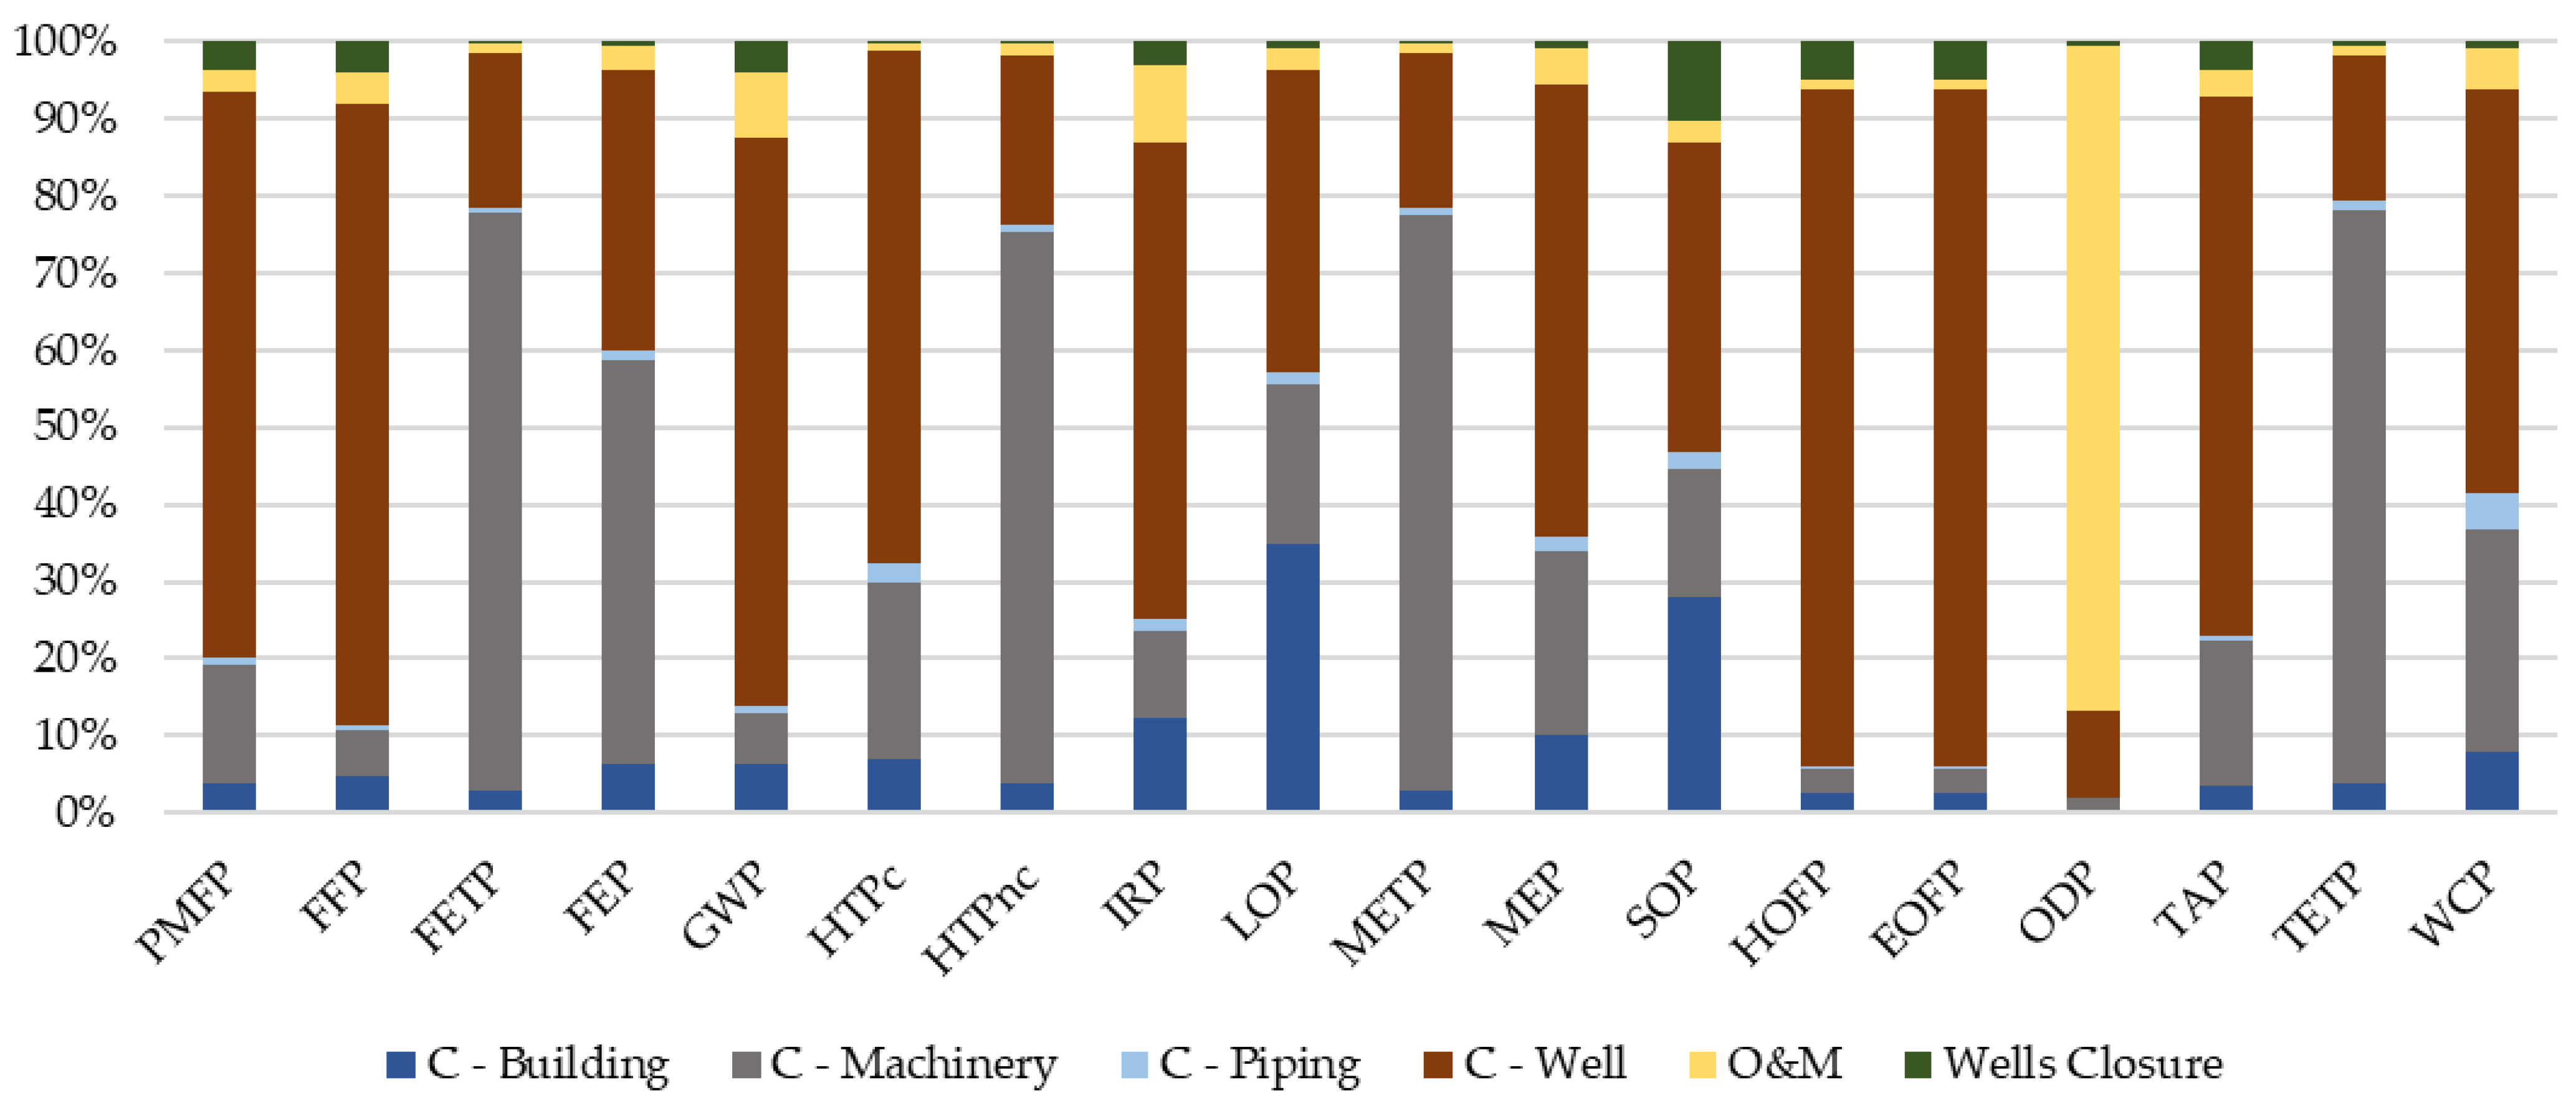
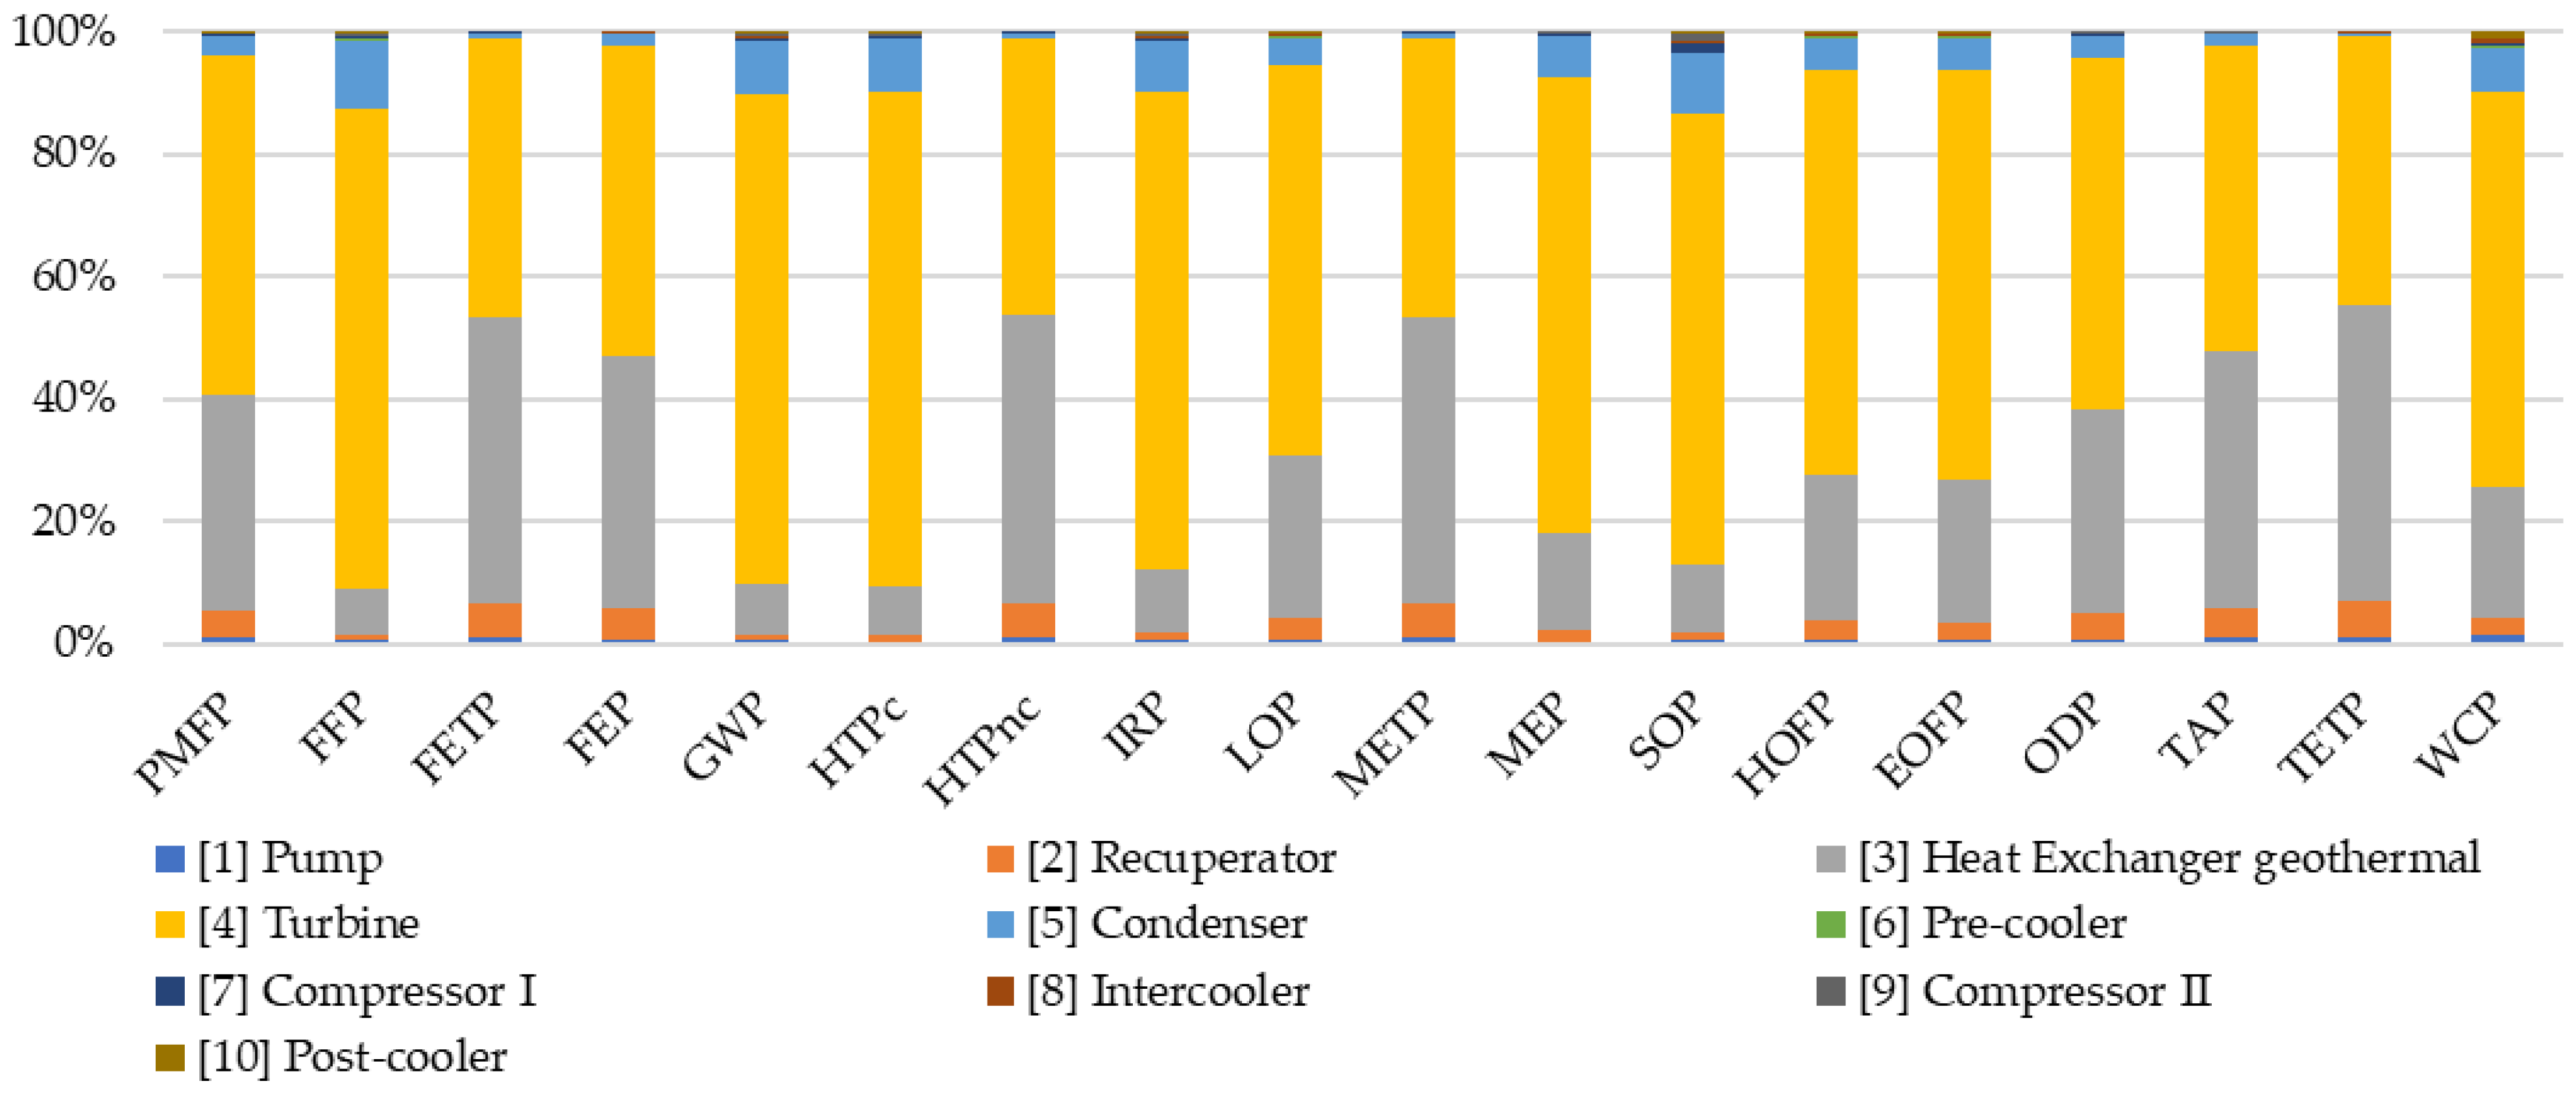
Given the high impact of the construction phase, all processes involved in this phase were examined in more detail; a synthesis is presented in Figure 3. The general trend for each category, excluding ODP, is that the impact from the construction phase is mainly attributable to the construction of the wells and the mechanical components of the power plant. In particular, the realization of wells causes the greatest impacts for categories HOFP and EOFP (87.5%), categories PMFP, FFP, and GWP (73–80%), and categories HTPc, IRP, MEP, and TAP (59–69%). Similarly, some categories are characterized by the impact of machinery, like FETP, HTpc, METP, and TETP (71–74%). For the FEP category, power machinery covers about 52%, and for the other categories, like HTPc, LOP, MEP, SOP, TAP, and WCP, 15–28%. The building process does not produce an important impact except for the IRP, LOP, MEP, and SOP indicators where it is responsible for, respectively, 12.2%, 34.8%, 10.1%, and 27.8% of the impact. For all categories, the piping process is almost irrelevant, covering about 0.7–4.8% of the total impacts.

Figure 3.
Qualtra contribution analysis in subprocess (C = construction phase).
A contribution analysis was also carried out referring exclusively to the power cycle components of the system for all category indicators. Figure 4 shows that the main impact of machinery is the turbine, which is responsible for most of the impacts for all categories going for 90% for FFP, GWP, and HTPc and about 82–85% for MEP and SOP. For all other indicators it covers more than 50% of the impacts except for FETP, HTPnC, METP, and TETP, for which it covers about 43–45%. The second element in terms of environmental impacts is the main heat exchanger, which covers a significant percentage for the categories of PMFP, FETP, FEP, HTPnc, METP, ODP, TAP, and TETP, covering about 33–46%. The condenser also has a considerable impact—about 8–11% for some categories: FFP, GWP, HTPc IRP, and SOP. Finally, the recuperator is responsible for 5–6% of the impacts for the categories of FETP, FEP, HTPnc, METP, TAP, and TETP. All other mechanical elements have minimal impacts compared to the total.

Figure 4.
Qualtra contribution analysis—power equipment.
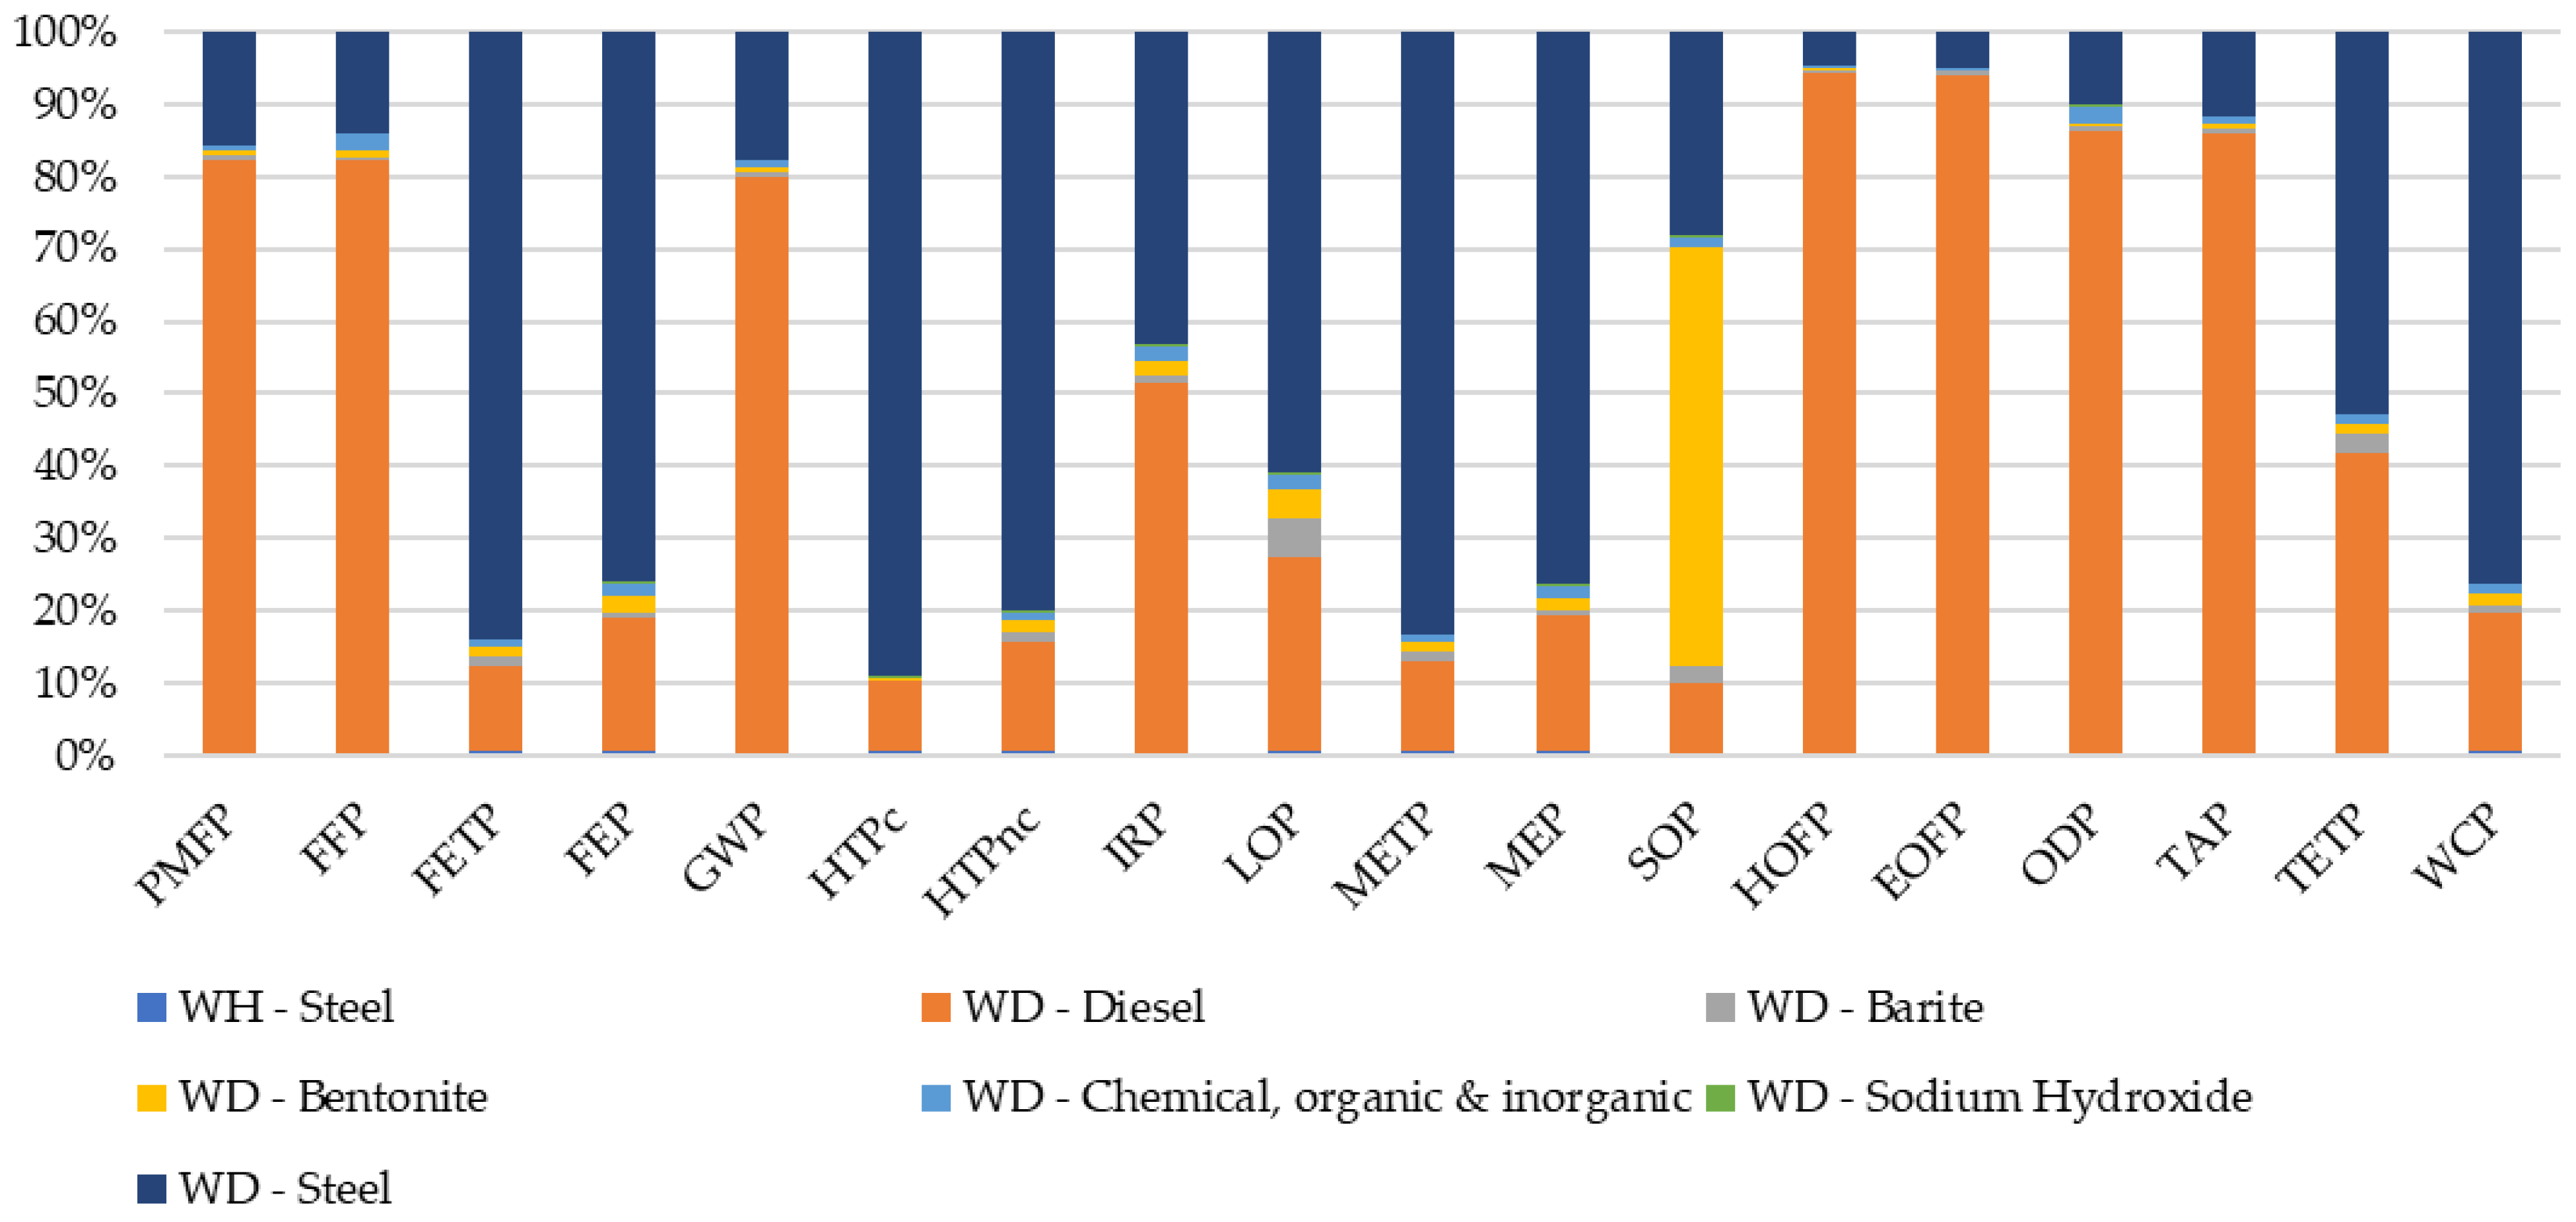
The analysis of the contributions of the well process was finally carried out to highlight how the environmental impact is distributed. Figure 5 shows two different well processes: well drilling (WD) and wellhead (WH). First, it is shown that the materials used for WH cover a negligible percentage of impact for all categories. As a second fact, the picture shows us that the environmental impacts can only be attributed to two contributions, that of the casing steel and the diesel consumed in the drilling phase. In particular, diesel consumption has a substantial impact on the categories of PMFP, FFP, GWP covering about 80%, and even more considerably for HOFP, EOFP, ODP, and TAP which impacts about 86–94%. For other indicators it covers smaller percentages such as 50% and 40% for IRP and TETP, respectively, or even smaller but still considerable for LOP, WCP between 18 and 26%. In contrast, casing steel has a significant impact on the FETP, FEP, HTPc, HTPnc, METP, MEP, and WCP categories, for which it accounts for approximately 77–88% of the impacts. For the categories of IRP, LOP, and TETP, it covers smaller, but still considerable percentages between 45 and 58% of impacts. The only exception is shown in SOP, where bentonite covers about 58% of the total category.

Figure 5.
Qualtra contribution analysis wells (WH = wellhead; WD = well drilling).
2.4. Building the Single Score—Qualtra
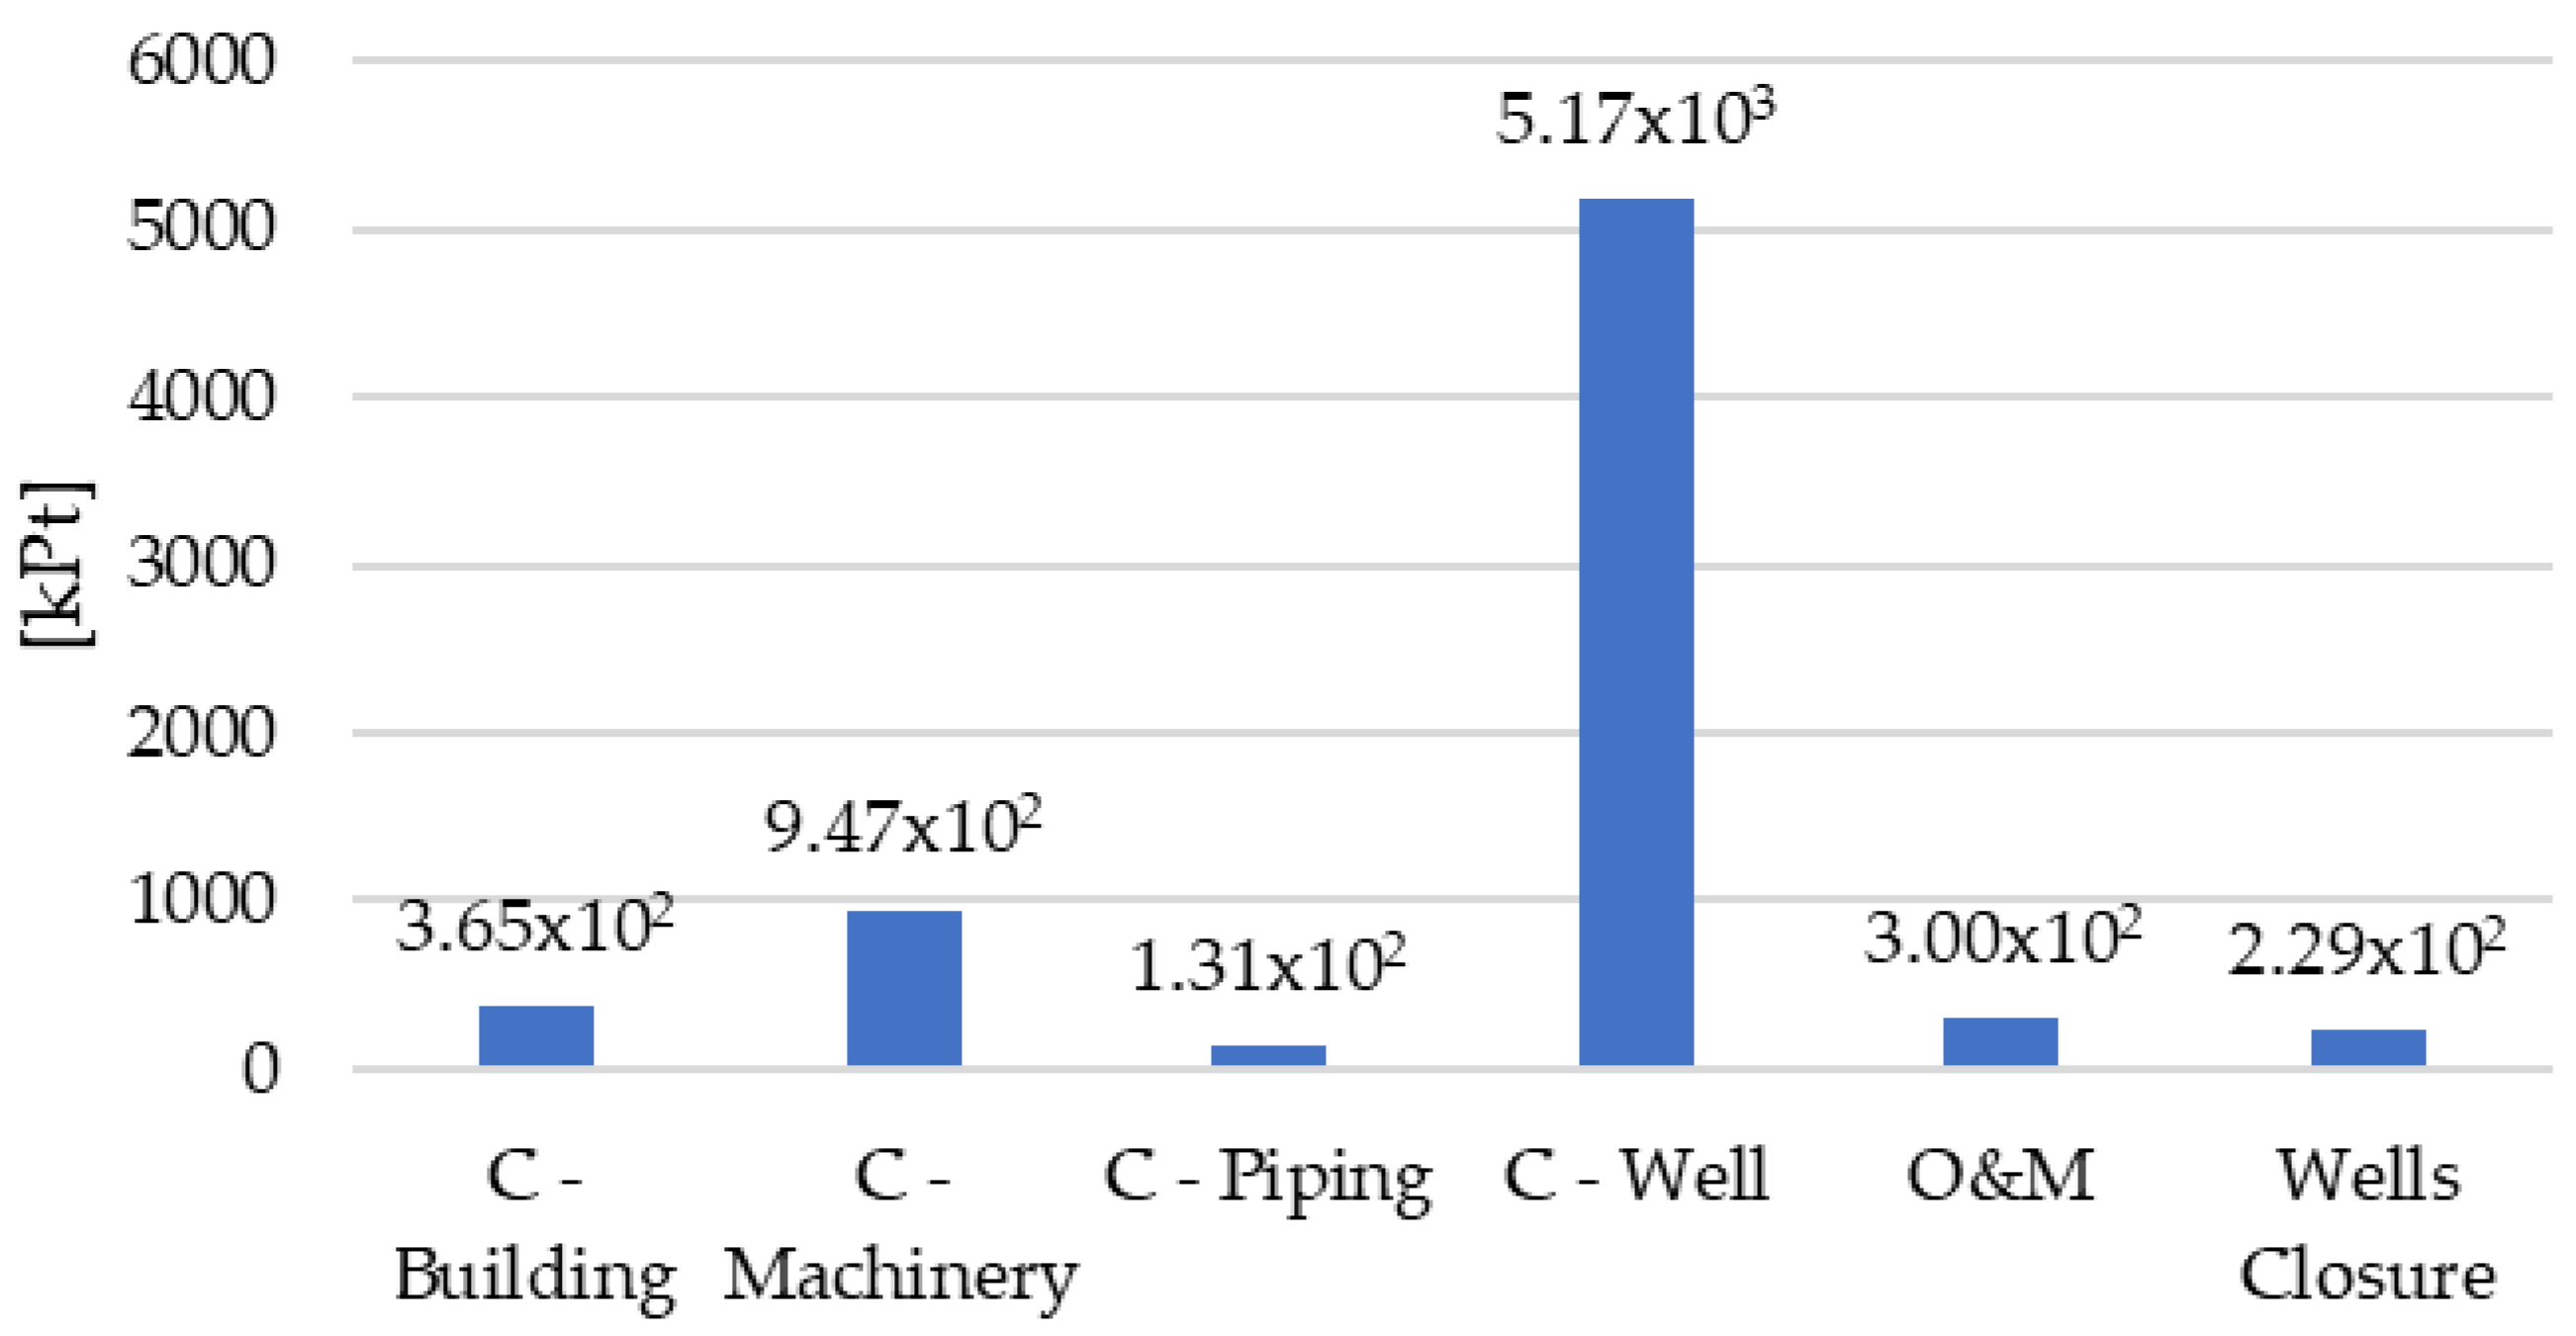
This step is not mandatory by the ISO 14040 and ISO 14044 standards [9,10], but it is necessary for the subsequent exergo-environmental analysis. To perform the calculation of the Single Score, the ReCiPe 2016 endpoint methodology is applied. In this stage, the evaluation of these indicators hasn’t been delved into deeply, as the environmental analysis was conducted at the midpoint level. Endpoint indicators were only appraised as a requisite step to quantify the single score in the ReCiPe methodology. Thus, the results obtained from endpoint indicators must be first processed with the normalization and weighting sets. The resulting single score represents a cumulative indicator representative of all environmental impacts. The following Figure 6 shows the single score split into the processes that constitute the whole Qualtra power plant. As the plant will operate on a completely closed loop and will need marginal flows of materials during operation (replacement of working fluid, lubricants), the construction phase is dominating. The sum of all the processes for plant construction results in an overall lifetime impact of 7.14 × 10³ kPt. As is shown, the impact that dominates the single score is the realization of wells, which covers 72.4% of the single score. The other processes cover much smaller percentages, such as machinery and building, amounting to 13.3% and 5.1%, respectively; all others are below 5%.
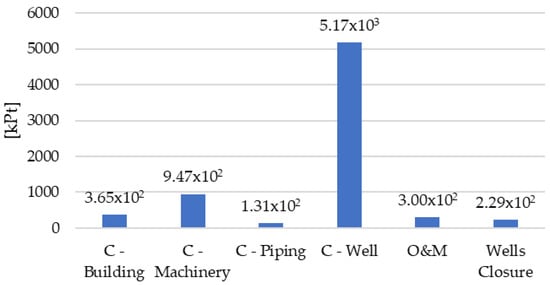
Figure 6.
Qualtra single score (ReCiPe 2016 endpoint) subprocess (C = construction phase).
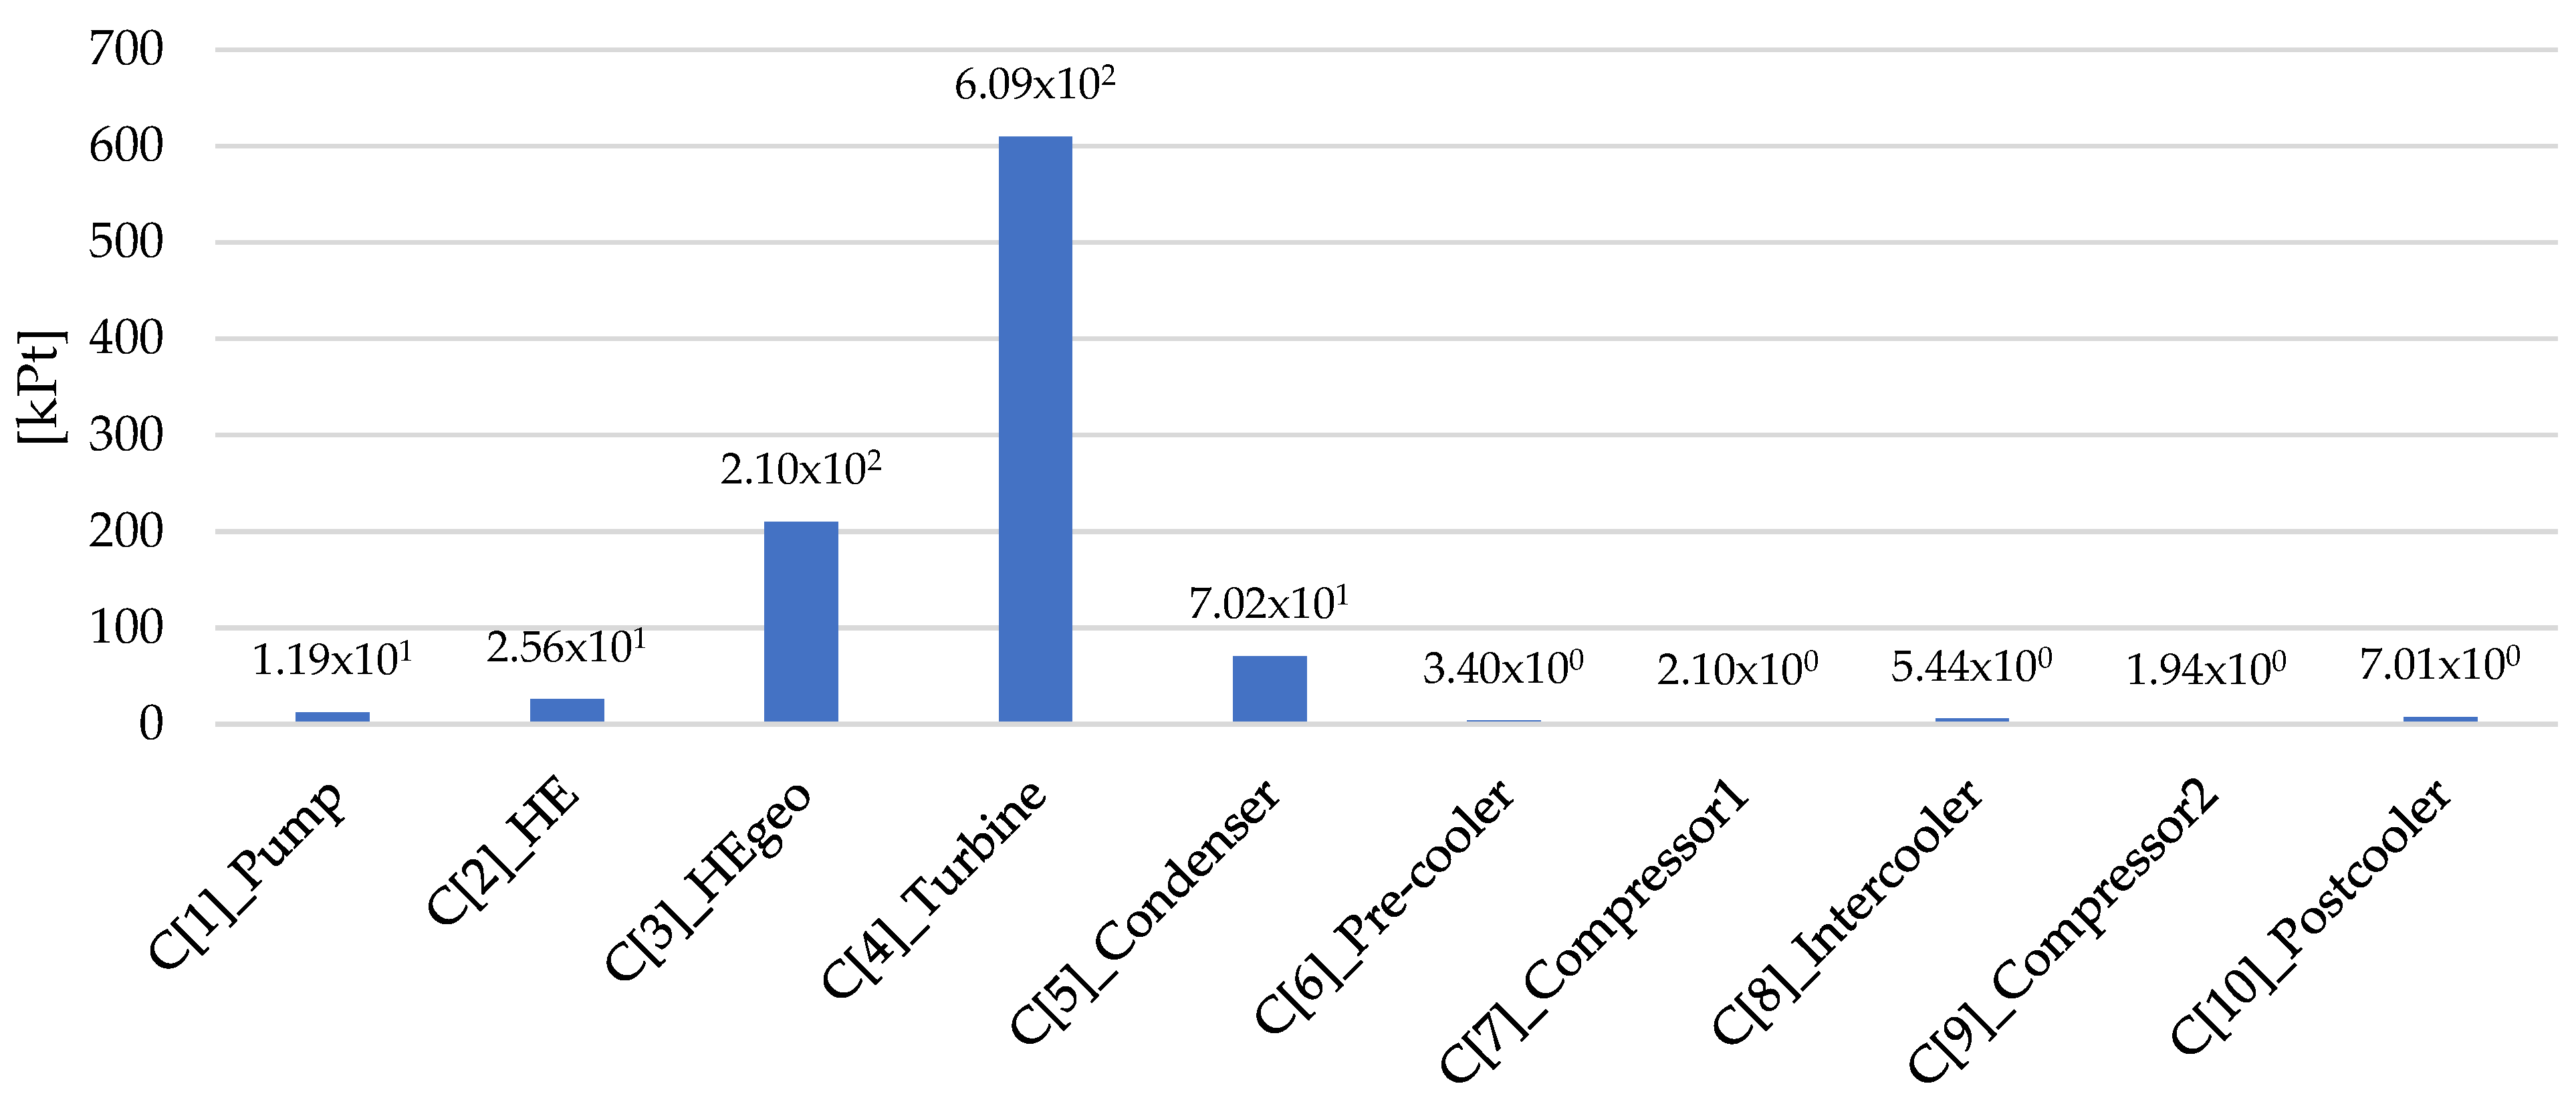
The power cycle components deserve a more detailed breakdown as they will be analyzed in detail in the following exergo-environmental analysis. Environmental impact is the last result to be obtained from the LCA. The environmental cost expressed in kPt is shown in Figure 7; the highest environmental cost is attributable to the turbine (64.3% of the environmental cost of power machinery). Two other elements have a significant impact, the geothermal heat exchanger (C[3]_HEgeo) and the condenser, which, respectively, account for 22.18% and 7.42%. All other elements have an environmental cost of no more than 2% of the total cost of machinery.
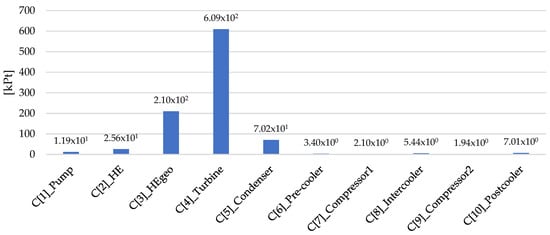
Figure 7.
Single score results—power plant components.
3. Exergy Analysis
Exergy is employed as an indicator for the capability of a material or energy flow’ to perform work through interaction with the external environment [14,15]. It has been used in numerous instances as a metric for geothermal energy systems that simultaneously produce heat and power [16]. To assess the most dissipative step in electricity generation from a geothermal system, an exergy analysis is performed under the assumption of steady-state conditions. The equation of physical exergy is the governing equation for exergy exchanges within the system and is defined for each stream as follows:
where is the mass flow rate; and are, respectively, its enthalpy and entropy, at the stream j or the stream 0. The latter represents the equilibrium state that is characterized by the reference temperature and pressure po.
In exergy analysis, a component-level approach is applied [17,18]. The following balance states that the exergy of the fuel of a component k must be equal to that produced, plus all the destructions (D) and losses (L):
Furthermore, standard key performance parameters indicating the system’s performance are defined: the component exergy efficiency (3), the exergy destruction ratio (4), and the overall exergy efficiency of the entire system (5), which can also be re-checked using an indirect approach (6).
In the context of heat conversion and specifically in the case of geothermal energy, the primary exergy input into the system is the heat drawn by the fluid from the reservoir rock, characterized by its corresponding temperature level. This can be assessed by considering the Carnot factor based on the rock temperature:
The proposed formulation in Equation (7) for defining the exergy input suggests that the exergy destruction within the well encompasses pressure losses (across pipes and the porous reservoir), as well as the irreversibility associated with heat transfer between rocks and brine. is assessed from the enthalpy balance between the brine streams at re-injection and production wellheads, while can be determined as the temperature of the fluid at the origin of the production well.
Exergy Analysis Qualtra
Table 5 shows the list of components and their numbering (red numbers in Figure 1; streams are numbered in black).
Table 5.
Components of Qualtra power plant.
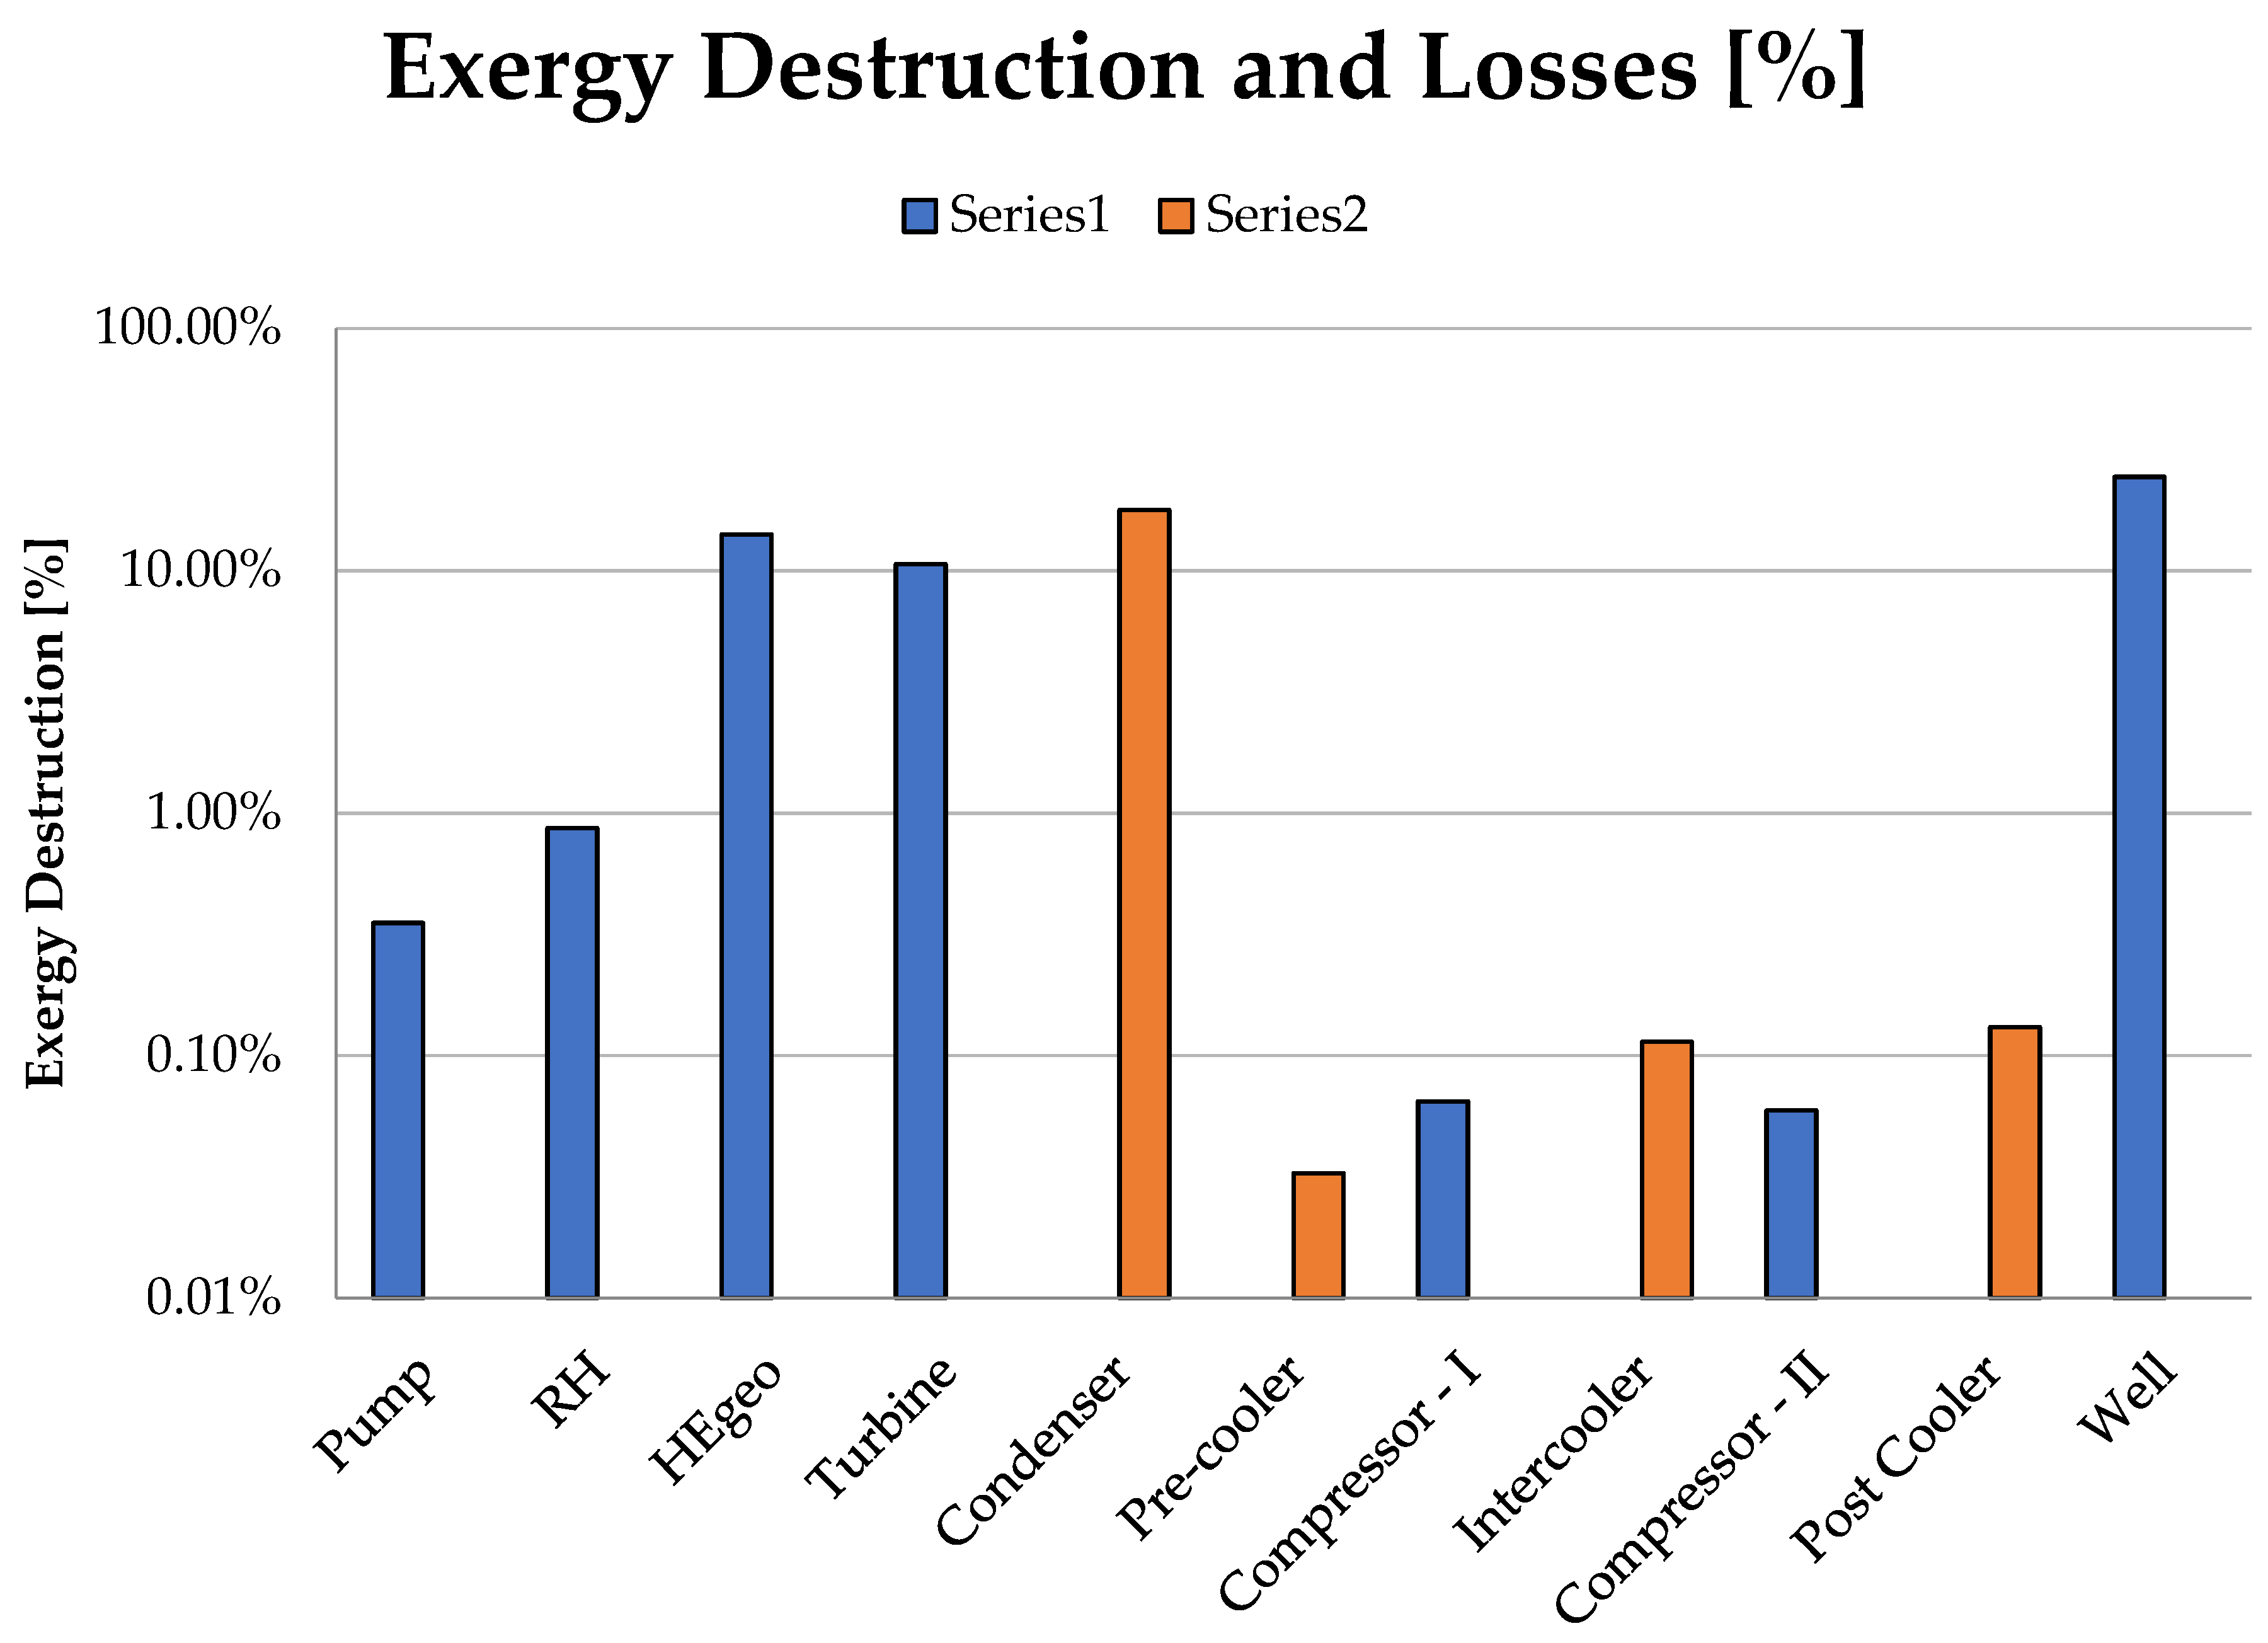
Figure 8 depicts the outcomes of the Qualtra power plant’s exergy analysis. It reveals that the geothermal wells system stands out as the component causing of most exergy destruction. Other notable contributors to exergy losses are the HEGeo, the turbine, and the RH.
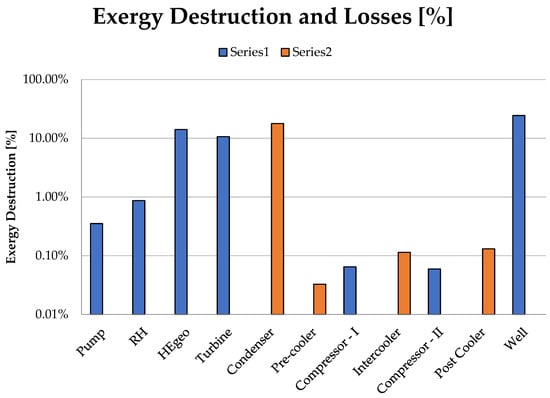
Figure 8.
Exergy destruction and losses for each component.
The total geothermal exergy input amounts to 36 MW, generating an exergy output of 10 MW (electricity). Consequently, the plant exhibits an exergy efficiency of 28%, with significant dissipation primarily linked to the wells. This dissipation represents the losses in the heat transfer from the rocks to the geothermal fluid and in the extraction process of the brine and is numerically linked to the value of the Carnot efficiency in Equation (7). If the wells are excluded, the exergy efficiency of the overall plant reaches 37%.
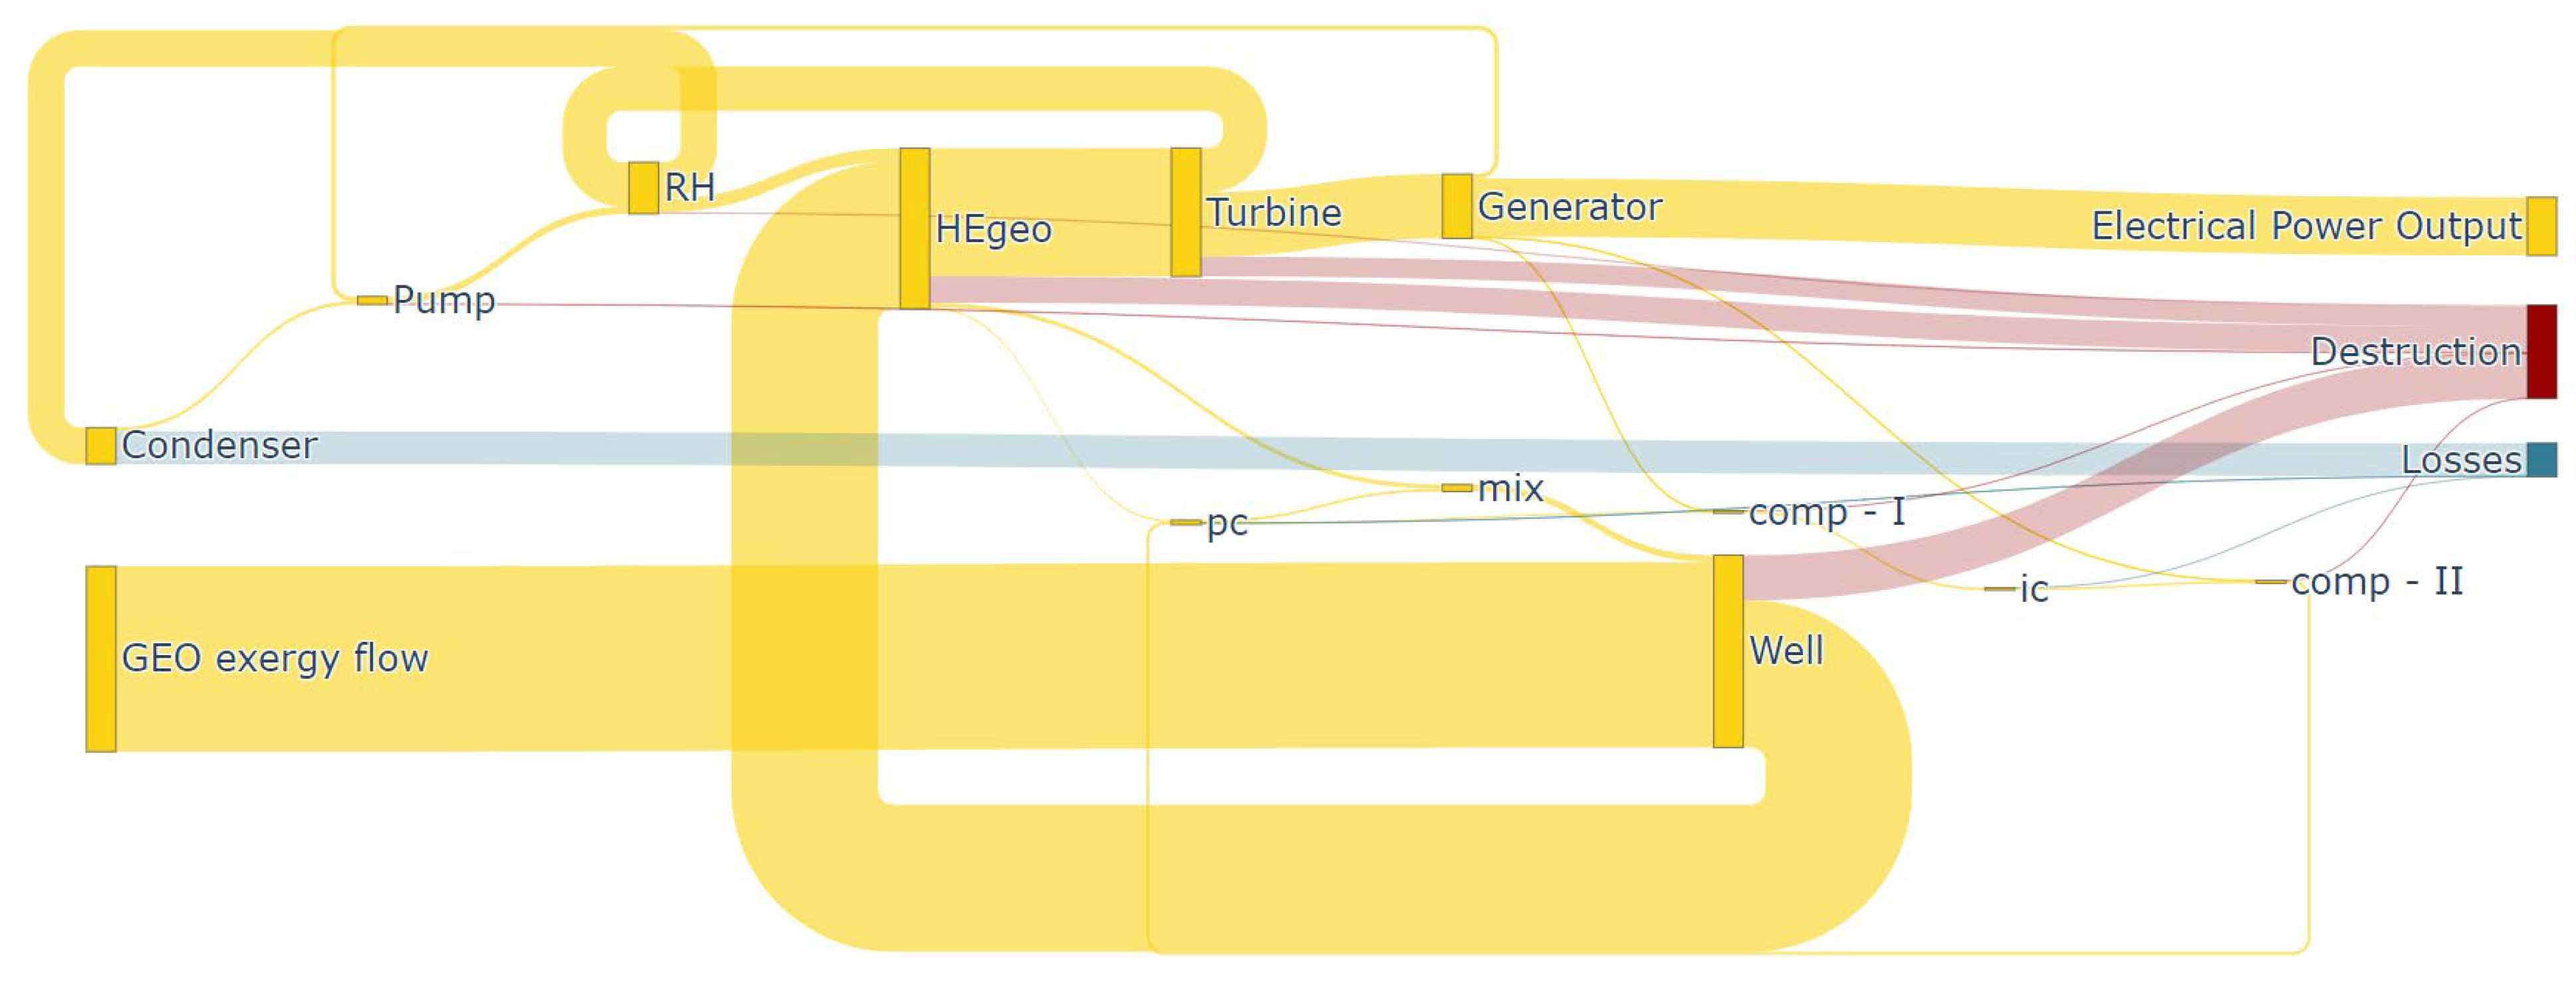
From the Sankey diagram in Figure 9, it is possible to individuate the relative share of exergy conversion in electricity, destruction, and loss. The cumulative exergy destruction of the power plant determines a large share of the plant inefficiencies, and there is also a relevant exergy loss at the condenser. A considerable part of the inlet exergy is recirculated to the geothermal reservoir through the re-injection wells, as a consequence of the prevention of environmental risks (micro-seismicity) and of avoiding scaling and corrosion.
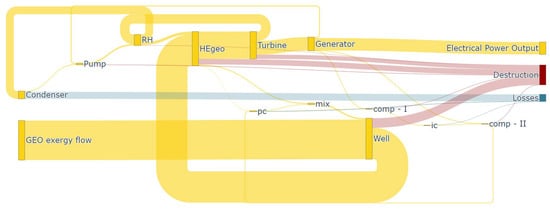
Figure 9.
Sankey exergy conversion diagram. Color code: yellow = standard exergy fluxes, red = exergy destruction, blue = exergy losses. The thickness of the connecting lines is proportional to the exergy flux (in kW).
4. Exergo-Economic and Exergo-Environmental Analysis
The exergo-economic analysis (EEA) is a method that evaluates the performance and economic efficiency of individual components. This is achieved through a cost balance that considers the costs associated with the exergy produced, the fuel utilized, and the overall investment. Auxiliary equations are introduced to handle the complexity arising from the number of exergy streams, and the cost of exergy destruction for each component is calculated [17]. The whole system is modeled through the cost balance of each component, considering the product and fuel costs, as well as the investment, according to the scheme in Figure 10.
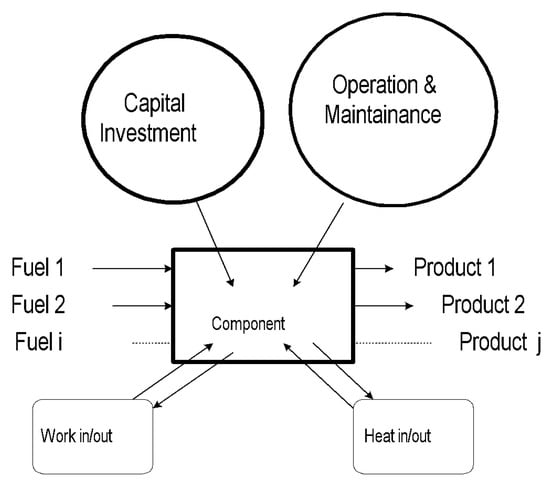
Figure 10.
Schematic of k-th component.
Equations (8) and (9) describe the component economic balance: and are expressed in terms of €/s and represent the cost associated with the exergy of the component product and fuel; they are calculated from the product of and (costs per exergy unit of product or fuel) by their respective exergy flows in kW. A mathematical model is formed where there are unknowns equal to the number of exergy streams and is composed of equations from the exergy balance and the auxiliary Equation (10), provided by the SPECO approach [18]. Moreover, additional parameters characterizing exergy performance can be established, such as fk (11), which delineates the origin of the component’s cost, distinguishing between exergy destruction and the cost of the investment itself. Similarly, the relative difference rk in economic cost between the product and fuel flags a notable increase in cost across the components (12). The fundamental description of the methodological approach can be found in [19].
The exergo-environmental analysis (EEvA) [20,21] employs an approach similar to that of the exergo-economic analysis but replaces conceptual economic costs with a singular indicator of the component environmental performance. This approach requires detailed LCA calculations for each k-th component. From the point of view of LCA, EEvA necessitates the application of a normalized and weighted single score for each component, typically expressed as ecopoints. This single score acts as a substitute for the capital cost in the exergo-economic analysis (EEA), taking into consideration the resource intensity inherent in each component.
EEvA allows for a comprehensive assessment of the environmental impact of each component within a system. The use of ecopoints provides a standardized unit, facilitating the comparison of the environmental performance across various components. This approach not only enables the identification of components with the most significant environmental impact but also allows for the prioritization of mitigation efforts.
In the scope of this analysis the exergo-economic and exergo-environmental analyses have been performed with an in-house developed tool [22].
4.1. Exergo-Economic Results Qualtra
The overall specific investment cost for the power plant was calculated at 1398 €/kW. The final production cost of electricity was 9.4 c€/kWh, which is justified by the size of the plant (10 MWe) and by the implementation of the total re-injection concept.
Table 6 summarizes the key exergo-economic parameters calculated for the Qualtra power plant. First of all, for each component, the purchase equipment cost (PEC) was reported [17]. Notably, the components with a substantial economic impact, influenced by both exergy destruction () and the capital cost () are the HEGeo and the turbine, whereas for the wells the capital cost is the only contributor to the cost build-up.
Table 6.
Exergo economic results and main parameters.
The condenser emerges as the component with the highest exergy inefficiency and, consequently, the greatest economic impact (), following the wells. The turbines also exhibit a significant impact, constituting approximately 7% of the total economic impact. Within this, 22% is attributed to the capital cost (), while 78% is ascribed to exergy destruction ).
The HEGeo significantly influences the economic cost, representing 12% of the overall economic impact (). This substantial contribution is attributed predominantly to its elevated exergy destruction cost, which constitutes 63% of the total component impact cost. Thus, it becomes apparent that the power plant’s most impactful components, in terms of economic impact, are the Wells, condenser, turbine, and HEGeo, contributing 70%, 5%, 7%, and 12%, respectively, to the total economic impact.
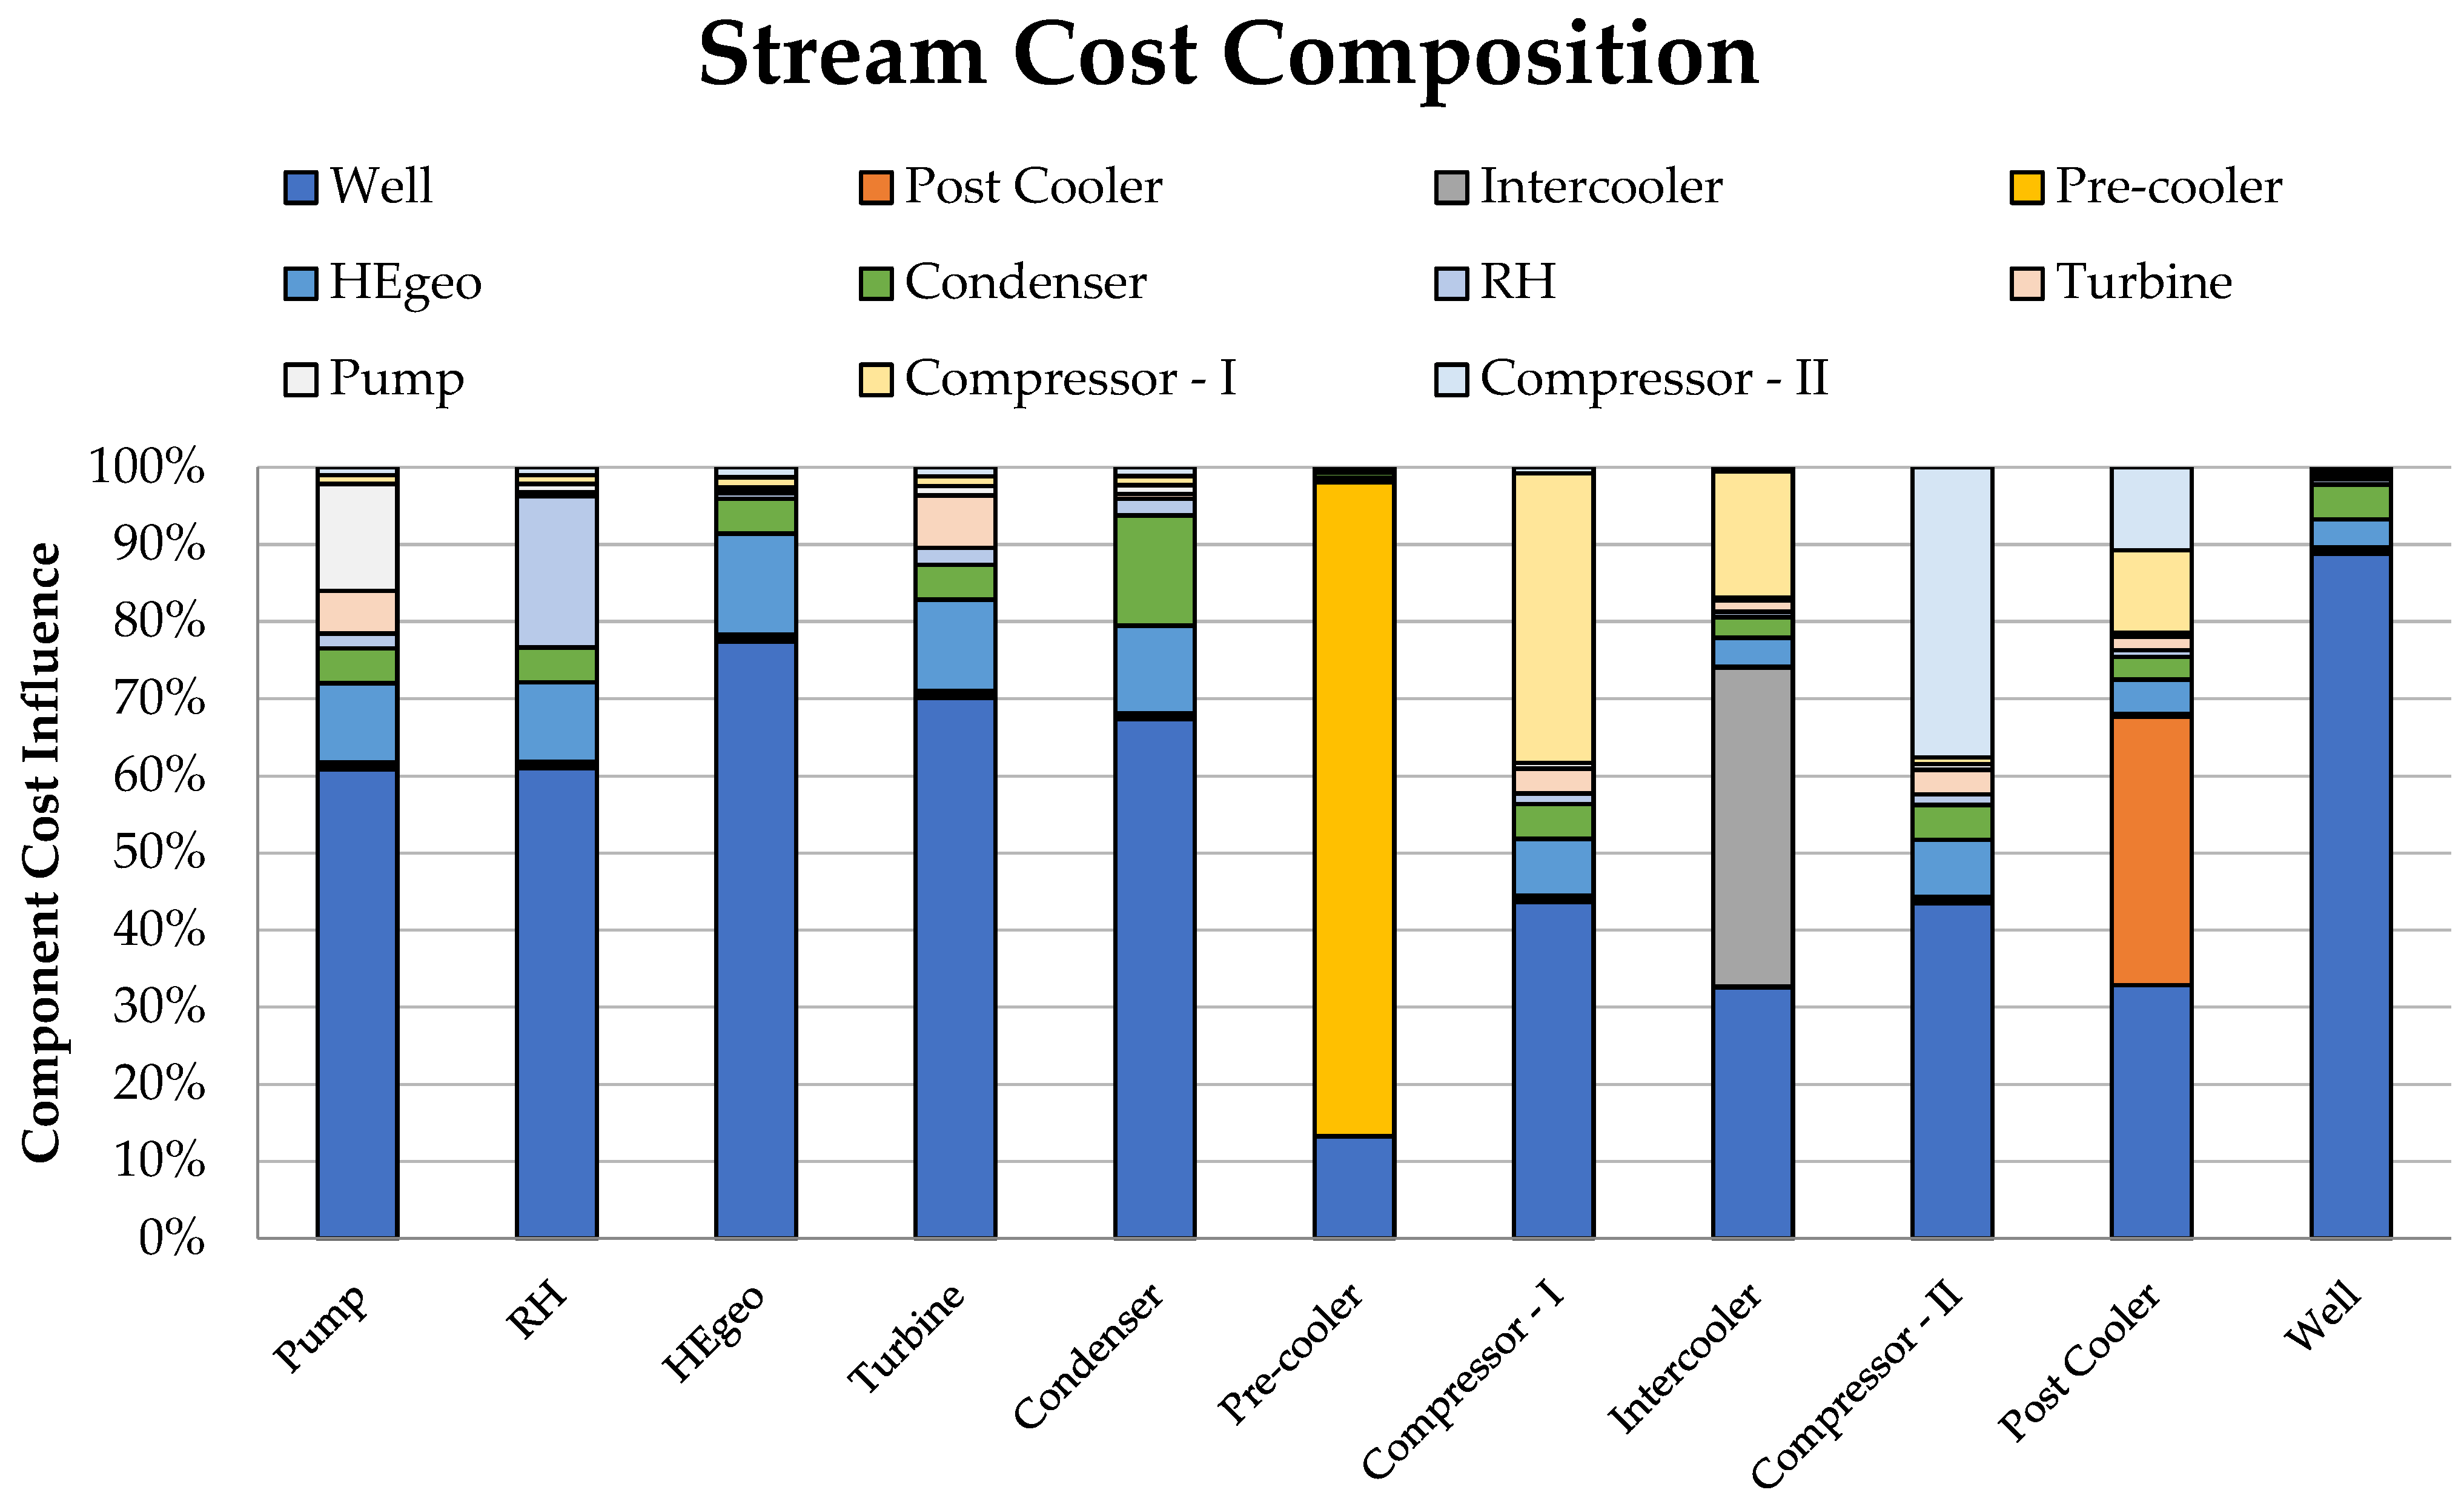
Figure 11 illustrates that the cost of the wells significantly influences almost all components of the power plant, with an external contribution exceeding 60% for all except the re-injection train components. After the well’s contribution, the HEGeo plays a substantial role in the cost structure of almost all components, while the contributions of other components proved negligible.
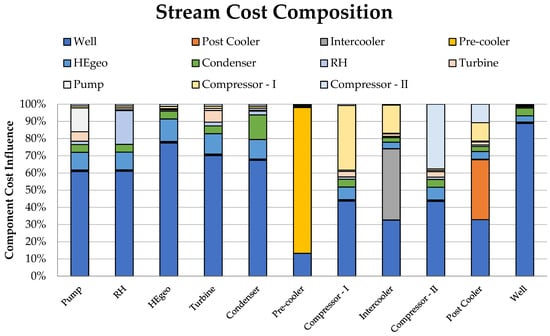
Figure 11.
Economic stream cost contribution for each component (self and share from all others).
4.2. Exergo-Environmental Analysis Qualtra
The outcomes of the EEvA conducted for the Qualtra power plant are outlined in Table 7. When viewed from an environmental standpoint, the wells system stands out as the component with the most relevant impact, representing approximately 45% of the total impact. Other noteworthy contributors to the environmental impact are the condenser (21% of the total), the turbine (17%), and the HEGeo (14%).
Table 7.
Exergo-environmental results and main parameters.
The turbine exhibits a relatively high value of signifying that an accurate meticulous evaluation of this component is essential for potential marginal improvements in the plant’s sustainability. The overall environmental cost associated with the electricity generated by the power plant was calculated at 8.3 cPts/kWh. This notably low score is attributed to the complete avoidance of emissions (H2S, Hg, NH3, and CO2) facilitated by the fully closed-loop operation.
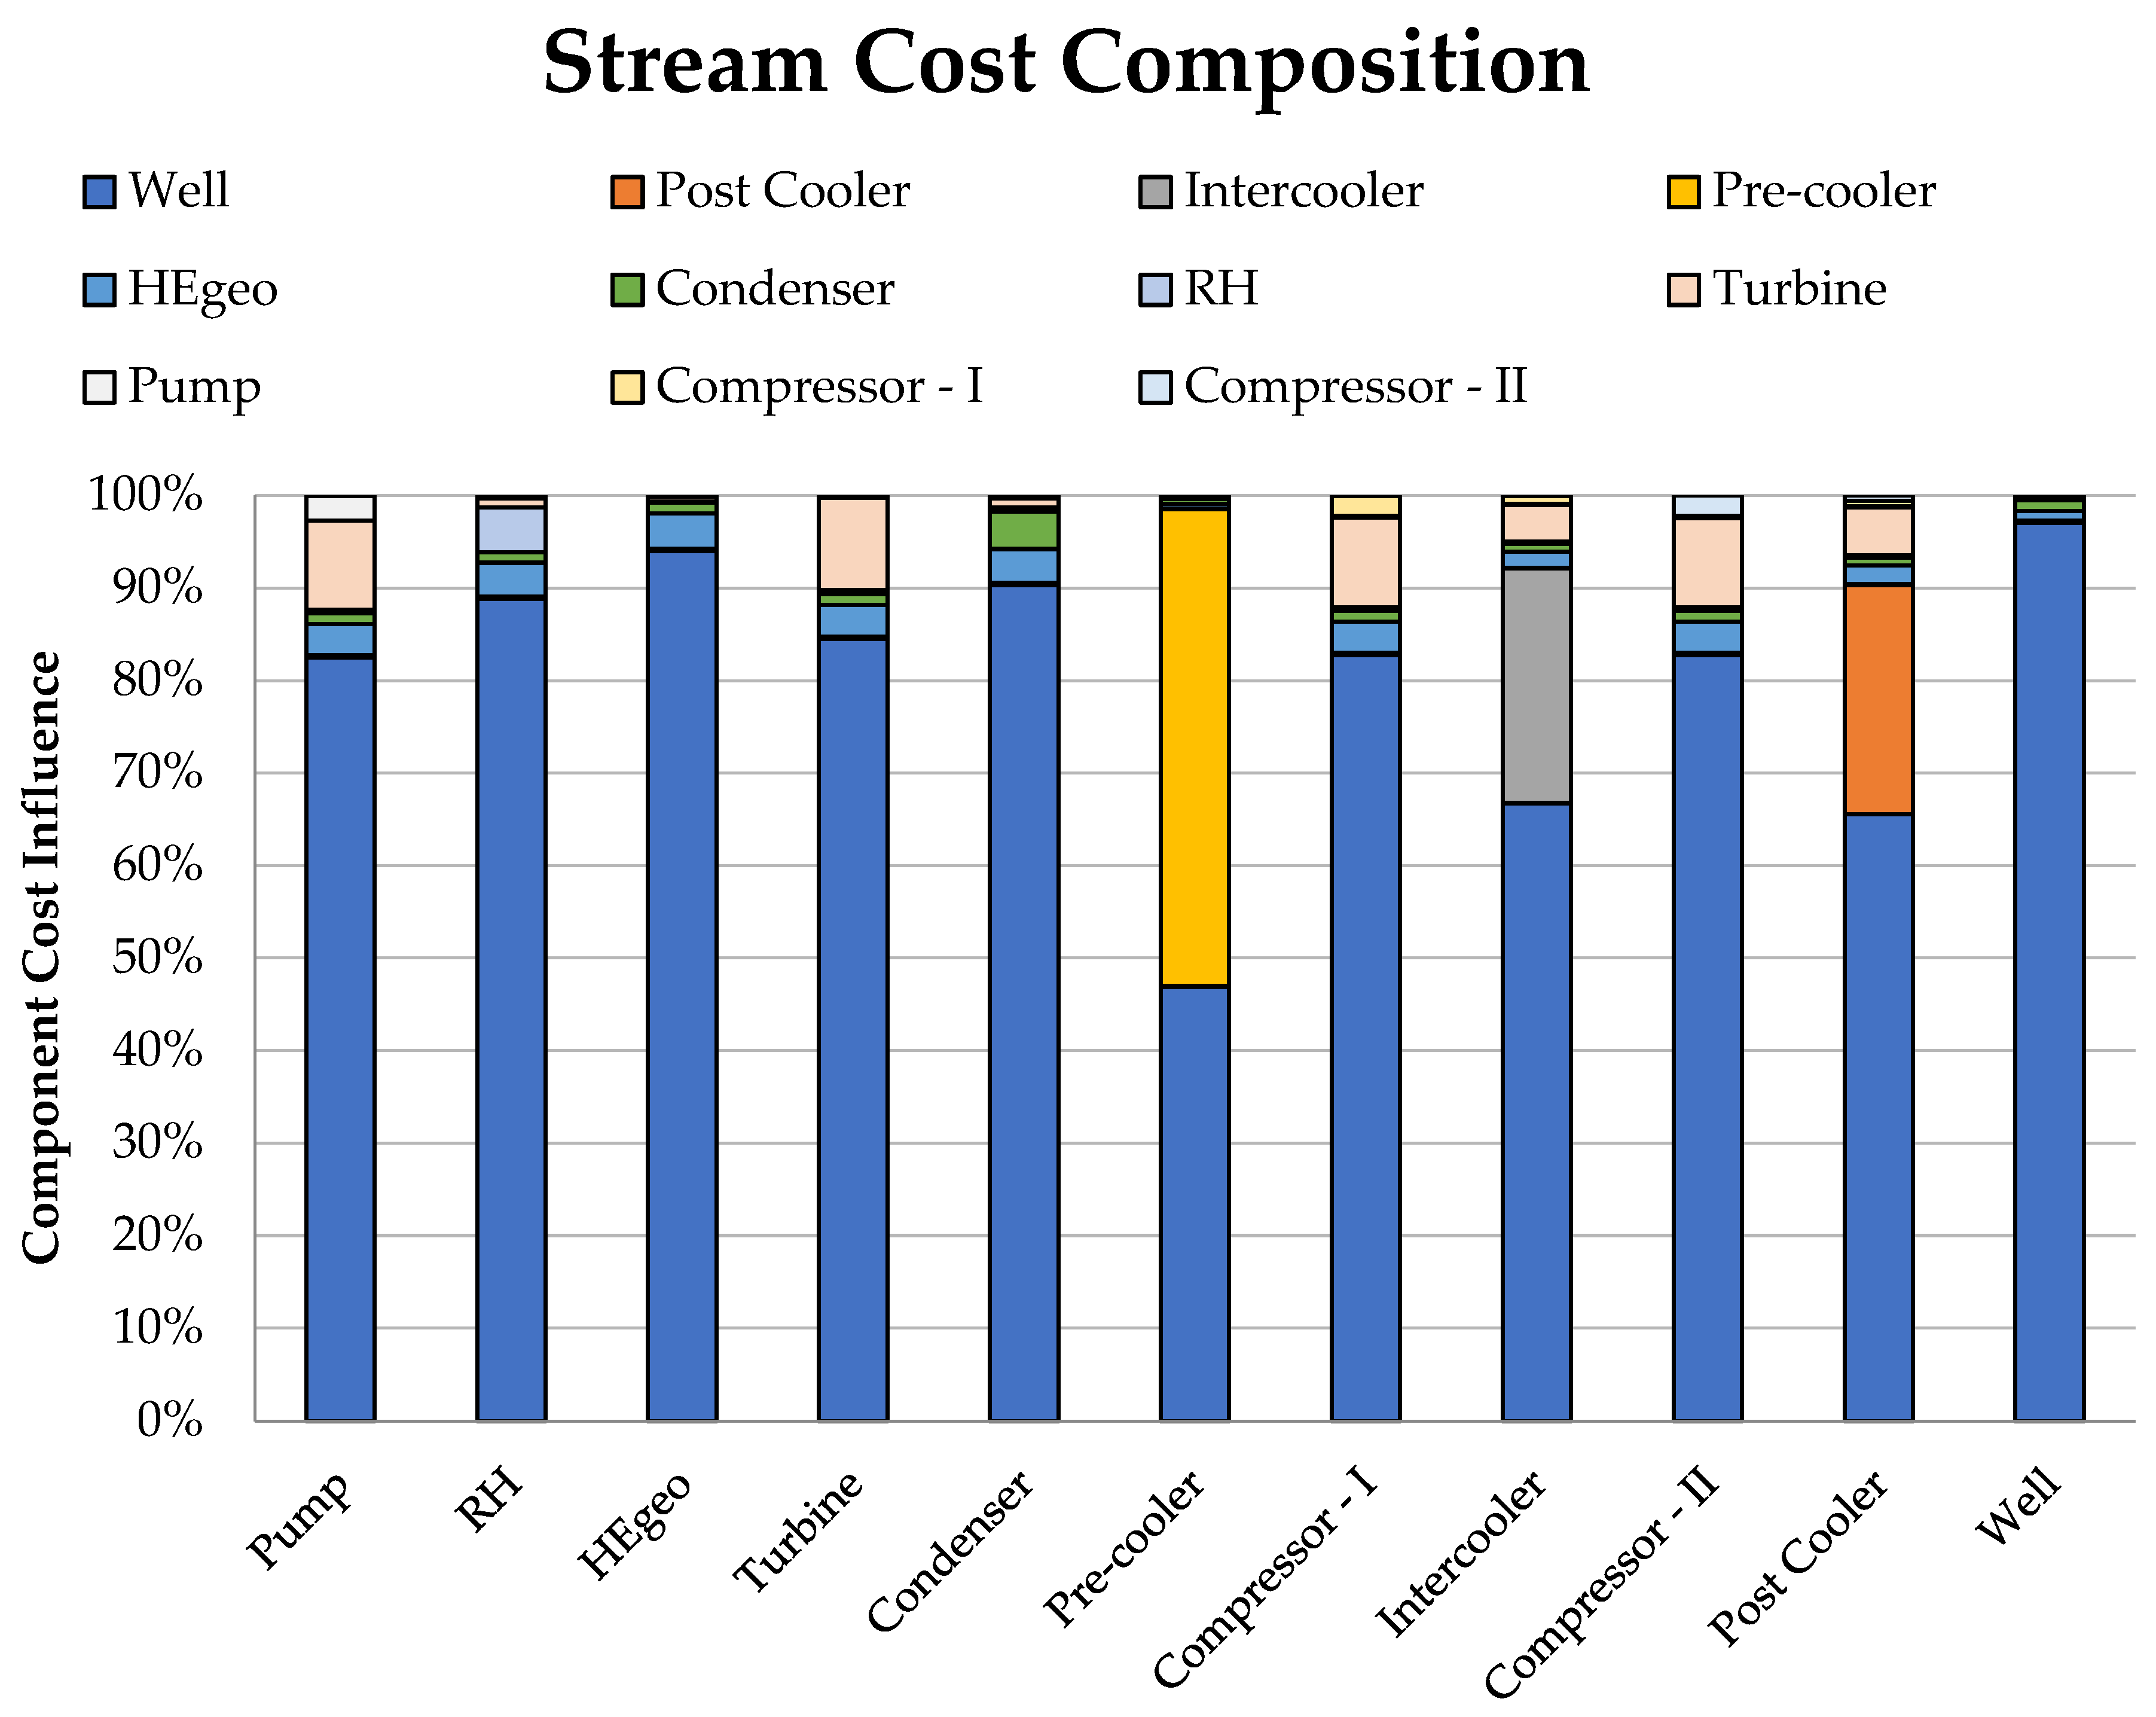
Furthermore, Figure 12 illustrates that, in a way similar to the economic analysis and consistent with other geothermal power plants, the wells contribute significantly, with contribution values surpassing 60% for all components except the pre-cooler. The cost structure of the condenser is notably influenced by its own contribution as this is a terminal, dissipative component (essential for system operation), determining by itself about 50% of the environmental cost. Lastly, the turbine has a moderate impact in terms of self-contribution, and the pump and all recompression system components contribute marginally to the environmental cost buildup.
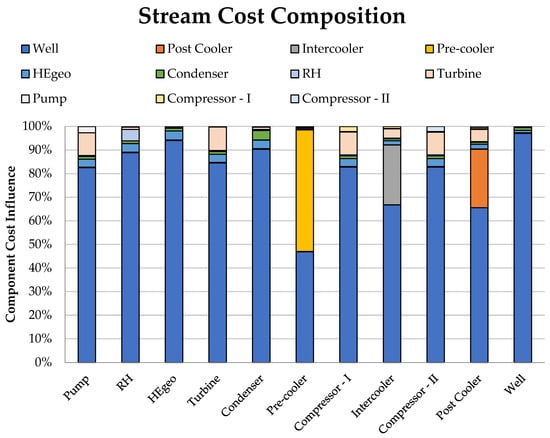
Figure 12.
Environmental stream cost contribution to each component (self and from all others).
5. Conclusions
A complete performance evaluation of the innovative Qualtra geothermal power plant was performed. Qualtra represents a new-generation, fully closed-cycle geothermal power plant, deploying the full potential of binary cycle technology and coupling it to complete re-injection of greenhouse gases, thereby determining a very low environmental impact in this specific category (6.56 g CO2 eq/kWh). Moreover, other avoided emissions (H2S and Hg) determine a very favorable profile in other relevant categories (TAP, MEP, HTP, and others), with significantly low LCA impacts (except for ODP, which is predominantly influenced by working fluid losses during the operations and maintenance phase). The main contribution stems from the well drilling activity for most environmental indicators at the midpoint.
The thermodynamic performance was assessed through the application of an exergy analysis, including the additional equipment needed for GHG re-injection. The exergy efficiency is an appreciable 28%, with most of the exergy destruction contributed by the wells, the turbine, and the main heat exchanger.
The exergo-economic analysis determined a final expected cost of electricity of about 9.4 c€/kWh. The cost of the wells emerges as the most relevant contribution, as is common in geothermal projects, followed by the power machinery (turbines) and the heat rejection equipment (condensers/cooling towers).
The exergo-environmental analysis confirmed that the drilling and construction of the wells represent the largest share of the resource/impact. Within the powerhouse equipment, the turbine emerges as both resource-intensive and contributing by the destruction of exergy (inefficiency). The main heat exchanger is the third contributor in terms of exergy destruction (irreversibility in heat transfer), while it is marginally resource-intensive. The condenser/air-cooled towers system determines an appreciable loss of exergy (a considerable release of heat to the environment, even if of low quality), which is a system effect (heat rejection is needed; passive component). The exergo-environmental analysis allows us to calculate a single score for the production of electricity (8.3 cPts/kWh); this competitive value—referring to existing geothermal power plants (flash technology) or other renewables, like solar photovoltaics [11]—is a valuable result of the fully closed power plant layout.
Supplementary Materials
The following supporting information can be downloaded at: https://www.mdpi.com/article/10.3390/su16114622/s1, LCI—Power plant, LCI—Process, LCI—Machinery.
Author Contributions
Conceptualization, C.Z., P.U., D.F. and G.M.; methodology, C.Z., P.U., D.F. and G.M.; software, C.Z. and P.U.; validation, C.Z. and P.U.; formal analysis, C.Z. and P.U.; investigation, C.Z., P.U. and G.M.; data curation, C.Z. and G.M.; writing—original draft preparation, G.M. and C.Z.; writing—review and editing, G.M., C.Z. and P.U.; visualization, G.M., C.Z. and P.U.; supervision, G.M., D.F. and F.B.; project administration, G.M., D.F. and F.B.; funding acquisition, G.M., D.F. and F.B. All authors have read and agreed to the published version of the manuscript.
Funding
The present research was funded by the European Union’s Horizon 2020 Research and Innovation Program under grant agreement No 818,169 (GECO Project).
Institutional Review Board Statement
Not applicable.
Informed Consent Statement
Not applicable.
Data Availability Statement
The data used in this work are available in the Supplementary Materials, for further details contact the authors.
Conflicts of Interest
Author Fausto Batini was employed by MagmaEnergy Italia SrL. The remaining authors declare that the research was conducted in the absence of any commercial or financial relationships that could be construed as a potential conflict of interest.
Nomenclature
| b | specific environmental cost per unit exergy, EcoPoints/kJ |
| environmental cost per unit time, Ecopoints/s | |
| c | specific cost per unit exergy, €/kJ |
| cost rate, €/s | |
| e | specific exergy, kJ/kg |
| total exergy of a stream, kW | |
| f | capital intensity exergo-economic factor |
| fd | resource intensity exergo-environmental factor |
| h | specific enthalpy, kJ/kg |
| mass flow rate, kg/s | |
| r | cost increase exergo-economic factor |
| rd | impact increase exergo-environemntal factor |
| s | specific enthalpy, kJ/(kgK) |
| T | temperature, K |
| y | exergy destruction ratio |
| LCA impact rate of a component, Ecopoints/s | |
| Component Capital + Operation and Maintenance levelized cost rate, €/s | |
| ¦Å | component or system exergy efficiency |
| Subscripts: | |
| o | reference environment |
| d | direct |
| D | Destruction |
| e | outlet (exit) |
| F | Fuel |
| in | inlet |
| ind | indirect |
| k | k-th component |
| L | Loss |
| P | Product |
| Res | Resource |
| Rock | Hot Rock reference |
| Acronyms: | |
| GHG | Greenhouse Gases |
| GPP | Geothermal Power Plant |
References
- Leontidis, V.; Niknam, P.H.; Durgut, I.; Talluri, L.; Manfrida, G.; Fiaschi, D.; Akin, S.; Gainville, M. Modelling reinjection of two-phase non-condensable gases and water in geothermal wells. Appl. Therm. Eng. 2023, 223, 120018. [Google Scholar] [CrossRef]
- Marieni, C.; Voigt, M.; Clark, D.E.; Gíslason, S.R.; Oelkers, E.H. Mineralization potential of water-dissolved CO2 and H2S injected into basalts as function of temperature: Freshwater versus Seawater. Int. J. Greenh. Gas Control 2021, 109, 103357. [Google Scholar] [CrossRef]
- Karlsdóttir, M.R.; Palsson, O.P.; Pálsson, H.; Maya-Drysdale, L. Life cycle inventory of a flash geothermal combined heat and power plant located in Iceland. Int. J. Life Cycle Assess 2015, 20, 503–519. [Google Scholar] [CrossRef]
- Paulillo, A.; Striolo, A.; Lettieri, P. The environmental impacts and the carbon intensity of geothermal energy: A case study on the Hellisheiði plant. Environ. Int. 2019, 133, 105226. [Google Scholar] [CrossRef] [PubMed]
- Heberle, F.; Schifflechner, C.; Brüggemann, D. Life cycle assessment of Organic Rankine Cycles for geothermal power generation considering low-GWP working fluids. Geothermics 2016, 64, 392–400. [Google Scholar] [CrossRef]
- Frick, S.; Kaltschmitt, M.; Schröder, G. Life cycle assessment of geothermal binary power plants using enhanced low-temperature reservoirs. Energy 2010, 35, 2281–2294. [Google Scholar] [CrossRef]
- Pratiwi, A.; Ravier, G.; Genter, A. Life-cycle climate-change impact assessment of enhanced geothermal system plants in the Upper Rhine Valley. Geothermics 2018, 75, 26–39. [Google Scholar] [CrossRef]
- Parisi, M.L.; Douziech, M.; Tosti, L.; Pérez-López, P.; Mendecka, B.; Ulgiati, S.; Fiaschi, D.; Manfrida, G.; Blanc, I. Definition of LCA Guidelines in the Geothermal Sector to Enhance Result Comparability. Energies 2020, 13, 3534. [Google Scholar] [CrossRef]
- ISO 14040:2006; Environmental Management—Life Cycle Assessment—Principles and Framework. International Organization for Standardization: Geneva, Switzerland, 2006.
- ISO 14044:2006; Environmental Management—Life Cycle Assessment—Requirements and Guidelines. International Organization for Standardization: Geneva, Switzerland, 2006.
- Zuffi, C.; Manfrida, G.; Asdrubali, F.; Talluri, L. Life cycle assessment of geothermal power plants: A comparison with other energy conversion technologies. Geothermics 2022, 104, 102434. [Google Scholar] [CrossRef]
- OpenLCA 1.10, GreenDelta. Available online: https://www.openlca.org/download/ (accessed on 10 February 2021).
- Ecoinvent Database 3.6. 2020. Available online: https://www.ecoinvent.org/database/older-versions/ecoinvent-36/ecoinvent-36.html (accessed on 1 December 2020).
- Kotas, T.J. The Exergy Method of Thermal Plant Analysis; Butterworths: London, UK, 1985. [Google Scholar]
- Szargut, J.; Morris, D.R.; Steward, F.R. Exergy Analysis of Thermal, Chemical and Metallurgical Processes; Hemisphere Publishing Corporation: New York, NY, USA, 1988. [Google Scholar]
- Di Pippo, R. Second Law assessment of binary plants generating power from low-temperature geothermal fluids. Geothermics 2004, 33, 565–586. [Google Scholar] [CrossRef]
- Bejan, A.; Moran, M.; Tsatsaronis, G. Thermal Design and Optimization; Wiley: New York, NY, USA, 1996. [Google Scholar]
- Lazzaretto, A.; Tsatsaronis, G. SPECO: A systematic and general methodology for calculating efficiencies and costs in thermal systems. Energy 2006, 31, 1257–1289. [Google Scholar] [CrossRef]
- Tsatsaronis, G.; Czieszla, F. Encyclopedia of Physical Science and Technology, 3rd ed.; Academic Press: Cambridge, MA, USA, 2003; pp. 659–680. ISBN 9780122274107. [Google Scholar] [CrossRef]
- Frangopoulos, C.; Caralis, Y.C. A method for taking into account environmental impacts in the economic evaluation of energy systems. Energy Convers. Manag. 1997, 38, 1751–1763. [Google Scholar] [CrossRef]
- Meyer, L.; Tsatsaronis, G.; Buchgeister, J.; Schebek, L. Exergoenvironmental analysis for evaluation of the environmental impact of energy conversion systems. Energy 2009, 34, 75–89. [Google Scholar] [CrossRef]
- Fiaschi, D.; Manfrida, G.; Ungar, P.; Talluri, L. Development of an exergo-economic and exergo-environmental tool for power plant assessment: Evaluation of a geothermal case study. In Proceedings of the 34th International Conference on Efficiency, Cost, Optimization, Simulation and Environmental Impact of Energy Systems (ECOS 2021), Taormina, Italy, 28 June–2 July 2021. [Google Scholar] [CrossRef]

Disclaimer/Publisher’s Note: The statements, opinions and data contained in all publications are solely those of the individual author(s) and contributor(s) and not of MDPI and/or the editor(s). MDPI and/or the editor(s) disclaim responsibility for any injury to people or property resulting from any ideas, methods, instructions or products referred to in the content. |
© 2024 by the authors. Licensee MDPI, Basel, Switzerland. This article is an open access article distributed under the terms and conditions of the Creative Commons Attribution (CC BY) license (https://creativecommons.org/licenses/by/4.0/).