Article

Green Marketing and the Path to Realizing Local Sustainable Development—Joint Dynamic Analysis of Data Envelopment Analysis (DEA) and Fuzzy Set Qualitative Comparative Analysis (fsQCA) Based on China’s Provincial Panel Data

1
School of Economics and Management, Inner Mongolia University of Science & Technology, Baotou 014010, China
2
School of Management and Economics, North China University of Water Resources and Electric Power, Zhengzhou 450046, China
*
Author to whom correspondence should be addressed.
Sustainability 2024, 16(11), 4644; https://doi.org/10.3390/su16114644
Submission received: 16 March 2024 / Revised: 18 May 2024 / Accepted: 28 May 2024 / Published: 30 May 2024
(This article belongs to the Special Issue Business Models for Sustainable Consumption in the Circular Economy)

Abstract

:
Understanding the mechanisms by which the combination of green marketing components fosters local sustainable development is crucial for global regions in achieving the United Nations’ sustainable development goals. Utilizing panel data from China’s provinces from 2011 to 2022, this study employs the DEA model to assess both the static and dynamic efficiencies of sustainable development across China’s 31 provinces. Subsequently, drawing on the 6P theory of marketing element combination, this study selects human input, capital input, energy input, technological output, economic output, and ecological output as causal variables, with the local sustainable development index serving as the outcome variable. By integrating the fsQCA method, the study identifies four distinct configurations: a “single input–multiple output” model, a “multiple input–single output” model, an “input–output” linkage model, and an “input-driven” model. This conclusion can enhance the comprehension of the dynamics through which various combinations of green marketing components contribute to local sustainable development from a regional macroeconomic perspective, offering a theoretical foundation for achieving sustainable development globally.

1. Introduction

In the context of contemporary global sustainable development, environmental issues have emerged as a universal challenge confronting nations worldwide. With the conclusion of the first three industrial revolutions and the onset of the fourth, the consumption of natural resources now greatly outpaces their capacity for regeneration. This lopsided development paradigm not only jeopardizes the Earth’s ecological equilibrium but also presents a profound challenge to the sustainable progression of human society [1]. In March 2024, the United Nations Environment Programme (UNEP) published the “Global Resources Outlook 2024”, highlighting that the extraction of natural resources has tripled over the past five decades. It warns that, without intervention, by 2060, this figure is projected to rise by 60%, and the daily per capita consumption of natural resources will escalate from 23 kg to 39 kg. The carbon emissions resulting from resource consumption constitute over 60% of the total global carbon emissions [2]. As per the “State of the Global Climate in 2023” report issued by the World Meteorological Organization on 19 March 2024, carbon dioxide emissions have reached 850 billion tons, surpassing the threshold by 340 billion tons. This has led to a cascade of conflicts between nature and development, including environmental pollution, energy crises [3], and climate change issues [4].
In recent years, China’s rapid economic growth has garnered global recognition, yet it has also engendered challenges such as the climate crisis, environmental pollution, and energy scarcity. Since 1978, as the largest developing country in the world, China has pursued an extensive development model to foster swift economic growth. By 2020, the energy consumption of China’s basic materials market had surpassed 20% of the total societal energy consumption. Emissions from basic manufacturing industries reached 810 million tons, representing 9% of total societal emissions, with 71% from the service industry. It is among the industries experiencing the most rapid growth in carbon emissions in China [5]. In 2020, China’s annual electricity generation reached 7.4 trillion kilowatt-hours, marking a 2.7% increase from the previous year, while total energy consumption saw a 2.2% rise. Consequently, in 2021, China declared its “dual carbon” targets: to peak carbon dioxide emissions before 2030 and achieve carbon neutrality before 2060, with the aim of offering solutions to global environmental issues and fostering sustainable development worldwide. By the end of 2021, China’s carbon intensity had decreased by about 48.1% compared to 2005 levels, with non-fossil energy comprising 15.3% of primary energy consumption. Additionally, China’s 2022 carbon reduction commitments were met ahead of schedule. Between 2011 and 2022, China nurtured 430 specialized and advanced enterprises that produce innovative products in the domains of energy conservation and environmental protection. The output value of the energy conservation and environmental protection sector has surpassed CNY 8 trillion, with an annual growth rate exceeding 10%. Green product certification encompasses building materials, express packaging, electrical and electronic products, and plastics, with nearly 20,000 unified green product certification certificates issued. In summary, China’s endeavors towards local sustainable development demonstrate its confidence in realizing sustainable development on a global scale. China aspires to contribute a “Chinese solution” to global sustainable development.
The concept of green marketing originated in the 1970s, with its core principle being to satisfy consumer demands by promoting products and services that are environmentally friendly, as well as mitigating the adverse effects of production on the natural environment [6]. The concept of green marketing has continued to evolve over time. During the 1980s, the concept of green marketing expanded to include notions pertinent to local sustainable development, such as clean energy, energy conservation, emission reduction, green consumption, and a green economy [7]. Since the late 1990s, research in green marketing has primarily concentrated on how companies can reconcile the tension between their growth and environmental preservation, thereby fostering their own sustainable development, and has yielded a substantial body of research [8]. Most studies define corporate green marketing in terms of individual components, such as green product pricing [9], green product costs [10], eco-labeling [11], and green orientation [12]. These elements are analyzed to explain their impact on corporate sustainability. In the 21st century, the concept of green marketing has been broadened to include elements such as green customer attitudes, green customer values, green purchase intentions, and green strategic orientations [13,14]. Concurrently, set theory concepts began to be applied to green marketing research [15]. From a strategic development perspective, some scholars assert that companies can shape consumer awareness of green consumption [16], boost sales of green products, and increase profits by implementing green marketing mix strategies, thus enhancing corporate performance and achieving sustainable development [17]. Other scholars break down green marketing into elements such as green products, green pricing, green promotions, and ecological environment [18]. By comparing the effects of different element combinations on customer purchase intentions, they identify the most effective combinations and develop strategies for enterprises. These sustainable development strategies provide both theoretical and empirical support [8].
Over the past five years, as global attention has increasingly focused on localized environmental issues, scholarly interest in the impacts and contributions of green marketing on regional sustainable development has expanded. The research emphasis has shifted from micro-level corporate analyses to broader, macro-level considerations. Contemporary studies on sustainable development now integrate economic changes with environmental and social factors. For instance, N. Chaaben analyzed data on the effectiveness of implementing green marketing strategies in the Arab region. Using the green economic index to assess the efficiency of sustainable development, Chaaben identified green marketing as a critical catalyst for fostering regional sustainable growth [19]. A separate study by Ismail et al. in Tanzania revealed that green absorptive capacity mediates the relationship between green marketing orientation and regional sustainability [7]. In Brazil, Larissa Oliveira Duarte used a case study approach to investigate the organic cotton industry ecosystem. Her findings underscored the pivotal role of social green development beliefs in linking green marketing with local sustainable development [20]. These beliefs significantly enhance local awareness of green marketing initiatives and promote regional sustainability. Furthermore, Kelly E. Noonan’s research, using communities in the United States as case studies, determined that the combination of green knowledge, green businesses, and marketers positively influences the interplay between green marketing and local sustainable development [21]. These elements collectively contribute to a feedback mechanism that promotes sustainable practices at the regional level.
Despite the growing body of literature, research examining the relationship between green marketing and local sustainable development from a macro perspective remains limited and predominantly focuses on regions such as the Americas, Africa, and Central Asia. Notably, studies targeting East Asia, particularly China, on achieving local sustainability through green marketing are scarce. Therefore, this study aims to explore the impact of green marketing on regional sustainable development in China from a macro perspective. This research synthesizes green marketing theory and sustainable development theory to construct an evaluative index system. This system assesses the impact of green marketing on local sustainable development. Utilizing data from 31 provinces in China spanning from 2011 to 2022, this study analyzes how various configurations of green marketing elements can facilitate China’s pursuit of local sustainability. It is anticipated that the findings from this study will offer insights applicable to other regions, providing strategies to mitigate conflicts between human social activities and environmental conservation, ultimately contributing to broader sustainable development goals.

2. Literature Review

2.1. Green Marketing Theory

The origins of green marketing can be traced to 1976, with Hennion and Kinnear positing that it is an economic activity aimed at addressing environmental issues arising from marketing practices [22]. Peattie subsequently broadened this definition to encompass ecological green marketing, suggesting that energy companies can enhance their performance by mitigating the environmental impact of their product lines and fulfilling consumers’ green demands [23]. Within this framework, green marketing is seen as a specialized area of traditional marketing, concentrating on environmental concerns through a corporate lens [10,24]. In the 1990s, as environmental consciousness grew, green marketing emerged as a key trend in contemporary business practices. Fuller’s 1999 definition of green marketing illustrates it as a comprehensive planning and product development process, where the value realization process must (1) satisfy consumer needs; (2) fulfill corporate objectives; and (3) align with local ecological conditions [25]. This definition underscores green marketing as a vital catalyst for local sustainable development. During this era, the definition of green marketing was clarified, highlighting it as a marketing activity that meets human aspirations while minimizing environmental impact. This definition highlights that green marketing encompasses not just the green attributes of products but also a holistic business process that identifies, anticipates, and satisfies consumer and societal needs in harmony with nature, striving for economic sustainability. With ongoing development, by the 21st century, scholars worldwide had developed a more comprehensive knowledge system of green marketing. Zhu, Qingyun, and Joseph Sarkis assert that green marketing should initiate from stakeholder engagement and consider the alignment of consumer interests with the ecological environment [26]. Abbas and Jawad further stress that green marketing is a novel marketing paradigm where companies adopt the development of ecological civilization as a corporate value, aiming to fulfill consumers’ green emotional needs and deeply integrate performance with environmental considerations [27]. Throughout this evolution, the foundational principles of green marketing have also taken shape, encompassing the adaptive adjustment of products, pricing, placement, and promotion, as well as interconnections with industrial ecology, environmental sustainability, and social responsibility [28]. These principles highlight the significance of green marketing in not only concentrating on the internal production processes of an enterprise but also in fostering and sustaining harmonious relationships with humans, society, and nature. The evolution of the green marketing concept has been a gradual progression, starting from initial forays into environmental marketing strategies, moving to the rise of green marketing as a business trend in the 1990s, and culminating in the ongoing refinement and expansion of its definition and core principles in the 21st century. In conclusion, green marketing theory extends beyond the traditional 4P marketing mix (product, price, place, promotion) by incorporating the dimensions of ecological considerations and green development.

2.2. Local Sustainable Development Theory

Local sustainable development entails fostering the interplay among economic growth, social advancement, and environmental conservation by judiciously utilizing natural resources within a particular region to satisfy both present and future demands. This concept originated from the Brundtland Commission Report, underscoring the imperative for humanity to strike a balance among economic development, social progress, and environmental protection [29]. In the 21st century, achieving local sustainable development has emerged as a central focus of global concern. The objective of sustainable development spans beyond environmental conservation to encompass various domains, including economic growth and social development, aiming to establish harmony between humanity and nature [30]. Achieving local sustainable development is crucial for fostering social and economic growth, enhancing quality of life, and safeguarding the natural environment. In recent years, an increasing number of studies on local sustainable development have been conducted, with scholars examining its theoretical significance and practical experiences from diverse perspectives. Within the theoretical framework of regional sustainable development, economic development theory constitutes one of the core elements. Endogenous growth theory, a significant branch of economic development theory, highlights the pivotal role of knowledge, technological innovation, and human capital in fostering sustainable local economic growth. Bandari et al.’s research developed a Local Environmental and Socioeconomic Model (LESEM) using system dynamics, charting a course for local sustainable development and underscoring the significance of the knowledge co-creation principle [31]. Manioudis and Meramveliotakis assessed the contributions of classical political economy to sustainable development theory’s construction, proposing an analytical framework grounded in classical political economic perspectives, and noted that scholars often overly concentrate on GDP growth, neglecting the balance between environmental conservation and economic growth [32]. Mentes’ research indicated that the green economy, a critical element of local sustainable development, underscores the need for environmental and economic harmony, reflecting endogenous growth theory’s importance in alleviating conflicts between social development and environmental protection [21]. In the process of enriching the theoretical framework of local sustainable development, social development theory holds an indispensable position. As a vital branch of social development theory, social capital theory accentuates the impact of elements like social networks, trust, and norms on advancing local sustainable development. Hermelin Brita and Kristina Trygg’s research emphasized that achieving the Sustainable Development Goals (SDGs) necessitates the engagement of local communities, cities, and organizations, with social capital playing an indispensable role in this endeavor [33]. Kusakab Emiko discovered that social capital aids in addressing “spillover effects” within the sustainable development process by fostering cooperation among community members [34]. Naturally, within the theoretical framework of regional sustainable development, environmental development theory holds a significant position. As global environmental challenges intensify, achieving sustainable resource use alongside economic development has become a pressing issue for all nations. Among various branches of environmental development theory, the ecological footprint theory offers a quantitative method to assess environmental impacts. It assesses the feasibility of local sustainable development by measuring the pressure of human consumption on Earth’s ecosystems. Sinha et al.’s study examined the environmental ramifications of ore mining in India, highlighting the pivotal role of renewable energy in fostering local sustainable development [35]. Wyrwa Joanna’s research explores the detrimental effects of the energy crisis on regional sustainable development from the vantage point of the EU’s green economic development and how sustainable development can be realized via a green economy [36]. Furthermore, in the realm of local sustainable development research, comprehensive development theory underscores the equilibrium among economic growth, social advancement, and environmental conservation. Research conducted in Australia by Ningrum Dianty et al. demonstrates that multi-level coordination within local governance is essential for the attainment of sustainable development [37]. Collectively, these studies illustrate the multidimensional nature of local sustainable development and emphasize the intricacies involved in realizing sustainable development goals. Sustainable local development necessitates collaborative efforts from all stakeholders, including policymakers, businesses, and social organizations, as well as the engaged participation of the public. It is only through a holistic consideration of the shared requirements of economic growth, social development, and environmental protection, coupled with the adoption of strategies to balance these needs, that we can attain genuine sustainable development.

2.3. Green Marketing and Local Sustainable Development

Existing research posits that the emergence of green marketing entities and the outcomes of local sustainable development are not isolated incidents but interconnected. To examine the correlation between green marketing and local sustainable development, a specific scope must be investigated. The manner in which green marketing activities within a company influence broader spatiotemporal dimensions requires analysis [38]. The influence of green marketing elements on corporate behavior is grounded in the principles of sustainable development and is integrated into the dynamic spatial and temporal progression of regional development [39]. Such economic activities not only expand the scale of the green economy but also foster the enhancement of local capacities necessary for sustainable development. Concurrently, green marketing represents a recurring economic behavior with distinctive characteristics over time. The interaction of all marketing elements yields economic, technological, and ecological outcomes [40]. The foundational marketing mix theory, introduced by McCarthy and known as the 4P mix, employs the strategic arrangement of product, price, place, and promotion to devise marketing strategies aimed at enhancing corporate profitability [41]. In the current era, the global economy has embarked on a phase of sustainable development. Tseng and Hung contend that the environment should be incorporated as an additional element within the 4P framework [42]. Peattie underscores the necessity for the economy to account for service marketing intermediaries during the transition from extensive growth to sustainable development [43]. In summary, an increasing number of studies have started to integrate green economic dimensions, such as environmental and technological aspects, into the mix of marketing factors. By enhancing the depth of the 4P combination’s meaning, the influence mechanism of the local sustainable development index can be thoroughly understood.
The primary focus of this study is to clarify the principles of local sustainable development through an examination of the impact of green marketing on corporate sustainability. Armstrong divides green marketing into four strategic dimensions: market segmentation, corporate objectives, product positioning, and differentiated competition. He investigates how corporations can strategically adapt within these dimensions to promote both corporate and local sustainable development [44]. Bombiak argues that enterprises should bear the full environmental costs associated with social development through green marketing initiatives, thereby creating an economic system that supports local sustainability [45]. Furthermore, although few scholars have directly studied the impact of green marketing on the efficiency of local sustainable development from a regional economic perspective, substantial contributions have been made. Nikonova and Mottaeva, utilizing green marketing theory, have formulated an algorithm for evaluating regional sustainable development efficiency, integrating indicators across social, environmental, and economic dimensions. This tool is crucial for developing strategies for local sustainability [46]. Ginsberg and Bloom emphasize that diverse green marketing mix strategies will require distinct local sustainable development strategies [47]. The interplay between green marketing and local sustainable development is inherently intricate, influenced by factors including technology, human resources, resource allocation, and output efficiency [48]. These elements are critical factors that may affect the efficiency of local sustainable development [49]. Specifically, although technology alone may not be sufficient to influence local sustainable development efficiency, when combined with other factors, it can have a significant impact.

2.4. Joint Analysis Method of DEA and fsQCA

The 4P theory of marketing originally posited that the marketing concept is holistic, encompassing four core elements: product, price, promotion, and place [22]. Subsequent scholarly developments have integrated environmental and social factors into the framework, expanding it into what is now recognized as green marketing theory [23]. Consequently, green marketing is a multifaceted construct that encompasses a variety of elements. The exploration of the relationship between green marketing and local sustainable development adopts a perspective that emphasizes its inherent regional and macroscopic characteristics. This relationship is marked by a typical cause-and-effect asymmetry, where different combinations of green marketing elements can yield similar outcomes in local sustainable development.
Earlier research on macro issues such as local sustainable development typically relied on a single indicator to construct a linear model for assessing sustainability efficiency [50]. Since the 1990s, however, multi-index evaluation models, including Data Envelopment Analysis (DEA) [51], Analytical Hierarchy Process (AHP) [52], and the Driving Force–State Response (DSR) model [53], have been utilized to evaluate local sustainable development efficiency. Among these models, the Data Envelopment Analysis (DEA) model is particularly notable because it does not necessitate the pre-specification of a function for evaluating local sustainable development efficiency. It simply requires the input of diverse indicators for analysis, imposing no restrictions on the types of indicators used [54]. Furthermore, this model is founded on an “input–output” framework, aligning with the central tenet of local sustainable development: improving “input–output” efficiency across societal, economic, and environmental dimensions. As a result, in the current era, the DEA model has become widely applied in macroeconomic research, particularly for assessing the efficiency of local sustainable development. Its flexibility and adaptability have made the DEA model a preferred tool for extensive empirical research across diverse regional settings [55,56,57,58,59,60,61,62,63].
In 1987, Ragin introduced the fuzzy-set Qualitative Comparative Analysis (fsQCA) method, which is predicated on identifying causal asymmetry [64]. This methodology is particularly well suited for examining relationships that involve multiple causal variables and a single outcome variable. Unlike traditional methods for exploring causal linkages, including questionnaires [65], grounded theory [66], and case studies [67], fsQCA addresses a significant misconception. It challenges the conventional view that the relationship between cause and effect must be one to one, with other factors having only a marginal influence. FsQCA necessitates the transformation of phenomena into quantifiable data for analysis, effectively combining the strengths of qualitative and quantitative research methods. Owing to its comprehensive analytical capabilities, fsQCA is particularly adept at exploring the intricate interconnections between green marketing—which encompasses multiple causal factors—and local sustainable development, characterized by a singular outcome element.
The integrated application of Data Envelopment Analysis (DEA) and fuzzy-set Qualitative Comparative Analysis (fsQCA) provides a sophisticated research approach that mitigates the individual limitations of each method. Specifically, the hybrid method compensates for the DEA model’s limitation in assessing the impact of multiple causal factors on a single outcome variable, and it addresses fsQCA’s limitations in quantifying causality and ensuring outcome precision. For example, Xiaoyu Qu et al. assessed the efficiency of local green technology innovation by examining a sample of 30 provinces in China. Key indicators, including Economic Environment, Environmental Regulation, Industrial Structure, Financial Supply, Labor Supply, and Facility Supply—linked to “input–output” factors—were incorporated into the DEA model to assess regional green innovation efficiency. Subsequently, fsQCA was applied to investigate the various combinations of these six causal variables and their association with regional green innovation efficiency as the outcome variable [68]. Similarly, Viktor Prokop utilized this combined approach in his study of 31 countries worldwide. The study classified knowledge investment, cooperation investment, and innovation investment as key causal variables, essential for building national innovation systems, using DEA to measure the overall output efficiency as an outcome variable indicative of the systems’ successful development [69]. Furthermore, Andrijauskiene applied this integrated approach in her research examining the factors affecting the efficiency of artificial intelligence R&D investment in the EU. By employing DEA to assess the efficiency of these investments across EU countries and fsQCA to determine the factors influencing them, the extensive applicability of this combined method for analyzing complex regional economic issues is highlighted, particularly when multiple causal variables are involved [70]. Considering that this study’s focus is on regional economic issues across 30 provinces in China, with green marketing broken down into six causal segments, the joint DEA and fsQCA analytical method is highly relevant. Therefore, this methodology is employed to explore the relationship between green marketing and local sustainable development.

3. Research Design

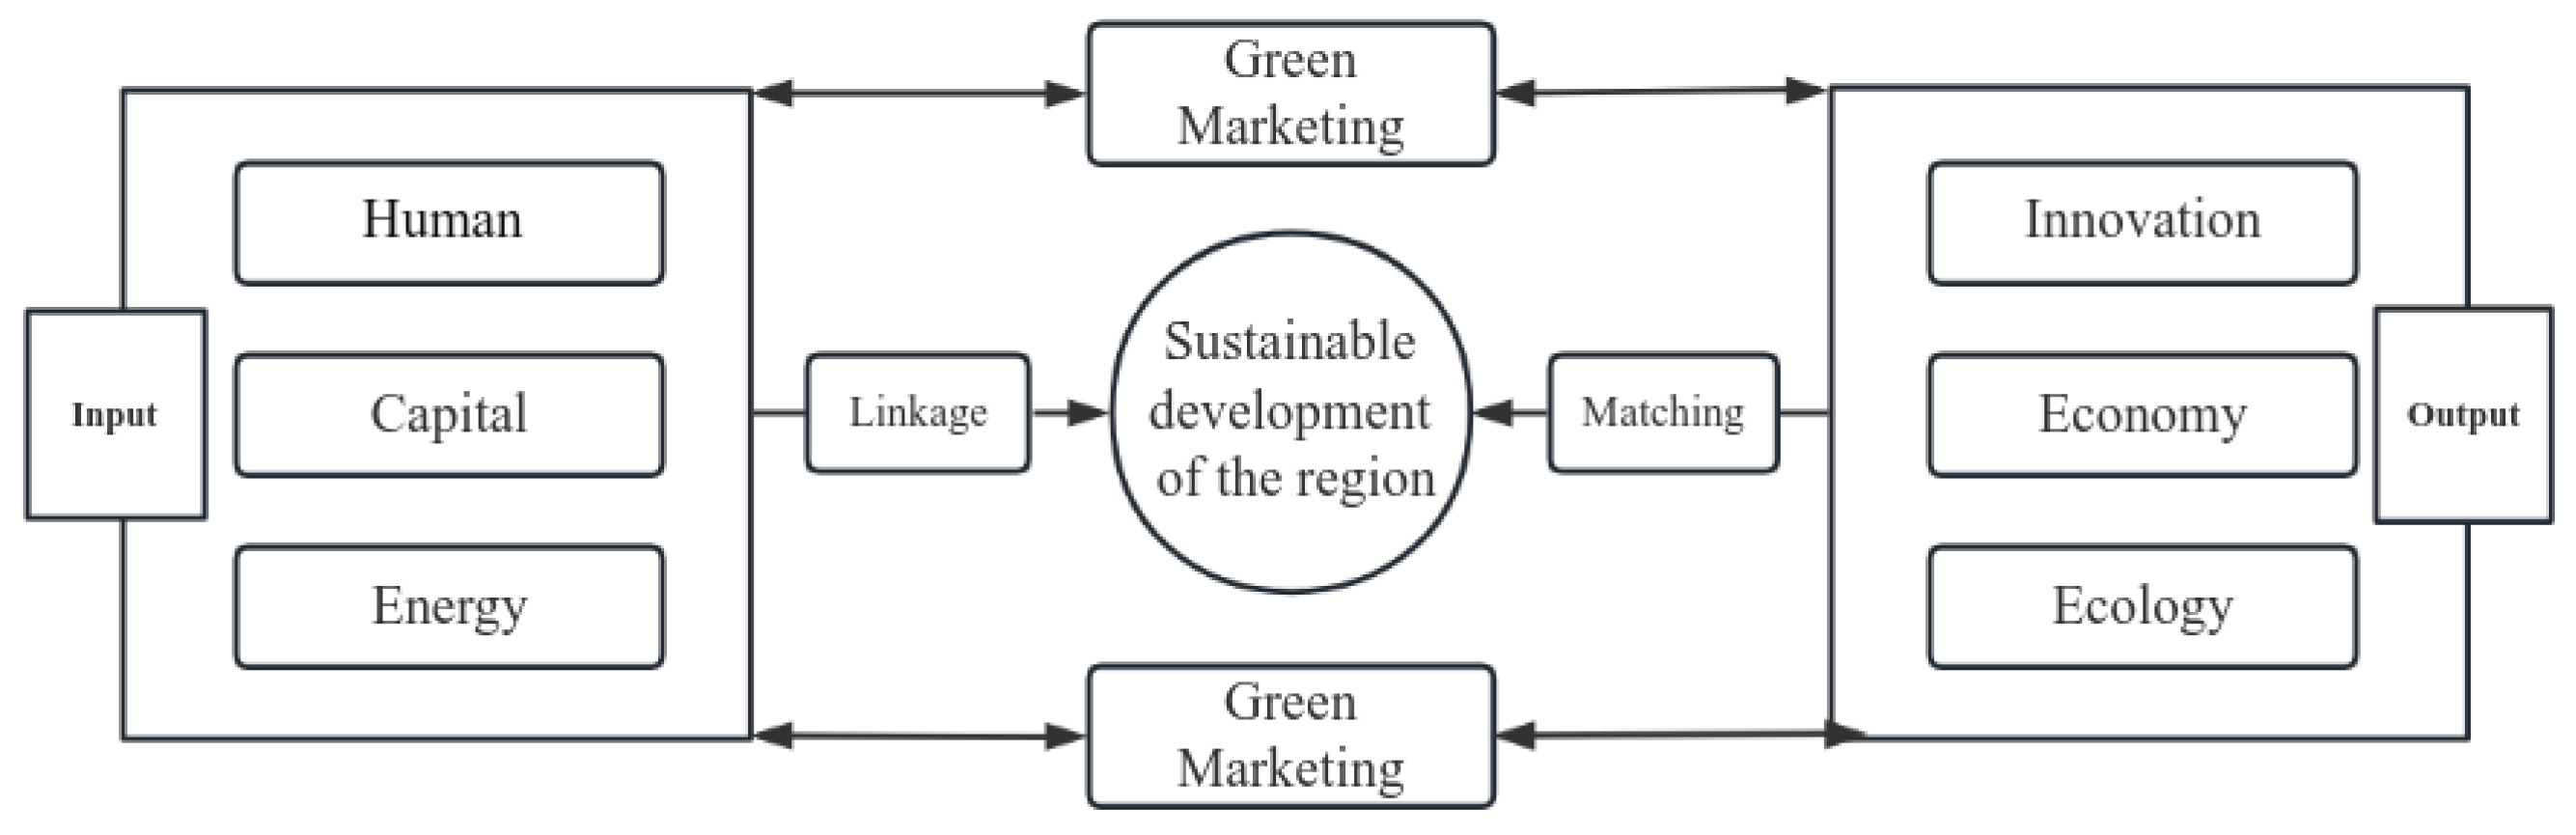
3.1. Research Framework

This study initially integrates the green dimensions of energy input and ecological output with the 4P-based marketing mix framework [71] and constructs an analytical framework encompassing conditional variables. Each element is explained in conjunction with green economic theory, as illustrated in Figure 1 [71]. Concurrently, the green total factor productivity, measured from an input–output perspective, serves as a proxy for the sustainable development index [72] and is adopted as the dependent variable.

3.2. Research Methods

3.2.1. DEA-SBM Model

Currently, scholars both domestically and internationally primarily utilize the Data Envelopment Analysis (DEA) method to assess regional sustainability indices. Given that traditional efficiency evaluation models are based on a single-factor approach and do not account for slack variables, this paper employs a multi-input–multi-output DEA model to evaluate the efficiency of regional sustainable development. Some scholars have utilized the SBM model introduced by Tone [73] to measure the efficiency of regional sustainable development. Although the SBM model can simultaneously analyze multiple input and output variables, enhance them collectively, avoid inefficient solutions, and align more closely with actual conditions, the efficiency value assessed by the standard SBM model ranges from 0 to 1. When numerous effective decision-making units are present, the SBM model cannot further assess them. Consequently, this article will employ the SBM model revised by Tone [74] to enable the evaluation of effective units with an initial efficiency score of 1 and to incorporate the emissions of hazardous substances as an undesirable output in the efficiency assessment of regional sustainable development. The revised model is presented in Formula (1).
θ * = min 1 + [ e = 1 E s e x e , o h ] 1 1 1 M + N f = 1 F s f + y f , o h + g = 1 G s g z g , o h
θ = min 1 + 1 L o = 1 L s o x e , o h 1 1 M + N p = 1 M s p + y f , o h + q = 1 N s q z g , o h s . t . h = 1 T i = 1 , i o I a i h x i , o h s o x e , o h , o = 1 , 2 , , L h = 1 T i = 1 , i o I a i h y i , p t + s p + y f , o h , p = 1 , 2 , , M h = 1 T i = 1 , i o I a i h z i , q h s q z q , o h , q = 1 , 2 , , N a i h 0 , s o 0 , s p + 0 , s q 0 , i = 1 , 2 , , I
In Formula (1), θ * denotes the efficiency value of an independent decision-making unit; E, F, and G represent the counts of input indicators, desirable output indicators, and undesirable output indicators, respectively, within the green marketing mix; e = [1, E], f = [1, F], and g = [1, G]; Se, S+f, and Sg correspond to the slack variables; xe,oh, yf,oh and zg,oh represent the input–output values of period h; xe,oh, yf,oh, and zg,oh represent the input and output variables of the decision-making unit; and ait represents the weight coefficient of the corresponding decision-making unit.

3.2.2. Malmquist Exponential Model

The DEA method is characterized by its non-parametric and non-discriminatory nature and is extensively utilized by scholars to assess regional development efficiency due to its objectivity and precision. However, the traditional DEA model, which adopts a univariate perspective, assesses the efficiency value of a decision-making unit over a specific time period (static efficiency); it cannot capture the variations in input factors and the consequent output factors across different time periods (dynamic efficiency) [75]. Consequently, this paper employs the Malmquist index model [16] to measure the regional sustainable development index, the Green Efficiency Index (GEC), and the Green Technology Innovation Index (GTC) [76]. By measuring the respective dimension indices, we can discern the efficiency’s dynamic trajectory and investigate the causes of its fluctuations, thereby addressing the issue of identifying appropriate solutions. When the Malmquist index (ML) exceeds 1, it indicates that the decision-making unit’s input–output ratio has a positive correlation; when the index is less than 1, it signifies a negative correlation between the input and output ratios. The Malmquist index model is shown in Formula (2).
M L h h + 1 = D v h x h + 1 , y h + 1 , z h + 1 D v h x h , y h , z h × D v h + 1 x h + 1 , y h + 1 , z h + 1 D v h + 1 x h , y h , z h 1 2 = D v h + 1 x h + 1 , y h + 1 , z h + 1 D v h x h , y h , z h × D v h x h + 1 , y h + 1 , z h + 1 D v h + 1 x h + 1 , y h + 1 , z h + 1 × D v h x h , y h , z h D v h + 1 x h , y h , z h 1 2
h = E C h h + 1 × T C h h + 1
In Formula (2), xh, xh+1 and yh, yh+1 represent the production output variables of x and y in the h period and h + 1 period; zh and zh+1 represent non-essential output; Dh and Dh+1 represent relative spacing.

3.2.3. fsQCA

fsQCA is a method of configurational analysis that integrates quantitative and qualitative research. It utilizes the Boolean algorithm to quantitatively analyze causal variables, identifying multiple configurations of necessary and sufficient conditions, offering diverse equivalent paths for pattern recognition and model construction. The rationale for employing this method in this study includes the following: Firstly, it circumvents the limitations inherent to regression econometric analysis. Traditional regression analysis adopts a univariate independent variable–dependent variable approach and overlooks the complexity of causal factor interactions. Secondly, fsQCA scholars posit that identifying equivalent paths through diverse configurations [77] aligns more closely with the objectives of fostering sustainable development in China and realizing nationwide high-quality growth. Thirdly, the fsQCA approach merges the strengths of quantitative and qualitative analyses, considering the longitudinal temporal dimension, and is particularly well suited for statistical analysis with small and medium-sized samples. With 31 provinces representing small and medium-sized samples, this approach is deemed appropriate. fsQCA elucidates the relationship between variables X and Y by assessing consistency and coverage indices, which measure proportional reduction in inconsistency [78]. It is widely accepted that a consistency index above 0.9 indicates that X is a necessary condition for Y. The corresponding formula is presented in Formula (3).
C o n s i s t e n c y X 1 = min X i , Y i X i
C o n v e r g e X 1 = min X i , Y i Y i

3.3. Data Construction

3.3.1. Sustainable Development Efficiency Measurement Indicators

Regarding the construction of sustainable development evaluation indicators, previous scholars predominantly focused on input indicators derived from resource, technological, and economic factors and chose output indicators related to innovation and performance. In this study, we have integrated the contemporary context, adhered to principles of objectivity and comprehensiveness, referenced existing evaluation indicators pertaining to sustainable development [79], and incorporated these into the existing marketing evaluation framework from a “dual carbon” goal perspective. The green economy-related indicator system, including green product sales and sulfuric dioxide emissions, utilizes input–output indicators from a green marketing standpoint to assess the efficiency of regional sustainable development (as depicted in Table 1).
At present, no model in China directly quantifies the indices of regional sustainable development. As reported in the “Capital Land (China) Sustainable Development White Paper 2022”, 85% of the added value in China’s green economy is attributed to marketing-based services and manufacturing. Consequently, this study utilizes input–output measures concerning product, price, channel, and promotion, drawing on the methodology of Feng Chao et al. [80]. The study covers the period from 2011 to 2022. The primary data sources for this research include the “China Statistical Yearbook” and “China Energy Statistical Yearbook”, among others, which were processed.
When assessing capital investment in marketing factors, the prevailing method for estimating the extent of capital engagement is the perpetual method [81]. Consequently, this study draws upon the research of Murshed et al. [82], replacing traditional fixed asset investment in the allocation of marketing capital factors with research and development investment; when examining personnel investment, the concentration of R&D personnel is employed as a proxy. In the current exploration of the energy input dimension by the marketing community, the existing research predominantly centers on the regression analysis of natural resource utilization. Nonetheless, this study, grounded in the context of sustainable development and viewing from the “dual carbon” perspective, selects electricity consumption and the industrial pollution abatement index as indicators for energy investment [83].
In constructing the expected output dimension, the intermediary effect analysis of green marketing and regional sustainable development typically encompasses the advancement of green consumption, green technological innovation, and the level of ecological adaptation within the region. Throughout this process, regional marketing entities seek patent protection to foster positive growth in innovative performance. This study utilizes the annual number of patents granted in the region as an indicator of technological output [84]. Product sales volume is an integral component of marketing elements and represents one dimension and a significant indicator of regional economic development. From a sustainable development perspective, this study employs green product sales as a proxy for economic output [85]. The essence of green marketing is the enterprises’ attention to ecology and environmental coordination, thereby completing production–sales cycles; thus, this study uses regional green coverage as a measure of ecological output. Harmful gas emissions are a significant factor impeding regional sustainable development; hence, this study employs them as indicators of unintended environmental impacts.

3.3.2. fsQCA Indicator Selection

The essence of regional sustainable development lies in the harmonization of society, resources, and the environment. To achieve the deep integration of these elements, the process must be guided by the government’s visible hand at the macro level. Nonetheless, at the micro level, enterprises must undertake marketing activities that are environmentally compatible to achieve regional development, specifically through green marketing. Drawing on a synthesis of the relevant literature, this study examines 31 provinces in China as an example, adheres to Mukherjee’s [86] 6P marketing framework, and selects human input, capital investment, energy input, technological output, economic output, and ecological output as specific indicators. Concurrently, building upon the approach of Francesco et al. [87], the study selects the investment amount and electricity consumption in industrial pollution control for each province to gauge the energy input within green marketing components and utilizes the green coverage rate of each province as an indicator of ecological output. Utilizing fsQCA software 4.1, this study employs the aforementioned six factors influencing the regional sustainable development index as condition variables, and the resultant measurement values (ML estimates) of regional sustainable development efficiency serve as outcome variables. The relevant data are primarily sourced from the “China Statistical Yearbook” and “China Energy Statistical Yearbook” (as detailed in Table 2).

4. Empirical Results and Analysis

4.1. Analysis of Regional Sustainable Development Efficiency Measurement Results

At present, based on the categorization by the National Bureau of Statistics, China is divided into the eastern, central, western, and northeastern regions. The specific delineation is as follows: the eastern region includes Beijing, Tianjin, Hebei, Shanghai, Jiangsu, Zhejiang, Fujian, Shandong, Guangdong, and Hainan, comprising ten provinces (cities); the central region includes Shanxi, Anhui, Jiangxi, Henan, Hubei, and Hunan, totaling six provinces; the western region includes Inner Mongolia, Guangxi, Chongqing, Sichuan, Guizhou, Yunnan, Tibet, Shaanxi, Gansu, Qinghai, Ningxia, and Xinjiang, encompassing twelve provinces (autonomous regions and municipalities); the northeastern region includes Liaoning, Jilin, and Heilongjiang, consisting of three provinces (as depicted in Table 3).

4.1.1. Correlation Analysis

In the DEA model, the input and output vectors must be in the same direction. This study employs SPSS 20.0 to calculate the Pearson correlation coefficients, assessing the collinearity of the input–output indicators (as illustrated in Table 4). Upon examination of Table 4, it is evident that the Pearson correlation coefficients for all input–output vectors exceed 0.4, and each indicator demonstrates a positive correlation at the 1% significance level, fulfilling the criteria for the DEA model [88].

4.1.2. Static Analysis

The input–output indices were inputted into the Matlab 2023a 12.10 software to calculate the sustainable development efficiency values for China’s 31 provinces. Based on the output results, the sustainable development status of the 31 provinces in 2022 is detailed in Table 5; the annual average trend and efficiency values of sustainable development for each province are depicted in Figure 2.
As depicted in Figure 2, from 2011 to 2022, the efficiency of sustainable development across different regions in China generally exhibited a moderate rise. However, the development trajectories vary among the eastern, central, western, and northeastern regions. The eastern region exhibits the highest development, averaging an efficiency value of 0.839; the central region follows, averaging an efficiency value of 0.777; the northeastern region ranks third, with an average efficiency value of 0.754; the western region lags behind, averaging an efficiency value of 0.638. However, the situation in the central and northeastern regions declines from higher to lower values, the situation in the western region improves from lower to higher values, conditions in the eastern region exhibit fluctuations around the value of one, and ultimately all four regional trends converge towards a value of one. This outcome is attributed to the high integration of green marketing with regional development conditions, and in-depth inter-regional cooperation can effectively mitigate the issue of uneven development across the country.
As shown in Table 5, based on the average sustainable development efficiency from 2011 to 2022, the eastern region’s average sustainable development efficiency—comprising Beijing, Tianjin, Hebei, Shanghai, Jiangsu, Zhejiang, Fujian, Shandong, Guangdong, and Hainan—scores 0.8; among them, Shanghai has the highest sustainable development efficiency value. In 2011, Jilin Province (northeast region) had an efficiency score above one, but it subsequently dropped to approximately 0.5 between 2012 and 2018, indicating that Jilin’s green marketing reform strategy did not yield significant economies of scale. Conversely, the sustainable development efficiency value for the central region (Shanxi, Anhui, Jiangxi, Henan, Hubei, and Hunan) rose from approximately 0.2 in 2011 to around 0.8 in 2019, representing a substantial improvement. Among the twelve provinces in the western region, the sustainable development evaluation values for eight provinces, including Inner Mongolia, Guangxi, Chongqing, Guizhou, Yunnan, Xinjiang, Shaanxi, and Gansu, have remained below 0.5 over the past decade, and the outcomes of reform have been unremarkable. A potential reason is the vastness and complex topography of these areas, which includes plateaus, mountains, and rivers, hindering infrastructure and transportation sector development. This has led to these areas’ marketing strategies remaining in an extensive growth phase, which restricts the implementation of green-oriented strategies.

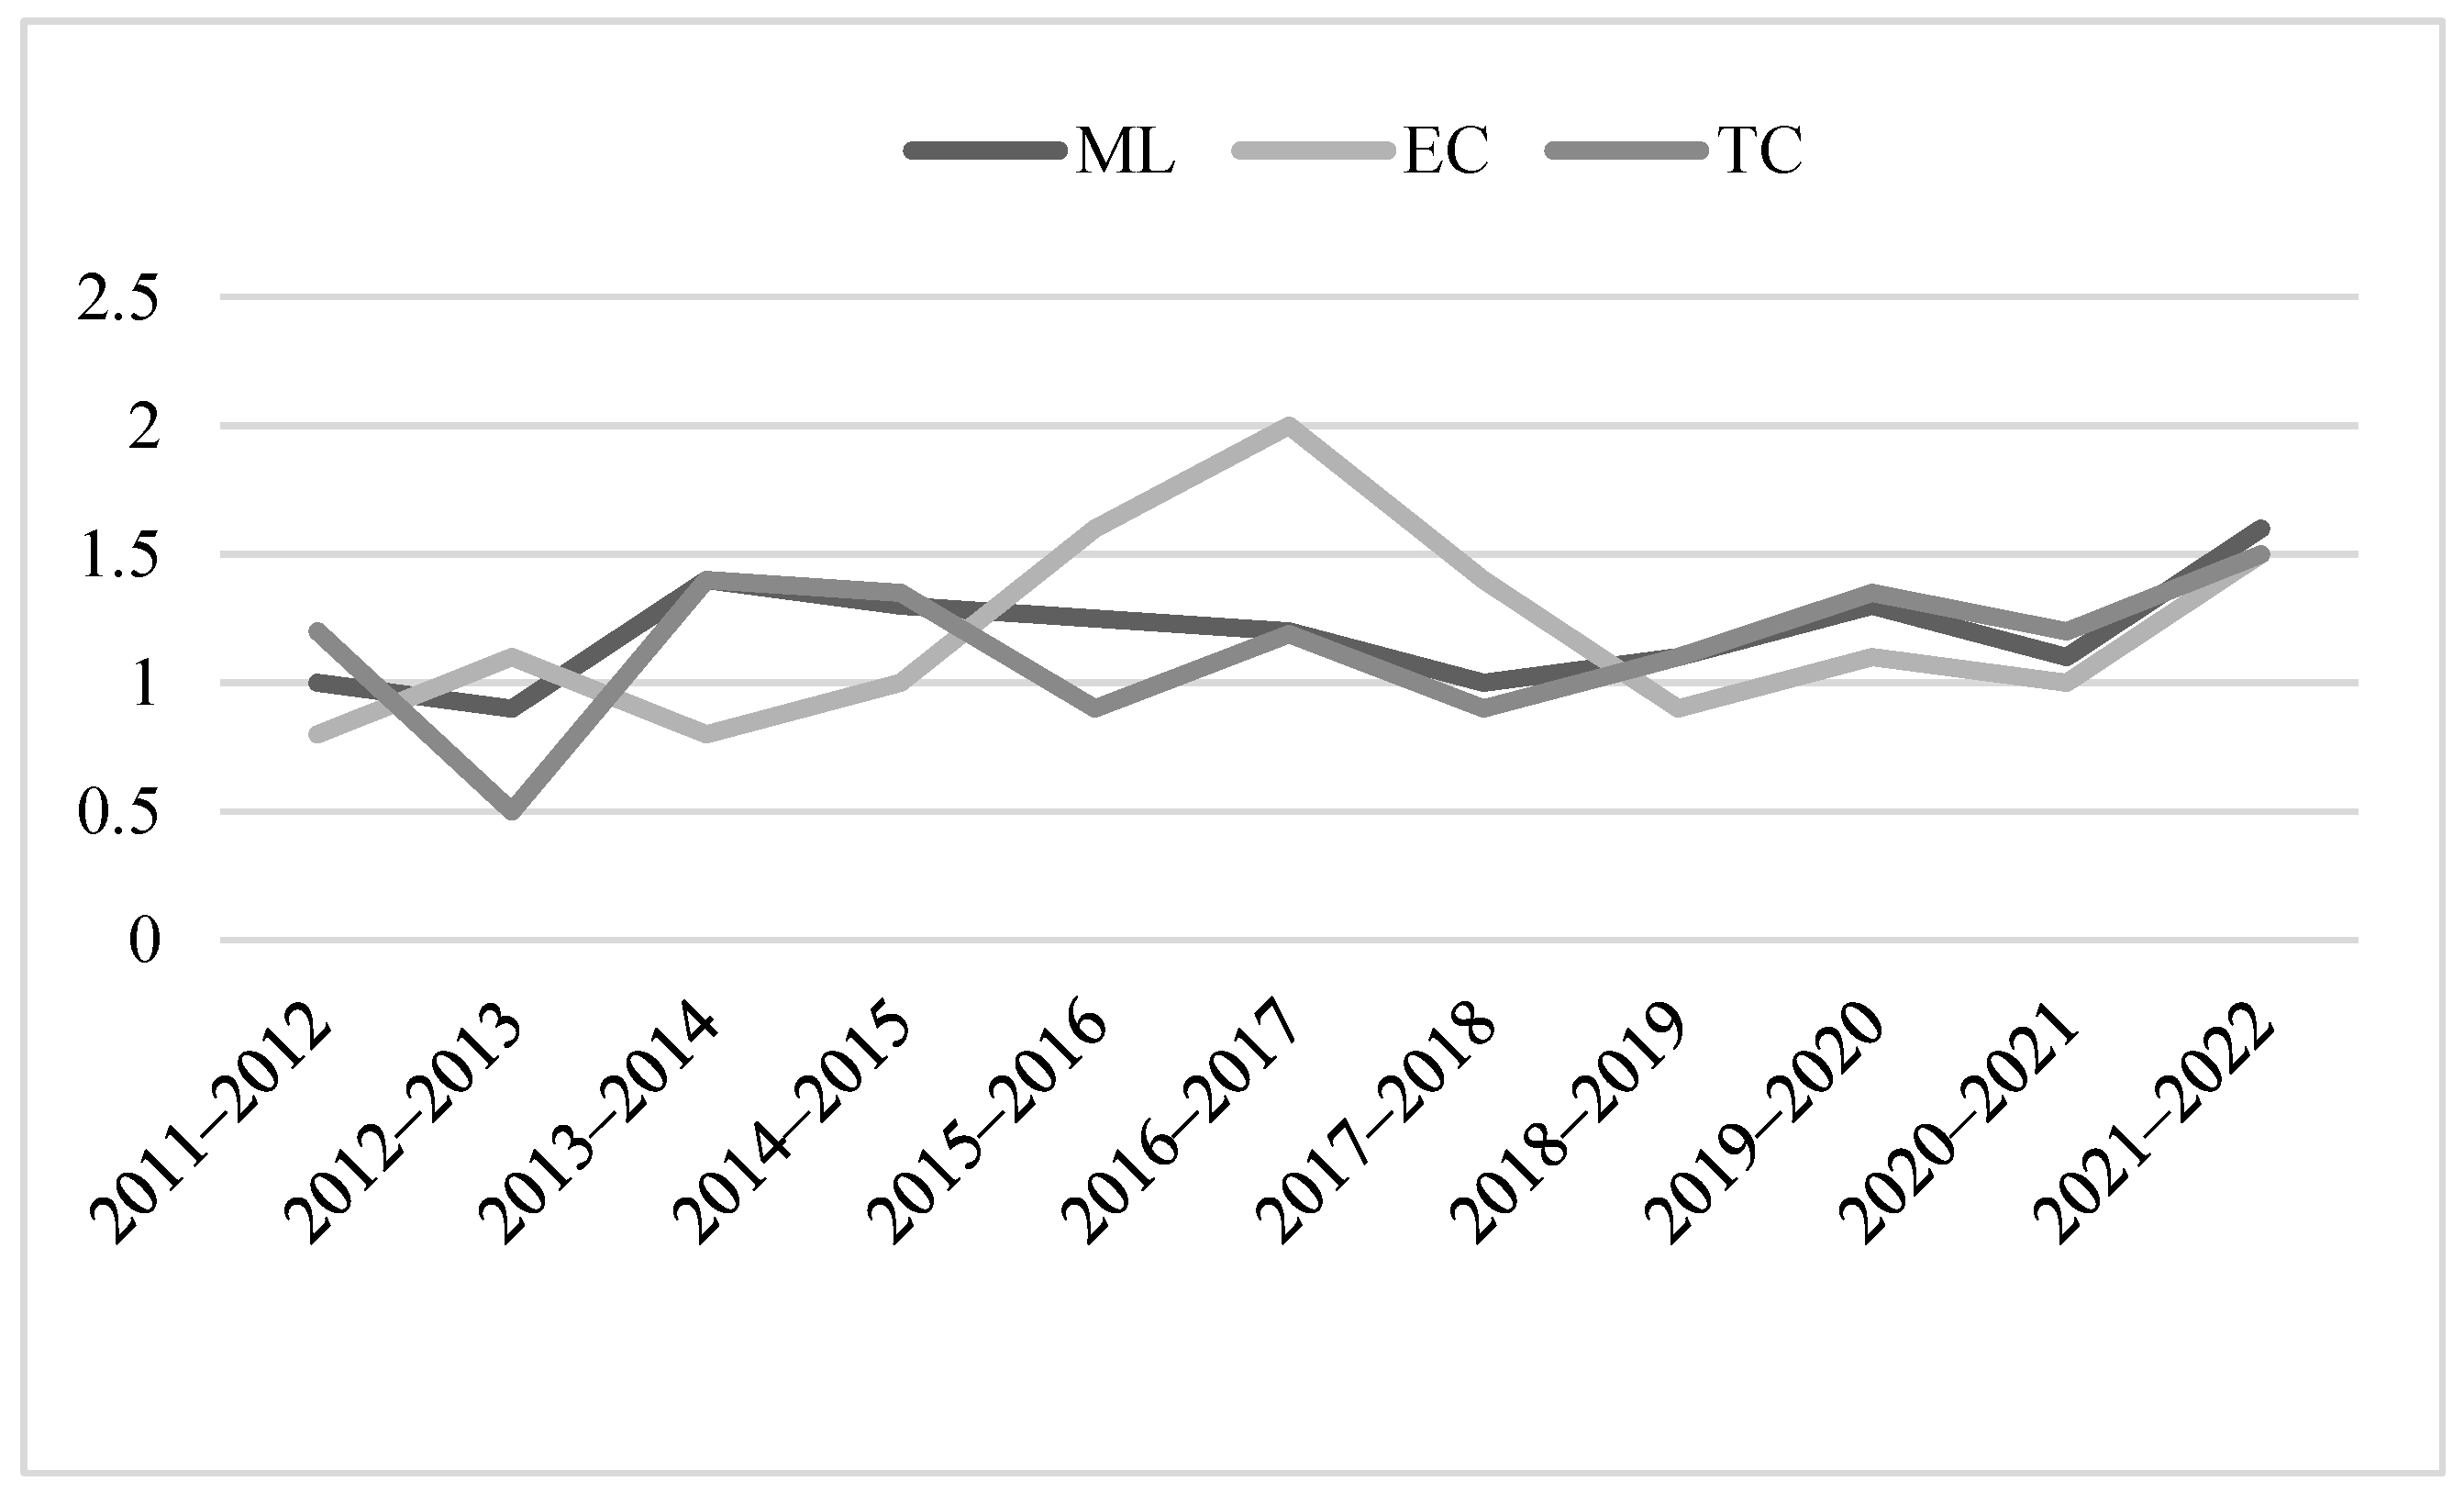
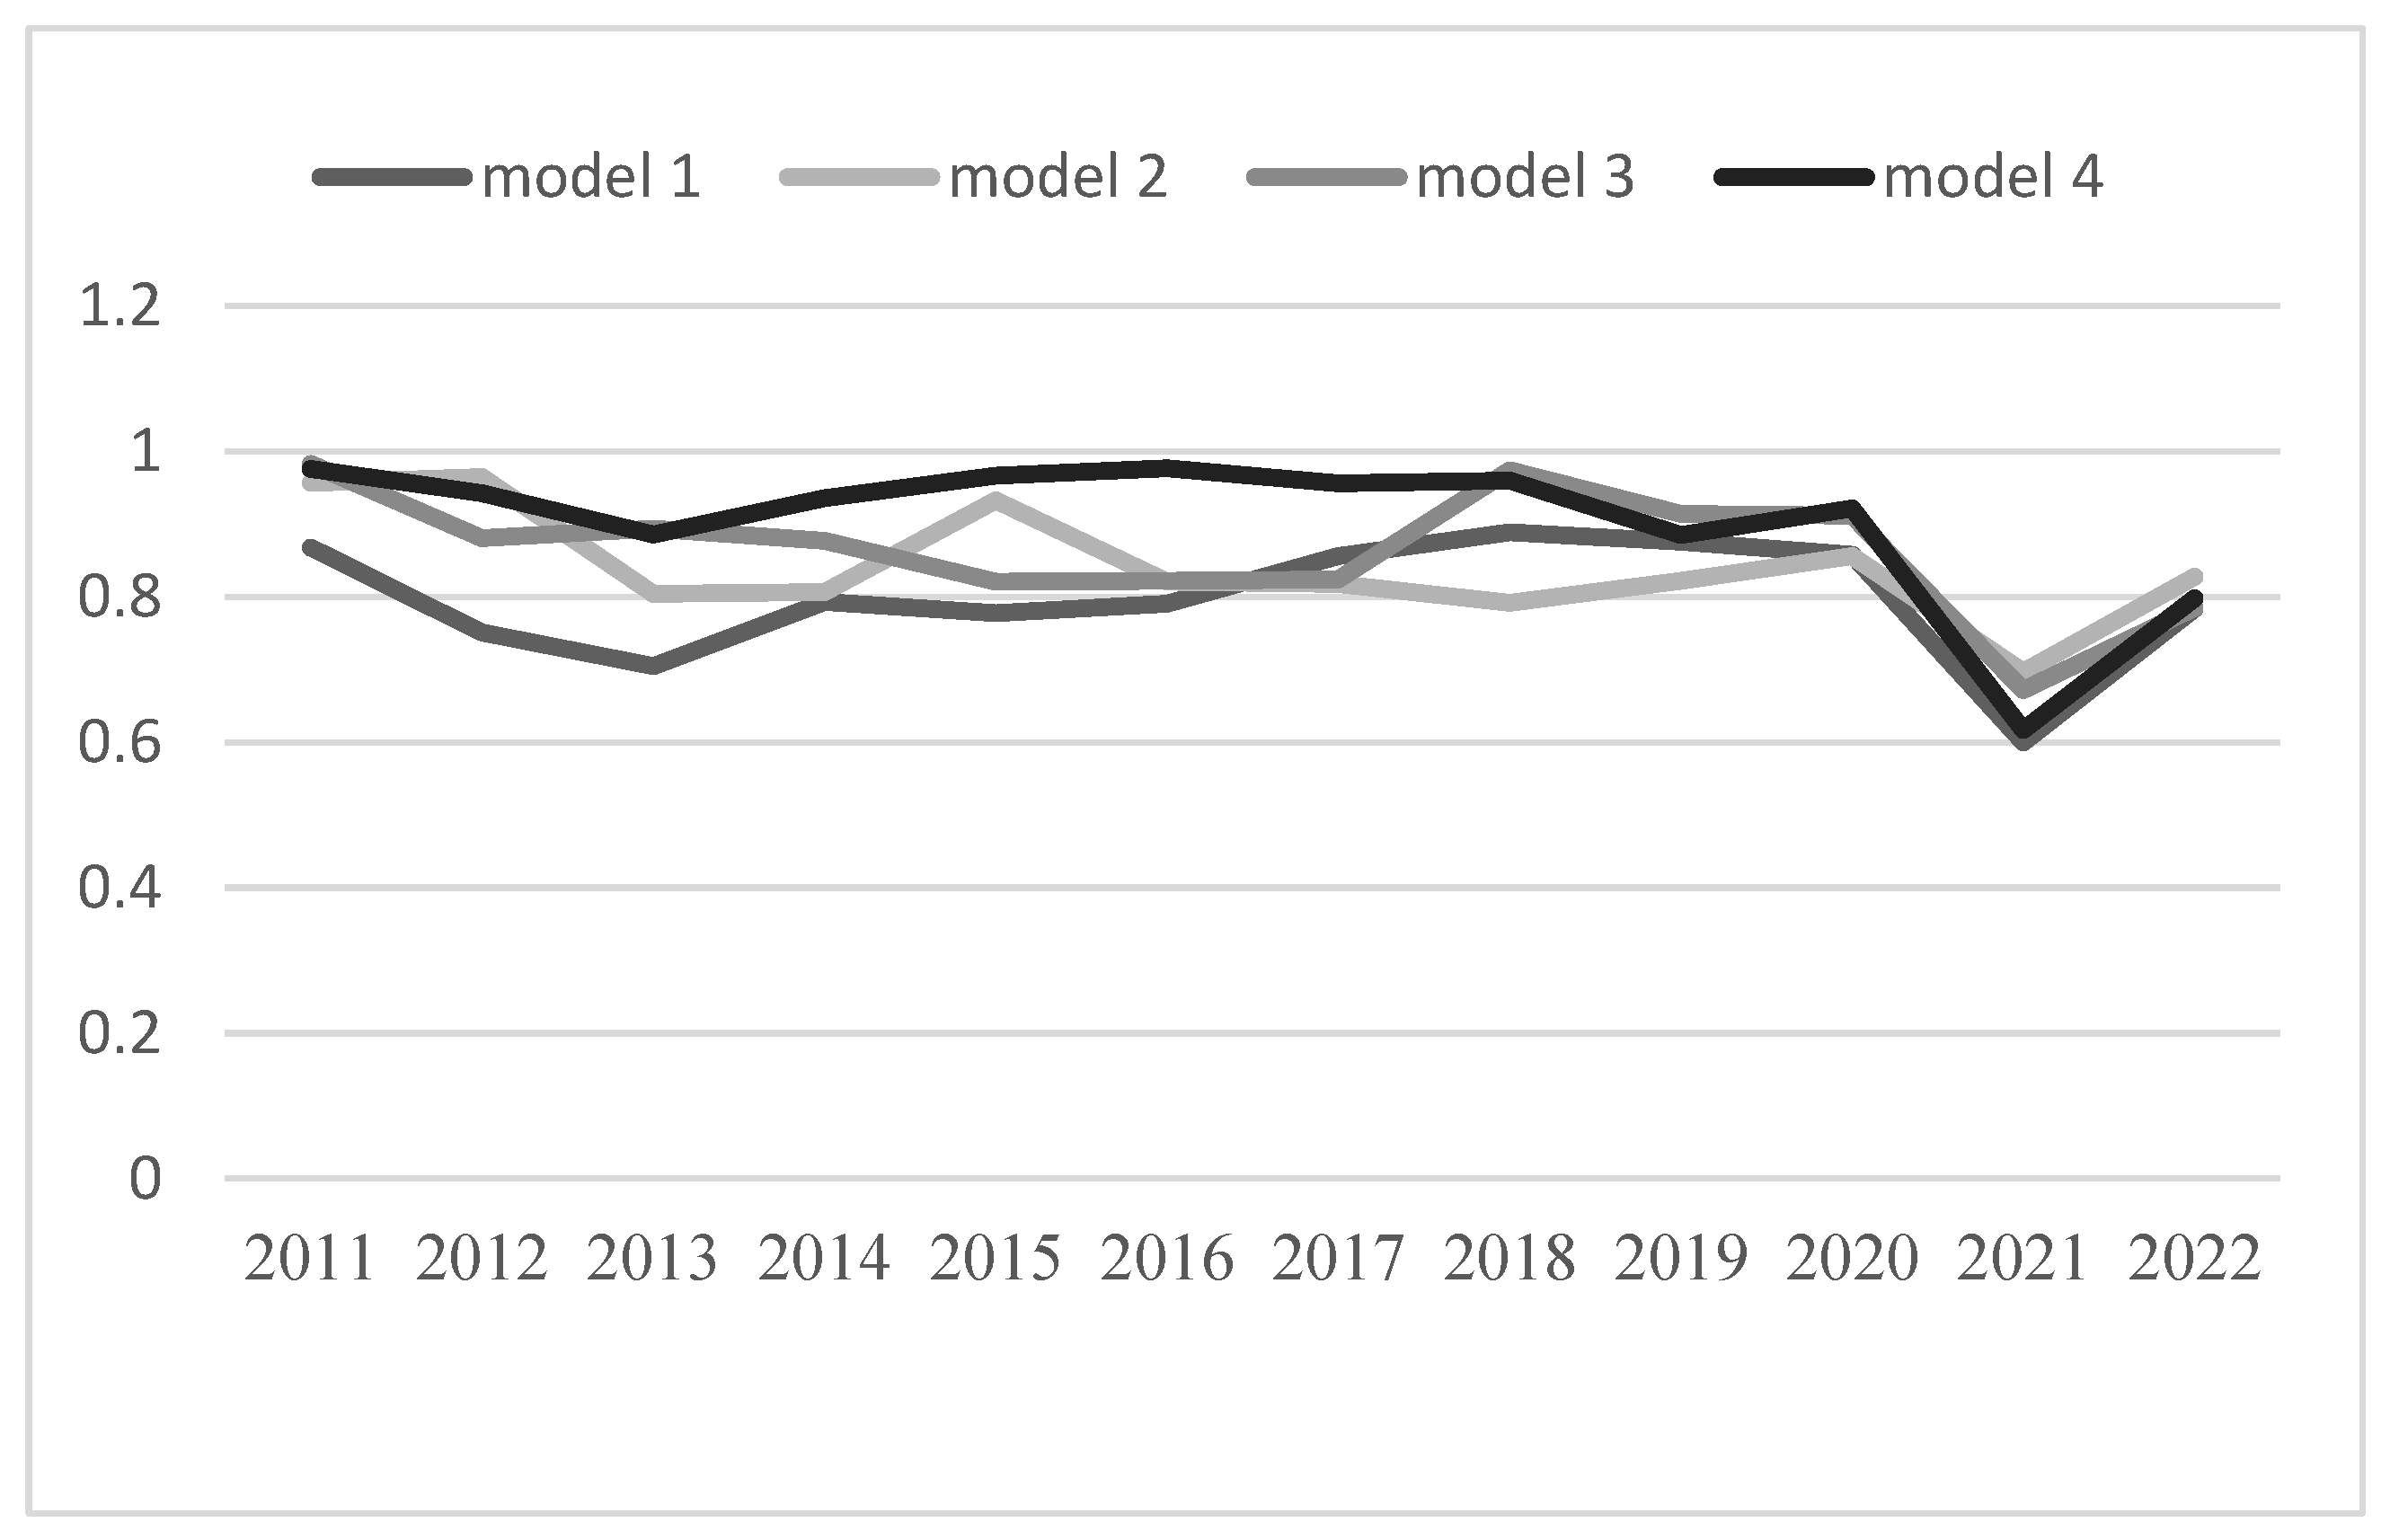
4.1.3. Dynamic Analysis

The Malmquist–Luenberger (ML) index model was utilized to assess the dynamic sustainable development efficiency across each province, and the ML index, along with the regional averages for EC and TC, were measured dynamically to derive the results for China’s 31 provinces from 2011 to 2022. The specific efficiency values and their trends are detailed (refer to Table 6 and Figure 3).
As illustrated in Figure 3, China’s regional overall sustainable development index has generally increased in an “N-shaped” pattern, with an average annual growth rate of 2%. Between 2011 and 2022, the technological progress indicator (TC) and technical efficiency both saw an increase of 43.61%. Additionally, the environmental condition indicator (EC) rose by 48.34%. The evident linkage between technological progress and efficiency suggests that technological innovation has become a pivotal driver of regional sustainable development. In recent years, policies aimed at strengthening the nation through science and technology have been proposed, with various regions increasing their investment in technological innovation and establishing zones of technological excellence, aligning with China’s fundamental national conditions and policies. The average input–output efficiency values of the green marketing mix for China’s 31 provinces across four regions, calculated from 2011 to 2022, yielded the regional average annual ML index, EC index, and TC index, as detailed in Table 6. As Table 6 indicates, when viewed from a geographical perspective, the sustainable development efficiency rankings from highest to lowest are as follows: the eastern region (1.362), the central region (1.278), the western region (1.191), and the northeastern region (1.054). The EC and TC indices in all four regions exceed one, indicating that technological factors have become the key drivers. The western region exhibits the highest TC growth rate (1.302), with technology increasingly serving as the primary driver for sustainable development. The changes in the EC and TC indices in the northeastern region are modest, and the impact of technology on development is limited. The overall ML values for each region demonstrate a modest upward trend. Consequently, there remains significant potential for enhancing the efficiency of regional sustainable development, and the allocation of resources requires further optimization. To further investigate the components of green marketing influencing regional sustainable development levels, this study will employ fuzzy set Qualitative Comparative Analysis (fsQCA) methods for subsequent analysis.

4.2. fsQCA Configuration Analysis

fsQCA analysis primarily relies on cross-sectional data and does not examine configuration evolution over time. Following the introduction of the concept of green development in 2015, exploring the relationship between marketing strategy and regional sustainable development represents an ongoing event along the timeline. A single cross-sectional analysis alone is insufficient to explain the configuration effects. The mechanism linking the path and time is complex. Therefore, this paper employs the fsQCA method, drawing on the dynamic analysis concept introduced by Garcia-Castro and Ariño [89], and utilizes R language to integrate panel data with fsQCA for analyzing configurations over time.

4.2.1. fsQCA Data Calibration

The data calibration in this study employs Professor Ragin’s direct calibration method [90] and establishes three anchor points—complete affiliation, intersection, and non-affiliation—between the green marketing condition variables and the sustainable development index outcome variables from an input–output perspective. For specific details, refer to Table 7 for the settings of the anchor points. Naturally, should a fuzzy membership value of 0.5 arise during the calibration process, this study uniformly adjusts the data to 0.501 to prevent sample path identification errors.

4.2.2. Analysis of Necessary Conditions

Necessity condition analysis is utilized to assess whether a direct effect exists between a specific condition variable and the outcome variable. If the consistency of a single condition variable with the outcome variable is greater than or equal to 0.9, the factor is deemed a necessary condition for the occurrence of the outcome; in other words, without the factor, the outcome variable would not be present. If the corresponding consistency score is below 0.9, then no direct effect is observed between the individual condition variable and the outcome variable. Subsequently, it becomes necessary to analyze the configurations of these condition variables to determine which combinations of elements exert a direct effect on the outcome variable. Coverage is employed to measure the degree of alignment between different configurations and the outcome variables. The greater the coverage value, the higher the degree of alignment of the configuration. This study employs the necessary condition analysis function within the R programming language to quantify the relationship between each individual condition variable and the outcome variable. The findings are presented in Table 8.
The data indicate that the consistency between the conditional variables of the green marketing mix, from an input–output perspective, and the outcome variables of the regional sustainable development index is below 0.9; this suggests that none of the conditional variables alone is sufficient to constitute a necessary condition for the efficiency of regional sustainable development. Consequently, a high level of regional sustainable development is the outcome of the combined effects of multiple conditional variables. Accordingly, this study will explore the configurational pathways that contribute to high-level sustainable development within the region.

4.2.3. Configuration Analysis

Configuration analysis, central to the fuzzy set Qualitative Comparative Analysis (fsQCA) method, examines how various combinations of causal conditions result in the emergence of outcome variables. Judgment is based on the consistency level. Schneider and Wagemann posit that a consistency level of at least 0.75 is required to establish the necessity of a configuration for the outcome variables [91]. In light of previous research and considering the small and medium sample size of this study, the thresholds selected were a consistency threshold of 0.9, a frequency threshold of 2, and a PRI threshold of 0.75, encompassing 31 provinces. Following the construction of the truth table, an enhanced standard analysis was conducted. Given the vastness of China and the heterogeneous resource endowments across regions, establishing a unified standard for the mediating effects of preconditions on outcomes is impractical; thus, the directional preset was omitted. Ultimately, the analysis yielded enhanced intermediate solutions, complex solutions, and parsimonious solutions. Drawing on academic research concerning configurational solutions, this study employs enhanced intermediate solutions to ascertain the core and peripheral conditions of the pertinent configurations. The specific findings from the configuration analysis are presented in Table 9. Four high-quality and two less effective pathways were identified from the perspective of green marketing for regional sustainable development. The coverage rates for all proposed models exceed 0.65, suggesting that the corresponding development model aligns with over 65% of the observed cases, which to some degree explains the combination of conditional variables facilitating the empowerment of regional sustainable development through green marketing.
Table 9 illustrates that six condition variables yield 64 configurations and are condensed into six distinct paths. The overall summary consistency rate is 0.798, which exceeds the judgment threshold of 0.975. Furthermore, the individual path consistency indices range from 0 to 0.802, which exceeds the judgment threshold of 0.75, indicating that these results are highly credible and constitute a sufficient condition for enhancing regional sustainable development. Concurrently, both the original and unique coverages of the six paths exceed 0.65, suggesting that a single configuration accounts for over 65% of the variance across different cases, which indicates strong explanatory power for the cases examined. In summary, this study identifies six configurations and categorizes them into four models: the “single input–multiple output” model, the “multiple input–single output” model, the “input–output” linkage model, and the “input-driven” model.

4.2.4. “Single Input–Multiple Output” Model

The “single input–multiple output” model corresponds to Configuration 1 in Table 9. The condition variables for this configuration include capital input, technological output, and economic output. Capital input and economic output are core conditions, while energy input and ecological output represent uncertain conditions, with a configuration consistency of 0.622 and a coverage rate of 0.679, explaining 67.9% of the samples. This configuration indicates that within the green marketing strategy, if the region has a low energy conversion rate, inadequate environmental remediation, and an absence of comprehensive talent attraction policies, to enhance the level of regional sustainable development, the region can attract private capital and promote industrial upgrading, thereby improving supply chain resilience and employing alternative marketing strategies to influence regional development. Enhancing the dynamism of private capital and fostering greater openness to external influences can facilitate the acquisition of advanced, cutting-edge technologies and efficient management systems, thereby promoting regional economic advancement. As regional economic development levels rise, this will, in turn, attract further international capital for successive technological advancements, thus creating a positive, upward spiral in economic development and ultimately realizing high-quality regional sustainable development. Samples conforming to this configuration are predominantly found in the western region, exemplified by the Inner Mongolia Autonomous Region and Sichuan Province. For instance, the Inner Mongolia Autonomous Region is among the western regions of China with the largest area and the richest resource endowment. It is characterized by a diversity of economic activities, including mining in the east, agriculture in the south, and animal husbandry in the north. Strategically, it serves as a vital ecological security barrier for China, a significant source of national energy and strategic resources, and a key gateway for northern expansion. It has consistently maintained a leading position in terms of economic development within the western region. Concurrently, in response to the “Opinions”, the Inner Mongolia Autonomous Region is forging a novel approach to developing the business environment in resource-rich areas, characterized by “two barriers”, “two bases”, and “one bridgehead”. These initiatives are expected to be pivotal in elevating the level of sustainable development in the western region.

4.2.5. “Multiple Inputs–Single Output” Model

The “multiple input-single output” model corresponds to Configuration 2 in Table 9. The condition variables for this configuration include human input, capital input, energy input, economic output, and ecological output, among which human input, energy input, and ecological output are the core conditions, economic output is the marginal condition, and technological output is the uncertain condition. Among them, the configuration consistency is 0.802, and the coverage rate is 0.715, which can account for 80.2% of the samples. This configuration indicates that focusing on the interplay among investment openness, economic development, and ecological civilization construction within green marketing strategies can also lead to high-quality regional sustainable development. Marketing behaviors that are driven by ecological civilization often necessitate incentive investment policies and a conducive economic environment. Upon completion of the ecological economic civilization system, individuals will consciously engage in consumption and other economic activities within a green business environment, thereby promoting the enhancement of regional economic levels and ultimately achieving sustainable regional development. This path is exemplified by the central region, represented by Henan Province. In 2022, Henan’s GDP reached CNY 6.134505 trillion. It is among the more developed provinces in China, ranking first in the central region. Concurrently, Henan Province stands as the sole province in the country where an average annual energy consumption growth of 1.3% over the past decade has corresponded with an average annual economic growth of approximately 7%. Additionally, the province has a solid economic foundation, characterized by robust demand for green consumption and a favorable investment climate. As per the “Implementation Opinions on Accelerating the Establishment and Improvement of a Sound Green, Low-Carbon Circular Development Economic System”, issued in August 2021, Henan Province currently boasts 300 green factories, 15 green industrial parks, and 20 green supply chain management companies, all of which are mid-tier ranked nationwide. This places it first in the region. With a high economic level and significant green demand, Henan Province leads the central region in the ratio of green innovative technology R&D investment to GDP. Furthermore, the long-standing focus on green development has consistently enhanced the green and ecological synergy within Henan Province’s marketing environment, offering robust support for the region’s efficient and sustainable development.

4.2.6. “Input–Output” Linkage Model

The “input–output” linkage model corresponds to Configurations 3 and 4 in Table 9. In aggregate, the condition variables for this model include human input, capital input, energy input, technological output, economic output, and ecological output. Among these, human input, capital input, technological output, economic output, and ecological output constitute the core conditions, while energy input represents the marginal condition. The average consistency of configurations is 0.670, and the average coverage rate is 0.711, accounting for 71.1% of the samples. This indicates that focusing on the interplay between the input and output dimensions in green marketing strategies is a crucial initial step toward achieving high-quality, sustainable regional development. Significant investment in green technological innovation and the cultivation of technical expertise typically necessitates robust economic returns and an efficient, eco-friendly industrial system. Nonetheless, establishing green ecological industrial systems with high technological content requires advanced economic levels and capabilities in green technological innovation for iterative development. This will ultimately lead to high-quality regional development. This pattern is exemplified by the eastern region, specifically Jiangsu Province, Zhejiang Province, and Shanghai City. For instance, Jiangsu Province anticipates that high-tech industries will constitute nearly 45% of the total industrial output value for large-scale enterprises in 2022, with strategic emerging industries accounting for 33%. Concurrently, energy consumption and carbon emission intensity per unit of GDP have decreased by 48.3% and 43.4%, respectively, compared to the previous year. In 2022, Jiangsu Province’s ecological environment quality index reached its highest level in the past decade, making green development a hallmark of the province’s high-quality growth. As per the “Jiangsu Province Action Plan to Optimize the Business Environment”, released in August 2022, Jiangsu Province has developed three to five leading enterprises in green technology innovation, with an annual output value exceeding CNY 10 billion. The green consumption sector has also achieved a main business income of CNY 9000 billion. The value of high-tech output represents approximately 46% of the industrial scale for large-scale enterprises. The province is home to 312 enterprises classified as “specialized, special, and new”, ranking it first in the nation for this category, with the marketing environment index placing sixth nationally. With Jiangsu Province’s substantial economic aggregate and its favorable green tourism environment, the ratio of green GDP to total GDP is second-highest in the eastern region. This achievement in coordinating production output with environmental considerations within the green marketing strategy is crucial for attaining sustainable development in resource-scarce regions, presenting a model for sustainable development.

4.2.7. “Input”-Driven Model

The “input” linkage model corresponds to Configurations 5 and 6 in Table 9. In aggregate, the condition variables for this model include human input, capital investment, energy input, economic output, and ecological output, among which human input, capital investment, energy input, and economic output are the core conditions, while technological output is the marginal condition. The average configuration consistency is 0.620, and the average coverage rate is 0.662, accounting for 62.2% of the samples. This model indicates that a green marketing foundation, despite having a robust economic level and substantial resource endowment, cannot achieve a high level of regional sustainable development if the efficiency of green technological innovation is low. The representative of this configuration is the northeast region, comprising Heilongjiang Province, Jilin Province, and Liaoning Province. From the “double carbon” perspective, the northeast region is pivotal to China’s sustainable development, possessing dual economic and resource advantages. However, technological innovation lags, and stringent ecological and environmental regulations may impede the enhancement of sustainable development efficiency. Nonetheless, economic development must not be pursued at the expense of the environment. Green and low-carbon goals remain the direction for sustainable development in northeast China. It is anticipated that, under China’s approach to regional integration and cooperative development, the northeast region will ultimately synthesize the unique characteristics of each region to overcome the constraints of environmental regulations and technological limitations, thereby providing momentum for the coordinated and sustainable development of both the economy and the environment.

4.2.8. Between-Group Analysis

Although the consistency among the four models does not exceed a difference of 0.1, this suggests that there is no significant temporal effect. Nonetheless, a more detailed analysis of the temporal effects within the group indicated that the consistency levels between the four models hovered around 0.75 from 2011 to 2019, yet exhibited a collective decline in 2020, as depicted in Figure 4. The consistency between Mode 1 and Mode 4 is particularly low, at 0.7, 0.6, and 0.617. However, this pattern is concentrated in 2020, is not randomly distributed, and does not represent a benign deviation. The results of this inter-group analysis, for one, compensate for the deficiencies of previous fsQCA analyses that were based on cross-sectional data configurations and did not fully consider time effects; for another, they demonstrate that the four models have been well suited to the sample from 2011 to 2019. The decline in explanatory power in 2020 may be attributed to the outbreak of the novel coronavirus epidemic. Policy implementation remains a critical factor in fostering regional sustainable development. Consequently, the explanatory power of other conditional variables is likely to diminish. Nonetheless, given that the inter-group distance is less than 0.1, it does not compromise the overall explanatory power, ensuring that these results hold strong applicability for achieving sustainable development in high-quality regions under typical conditions.

4.2.9. Robustness Check

To ensure the robustness of the research data, this study employs a specific theoretical approach for conducting robustness testing. Initially, during the variable data calibration phase, the original calibration thresholds set at the 0.95, 0.5, and 0.05 quantiles were modified to the 0.30, 0.5, and 0.85 quantiles, and a component analysis using the R language for fsQCA was conducted. Subsequently, we adjusted the consistency threshold during the configuration analysis phase and increased the consistency threshold from 0.75 to 0.85 [92]. Then, we executed the fsQCA analysis and observed that between the two sets of findings, the consistency and coverage differed from the initial results. This minor difference of 0.02 suggests that the interpretability of the conclusions remains unchanged. Consequently, the configuration results presented in this study are robust.

5. Conclusion and Suggestions

5.1. Research Conclusions

This study has several limitations. Firstly, the necessary condition analysis indicates that none of the six variables within the green marketing mix framework, from an input–output perspective, are individually necessary for achieving high-level sustainable development in the region. However, the necessity levels for human input, technological output, and ecological output have been increasing steadily and may become essential for local sustainable development in future years. Ultimately, these three variables reflect the attraction of regional talent, the level of green technology innovation, and the efficiency of resource conversion.
Secondly, the implementation of the green marketing mix strategy has enhanced local sustainable development efficiency, yet significant regional heterogeneity remains. Static analysis indicates that overall sustainable development efficiency is higher in the eastern region compared to the western region. All ten provinces in the eastern region have achieved high levels of sustainable development efficiency; the central region exhibits higher efficiency, while the western region shows lower levels. The dynamic analysis index reveals that China’s overall sustainable development efficiency has experienced an “N”-shaped fluctuation over time, with a consistent increase observed in all provinces within the eastern region. Among the twelve provinces in the central region, the count of those achieving high-level sustainable development has risen from four to eight, whereas the western region has seen an addition of only two provinces.
Thirdly, the fsQCA results indicate three high-quality trajectories and one non-high-quality trajectory for achieving regional sustainable development, each representing distinct combinations of green marketing strategies across various regions. Concurrently, the consistency index for these four models has increased over recent years. Within the last decade, it has consistently remained above the high threshold of 0.75, demonstrating strong explanatory power. Among these, human input, technical level, and ecological output emerge as core elements across multiple configurations. Naturally, this diverse developmental trajectory underscores that regional sustainable development hinges not solely on a one-dimensional green marketing strategy but is the result of a synergistic effect among multiple factors.
Fourthly, during the identification of suboptimal sustainable development pathways in northeast China, both capital and energy investments exhibit a high necessity level, suggesting that these variables are pivotal in contributing to the region’s lower sustainable development levels. Consequently, when refining the green marketing strategy in northeast China, the government must consider the impeding impact of these variables on regional sustainable development to ensure advancement at a high level.
Lastly, while the temporal impact on the overall consistency of these models is not substantial, there was a notable decline in the consistency of the four configurations in 2020. This may be attributed to the COVID-19 pandemic, which may have elevated policy macro-control as a new core factor, thereby diminishing the explanatory power of other conditional variables.

5.2. Theoretical Contribution

Firstly, this study transitions the examination of factors influencing regional sustainable development from a singular focus on resource distribution and technological innovation to an input–output oriented approach grounded in the green marketing mix. Building upon prior research, this paper utilizes the 4P marketing mix theory and integrates China’s specific national conditions to develop an “input–output” conditional variable configuration analysis framework, encompassing two primary conditions and six secondary conditions. This analytical framework investigates the interlinkages and alignment between green marketing components at both the input and output interfaces, uncovers the intricate causal dynamics underpinning regional sustainable development, and aids in comprehending the catalysts of China’s high-quality development from an input–output vantage point.
Secondly, this paper pioneers the application of fuzzy set Qualitative Comparative Analysis (fsQCA) to the study of marketing and regional development, focusing on the configuration effects from a longitudinal temporal perspective. Prior research on the interplay between marketing and regional development presents two significant limitations: Firstly, the majority have employed regression analysis, neglecting the interplay between conditional and outcome variables. Secondly, the predominant use of fsQCA methods has been cross-sectional, concentrating on group consistency levels and overlooking the examination of regional heterogeneity within configuration coverage. This paper employs fsQCA to analyze the impact of the green marketing mix configuration on regional sustainable development from a temporal dimension perspective. Concurrently, a one-way analysis of variance and the Kruskal–Wallis H-test were utilized to ensure the robustness of the findings.

5.3. Countermeasures and Suggestions

Based on the aforementioned analysis, the following four strategies are proposed to optimize and enhance the efficiency of sustainable development across different regions.
Firstly, each region in China should leverage its distinctive marketing strategic strengths to foster a comprehensive enhancement in the efficiency of sustainable development nationwide. Analysis utilizing the DEA model indicates that the eastern region exhibits superior marketing strategy and input–output efficiency. The eastern region, exemplified by Jiangsu and Guangdong provinces, should act as a “leader” in the development chain, fully utilizing the “chain effect” to foster the development of the western region. Concurrently, the Inner Mongolia Autonomous Region and Sichuan Province, as pivotal nodes in the western region within the “Silk Road Economic Belt”, should expedite the development of energy and talent hubs, capitalize on the western region’s significant resource endowment, enhance regional economic integration, and ensure that sustainable development efficiency is enhanced effectively and promptly. It is important to continue to bolster investment in emerging green industries, specialized and innovative enterprises, and university research platforms in central region provinces, to establish an advanced talent system, and to augment the development of “talent highlands” support, harness its geographic advantages, spearhead the dissemination of green development benefits, construct a “technology + ecology” marketing system, and attain a high standard of sustainable development.
Secondly, the establishment of an advanced open market system should be expedited, and the foreign investment climate should be refined. Capital is a crucial element for high-quality economic development and a keystone for establishing a technological hub and attracting talent. The central region, situated in China’s interior, should expand its international engagement, invigorate the railway and aviation sectors, and leverage transportation hubs like Zhengzhou Railway Station and Wuhan Tianhe Airport as gateways to enhance external interaction, foster energy conservation, and lower emissions and carbon footprints. Concurrently, we should actively engage in the global division of labor, accumulate technological expertise, assert market leadership, foster a broader and more profound openness, and continuously refine the strategy for the composition of marketing elements, thereby enhancing the level of sustainable development.
Thirdly, it is necessary to focus on technological innovation to enhance economies of scale. The resource–technology alignment indicates that the western region can capitalize on its substantial resource wealth to boost investment in green technological innovation and leverage technology to optimize the integration of green marketing elements. Sichuan Province, with its advanced economic development, substantial energy sector, and numerous higher education and research institutions, should harness the spatial “spillover effect” to stimulate the growth of regions such as Inner Mongolia, Xinjiang, and Yunnan, establishing comprehensive industrial, supply, and value chains, and enhancing the marketing scale effect.
Fourthly, market regulation should be fully leveraged to enhance the business environment and the rate of resource conversion. The northeast region can utilize the “Northeast Asia Cooperation Center Hub” and the core logistics system characterized by “three horizontal and one vertical” to facilitate the strategic planning of the market economy. Concurrently, throughout the development process, all provinces should actively heed the national initiative to “revitalize the Northeast”, fully capitalize on the support provided by “regional economic integration” efforts, and establish new avenues for international engagement. The northeast region should also expedite the establishment of a talent development system and solidify the underpinnings of green technology innovation hubs to maximize market regulatory efficacy. Concurrently, northeast China’s provinces and municipalities should develop carbon reduction policies tailored to their specific conditions, progressively refine green marketing strategies amidst the ongoing optimization of the market system, and persistently enhance the efficiency of sustainable development.

5.4. Limitations and Prospects

This study has several limitations. Firstly, this study primarily examines provincial data from China over the period 2011 to 2022. The findings can largely reflect the current impact of different combinations of green marketing components on the sustainable development of various parts of China. The COVID-19 pandemic occurred in the studied period of 2011 to 2022; countries around the world had different ways of dealing with the pandemic, resulting in certain differences in the situation reflected by the relevant data in individual years. The generalizability of the research findings thus may be limited. Therefore, future research should extend the timeframe and broaden the geographical scope of data collection, include data from various countries and regions, and enlarge the sample size to enhance the applicability of the conclusions.
Secondly, this study utilized the fsQCA method, which has significantly contributed to uncovering the intricate combinatorial relationships between green marketing and sustainable development. Through fsQCA, the various combinations of factors that influence different pathways to sustainable development can be identified. Nonetheless, fsQCA has limitations regarding its capacity to quantify the precise effects of external factors on these relationships. To address this limitation, future studies might integrate more sophisticated quantitative analytical methods, such as regression analysis, to explore the specific influence of external factors on the relationship. By integrating quantitative and qualitative research methodologies, a more thorough and comprehensive understanding can be obtained, providing a robust theoretical and empirical basis for devising more effective green marketing strategies and fostering local sustainable development.

Author Contributions

Conceptualization, W.L.; methodology, W.L. and H.Z.; data curation, T.H. and J.Z.; writing—original draft preparation, J.Z.; supervision, L.M. and Y.S. All authors have read and agreed to the published version of the manuscript.

Funding

National Natural Science Foundation of China (71962028, Hao Ting), Henan Province Soft Science Program Research Project (232400410146, Zhu Hanyu), Henan University Philosophy and Social Science Innovation Team Funding Project (2020-CXTD-12, Yang Zhilin; 2024-CXTD-10, Li Gang), Key Research Institute of Humanities and Social Sciences at Universities of Inner Mongolia Autonomous Region (2024, Li Wen—Research Center of Industrial Informationization and Innovation in Inner Mongolia University of Science and Technology).

Institutional Review Board Statement

Not applicable.

Informed Consent Statement

Not applicable.

Data Availability Statement

The data used to support the findings of this study are available from the corresponding author upon request.

Conflicts of Interest

The authors declare no conflicts of interest.

References

  1. Allen, C.; Nejdawi, R.; El-Baba, J.; Hamati, K.; Metternicht, G.; Wiedmann, T. Indicator-based assessments of progress towards the sustainable development goals (SDGs): A case study from the Arab region. Sustain. Sci. 2017, 12, 975–989. [Google Scholar] [CrossRef]
  2. Aghahosseini, A.; Bogdanov, D.; Breyer, C. Towards sustainable development in the MENA region: Analysing the feasibility of a 100% renewable electricity system in 2030. Energy Strategy Rev. 2020, 28, 459–466. [Google Scholar] [CrossRef]
  3. Meramveliotakis, G.; Manioudis, M. Default Nudge and Street Lightning Conservation: Towards a Policy Proposal for the Current Energy Crisis. J. Knowl. Econ. 2023, 1–10. [Google Scholar] [CrossRef]
  4. Singh, J.S. Sustainable Development of the Indian Himalayan Region: Linking Ecological and Economic Concerns; Current Science: Bangalore, India, 2006; pp. 784–788. [Google Scholar]
  5. Lorente, D.B.; Mohammed, K.S.; Cifuentes-Faura, J.; Shahzad, U. Dynamic connectedness among climate change index, green financial assets and renewable energy markets: Novel evidence from sustainable development perspective. Renew. Energy 2023, 204, 94–105. [Google Scholar] [CrossRef]
  6. Nath, P.; Siepong, A. Green marketing capability: A configuration approach towards sustainable development. J. Clean. Prod. 2022, 354, 131727. [Google Scholar] [CrossRef]
  7. Ismail, I.J.; Amani, D.; Changalima, I.A. Strategic green marketing orientation and environmental sustainability in sub-Saharan Africa: Does green absorptive capacity moderate? Evidence from Tanzania. Heliyon 2023, 9, e18373. [Google Scholar] [CrossRef]
  8. Chaaben, N.; Elleuch, Z.; Hamdi, B.; Kahouli, B. Green economy performance and sustainable development achievement: Empirical evidence from Saudi Arabia. Environ. Dev. Sustain. 2024, 26, 549–564. [Google Scholar] [CrossRef] [PubMed]
  9. Gurău, C.; Ranchhod, A. International green marketing: A comparative study of British and Romanian firms. Int. Mark. Rev. 2005, 22, 547–561. [Google Scholar] [CrossRef]
  10. Negi, R.; Gupta, A.K.; Gaur, V. Effect of green marketing orientation dimensions on green innovation and organizational performance: A mediation-moderation analysis. Bus. Strategy Environ. 2023, 32, 5435–5458. [Google Scholar] [CrossRef]
  11. Rex, E.; Baumann, H. Beyond ecolabels: What green marketing can learn from conventional marketing. J. Clean. Prod. 2007, 15, 567–576. [Google Scholar] [CrossRef]
  12. Papadas, K.K.; Avlonitis, G.J.; Carrigan, M.; Piha, L. The interplay of strategic and internal green marketing orientation on competitive advantage. J. Bus. Res. 2019, 104, 632–643. [Google Scholar] [CrossRef]
  13. Kirchoff, J.F.; Koch, C.; Nichols, B.S. Stakeholder perceptions of green marketing: The effect of demand and supply integration. Int. J. Phys. Distrib. Logist. Manag. 2011, 41, 684–696. [Google Scholar] [CrossRef]
  14. Lim, W.M.; Ting, D.H. Green marketing: Issues, developments and avenues for future research. Int. J. Glob. Environ. Issues 2011, 11, 139–156. [Google Scholar] [CrossRef]
  15. Jain, S.; Basu, S.; Dwivedi, Y.K. Green brand identity and B2B channel partners’ tactical green marketing orientation: Moderating effect of brand governance. Ind. Mark. Manag. 2024, 119, 218–237. [Google Scholar] [CrossRef]
  16. Ahmed, R.R.; Streimikiene, D.; Qadir, H.; Streimikis, J. Effect of green marketing mix, green customer value, and attitude on green purchase intention: Evidence from the USA. Environ. Sci. Pollut. Res. 2023, 30, 11473–11495. [Google Scholar] [CrossRef] [PubMed]
  17. Dangelico, R.M.; Pujari, D.; Pontrandolfo, P. Green product innovation in manufacturing firms: A sustainability-oriented dynamic capability perspective. Bus. Strategy Environ. 2017, 26, 490–506. [Google Scholar] [CrossRef]
  18. Roh, T.; Noh, J.; Oh, Y.; Park, K.-S. Structural relationships of a firm’s green strategies for environmental performance: The roles of green supply chain management and green marketing innovation. J. Clean. Prod. 2022, 356, 131877. [Google Scholar] [CrossRef]
  19. Duarte, L.O.; Vasques, R.A.; Filho, H.F.; Baruque-Ramos, J.; Nakano, D. From fashion to farm: Green marketing innovation strategies in the Brazilian organic cotton ecosystem. J. Clean. Prod. 2022, 360, 132196. [Google Scholar] [CrossRef]
  20. Noonan, K.E.; Coleman, L.J. Marketing to green communities: How to successfully reach the green consumer. J. Mark. Anal. 2013, 1, 18–31. [Google Scholar] [CrossRef]
  21. Mentes, M. Sustainable development economy and the development of green economy in the European Union. Energy Sustain. Soc. 2023, 13, 32. [Google Scholar] [CrossRef]
  22. Hennion, K.E.; Kinnear, T.C. Ecological Marketing; American Marketing Association: Chicago, IL, USA, 1976. [Google Scholar]
  23. Peattie, K. Green Marketing; The M&E Handbook Series; Pitman: London, UK, 1992. [Google Scholar]
  24. Li, G.; Wu, H.; Sethi, S.P.; Zhang, X. Contracting green product supply chains considering marketing efforts in the circular economy era. Int. J. Prod. Econ. 2021, 234, 108041. [Google Scholar] [CrossRef]
  25. Fuller, D.A. Sustainable Marketing: Managerial e Ecological Issues; SAGE Publications, Inc.: London, UK, 1999. [Google Scholar]
  26. Zhu, Q.; Sarkis, J. Green marketing and consumerism as social change in China: Analyzing the literature. Int. J. Prod. Econ. 2016, 181, 289–302. [Google Scholar] [CrossRef]
  27. Abbas, J.; Khan, S.M. Green knowledge management and organizational green culture: An interaction for organizational green innovation and green performance. J. Knowl. Manag. 2023, 27, 1852–1870. [Google Scholar] [CrossRef]
  28. Polonsky, M.J.; Rosenberger, P.J. III. Reevaluating green marketing: A strategic approach. Bus. Horiz. 2001, 44, 21. [Google Scholar]
  29. Welford, R.; Ytterhus, B. Sustainable development and tourism destination management: A case study of the Lillehammer region, Norway. Int. J. Sustain. Dev. World Ecol. 2004, 11, 410–422. [Google Scholar] [CrossRef]
  30. Chaudhary, S.; Kumar, A.; Pramanik, M.; Negi, M.S. Land evaluation and sustainable development of ecotourism in the Garhwal Himalayan region using geospatial technology and analytical hierarchy process. Environ. Dev. Sustain. 2021, 24, 2225–2266. [Google Scholar] [CrossRef]
  31. Bandari, R.; Moallemi, E.A.; Kharrazi, A.; Trogrlić, R.Š.; Bryan, B.A. Transdisciplinary approaches to local sustainability: Aligning local governance and navigating spillovers with global action towards the Sustainable Development Goals. Sustain. Sci. 2024, 1–20. [Google Scholar] [CrossRef]
  32. Manioudis, M.; Meramveliotakis, G. Broad Strokes towards a Grand Theory in the Analysis of Sustainable Development: A Return to the Classical Political Economy. New Political Econ. 2022, 27, 866–878. [Google Scholar] [CrossRef]
  33. Hermelin, B.; Trygg, K. Local approaches to sustainable development with case studies from Sweden. Scott. Geogr. J. 2018, 134, 97–102. [Google Scholar] [CrossRef]
  34. Kusakabe, E. Social capital networks for achieving sustainable development. Local Environ. 2012, 17, 1043–1062. [Google Scholar] [CrossRef]
  35. Sinha, S.; Bhattacharya, R.N.; Banerjee, R. Surface iron ore mining in eastern India and local level sustainability. Resour. Policy 2007, 32, 57–68. [Google Scholar] [CrossRef]
  36. Wyrwa, J.; Jędrzejczak-Gas, J.; Barska, A.; Wojciechowska-Solis, J. Sustainable Energy Development and Sustainable Social Development in EU Countries. Energies 2023, 16, 6556. [Google Scholar] [CrossRef]
  37. Ningrum, D.; Raven, R.; Malekpour, S.; Moallemi, E.A.; Bryan, B.A. Transformative potential in sustainable development goals engagement: Experience from local governance in Australia. Glob. Environ. Change 2023, 80, 102670. [Google Scholar] [CrossRef]
  38. Chan, H.K.; He, H.; Wang, W.Y. Green marketing and its impact on supply chain management in industrial markets. Ind. Mark. Manag. 2012, 41, 557–562. [Google Scholar] [CrossRef]
  39. Carp, M.; Păvăloaia, L.; Afrăsinei, M.-B.; Georgescu, I.E. Is sustainability reporting a business strategy for firm’s growth? Empirical study on the Romanian capital market. Sustainability 2019, 11, 658. [Google Scholar] [CrossRef]
  40. Andiç, E.; Yurt, Ö.; Baltacıoğlu, T. Green supply chains: Efforts and potential applications for the Turkish market. Resour. Conserv. Recycl. 2012, 58, 50–68. [Google Scholar] [CrossRef]
  41. McCarthy, M.; de Boer, M.; O’Reilly, S.; Cotter, L. Factors influencing intention to purchase beef in the Irish market. Meat Sci. 2003, 65, 1071–1083. [Google Scholar] [CrossRef]
  42. Tseng, S.C.; Hung, S.W. A framework identifying the gaps between customers’ expectations and their perceptions in green products. J. Clean. Prod. 2013, 59, 174–184. [Google Scholar] [CrossRef]
  43. Peattie, K.; Peattie, S. Social marketing: A pathway to consumption reduction? J. Bus. Res. 2009, 62, 260–268. [Google Scholar] [CrossRef]
  44. Armstrong Soule, C.A.; Reich, B.J. Less is more: Is a green demarketing strategy sustainable? J. Mark. Manag. 2015, 31, 1403–1427. [Google Scholar] [CrossRef]
  45. Bombiak, E.; Marciniuk-Kluska, A. Green human resource management as a tool for the sustainable development of enterprises: Polish young company experience. Sustainability 2018, 10, 1739. [Google Scholar] [CrossRef]
  46. Nikonova, N.; Mottaeva, A. The role of green marketing in regional sustainability. E3S Web Conf. 2023, 402, 08042. [Google Scholar] [CrossRef]
  47. Ginsberg, J.M.; Bloom, P.N. Choosing the right green marketing strategy. MIT Sloan Manag. Rev. 2004, 46, 79–84. [Google Scholar]
  48. Dao, V.; Langella, I.; Carbo, J. From green to sustainability: Information Technology and an integrated sustainability framework. J. Strateg. Inf. Syst. 2011, 20, 63–79. [Google Scholar] [CrossRef]
  49. Yildiz Çankaya, S.; Sezen, B. Effects of green supply chain management practices on sustainability performance. J. Manuf. Technol. Manag. 2019, 30, 98–121. [Google Scholar] [CrossRef]
  50. Milán-García, J.; Uribe-Toril, J.; Ruiz-Real, J.L.; Valenciano, J.d.P. Sustainable local development: An overview of the state of knowledge. Resources 2019, 8, 31. [Google Scholar] [CrossRef]
  51. Bruni, M.E.; Guerriero, F.; Patitucci, V. Benchmarking sustainable development via data envelopment analysis: An Italian case study. Int. J. Environ. Res. 2011, 5, 47–56. [Google Scholar]
  52. Solangi, Y.A.; Longsheng, C.; Shah, S.A.A. Assessing and overcoming the renewable energy barriers for sustainable development in Pakistan: An integrated AHP and fuzzy TOPSIS approach. Renew. Energy 2021, 173, 209–222. [Google Scholar] [CrossRef]
  53. Barrera-Roldán, A.; Saldívar-Valdés, A. Proposal and application of a Sustainable Development Index. Ecol. Indic. 2002, 2, 251–256. [Google Scholar] [CrossRef]
  54. Blancard, S.; Hoarau, J.-F. A new sustainable human development indicator for small island developing states: A reappraisal from data envelopment analysis. Econ. Model. 2013, 30, 623–635. [Google Scholar] [CrossRef]
  55. Dursun, M.; Goker, N.; Tulek, B.D. Efficiency analysis of organized industrial zones in Eastern Black Sea Region of Turkey. Socio-Econ. Plan. Sci. 2019, 68, 100659. [Google Scholar] [CrossRef]
  56. Kara, K.; Yalçın, G.C.; Acar, A.Z.; Simic, V.; Konya, S.; Pamucar, D. The MEREC-AROMAN method for determining sustainable competitiveness levels: A case study for Turkey. Socio-Econ. Plan. Sci. 2024, 91, 101762. [Google Scholar] [CrossRef]
  57. Şahin, F. An Anaylsis on the Comparison of Green Growth indices: The Case of Turkey and Eu Countries. Doctoral Dissertation, Marmara Universitesi, Istanbul, Türkiye, 2022. [Google Scholar]
  58. Kutty, A.A.; Kucukvar, M.; Abdella, G.M.; Bulak, M.E.; Onat, N.C. Sustainability performance of European smart cities: A novel DEA approach with double frontiers. Sustain. Cities Soc. 2022, 81, 103777. [Google Scholar] [CrossRef]
  59. Sueyoshi, T.; Yuan, Y. China’s regional sustainability and diversified resource allocation: DEA environmental assessment on economic development and air pollution. Energy Econ. 2015, 49, 239–256. [Google Scholar] [CrossRef]
  60. Tsai, W.-H.; Lee, H.-L.; Yang, C.-H.; Huang, C.-C. Input-output analysis for sustainability by using DEA method: A comparison study between European and Asian countries. Sustainability 2016, 8, 1230. [Google Scholar] [CrossRef]
  61. Zhou, H.; Yang, Y.; Chen, Y.; Zhu, J. Data envelopment analysis application in sustainability: The origins, development and future directions. Eur. J. Oper. Res. 2018, 264, 1–16. [Google Scholar] [CrossRef]
  62. Rebolledo-Leiva, R.; Vásquez-Ibarra, L.; Feijoo, G.; Moreira, M.T.; González-García, S. Determining key indicators for the assessment of sustainable development in Spanish cities under a multi-criteria approach. Clean. Prod. Lett. 2023, 5, 100046. [Google Scholar] [CrossRef]
  63. Santana, N.B.; do Nascimento Rebelatto, D.A.; Périco, A.E.; Mariano, E.B. Sustainable development in the BRICS countries: An efficiency analysis by data envelopment. In Managing Organizations for Sustainable Development in Emerging Countries; Routledge: London, UK, 2017; pp. 65–78. [Google Scholar]
  64. Ragin, C.C. The Comparative Method: Moving beyond Qualitative and Quantitative Strategies; University of California Press: Berkeley, CA, USA, 2014. [Google Scholar]
  65. Qureshi, I.H.; Mehraj, D. Identifying the factors of internal green marketing: A scale development and psychometric evaluation approach. Int. J. Manpow. 2022, 43, 786–804. [Google Scholar] [CrossRef]
  66. He, Z.; Zhou, Y.; Wang, J.; Li, C.; Wang, M.; Li, W. The impact of motivation, intention, and contextual factors on green purchasing behavior: New energy vehicles as an example. Bus. Strategy Environ. 2021, 30, 1249–1269. [Google Scholar] [CrossRef]
  67. Lam, J.S.; Li, K.X. Green port marketing for sustainable growth and development. Transp. Policy 2019, 84, 73–81. [Google Scholar] [CrossRef]
  68. Qu, X.; Qin, X.; Hu, H. Research on the Improvement Path of Regional Green Technology Innovation Efficiency in China Based on fsQCA Method. Sustainability 2023, 15, 3190. [Google Scholar] [CrossRef]
  69. Prokop, V.; Hajek, P.; Stejskal, J. Configuration paths to efficient national innovation ecosystems. Technol. Forecast. Soc. Change 2021, 168, 120787. [Google Scholar] [CrossRef]
  70. Andrijauskiene, M.; Loannidis, D.; Dumciuviene, D. Towards AI-based R&I investment efficiency evaluation: Case of EU. In Proceedings of the ISPIM Conference Proceedings: The International Society for Professional Innovation Management (ISPIM), Copenhagen, Denmark, 5–8 June 2022. [Google Scholar]
  71. Kammen, D.M.; Sunter, D.A. City-integrated renewable energy for urban sustainability. Science 2016, 352, 922–928. [Google Scholar] [CrossRef] [PubMed]
  72. Östberg, K.; Hasselström, L.; Håkansson, C. Non-market valuation of the coastal environment–Uniting political aims, ecological and economic knowledge. J. Environ. Manag. 2012, 110, 166–178. [Google Scholar] [CrossRef] [PubMed]
  73. Tone, K. A slacks-based measure of efficiency in data envelopment analysis. Eur. J. Oper. Res. 2001, 130, 498–509. [Google Scholar] [CrossRef]
  74. Tone, K.; Tsutsui, M. Dynamic DEA: A slacks-based measure approach. Omega 2010, 38, 145–156. [Google Scholar] [CrossRef]
  75. Ibrahim, M.D. Efficiency and productivity analysis of innovation, human capital, environmental, and economic sustainability nexus: Case of MENA countries. Environ. Sci. Pollut. Res. 2023, 30, 34394–34405. [Google Scholar] [CrossRef] [PubMed]
  76. Debbarma, J.; Choi, Y.; Yang, F.; Lee, H. Exports as a new paradigm to connect business and information technology for sustainable development. J. Innov. Knowl. 2022, 7, 100233. [Google Scholar] [CrossRef]
  77. Fiss, P.C. Building better causal theories: A fuzzy set approach to typologies in organization research. Acad. Manag. J. 2011, 54, 393–420. [Google Scholar] [CrossRef]
  78. Schneider, C.Q.; Rohlfing, I. Case studies nested in fuzzy-set QCA on sufficiency: Formalizing case selection and causal inference. Sociol. Methods Res. 2016, 45, 526–568. [Google Scholar] [CrossRef]
  79. Škare, M.; Gavurova, B.; Porada-Rochon, M. Digitalization and carbon footprint: Building a path to a sustainable economic growth. Technol. Forecast. Soc. Change 2024, 199, 123045. [Google Scholar] [CrossRef]
  80. Wang, M.; Feng, C. The consequences of industrial restructuring, regional balanced development, and market-oriented reform for China’s carbon dioxide emissions: A multi-tier meta-frontier DEA-based decomposition analysis. Technol. Forecast. Soc. Change 2021, 164, 120507. [Google Scholar] [CrossRef]
  81. Wu, J.; Ge, Z.; Han, S.; Xing, L.; Zhu, M.; Zhang, J.; Liu, J. Impacts of agricultural industrial agglomeration on China’s agricultural energy efficiency: A spatial econometrics analysis. J. Clean. Prod. 2020, 260, 121011. [Google Scholar] [CrossRef]
  82. Ma, Q.; Murshed, M.; Khan, Z. The nexuses between energy investments, technological innovations, emission taxes, and carbon emissions in China. Energy Policy 2021, 155, 112345. [Google Scholar] [CrossRef]
  83. Newbery, D.M. Towards a green energy economy? The EU Energy Union’s transition to a low-carbon zero subsidy electricity system–Lessons from the UK’s Electricity Market Reform. Appl. Energy 2016, 179, 1321–1330. [Google Scholar] [CrossRef]
  84. Li, M.; Gao, X. Implementation of enterprises’ green technology innovation under market-based environmental regulation: An evolutionary game approach. J. Environ. Manag. 2022, 308, 114570. [Google Scholar] [CrossRef] [PubMed]
  85. Hong, Z.; Guo, X. Green product supply chain contracts considering environmental responsibilities. Omega 2019, 83, 155–166. [Google Scholar] [CrossRef]
  86. Mukherjee, A.; Carvalho, M. Dynamic decision making in a mixed market under cooperation: Towards sustainability. Int. J. Prod. Econ. 2021, 241, 108270. [Google Scholar] [CrossRef]
  87. Di Maio, F.; Rem, P.C.; Baldé, K.; Polder, M. Measuring resource efficiency and circular economy: A market value approach. Resour. Conserv. Recycl. 2017, 122, 163–171. [Google Scholar] [CrossRef]
  88. Lim, S.; Oh, K.W.; Zhu, J. Use of DEA cross-efficiency evaluation in portfolio selection: An application to Korean stock market. Eur. J. Oper. Res. 2014, 236, 361–368. [Google Scholar] [CrossRef]
  89. Duşa, A. QCA with R: A Comprehensive Resource; Springer: Berlin/Heidelberg, Germany, 2018. [Google Scholar]
  90. Rihoux, B.; Ragin, C. Configurational Comparative Methods: Qualitative Comparative Analysis (QCA) and Related Techniques; Sage Publications: Thousand Oaks, CA, USA, 2008. [Google Scholar]
  91. Schneider, C.Q. Realists and Idealists in QCA. Political Anal. 2018, 26, 246–254. [Google Scholar] [CrossRef]
  92. Kim, M. Many roads lead to Rome: Implications of geographic scope as a source of isolating mechanisms. J. Int. Bus. Stud. 2013, 44, 898–921. [Google Scholar] [CrossRef]
Figure 1. Green marketing input–output element configuration diagram.
Sustainability 16 04644 g001
Figure 2. Annual average of sustainable development efficiency in the eastern, central, western and northeastern regions.
Sustainability 16 04644 g002
Figure 3. Change trends of China’s overall development ML, EC, and TC indices from 2011 to 2022.
Sustainability 16 04644 g003
Figure 4. Consistency changes between groups.
Sustainability 16 04644 g004
Table 1. Regional sustainable development efficiency input–output index evaluation system based on DEA-Malmquist model.
Evaluation ObjectivesVariablesLevel 1 IndicatorsLevel 2 IndicatorsUnit
Based on the provincial perspective
Evaluation of the efficiency of regional sustainable development
InputManpowerFull-time equivalent of R&D personnelPerson/Year
CapitalR&D fundingCNY ten thousand
EnergyThe amount of investment in industrial pollution control has been completedCNY ten thousand
Electricity consumptionGWh
OutputInnovationNumber of patent applicationsPiece
EconomySales revenue of green productsCNY ten thousand
EcologyRegional green coverage%
UnexpectedaccidentalTotal industrial sulfur dioxide emissionsTon
Total amount of industrial wastewater dischargedTen thousand tons
General industrial solid waste generatedTen thousand tons
Table 2. fsQCA variable table.
VariablesLevel 1 IndicatorsVariable
Symbol
Level 2 IndicatorsUnit
Result VariablesSustainability IndexG
Condition VariablesManpowerAFull-time equivalent of R&D personnelPerson/Year
CapitalBR&D fundingCNY ten thousand
EnergyCThe amount of investment in industrial pollution control has been completedCNY ten thousand
Electricity consumptionGWh
InnovationDNumber of patent applicationsPiece
EconomyESales revenue of green productsCNY ten thousand
EcologyFRegional green coverage%
Table 3. China’s regional division range in 2022.
Region
Eastern RegionBeijing, Tianjin, Hebei, Shanghai, Jiangsu, Zhejiang, Fujian, Shandong, Guangdong, Hainan
Central RegionShanxi, Anhui, Jiangxi, Henan, Hubei, Hunan
Western RegionInner Mongolia, Guangxi, Chongqing, Sichuan, Guizhou, Yunnan, Shaanxi, Gansu, Ningxia, Qinghai, Xinjiang, Tibet
Northeast RegionHeilongjiang, Jilin, Liaoning
Table 4. Indicator correlation analysis table.
IndexFull-Time Equivalent of R&D PersonnelR&D FundingElectricity ConsumptionThe Amount of Investment in Industrial Pollution Control Has Been CompletedNumber of Patent ApplicationsSales Revenue of Green ProductsRegional Green Coverage
Full-time equivalent of R&D personnel1
R&D funding0.9671 *1
Electricity consumption0.8573 *0.8767 *1
The amount of investment in industrial pollution control has been completed0.3980 *0.4095 *0.5358 *1
Number of patent applications0.9511 *0.9455 *0.8007 *0.2815 *1
Sales revenue of green products0.9666 *0.9727 *0.8373 *0.3329 *0.9606 *1
Regional green coverage0.3349 *0.3669 *0.3876 *0.1549 *0.3298 *0.3551 *1
* = p < 0.01.
Table 5. Sustainable development efficiency value of 31 provinces in China from 2011 to 2022.
Year\ProvinceBeijingTianjinHebeiShanxiInner MongoliaLiaoningJilinHeilongjiangShanghaiJiangsu
20110.3570.5890.0900.2220.3740.1701.0000.5100.4020.077
20120.2880.5730.0900.1760.3630.1460.4630.5240.3970.073
20130.2110.6560.0710.1240.2540.1170.6930.3830.4370.065
20140.1880.6340.0610.1400.1590.1080.3920.3840.4170.062
20150.0610.5990.0730.1570.1700.1270.3900.3650.4340.061
20160.0710.5850.0790.1400.1590.1730.4000.3560.4160.047
20170.2880.5610.0640.1180.1170.1170.4060.3790.4040.042
20180.7610.4900.0510.1010.1070.1600.4210.3720.5130.051
20191.0000.4670.0480.0770.0900.1071.0000.3930.5140.047
20200.9570.5360.0610.0570.1040.0960.4480.3270.8030.044
20211.0000.6510.0630.0880.0630.0820.2470.2180.5810.093
20220.9990.5050.0610.0870.0440.0751.0000.1840.4700.023
Average0.5150.5710.0680.1240.1670.1230.5720.3660.4820.057
Year\ProvinceZhejiangAnhuiFujianJiangxiShandongHenanHubeiHunanGuangdongGuangxi
20110.2480.1660.2170.0110.0660.1760.2570.2350.1320.309
20120.2350.1670.1320.0340.0540.1770.2110.2090.1230.317
20130.2250.1390.1010.0730.0450.1260.1880.1980.1140.245
20140.1681.0000.1460.0980.0430.1140.1950.2020.1130.204
20150.1551.0000.1370.0990.0430.1370.2200.1810.1030.236
20160.1091.0000.1060.1040.0320.0990.1670.1860.0730.212
20170.1170.1530.1020.0710.0300.0930.1620.1850.0770.200
20180.1050.0970.0850.0520.0380.0810.1550.1870.0810.196
20190.1030.0760.0760.0630.0350.0650.1330.1790.1380.198
20200.1230.0960.0880.0560.0390.0850.1170.2330.9930.207
20210.1000.0750.0880.0470.0230.0950.0940.1601.0000.137
20220.0900.0500.0920.0360.0410.9910.0730.0961.0000.129
Average0.1480.3350.1140.0620.0410.1870.1640.1880.3290.216
Year\ProvinceHainanChongqingSichuanGuizhouNingxiaYunnanTibetShanxiGansuQinghaiXinjiang
20110.9850.3230.1800.3820.6070.2130.9390.2660.5990.9680.387
20120.9950.2570.1410.3300.4730.1650.9690.2110.4860.9710.331
20130.9790.2610.1230.2640.3920.1710.1310.1890.4100.9240.215
20140.9210.3150.1210.2760.3790.1660.9620.1760.4440.6390.209
20150.9970.3310.1320.2850.3980.1870.8470.1690.6840.7250.226
20160.9910.3590.1180.2860.2550.1831.0000.1700.4600.4560.163
20170.9950.3500.1080.2600.2610.2140.9020.1560.4020.7730.134
20180.9590.3440.0940.2010.2490.1500.7430.1610.3810.4540.130
20190.9750.3200.0790.1630.2160.1351.0000.1200.3530.3670.114
20200.9800.2920.0660.1420.1790.1110.8550.1180.3971.0001.000
20210.9990.3520.0740.1270.1770.1131.0000.1340.3260.6870.117
20221.0000.9970.0630.1470.1930.8821.0000.1140.2990.5880.111
Average0.9810.3750.1080.2390.3150.2240.8410.1650.4370.7130.261
Table 6. Input–output efficiency ML index and its decomposition items for 31 provinces.
ProvinceMLECTCProvinceMLECTCProvinceMLECTC
Beijing1.0041.0021.002Zhejiang1.1240.9341.337Hainan1.0031.0021.002
Tianjin1.0080.9621.049Anhui1.3701.1231.368Chongqing1.1371.0261.118
Hebei0.9831.4061.159Fujian0.9801.0751.064Sichuan1.0791.3311.232
Shanxi1.0631.2161.183Jiangxi1.2601.1741.377Guizhou1.0011.1891.133
Inner Mongolia1.4391.4111.273Shandong1.4411.3381.222Yunnan1.3891.7571.131
Liaoning0.9971.3161.136Henan1.4781.7051.124Tibet1.0001.0001.000
Jilin1.2241.1951.171Hubei1.1801.1451.239Shanxi0.9551.1581.086
Heilongjiang0.9401.1531.064Hunan1.3141.3571.358Gansu1.0951.1831.151
Shanghai1.0030.9491.080Guangdong1.1591.1701.336Qinghai1.1141.4201.137
Jiangsu1.9151.4192.021Guangxi1.5871.6051.447Ningxia0.9521.0761.054
Xinjiang1.5121.4761.407Eastern1.3621.1251.227Western1.1911.3021.181
Central1.2781.2861.275Northeast1.0541.2211.124Total1.1841.2351.210
Table 7. Calibration variable plot.
Variable TypeSymbolCalibration
Full Affiliation
(0.95)
Intersections
(0.5)
Total Non-Affiliation
(0.05)
Result
Variables
Sustainability IndexG0.990.180.05
Condition VariablesManpowerA43,368.3147,828.001765.95
CapitalB15,399,576.612,107,772.0080,999.30
EnergyC249.2681.5410.34
InnovationD116,442.2012,098.00442.10
EconomyE267,477,897.6031,826,110.00985,848.85
EcologyF45.5540.3032.71
Table 8. Necessary condition analysis.
Condition VariablesG~G
ConsistencyCoverageInter-GroupWithin-GroupConsistencyCoverageInter-GroupWithin-Group
A0.6560.7740.0800.0510.5210.6050.0700.031
~A0.6330.6410.0790.0660.6980.6320.0590.096
B0.6440.7140.0760.0580.7110.7120.0860.078
~B0.6590.6120.0110.0770.8290.6980.0310.067
C0.6310.8110.0510.0650.7480.5990.0910.045
~C0.6220.8020.0210.0180.6350.6050.0710.068
D0.6380.6150.0140.0360.7450.6310.0340.076
~D0.6790.7130.0310.0890.8110.5120.0510.029
E0.6660.8970.0270.0540.7510.7640.0770.034
~E0.6570.6520.0510.0510.6580.7250.0110.041
F0.6990.7630.0230.0320.5960.6540.0730.062
~F0.6710.5910.0180.0210.6410.5910.0980.071
Table 9. Configuration analysis results.
Condition VariablesSustainable Development~Sustainable Development
Configuration 1Configuration 2Configuration 3Configuration 4Configuration 5Configuration 6
Manpower (A)
Capital (B)
Energy (C)
Innovation (D)
Economy (E)
Ecology (F)
Consistency0.6220.8020.6210.7180.6350.605
PRI0.7380.7150.8140.7360.7450.751
Coverage0.6790.7130.7320.6890.7110.612
Unique Coverage0.6660.5970.6270.6540.7510.764
Within-group0.0570.0520.0510.0410.0580.025
Inter-group0.0990.0630.0230.0320.0960.054
Overall PRI0.798
Overall Consistency0.658
Overall Coverage0.658
Note: ● indicates the core condition; ⊗ indicates the condition is missing; blank indicates that the condition is not sure to exist.
Disclaimer/Publisher’s Note: The statements, opinions and data contained in all publications are solely those of the individual author(s) and contributor(s) and not of MDPI and/or the editor(s). MDPI and/or the editor(s) disclaim responsibility for any injury to people or property resulting from any ideas, methods, instructions or products referred to in the content.

