Article

Examination of the Physical–Mechanical Properties of Sustainable Self-Curing Concrete Using Crushed Ceramic, Volcanic Powder, and Polyethylene Glycol

by
Hassan M. Etman
1,2,
Mohamed M. Yousry Elshikh
1,
Mosbeh R. Kaloop
3,4,5,*,
Jong Wan Hu
4,5,* and
Ibrahim Abd ELMohsen
6
1
Structural Engineering Department, Mansoura University, Mansoura 35516, Egypt
2
Civil Engineering Department, Horus University, New Damietta 34518, Egypt
3
Public Works Engineering Department, Mansoura University, Mansoura 35516, Egypt
4
Department of Civil and Environmental Engineering, Incheon National University, Incheon 22012, Republic of Korea
5
Incheon Disaster Prevention Research Center, Incheon National University, Incheon 22012, Republic of Korea
6
Civil Engineering Department, Damietta University, New Damietta 34518, Egypt
*
Authors to whom correspondence should be addressed.
Sustainability 2024, 16(11), 4659; https://doi.org/10.3390/su16114659
Submission received: 1 May 2024 / Revised: 26 May 2024 / Accepted: 27 May 2024 / Published: 30 May 2024
(This article belongs to the Section Sustainable Materials)

Abstract

:
This study investigates the properties of sustainable self-curing concrete (SSC) by adding volcanic powder (VP), crushed ceramic (CC), and polyethylene glycol 6000 (PEG). VP and CC are prepared from volcanic ash, as a natural pozzolanic material, and construction waste, respectively. PEG is used as an inner-curing agent. Twenty-six concrete mixtures are prepared using VP at 5%, 10%, 15%, and 20%, CC at 50%, and PEG at 1%, 1.5%, and 2% and tested after 7, 28, and 56 days. Mechanical, workability, and durability characteristics are evaluated using different tests. The bond and cohesion between aggregates and mortar are tested using a scanning electron microscope (SEM). The results show that the optimum replacement mix for enhancing strengths, by producing C-S-H, of the studied SSC is 10% VP and 1.5% PEG. This improved the compressive, tensile, and flexural strengths of SSC by 54.5%, 60.7%, and 34.9%, respectively, compared to a reference mix. Adding CC enhances the compressive strength of SSC by 41.6% and 11.5% and decreases chloride penetration by 10% and 9.1% compared to control mixes. PEG improves the mechanical, workability, and durability characteristics of SSC even with the addition of 1%. The obtained results reveal the possibility of using VP and CC in producing SSC.

1. Introduction

Current ecofriendly concrete structures have been developed to withstand various environmental conditions. Thus, many researchers have used natural resources and waste materials to enhance the properties of sustainable concrete [1,2,3]. Self-curing concrete (SC) is prepared to decrease the need for additional water for concrete curing after it has been placed. This allows concrete to provide itself with more moisture through the self-curing or internal curing process. This process can increase cement hydration and lessen self-desiccation in contrast to traditional concrete, which needs more time to ensure proper hydration and strength development [4,5]. SC incorporates special additives or technologies that enable it to retain moisture and hydrate itself [6]. Internal water reservoirs, such as light aggregates or superabsorbent polymers, are used during the self-curing process, and absorb and store water within a concrete mix [7]. As the concrete cures, these reservoirs release the stored water gradually, ensuring the continuous hydration of cement particles. The main advantages of SC are the capability to reduce water for curing and saving time in concrete preparation. In addition, the overall durability of concrete can be improved by reducing shrinkage, cracking, and surface defects caused by premature drying. Additionally, SC can lead to enhanced strength development and improved long-term performance [8].
Currently, the fast curing of concrete is required to finalize constructions in a short time with acceptable properties based on standard codes. It is crucial to note that in some circumstances, SC cannot replace competent concrete mix design, good construction practices, or other curing methods in certain situations. However, it offers an innovative solution to enhance the curing process and mitigate common challenges associated with traditional concrete curing [9]. Internal curing of concrete is now accomplished using two main techniques. In the first method, a light-weight, porous aggregate that has been saturated with water serves as an internal water supply to replenish the water lost by chemical shrinkage during cement hydration [10,11]. The term “curing” is used to describe the progression of internal chemical processes in hydrated cement paste. With enough water, this procedure creates the qualities of hardened cement paste. Curing keeps concrete saturated or nearly saturated for as long as possible or for a long enough period of time to prevent water loss [12,13,14]. Internal curing can reduce autogenous shrinkage and enhance concrete quality, and is essential for constructing high-strength concrete. Desert areas have very high temperatures and low humidity [13,14]. In order to prevent internal drought and reduce autogenous shrinkage in the early age of concrete, internal curing will be a substantial method [12].
Polyethylene glycol (PEG) is used in the second approach [4,15,16,17,18]. The polymers that are mixed in with the concrete primarily establish hydrogen bonds with water molecules and lower the chemical potential of the molecules, which lowers the vapor pressure and slows the rate of evaporation from the concrete’s surface and aids in water retention [19]. In addition, PEG is hydrophilic “water-loving” material [20]. Furthermore, PEG greatly develops the pore and surface structure of C-S-H, based on what scanning transmission X-ray microscopy has revealed [21] alongside infrared spectroscopy with Fourier transform [22]. Calcium silicate hydrates, which include crystalline minerals as well as the highly variable and erratically organized phase (C-S-H), serve as the primary binding phase in the majority of concrete. Therefore, C-S-H is responsible for the strength of concrete because the bonding system in C-S-H is made possible by the cohesive forces that act between individual C-S-H layers [23]. Among the several types of polymers, PEG is one of the most promising options for C-S-H modification [24,25,26,27]. This is because, due to the covalent connections between carbon and carbon or carbon and oxygen, PEG can provide high stiffness, assisting in increasing incompressibility in the C-S-H ab plane [27]. Moreover, PEG might raise the macroscale fracture energy of ordinary Portland cement paste [28]. Additionally, Zhou et al. [29] showed how propagating PEG could be sealed into the silicate chain defects when exposed to tensile loading, increasing the system interconnectivity and increasing the ductility of C-S-H, which was compatible with the macroscale experimental results. However, because of the constraints of laboratory-based equipment, there is still a dearth of direct experimental information on the structure–mechanical property relationships of C-S-H/PEG composites at the lattice scale.
Meanwhile, the definition of sustainable concrete is “concrete that consumes much less energy during production and emits significantly less carbon dioxide” [30,31]. To achieve this goal and expand the usage of self-curing green concrete, also known as sustainable self-curing concrete (SSC), numerous studies focused on incorporating waste and byproducts in concrete [32,33,34]. Crushed ceramic (CC) as a construction waste was used to produce SSC. For instance, a comparison was made between the strength development of ordinary concrete and concrete mixes that contained CC. Compared to ordinary concrete, the results indicate that concrete mixes using CC attain strength levels between 80 and 95% [35]. The compressive, flexural, and split tensile strength and modulus of elasticity of ceramic concrete, which are marginally higher than that of reference concrete, were measured in an earlier work using CC [36]. Comparatively to reference concrete, ceramic concrete absorbs more water [36]. The construction industry can achieve sustainability and economic competence by using less natural and raw resources when CC is used in concrete [36]. Utilizing aggregates of CC products speeds up the concrete’s strength-gain process as it cures [37]. High-performance concrete (HPC) made with a very low water/binder ratio (w/b) of 0.15 was prepared using CC. The results showed the high effectiveness of the CC for internal curing purposes, to drastically reduce and even to completely eliminate autogenous shrinkage [38]. It has been found by researchers that incorporating 40% CC produces a non-shrinking HPC with a significant increase in compressive strength and minimal internal stress [38].
Moreover, ashes from volcanic eruptions are a common type of natural pyroclastic debris found across the world. The term “volcano” can refer to either the vent from which magma and other substances explode on the surface, or the terrain formed by the accumulation of solidified lava and volcanic debris close to the vent [39]. Volcanic concrete is described as concrete containing volcanic powder (VP) as cementitious material produced by crushing volcanic rocks. Consequently, these items are extremely uniform and have a high degree of fineness and a precise surface area [40]. Although volcanic ash can be beneficial for numerous applications, much of it is unexploited [41,42]. The utilization of its naturally occurring aluminosilicate georesource could be advantageous for the environment and the economy [43]. Numerous parameters, comprising particle size distribution, surface area, chemical composition, mineralogy, and the amount of ash in the amorphous phase, affect the usage of volcanic ash in different applications [42,44,45,46]. This study aims to produce SSC to preserve natural resources for future generations by grinding volcanic ash to cement fineness and replacing part of the cement with it at different ratios, starting from 5% up to 20% replacement of the total weight of cement [47]. However, on the topic of volcanic concrete, Khurram et al. [48] calculated the thermal impact, and the findings demonstrated that volcanic ash perfectly influences the weight loss and strength of volcanic concrete at temperatures between 200 and 800 °C. Recent studies using volcanic ash in concrete have been summarized and presented by Alqarni [49].
There is a growing demand for SSC as a result of the rising use of concrete in the worldwide construction industry. One of the main causes of this is the detrimental effects of manufacturing concrete on the environment, such as the high energy consumption and significant CO2 emissions [50], as well as the consumption of natural materials like aggregates and cement components, leading to the exhaustion of these products [51]. This study investigates the effect of VP, CC, and PEG on SSC characteristics. Here, based on our knowledge, the novelty of this study is the use of VP and CC as waste materials to enhance the characteristics of a new, sustainable SSC. The use of VP and CC to improve the characteristics of SSC is still limited. This study aims to bridge this gap by exploring the effects of CC, VP, and PEG in the formulation of SSC. Thus, to achieve the objectives of this study, 26 concrete mixtures containing 400 kg/m3 of cement were implemented, tested, and evaluated. The VP, CC, and PEG were prepared to enhance the characteristics of the developed SSC based on previous studies and standard codes, using VP at replacement percentages of 0%, 5%, 10%, 15%, and 20% of cement weight; CC at percentages of 0 and 50%; and PEG at percentages of 0%, 1%, 1.5%, and 2%. The replacements of VP, CC, and PEG were selected according to previous studies [32,52,53]. This study presents the utilization of various waste materials in concrete, the resulting characteristic strength attained thereby, and limitations in the utilization of those materials, especially the use of VP, as this is the first time it has been used in self-curing concrete.

2. Experimental Procedures
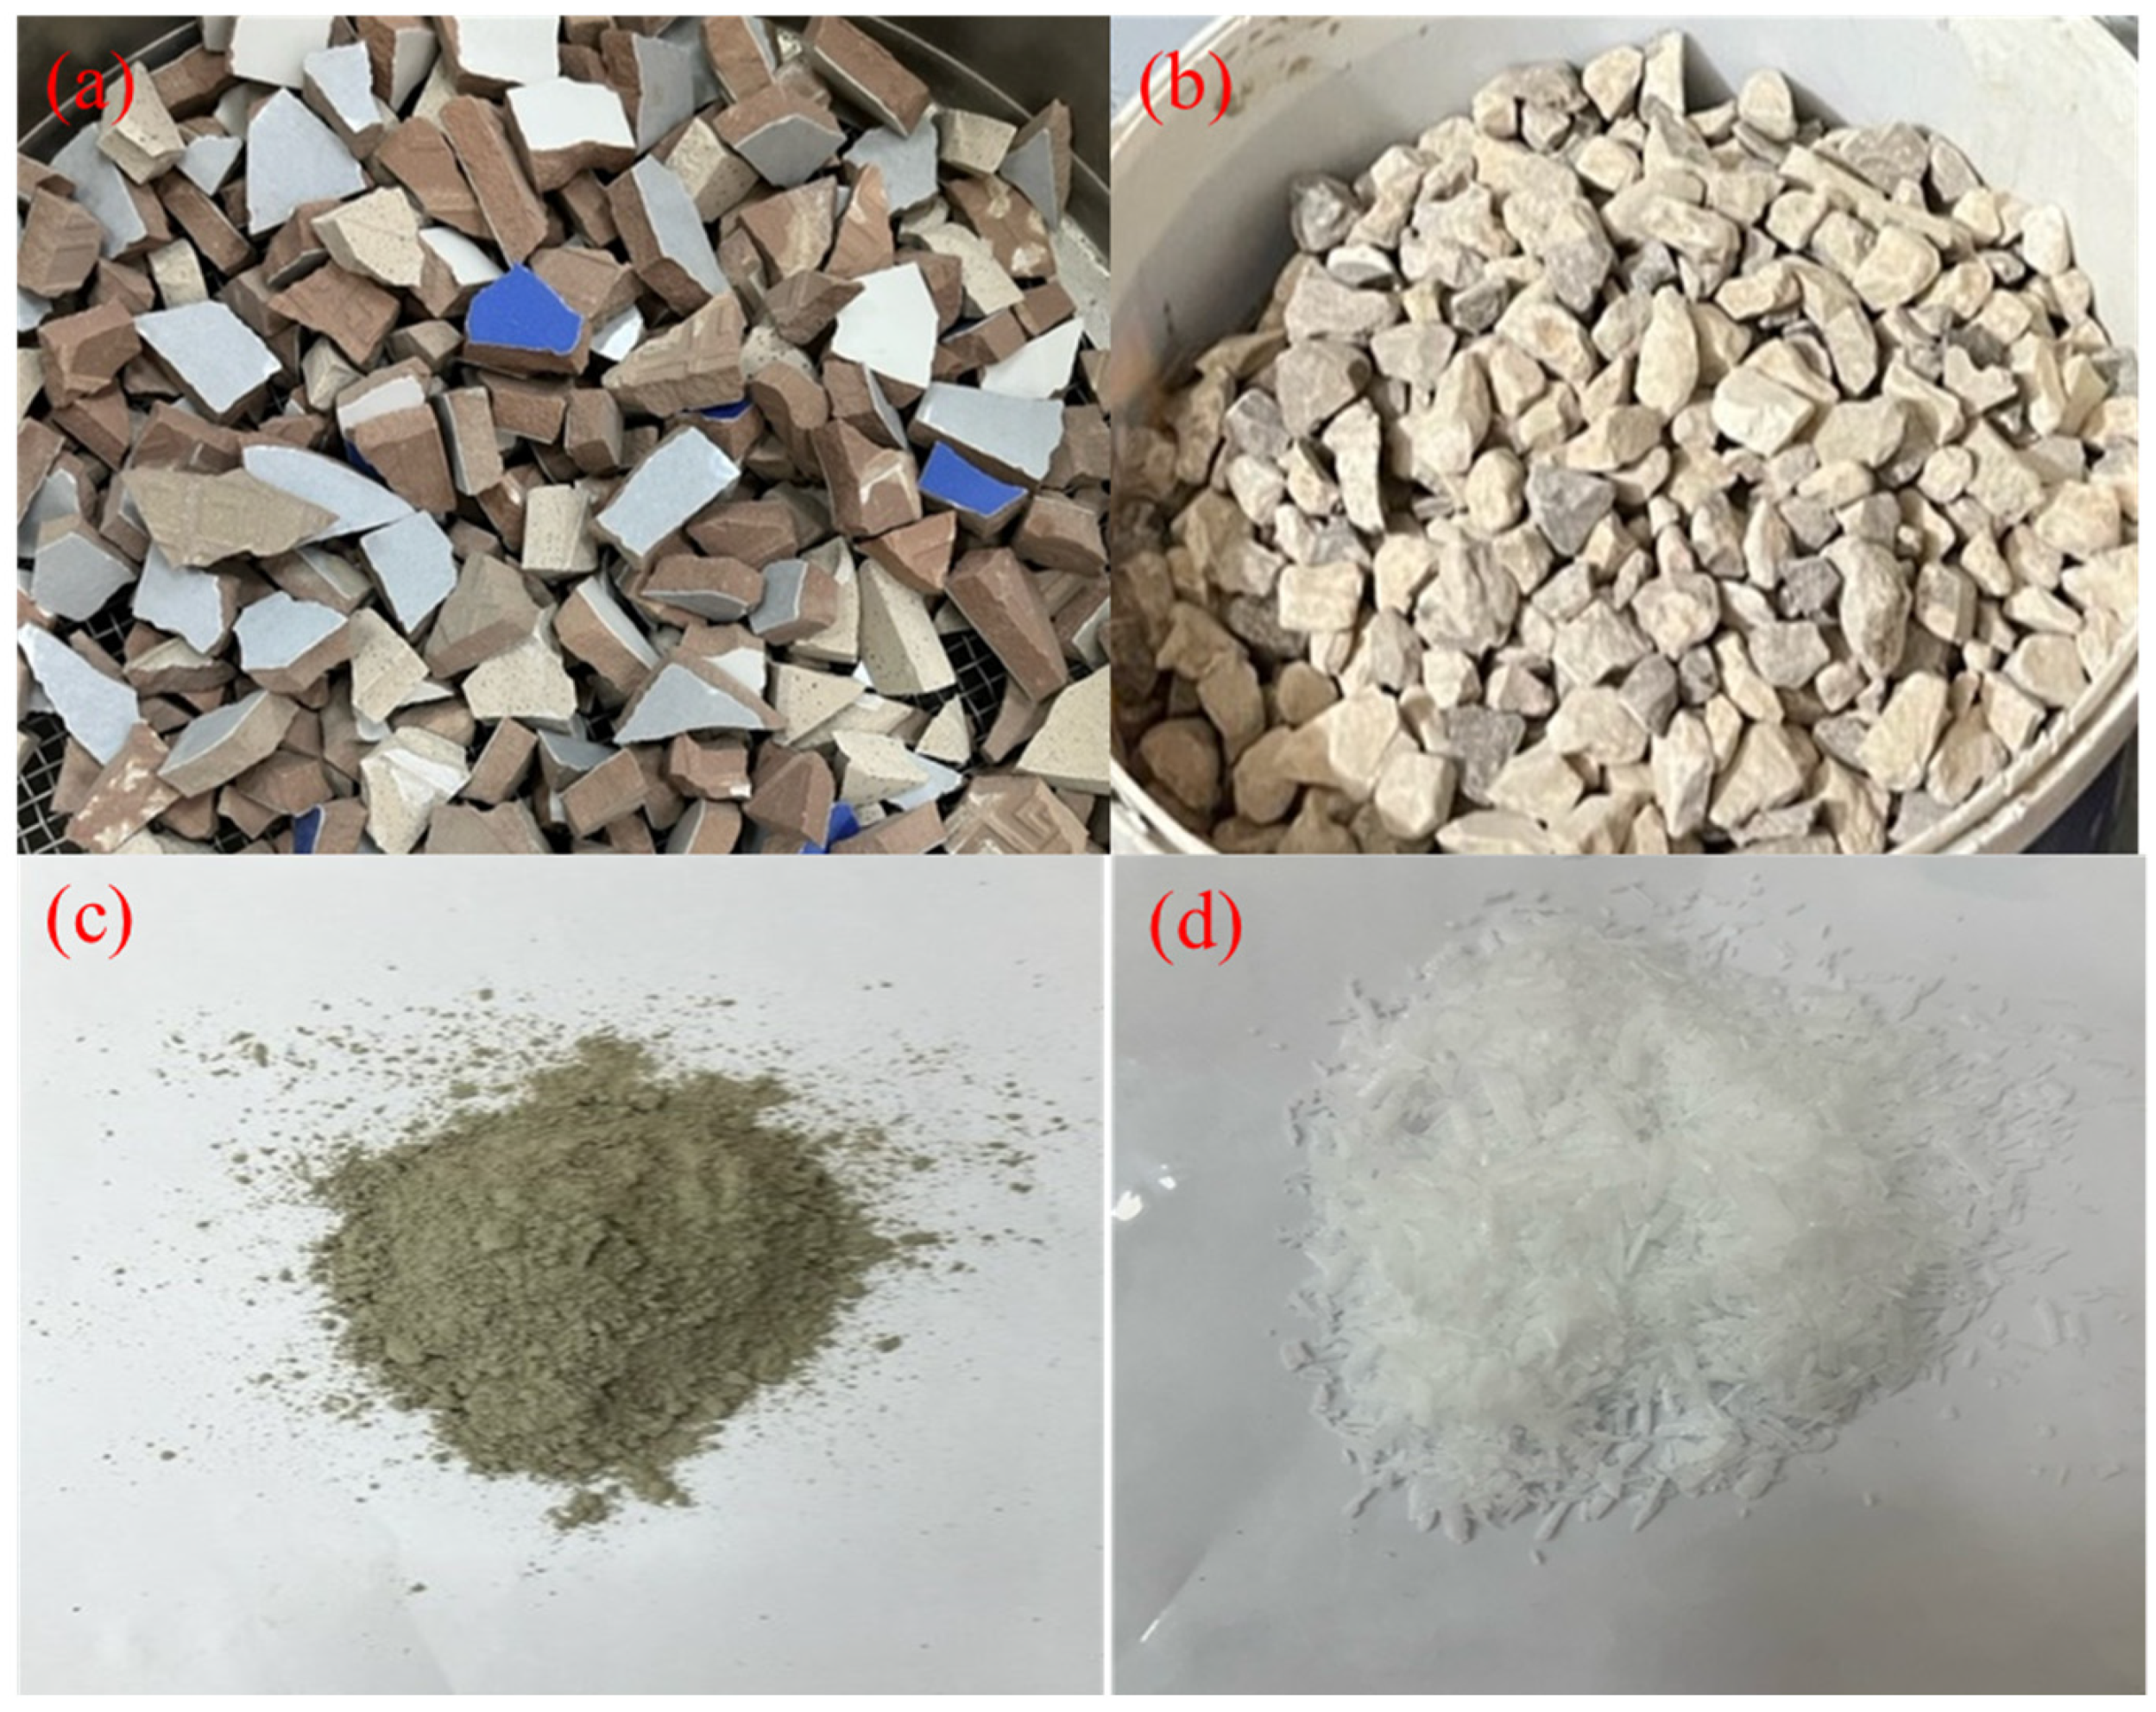
2.1. Materials

Portland cement (CEM II 42.5N) was used to prepare all of the mixtures in the current study. Tests on cement were conducted in accordance with BS EN 197-1/2011 [54]. Table 1 displays the Portland cement’s physical characteristics. ASTM standard C191 is used to estimate the setting times of cement hydration [55]. VP with SiO2 at 50–65% was utilized, and replaced 5%, 10%, 15%, and 20% of the cement weight in regular-strength concrete mixtures. VP was collected from volcanic rocks of the andesite type at El-Quseir, Egypt’s Wadi El-Anbgy. Table 2 lists the VP manufacturer’s characteristics. The production of these particles complies with Egyptian Standards (1109/2021) [56]. Here, the porosity rate of the andesite ranges between 10 and 25 percent [43]. Therefore, this can be utilized in a variety of physical and chemical contexts. Furthermore, its environmental effect resistance is excellent [24].
Volcanic rocks were gathered in accordance with Egyptian Organization for Standards & Quality Standard 8615–1/2019 [57] in order to produce volcanic ash. As indicated in Figure 1 and Figure 2c, the used volcanic aggregates were ground until they could pass through Sieve No. 170, with a specific gravity of 2.68 and a mass per unit volume of 1650 kg/m3. Figure 1 shows the processes used to extract the VP. Four steps were used from collecting the rocks to obtain the VP; two machines and a sieve were used to extract the VP’s characteristics following standardization (as presented in Table 2). Here, it should be mentioned that the controlled process of crushing, grinding, and sieving volcanic ash ensures that the VP possesses optimal properties to enhance the physical–mechanical characteristics of sustainable self-curing concrete. By achieving a consistent and fine particle size distribution, the reactivity and pozzolanic activity of VP in the concrete mix are maximized. Fine grinding increases the surface area of VP particles, improving their interaction with cementitious components, which in turn enhances the concrete’s mechanical properties and durability. Additionally, sieving ensures purity and homogeneity by removing impurities and oversized particles, resulting in a uniformly high-quality VP suitable for consistent performance in concrete applications.
The workability of self-curing concrete was improved by using a superplasticizer with a modified polycarboxylate base. For combinations that need to develop their strength and fluidity early on, Viscocrete-3425 is the best choice (ASTM C494/C494M-17 recommends Viscocrete-3425 [58]), and 1% from the mass of cementitious materials was added to the standard concrete compositions. In accordance with the specifications of ASTMC33, natural sand and locally accessible natural crushed limestone (dolomite) were used as coarse and fine aggregate [59]. A natural coarse aggregate (dolomite) and coarse ceramic waste that has been crushed are shown in Figure 2a,b. The grading curves of these aggregates as well as the mechanical and physical characteristics of all types of aggregate are shown in Figure 3 and Table 3, respectively. The water used was pure, fresh, and fit for human consumption. It served as a mixer for the concrete. As seen in Figure 2a, ceramics were broken and used as a light-weight aggregate. The SEM analysis was utilized to study the inside of the CCs. The SEM picture of broken ceramics displays several gaps of various sizes, illuminating the innumerable interior pores found within the CC. Polyethylene glycol 6000 (PEG) has the chemical formula H(OCH2CH2)nOH, where n is the average number of repeating oxyethylene groups, typically ranging from 4 to about 180. The typical molecular weight is indicated by a number suffix. El-Nasr Pharmaceuticals Chemicals Company (Cairo, Egypt) produces the obtained PEG as an internal chemical self-curing agent of the hydrophilic kind. As seen in Figure 2d, the PEG used in this investigation was solid. In addition to being chloride-free, it creates an interior barrier that protects freshly laid concrete from quick water evaporation. The manufacturer’s PEG characteristics are listed in Table 4.

2.2. Mix Design

We selected suitable self-curing concrete components (cement, aggregates, admixtures, and water) and calculated their quantities in relation to one another in order to produce inexpensive concrete with the desired qualities. To achieve the objectives of this study, 26 concrete mixtures containing 400 kg/m3 of cement were formulated and evaluated. The proportions of SSC in each mix are shown in Table 5. As presented in Table 5, different cementitious materials (PC and PV) and coarse aggregates (dolomite and CC) were used. To contrast the main replacement components visible in coarse aggregates and PEG and achieve the main objective of this research, discrepancies in aggregate densities may be neglected since they are minor. PEG, CC, and VP were absent from M01 (water-cured) and M02 (air-cured), which are considered reference mixtures. It has been demonstrated in earlier experiments that the cement’s PEG content should range from 1% to 5% [53]. Moreover, the replacement rate for porous aggregates can be up to 100% [60]. Six different concrete mixtures were used in the experiment. The first group includes M03, M04 and M05 mixes containing 1, 1.5, and 2% PEG in the cementitious materials, respectively. The mixtures M06, M07, M08, and M09 contain 0, 1, 1.5, and 2% PEG and 50% replacement by coarse aggregates, and are considered as the second group. M10, M11, M12, and M13 contain different ratios of VP (5%, 10%, 15%, and 20%) substituted by mass of cement, respectively, with 1.5% PEG as a fixed ratio. The fourth group has different ratios of VP (5%, 10%, 15%, and 20%) and a 50% substitution of CC. After that, the fifth group involves (5%, 10%, 15%, and 20%) VP, 1.5% PEG, and 50% CC. The final group involves the same as the fifth group, but at a temperature of 50 °C to assess the effect of temperature on the concrete characteristics. The precise proportions for each mix are displayed in Table 5.

2.3. Concrete Mixture Preparation and Specimen Preparation

Four steps of mixing were used for the SSC samples that included PEG. First, in a mixer, fine and coarse aggregates were dry blended for a one minute. Secondly, the cementitious materials and all types of aggregates were mixed for 2 min. The distribution of the cementitious components in the concrete mixture was homogenized as a result of this operation. To keep the homogeneity of all mixtures approximately the same, the mixing time was considered based on the results proposed by Zhao et al. [61]. Furthermore, the mixtures were made approximately within a month and a half and at approximately the same time every day to consider the temperature difference. About 40% of the total water was then added and blended, with the mixer still running. In order to guarantee an appropriate mixing time for homogenous dispersion, the superplasticizer was introduced during this time after being stirred in 30% water by mass, diminishing the friction between components and activating the plasticizer. The remaining water was added in the final step, mixed with the PEG, and then added to the mixer. After the mixing process was finished, a slump flow test was performed. Then, layers of the freshly mixed concrete were poured into steel molds. Each layer was compacted 25 times with a steel rod. Extra air was removed using a vibrating table. After finishing the top layer, extra concrete was taken out, and after that, the samples were allowed to dry. After a day, the samples were demolded, and they were exposed to the air for 7, 28, and 56 days (apart from the water-cured mix) before testing.

2.4. Testing Procedure

Fresh and mechanical concrete testing: In accordance with ASTM C143/C143M-15, the consistency of the freshly poured concrete was evaluated using the slump flow test [62]. According to BS EN 12390 [63], a compressive strength test was established. At ages of 7, 28, and 56 days, the test was conducted on concrete cubes with dimensions of 100 × 100 × 100 mm. After 28 days, a splitting tensile test was conducted on 100 × 200 mm concrete cylinders in accordance with ASTM C496 [64]. Following the ASTM C78 standard, after 28 days, 500 × 100 × 100 mm beam specimens were ready for the flexural strength test [65].
Chloride penetration: For the chloride penetration test, 10 by 20 cm concrete samples were created. For ASTM C192/C192M [66], the samples spent the first 28 days submerged in water, then another 28 days in a 3% NaCl solution. Cylindrical samples that had undergone treatment and exposure to chlorides were taken out and divided using a splitting tensile strength test to create two slits for each sample. For the chloride penetration test, silver nitrate (AgNO3) solution with a molecular weight of 0.1 mol/L was utilized using the colorimetric method. Here, a digital caliper with accuracy ±0.01 mm was used for measuring the penetration. The interior of the cylindrical slit received a spray of a soluble solution (Figure 4). Chlorides were measured by observing the concrete’s surface’s color change after being sprayed with AgNO3. White to grey indicates the presence of chlorides, while light brown denotes the absence of chlorides [67,68]. The silver nitrate colorimetric method produces a white precipitate by interacting silver ions (Ag+) with chloride ions (Cl). Continued colorimetric application to concrete with chloride permeability will result in additional precipitation processes. After the cement hydrates, a brown precipitation phase occurs with the calcium hydroxide (Ca(OH)2) and silver ions in the voids. Equations (1) and (2) provide examples of the colorimetric reaction [44].
Ag+ + Cl ⇒ AgCl (it becomes white to grey.)
This color appears on the edges of the sample in Figure 4.
Ag+ + OH ⇒ AgOH (the outcome is light brown.)
This color appears in the middle of the sample in Figure 4.
Microstructural analysis: Before being investigated using a JEOL JSM 6510 lv scanning electron microscope (SEM) (JEOL Ltd., Tokyo, Japan) with a 30 kV acceleration voltage to describe and examine the concrete specimens’ surface morphology and microstructure, the samples had a 12 nm gold coating applied to them. The reference concrete mix was used for the SEM study (M02). Additionally, the tests were run on corresponding mixtures of M04, M08, M10, M14, M18, and M23, respectively, to capture microstructure photos of the ITZs after 28 days for the SC concrete mixtures.

3. Results and Discussion

3.1. Slump

This test is a straightforward approach to determine concrete workability. Figure 5a presents the slump values for mixes M03, M04, and M05. These mixes, with a water/cement ratio (w/c) = 0.45 and superplasticizer (SP) content of around 1%, showed an increase in slump value by up to 38.90% compared to the reference mix (M02). This increase is due to the presence of PEG, which produces concrete that is more workable, because polymers that are soluble in water serve as plasticizers and lubricants in fresh concrete, as presented in [69]. As seen in Figure 5a, the mixes M06, M07, M08, and M09 have a skyrocketing increase with a proportion up to 44.40%. Moreover, Figure 5b depicts that the workability of mixtures M10, M11, and M12 soared by 22.20%, 16.70%, and 11.10%, respectively. Furthermore, Figure 5b illustrates that the values of slump in mixes M14, M15, and M16 rose with percentages of 16.70%, 11.10% and 11.10%, respectively. The slump for M17 diminished by 5.60%. As can be noted in Figure 5a,c, the slump results diminished in mixes M18, M19, M20, and M21 compared to samples M06, M07, M08, and M09. This reduction is a result of using VP; Karolina et al. [70] and Olawuyi and Olusola [71] also demonstrate this result. Finally, Figure 5c demonstrates that the results of slump were approximately the same. This implies the limitation of the temperature curing of SSC on the slump of mixes.

3.2. Mechanical Properties

The influence of PEG, CC, and VP on the concrete’s mechanical properties is presented and discussed based on the evaluation of compressive strength, splitting tensile strength, and flexural strength.

3.2.1. Compressive Strength

The compressive strength was tested for concrete mixes incorporating PEG, VP, and CC at various ages (7, 28, and 56 days). Figure 6 presents the compressive strength of the developed SSC. The results indicate that including PEG considerably increases the compressive strength of concrete. The improvement in compressive strength has been attributed to internal curing by chemical admixtures; it can prevent water evaporation thanks to a holding function [72]. Moreover, as is seen, Figure 6a delineates that the best compressive strength was recorded by M5, which contains 1.5% PEG. Furthermore, Figure 6b shows the findings of mixes utilizing CC and PEG; comparing the advancement of compressive strength in Figure 6a,b, the strength of M8 after 56 days diminished by 2.1% with respect to M5, taking into consideration M5 and M8 as the superior results. Figure 7 presents the SEM picture of M8; the high concentration of C-S-H, which gives concrete its strength, is shown in this shot. Also, previous studies have affirmed the positive influences of polymers on the C-S-H matrix [73,74,75,76]. Nonetheless, Figure 6c delineates that using 1.5% PEG and 10% VP (M11) gives fantastic results; the compressive strength of the mixes shown in Figure 6c was extremely improved by 12.8%, 26%, 2.5%, and 1.7% with respect to the mixes in Figure 6d, after 28 days. The combination of 1.5% PEG and 10% VP (M11) yields the best enhancement in concrete characteristics due to synergistic effects. PEG acts as a self-curing agent, retaining moisture and promoting prolonged hydration, which improves the microstructure and compressive strength. VP serves as a pozzolan, reacting with calcium hydroxide to form additional C-S-H gel, enhancing the density and strength. In addition, Figure 6d confirms that 10% VP is the ideal proportion because any increase in VP does not lead to any further development in compressive strength as a result of all the powder reacting with all the existing CaOH; this produces C-S-H, meaning there is no more CaOH to react with, and this coincides with the results obtained by Zeyad et al. [77]. In other words, from the SEM images in Figure 11 and Figure 12, it can be clearly shown that by using 10% VP, the compact C-S-H makes the micro-concentrate configuration denser, with a more refined microstructure; this improves the strength characteristics of SSC. Moreover, the existence of CC improved the compressive strength by 34.4%, 37.7%, 31.1%, and 21.3% after 56 days with respect to M1, as presented in Figure 6d. This indicates that curing is one of important factors should be considered in the compressive strength of SSC. This enhancement can be considered due to the porous structure of the produced concrete. In addition, the silica and alumina found in CC support pozzolanic reactions, which are needed for the primary strength-giving phase in concrete [34]. In addition, VP contains a high silica content, as presented in Table 2, which significantly enhances its compressive strength. Also, on the one hand, Figure 6e illustrates that the existence of 1.5% PEG, CC, and VP roughly decreased the compressive strength by around 5.4%, 12.8%, 4%, and 3.6% after 27 days with respect to the mixes in Figure 6d. This indicates the crucial role of determining the percentage of PEG in SSC. On the other hand, Figure 6f depicts the effect of 50 °C temperature on curing concrete. The compressive strength of mixes M23, M24, M25, and M26 is enhanced by 5.3%, 10.3%, 2.6%, and 3.2%, respectively, compared to the mixtures in Figure 6e after 56 days. Furthermore, the compressive strength of mixes M22, M23, M24, and M25 is increased by 35.4%, 27.1%, 28.5%, and 25%, respectively, and diminishes in mix M26 by 10%, all with respect to M01 after 28 days (Figure 6f). This indicates that the curing temperature influences the compressive strength of SSC. This elaborates on how higher curing temperatures can accelerate the hydration process, altering the concrete’s microstructure and influencing its mechanical properties. The expanded analysis provides deeper insights into how temperature variations impact the strength of self-curing concrete, guiding the determination of optimal curing conditions for improved performance. SEM image (Figure 11g) shows that the temperature facilitates a quicker hydration process, marked by an accelerated strength gain due to the increased mobility and reactivity of water molecules and cement components. A longer-chain C-S-H gel can be observed, which improves the concrete strength. The error bar presents the standard deviation of compressive strength change that is likely significant after 7, 28, and 56 days.

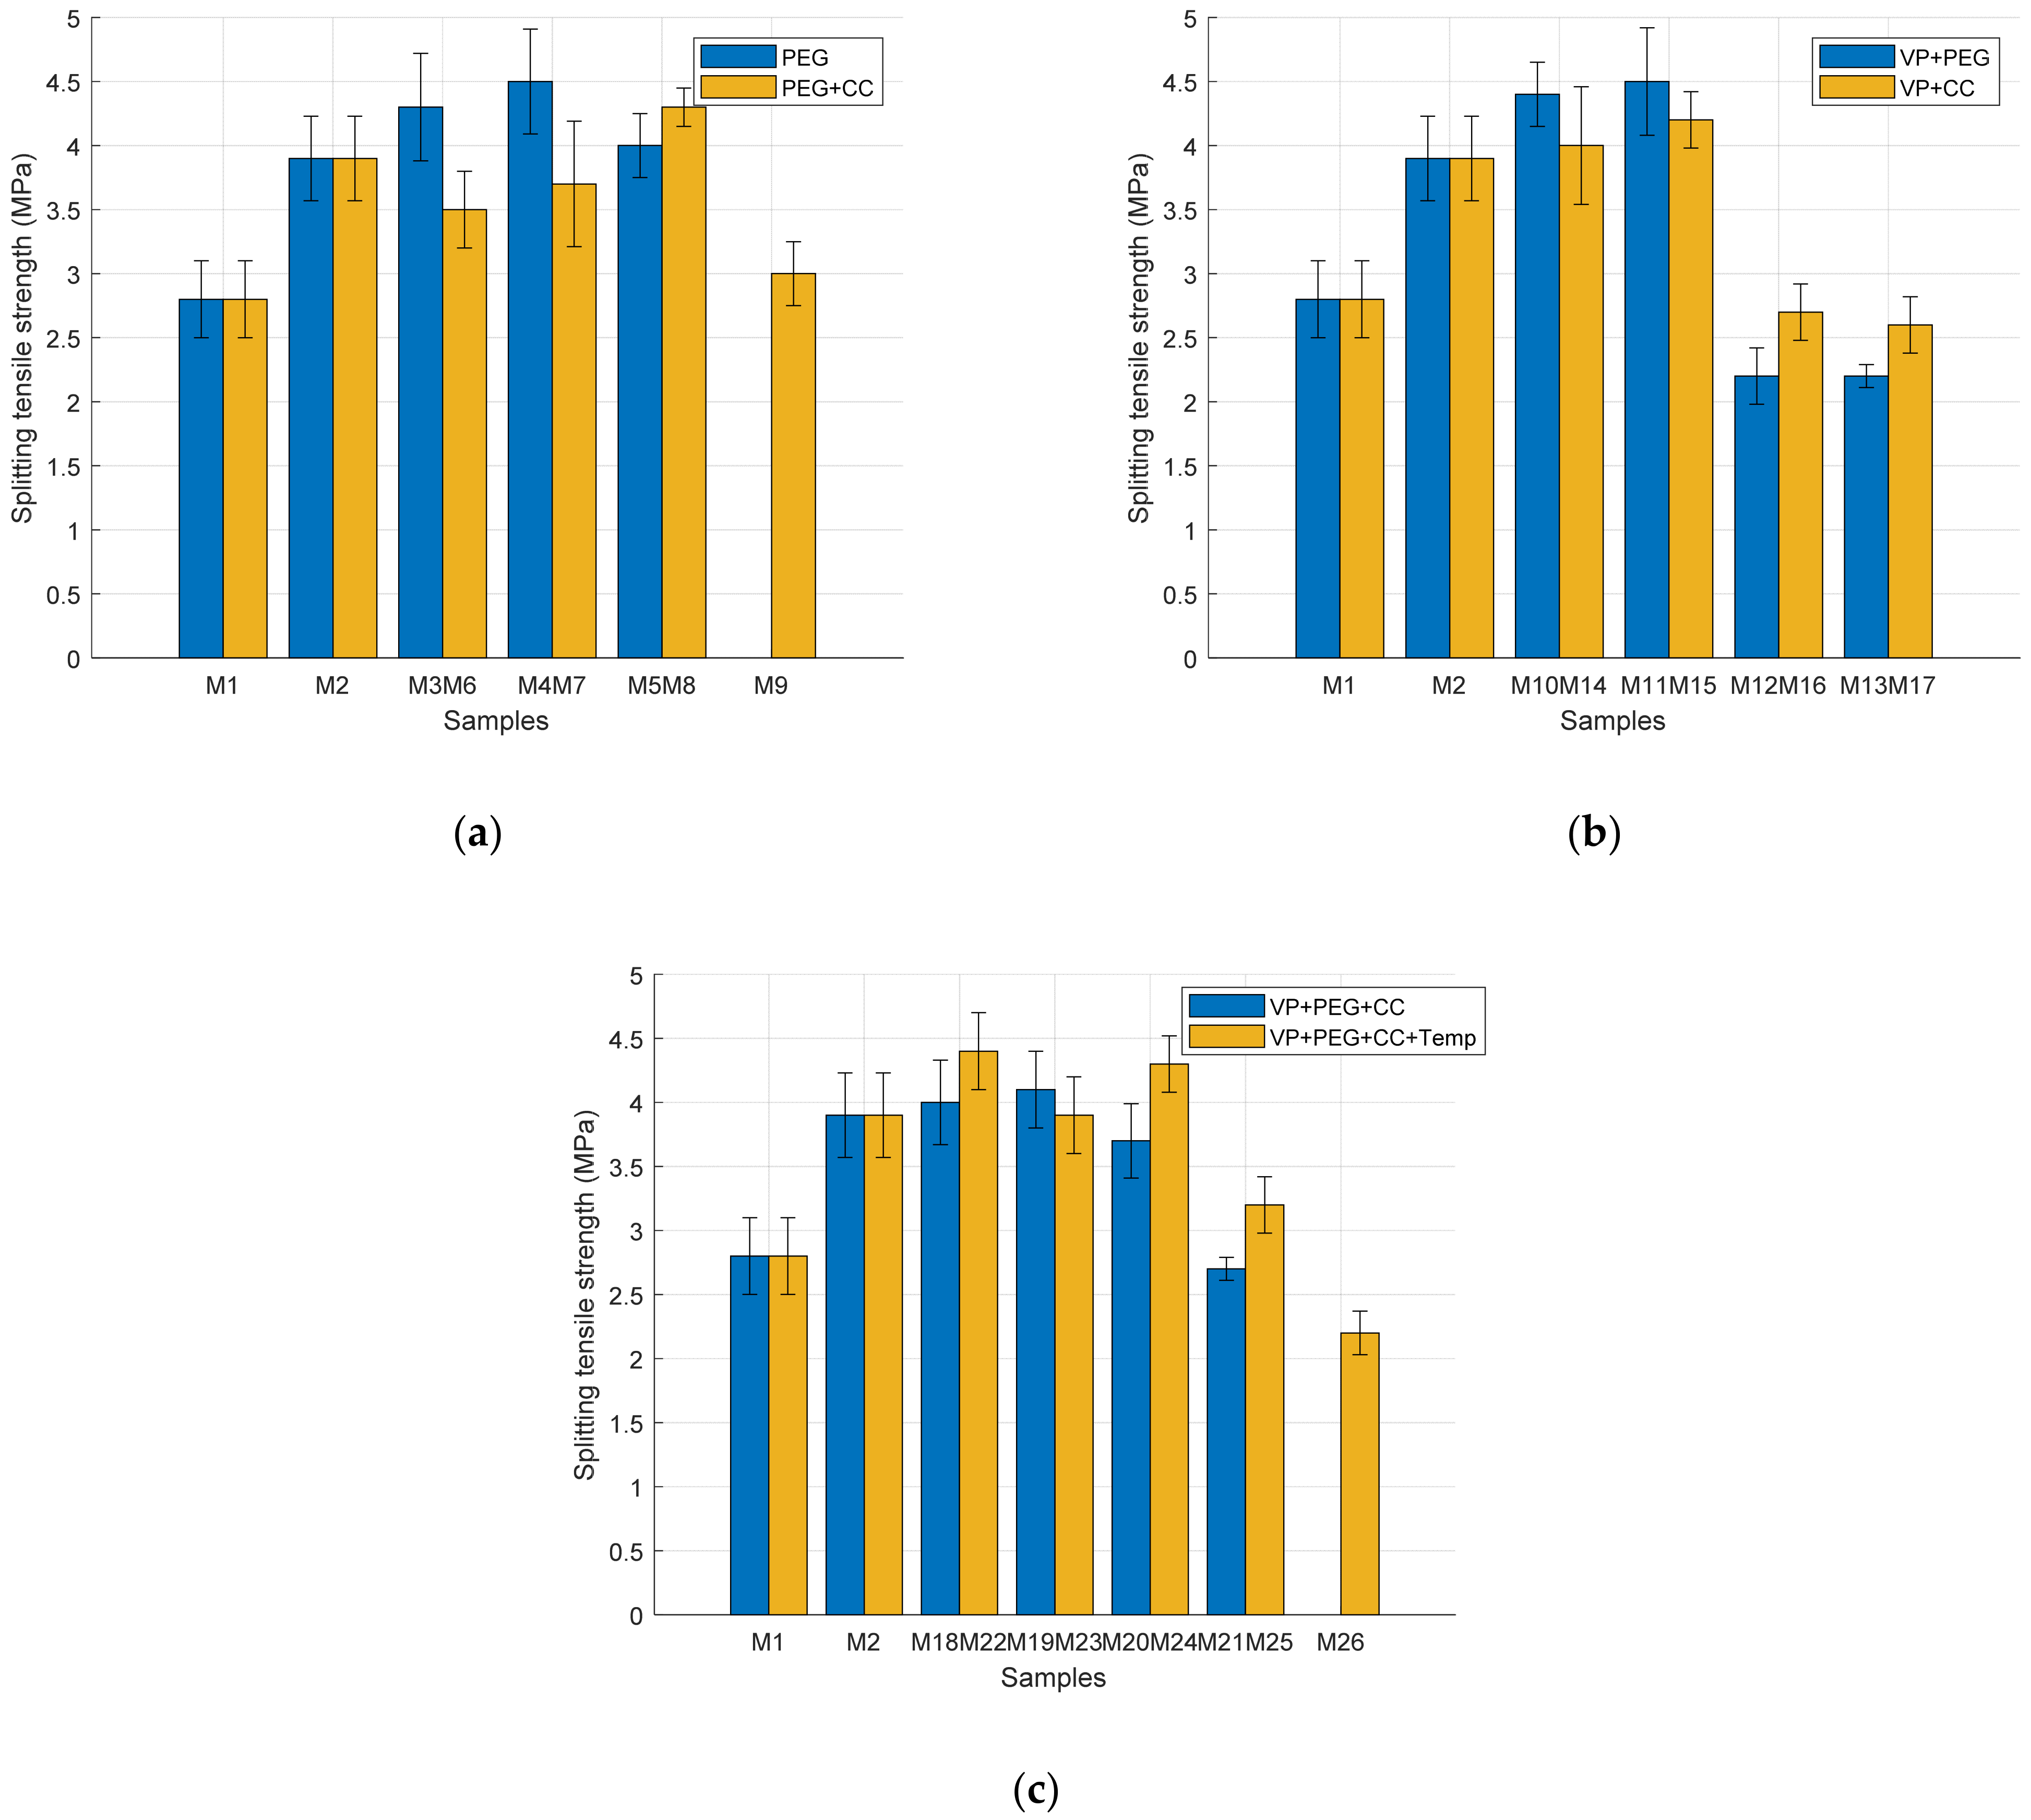
3.2.2. Splitting Tensile Strength

Figure 8 shows the results of the splitting tensile strength test that was performed on all of the concrete mixtures after they had aged for a total of 28 days. As can be seen in Figure 8, the results indisputably demonstrated that after 28 days, the self-curing concrete had increased tensile strength. The tensile strength of concrete mixes that contained PEG as a self-curing agent was significantly increased when compared to water-cured and air-cured concrete. When compared to an air-cured mix, the tensile strength of concrete increases by roughly 53.5%, 60.7%, and 42.8%, respectively, when PEG is added at ratios of 1%, 1.5%, and 2%. After 28 days, the tensile strengths are 3.5, 3.7, 4.3, and 3 MPa after substituting coarse aggregates with 50% CC and different percentages of PEG, as shown in Figure 8a, which confirms that 1.5% PEG and 50% CC (M08) provide the maximum tensile strength obtained in this group, with a tensile strength equal to 4.3 MPa. As shown in Figure 8b, when VP replaced cement at percentages of 5%, 10%, 15%, and 20%, respectively, and when PEG was used as an additive at a concentration of 1.5%, the tensile strength was 4.4, 4.5, 2.2, and 2.2 MPa. Furthermore, at 50 °C, the splitting tensile strength increased in mixes M22, M23, M24, and M25 by 57.1%, 39.3%, 53.6%, and 14.3%, respectively, and diminished in mix M26 by 21.4%, all with respect to M01 after 28 days (Figure 8c). According to these findings, substituting VP for cementitious materials and adding a self-curing agent containing 1.5% PEG increases the splitting tensile strength when compared to concrete mixtures that are air-cured or water-cured. In addition to this, it was improved when VP was used as a replacement for up to 10% (M11) of the cementitious components, a significant improvement over previous studies that used CC and PEG without VP. The addition of VP enhances the pozzolanic activity, leading to increased formation of C-S-H and resulting in a stronger concrete matrix. SEM analyses reveal that VP contributes to a more homogeneous particle distribution and improved load distribution under stress, which enhances the splitting tensile strength, as is seen in Fig11. This innovative combination of VP, CC, and PEG has not been extensively documented in the literature, marking a novel and transformative advancement in the development of sustainable self-curing concrete. However, the splitting tensile strength was diminished when using more than 10% VP, as at this point, there is no more CaOH to react with. The trend seen in the acquired results of the mechanical characteristics was consistent with that seen in previous studies [38,48]. The error bar presents splitting tensile strength changes that are statistically significant with PEG and CC, and VP and PEG. In addition, the temperature is likely significant to in the splitting tensile strength of SCC.

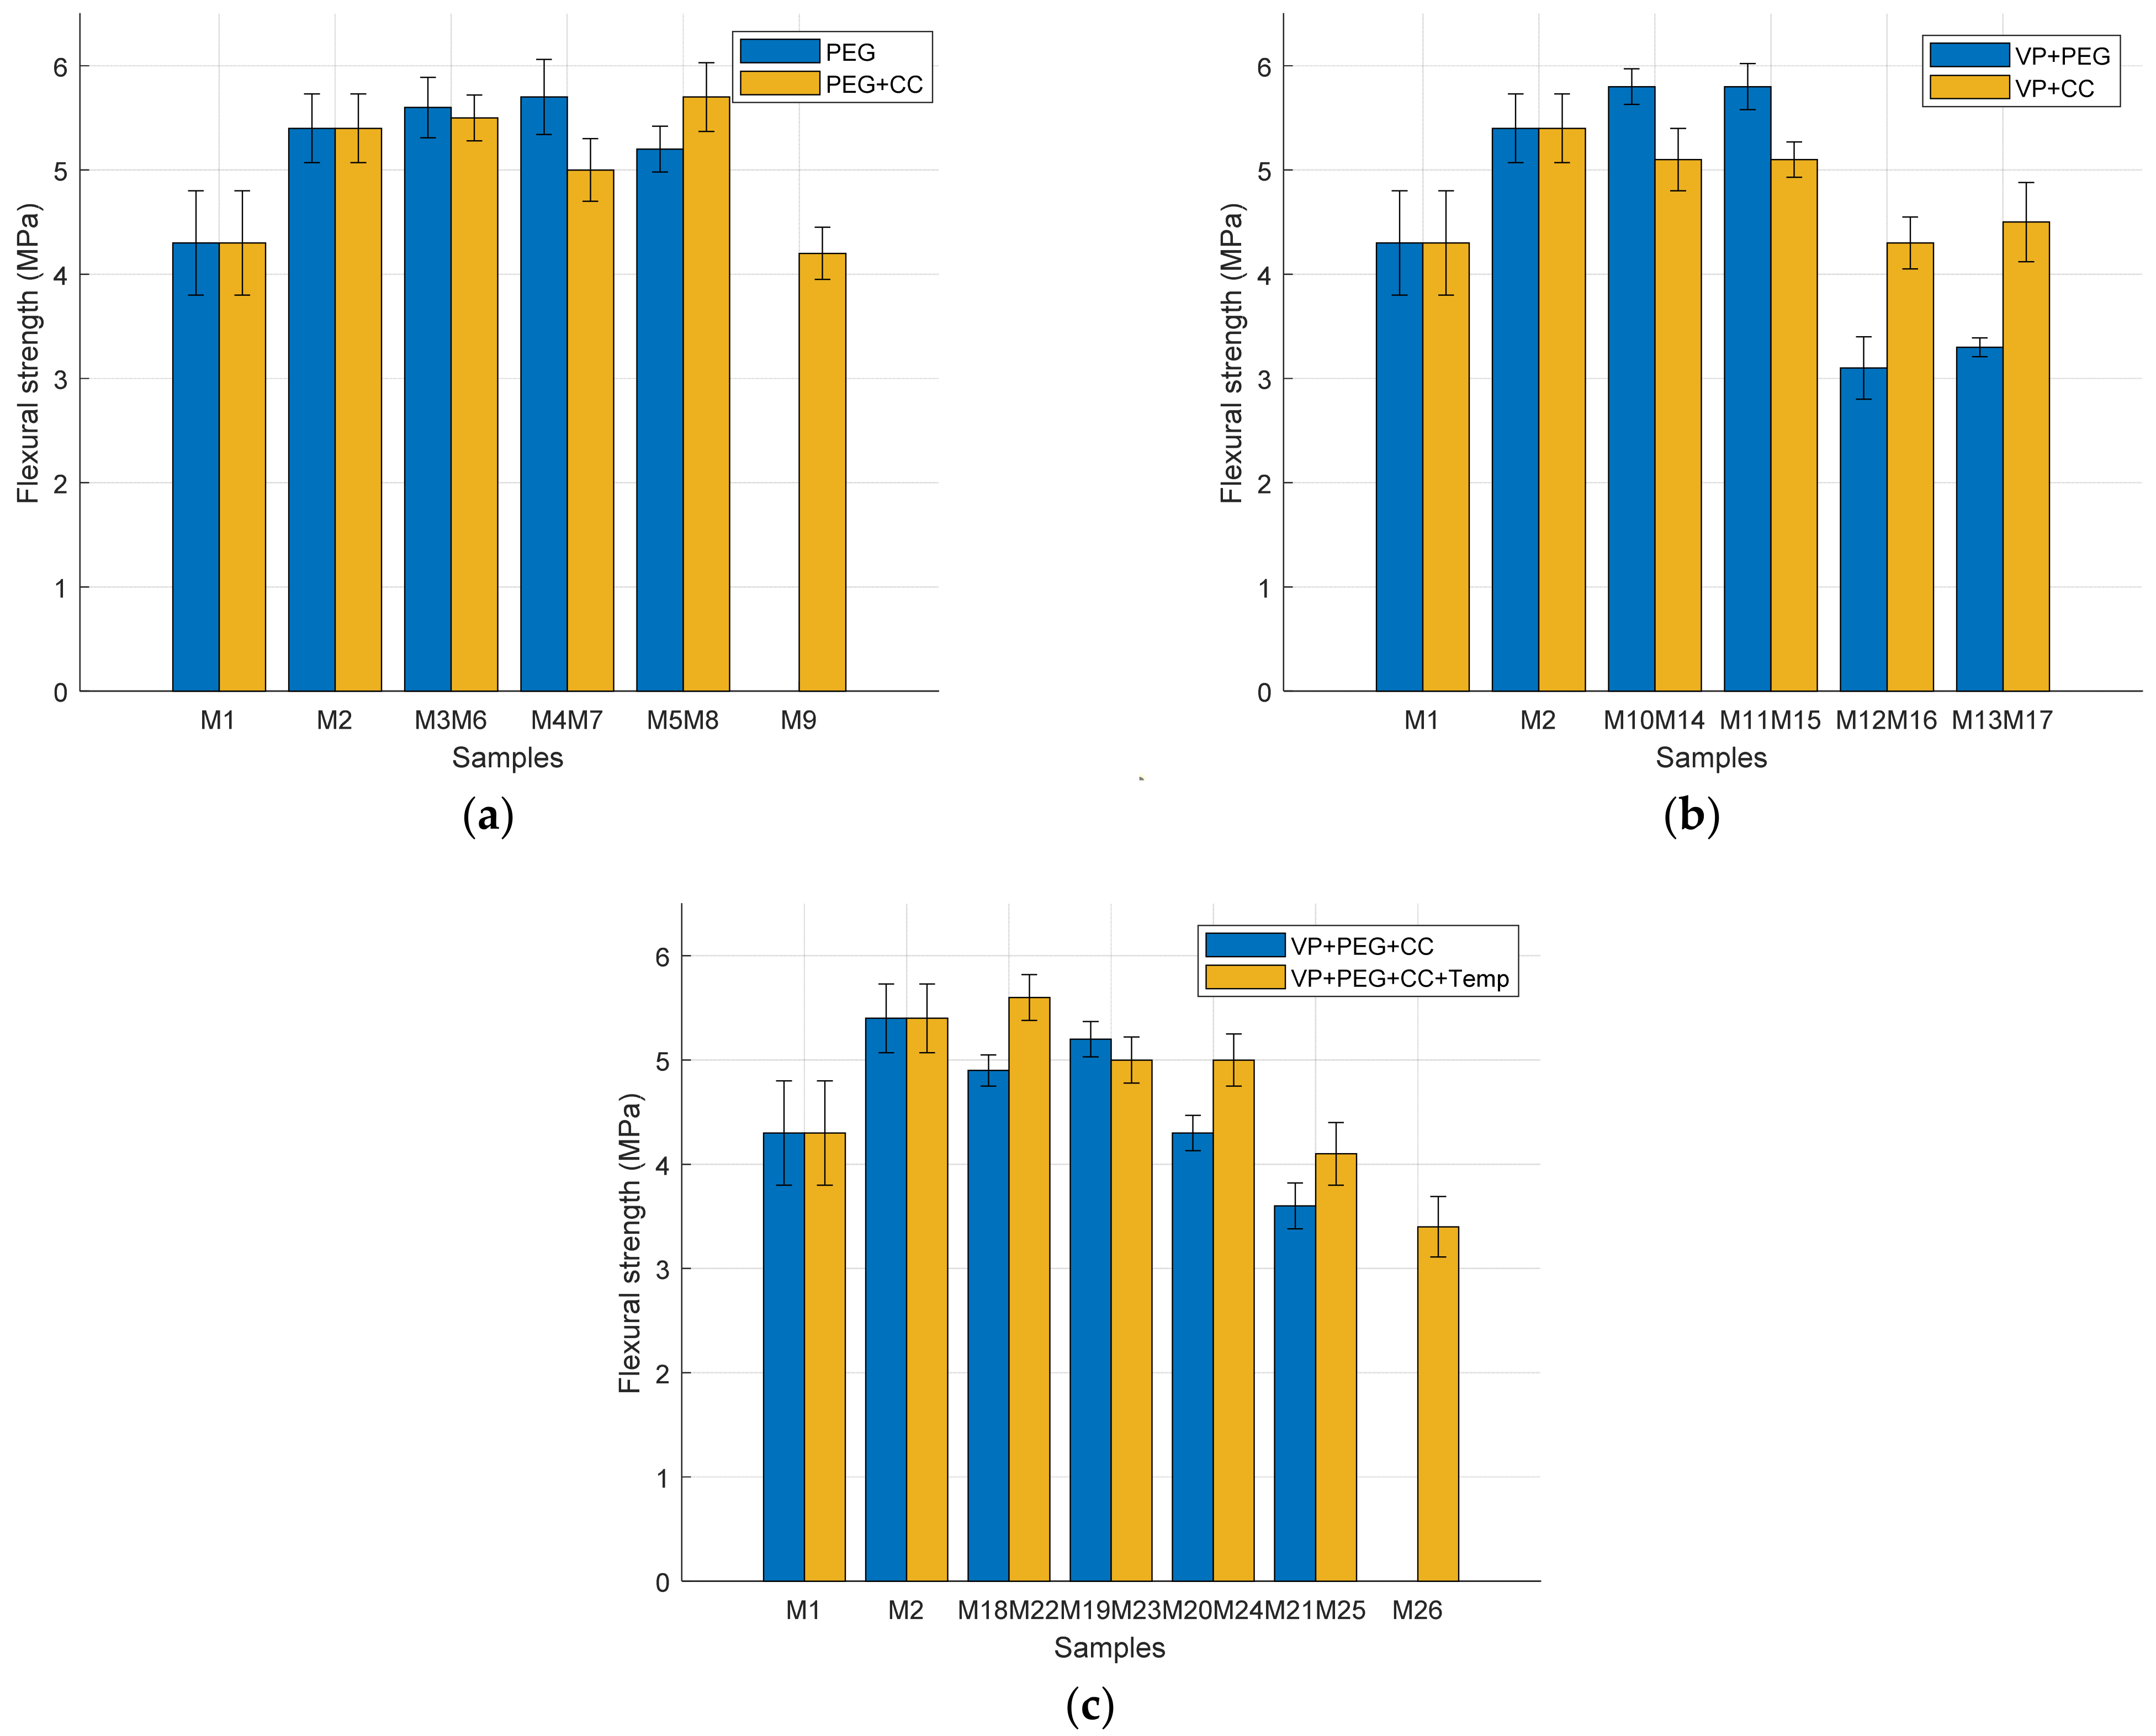
3.2.3. Flexural Strength

Figure 9 displays the self-curing concrete’s flexural strength findings after 28 days. In accordance with the prior experiment [52], Figure 9a shows that self-curing with 1%, 1.5%, and 2% PEG increased the flexural strength by 30.2%, 32.6%, and 20.9% in mixes M3, M4 and M5, respectively, compared to air-cured concrete. Further, when using 50% CC and various PEG percentages after 28 days, the flexural strengths are 5.5, 5, 5.7, and 4.2 MPa, as shown in Figure 9a, in mixes M6, M7, M8, and M9, which confirms that 1.5% PEG and 50% CC provide the maximum flexural strength obtained in this group, with a flexural strength equal to 5.7 MPa. As shown in Figure 9b, when VP substituted cement at percentages of 5%, 10%, 15%, and 20%, respectively, and when PEG additive was applied at a concentration of 1.5%, the flexural strength was 5.8, 5.8, 3.1, and 3.3 MPa, as can be noticed in mixes M10, M11, M12, and M13. In contrast to concrete mixes that are air-cured or water-cured, our results show that substituting VP for cementitious materials and adding a self-curing agent containing 1.5% PEG increases the flexural strength of concrete mixes. These results were consistent with those seen in previous studies [16,53]. Additionally, it was enhanced by the substitution of VP at up to 10% of the cementitious components, which aligned with the results obtained by Zeyad et al. [77]. Moreover, at 50 °C, the flexural strength grew in mixes M22, M23, and M24 by 30.2%, 16.3%, and 16.3%, respectively, and decreased in mixes M25 and M26 by 5% and 21%, all with respect to M01 after 28 days, as presented in Figure 9c. The error bar presents flexural strength changes that are statistically significant with PEG and CC and with VP and PEG. In addition, the temperature also likely has a significant effect on the flexural strength of SCC.

3.3. Chloride Penetration Depth and Absorption Evaluation

To measure chloride penetrability, silver nitrate colorimetry was initially used by Otsuki et al. [78]. Continuous hydration enhances the properties of concrete. According to our findings, concrete with VP, PEG, and CC added as self-curing agents has less chloride ion penetrability than concrete that has been water- or air-cured. Additionally, the chloride ion penetrability rate is decreased when VP, CC, and 1.5% PEG are used in place of water curing. Self-curing could be the cause of concrete samples having low chloride penetrability, as the concrete holds onto more water during the rehydration process, as well as the presence of VP, which reduces the pores, hence reducing chloride ion penetration. Self-curing maintains a high internal moisture level that aids in the production of gel and the sealing of pores. However, after 28 days, self-curing decreases chloride penetrability. Figure 10 presents the average chloride of the proposed mixes. In Figure 10, compared to air-cured concrete, self-curing concrete containing 1%, 1.5%, and 2% PEG has reduced chloride penetrability by 29.5%, 24.5%, and 15%, respectively. When coarse aggregate was replaced with 50% CC, integrating 1%, 1.5%, and 2% PEG, respectively, chloride penetrability in concrete was decreased by 10%, 13%, 13.5, and 10% compared to concrete that was air-cured. In addition, chloride penetrability was reduced by 25%, 21%, 5%, and 1% when cement was replaced with 5%, 10%, 15%, and 20% VP, respectively, with the addition of 1.5% PEG, compared to the air-cured concrete mix. In addition, compared to the air-cured mix, combinations of crushed ceramic with 1.5% PEG and 5% VP (M10) improved the properties of self-curing concrete by decreasing the chloride penetrability by approximately 35%. Due to PEG’s capacity to reduce concrete pores and improve cement hydration, chloride penetrability resistance was enhanced.
For the absorption test, concrete’s properties are enhanced by the ongoing hydration process, which necessitates a high moisture content. The findings showed that SSC mixes with added PEG had a lower absorption percent than concrete that had only been air-cured. The reference mix (M01), M8, and M19 underwent a water absorption test after 28 days. The specimens were ready, and each cube’s initial weight was recorded [79,80,81]. Following a 28-day curing period, concrete cubes were submerged in water for a whole day. After placing them in the oven until the weight of the sample was stable, the amount of water absorbed by the concrete cubes was calculated based on their initial weight. M19 had the least amount of water absorption (1.57 percent) compared to air-cured concrete, whose absorption was 2.03%. Concrete that is self-curing retains more water, which lowers its water absorption. By maintaining a high internal moisture level, self-curing makes it possible for hydration processes to continue producing gel and sealing pores [82]. Furthermore, lowering water absorption to 81.3 percent and 77.3 percent, respectively, in comparison to the air-cured mix by adding CC with 1.5% PEG (M08) or adding 10% VP and CC with 1.5% PEG (M19) improved the properties of self-curing concrete. If water curing cannot be accomplished, the self-curing process is the best option. In this investigation, self-curing regimens produced normal-strength concrete with decreased water absorption compared to uncured concrete. Pore size and interconnectivity are roughly related to the water absorption rate (virtuous porosity). The significant rate of water absorption is proof that the concrete sample is no longer as durable. Concrete may become contaminated by hazardous substances like sulfates and alkalis when exposed to water. It is also feasible for carbon and chloride ions in the external air to penetrate the pores [83]. This study found that SCC, produced utilizing a variety of curing techniques, is better for water absorption and durability, which is consistent with other findings [84,85]. PEG helped to reduce the reduction in concrete pores, which reduced water absorption, and improved cement hydration. In other words, PEG promotes internal curing and continuous hydration, forming additional C-S-H gel that seals pores [53]. Here, the water absorption for M01, M08, and M19 was 2.03%, 1.65%, and 1.57%, respectively. This indicates that VP and CC slightly reduced the water absorption capacity compared to conventional concrete; this result coincides with those of Higashiyama et al. [86], Ahmad et al. [87], and Siddique [88].

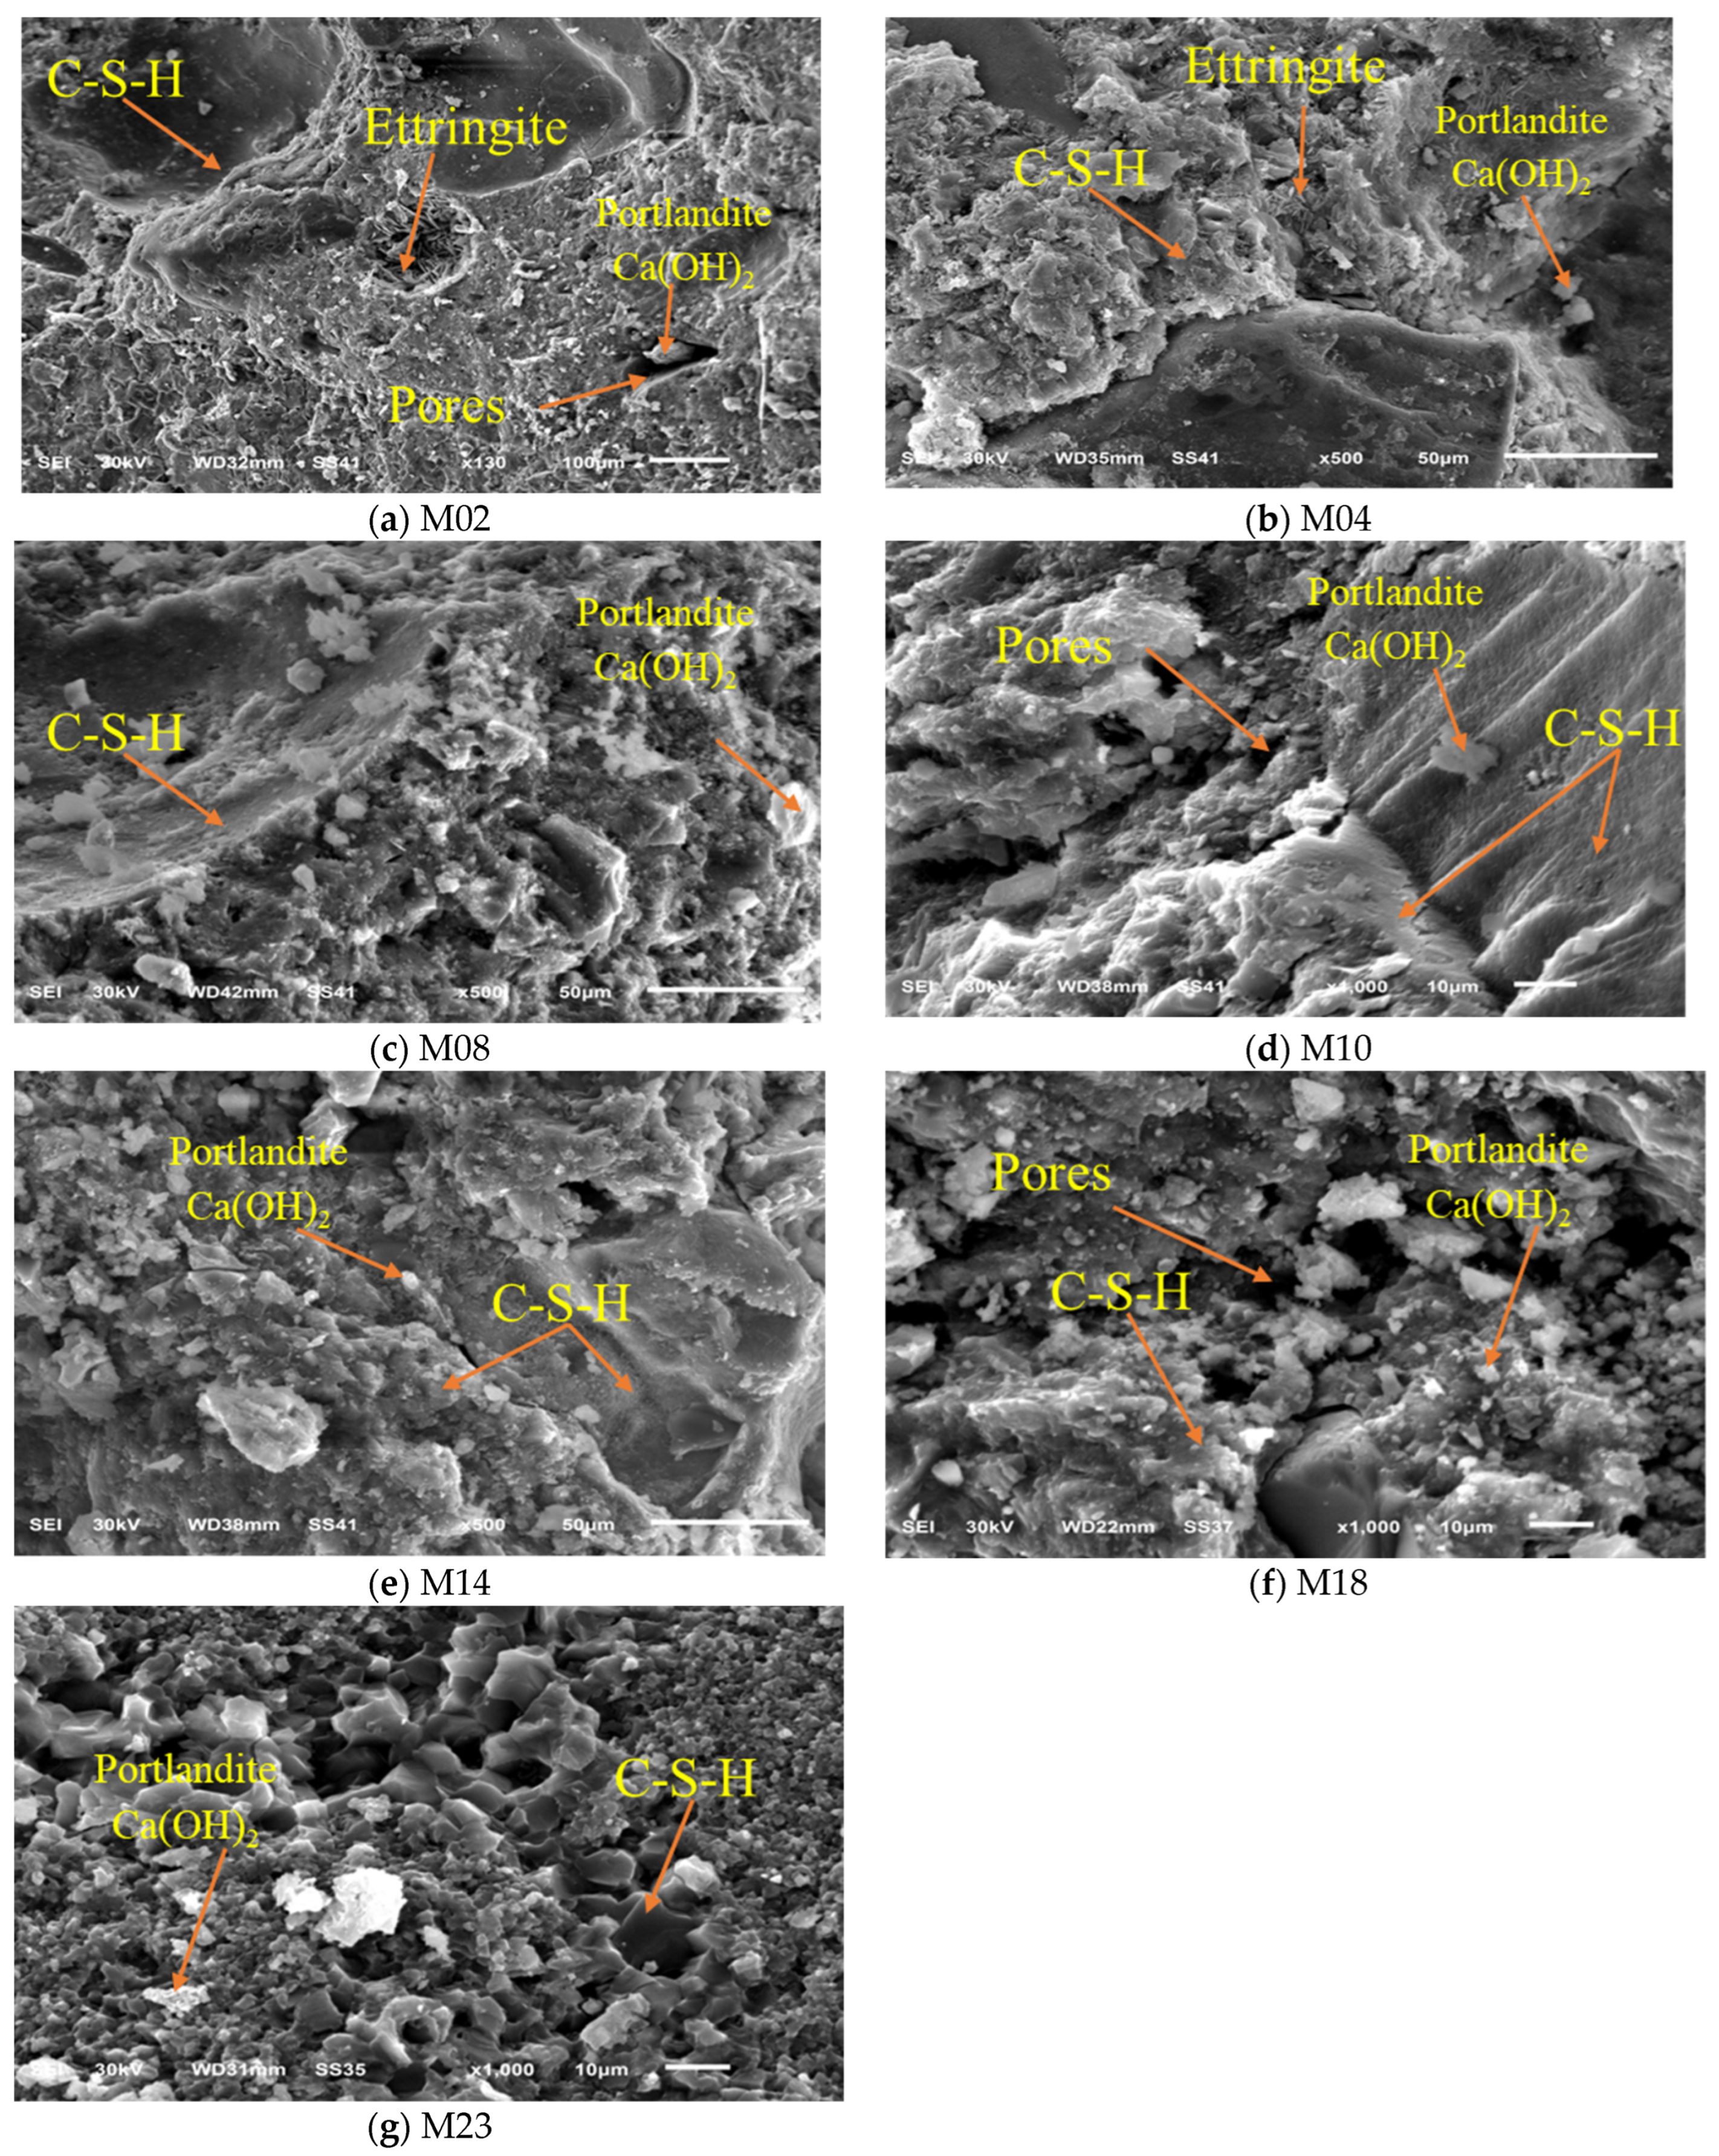
3.4. Microstructure of Developed SSC Charascteristics

Concrete composites can be divided into cement paste, aggregates, and the interfacial transition zone (ITZ) between aggregates and cement paste at the microstructural level [89,90]. ITZ has a significant impact on the characteristics of concrete because of the material’s many pores and the presence of soluble calcium hydroxide (CaOH) [90,91]. Images examined using a scanning electron microscope (SEM) were used in the current study (JEOL JSM 6510 lv). The microscope provides a stereoscopic image that is of outstanding quality and clarity and is used to inspect sample surfaces; 300,000-fold magnification is possible. The work process matches the investigations of Huang et al. [92]. SSC is made of unhydrated cement granules, quartz sand, and rehydration products like C-S-H [93,94]. SSC’s microstructure is influenced by its pore structure, rehydration outcomes, and ITZ microstructure [95,96]. The microstructure, morphology, and ITZ between the aggregate and paste were all examined using an SEM.
Figure 11a–g display cement paste SEM images for the following mixtures: the reference mix (M02), M04, M08, M10, M14, M18, and M23 were all tested after 28 days. The C-S-H gel is clearly spread out in these scanning images. The control mixture is shown in Figure 11a. It has been noted that the concrete mix contains irregularly shaped microparticles, along with visible micro-voids and micro-cracking. This is possibly the main cause of the worse performance of concrete mixes in terms of strength and durability when compared to mixes incorporating self-curing chemicals. The mixes with 1.5% PEG (M04) and 50% CC and 1.5% PEG (M08), respectively, are shown in Figure 11b,c. It is reported that as the hydration mechanism developed, the micro-voids were diminished. In these circumstances, mixtures containing 1.5% PEG (M04) and 50% CC/1.5% PEG (M08) provided better distribution than the control mix. This refers to the homogeneity of the C-S-H phases within the concrete matrix, which affect the integrity and durability of concrete. Furthermore, uniform distribution generally enhances concrete properties and gives it a regular, heavy structure. Early on, CH plates and widespread pin-like structures were produced by the delayed hydration process, as shown in Figure 11b. After hydration, C-S-H and second-generation ettringite filled the pores of the cement paste and aggregates. Ettringite tubular structures and calcium hydrate (CH) crystals were seen. Additionally, the addition of VP to the mixes M10, M14, M18, and M23 increased the production of C-S-H, enhanced its existence, and reduced the presence of calcium hydroxide.
Furthermore, the SEM microstructure pictures of the ITZs in the SCC mixtures after 28 days are shown in Figure 12a–g. Due to the roughness of the dolomite’s surface, it became apparent that the cohesion or link between it and the cement mortar was strengthened, while the cohesiveness or bond between it and the cement mortar was less when utilizing CC because of its smooth exterior surface, as seen in Figure 12c. However, when employing dolomite, there was a sort of harmony between the aggregate and the mortar, resulting in a considerably stronger link, as can be seen in Figure 12b. Perhaps as a result, mixtures with PEG, VP, and no CC have much-improved strength and durability compared to the control mix. In the reference mix (M02), there was a noticeable ITZ between the mortar and the aggregate. Apart from Figure 12c, Figure 12b–g showed that the ITZ between the paste matrix and the aggregate was exceedingly dense, had less CH, and was transformed into C-S-H. On the other hand, as is seen in Figure 12a–g, the ITZ in samples without CC is better than in samples with CC (M8). Figure 12c,d show that the ITZ thickness without and with CC was about 20 and 35 μm, respectively. Image analysis of the SEM micrographs estimated the porosity within the ITZ, showing that samples without CC had a lower porosity. Moreover, as can be noted, Figure 12c depicts that the CC in sample M8 contains pores that help absorb water. Consequently, the ITZs in mixes appear to be roughly as dense as the matrix [91,97].
From these results, it can be summarized that the significant benefits of using SCC, specifically in terms of water conservation and the utilization of sustainable materials such as VP and CC, are reaffirmed. The study findings validate the hypothesized advantages, demonstrating substantial water savings during the curing process, which are crucial for sustainability in arid regions or contexts where water is scarce. Moreover, the incorporation of VP and CC not only reduces dependence on traditional cement and aggregates but also enhances concrete durability and strength. While our results robustly support these aspects, the benefit of reduced cracking, although observed, was less pronounced compared to the gains in strength and durability. These outcomes align closely with previous studies’ initial discussions on the environmental and practical merits of SCC. Therefore, using VP and CC could enhance concrete characteristics, promoting environmental sustainability and resource efficiency. Here, it should be noted that the life cycle assessment of developed sustainable concrete should be studied, which can be considered in our future works. Furthermore, other wastes can be considered and evaluated in our future studies, such as plastic wastes [98]. Soft computing techniques [99] shall improve the time consumed by these experimental studies.

4. Conclusions

This research experimentally examines the effects of substituting recycled waste materials, crushed ceramic (CC) and volcanic powder (VP), into concrete with polyethylene glycol 6000 (PEG) to enhance the characteristics of sustainable self-curing concrete (SSC). The impacts of various PEG dosages of 1%, 1.5%, and 2% of cement with a constant coarse aggregate replacement ratio of 50%, including various percentages of VP (5%, 10%, 15%, and 20%), on concrete properties are evaluated using 26 concrete mixtures. The concrete’s microstructure and mechanical behavior were identified. The water absorption test was also used to investigate the durability of the concrete. The results show that adding PEG to concrete causes an increase in its workability. In addition, using 1.5% PEG and 10% VP (M11), the ideal dosage, globally enhanced the concrete characteristics, so, this can be considered the best mixture percentage to produce SSC in this study. Using CC in concrete production with 1.5% PEG and with/without 10% VP achieves the best mechanical, physical, and durability results. This implies that the used materials can be used to uphold the sustainability ideal of conserving natural resources while utilizing waste. Additionally, the following are the key conclusions of this study:
  • VP enhances the compression strength of SSC; however, adding 1.5% PEG improved the compression strength of SSC by 52.8%, 54.5%, 11.1%, and 2.4% with 5%, 10%, 15%, and 20% VP in cement mixes M10, M11, M12, and M13, respectively, with respect to M01, after 28 days. The compressive strength was decreased by using different percentages of VP, 1.5% PEG, and CC by 14.6%, 13.3%, 1.3%, and 12.7% compared to the mixes without CC (M10, M11, M12, and M13) after 56 days.
  • Using the ideal dosage (1.5% PEG and 10% VP (M11)) boosts the compressive strength by 55.17% compared to mixes that were air-cured after 28 days. When utilizing 1.5% PEG, the highest compression strength of 47 MPa was attained after 56 days. Concrete that underwent self-curing with PEG was able to reach an appropriate compression strength. When compared to air-cured concrete, using 1.5% PEG increased the compression strength by 49.3%.
  • The flexural and splitting tensile strengths improved by 34.9% and 60.7%, respectively, compared to the mix that was air-cured when using the ideal dosage. The flexural and splitting tensile strengths increased to 5.7 and 4.3 MPa, respectively, when 50% CC was substituted as the coarse aggregate with 1.5% of PEG (M08), as opposed to 4.3 and 2.8 MPa for the air-cured mixtures.
  • In comparison to alternative water-curing or air-curing processes, using self-curing systems with 1.5% PEG and 5% VP (M11) produced the lowest chloride penetrability, with an average depth of roughly 13 mm for M18 and about 20 mm and 19.8 mm for both water-cured and air-cured mixes, respectively.
Using recycled ceramic wastes as coarse aggregate replacements in concrete production yields the greatest results in terms of mechanical, physical, and durability qualities with the ideal dosage of PEG and VP. This can be applied to produce more sustainable concrete throughout the following: (a) VP can be added as an admixture to cement with different percentages. (b) The effect of this concrete with these different materials on the environment should be studied by making a model in a design builder program. (c) The effectiveness of PEG in reinforced concrete and its impact on steel rebars must be demonstrated through corrosion tests. (d) Concrete containing CC must undergo a bond test in order to be investigated. (e) Although it is anticipated that CC might be used as a complete replacement for coarse aggregate, a corrosion test and a carbonation penetrability test must be performed to determine how it will affect steel rebars. (f) To create an ultra-high-performance self-curing concrete that is completely sustainable, industrial tailings and agricultural wastes that are high in silica and calcium should be utilized. However, the shortage of skilled labor, supply chain resources, and cost should be considered challenges in developing this sustainable concrete.

Author Contributions

All authors contributed to the study conception and methodology. Test preparation and data collection were performed by H.M.E., M.M.Y.E. and I.A.E. supervised the project and revised and approved the manuscript. Formal analysis and data curation were performed by H.M.E. and M.R.K. Co-supervision, revision, and final checking were performed by M.R.K., I.A.E. and J.W.H. contributed to the funding and review and editing. All authors have read and agreed to the published version of the manuscript.

Funding

This research was supported by the Basic Science Research Program through the National Research Foundation of Korea (NRF) funded by the Ministry of Education (grant number) (NRF-2022R1I1A1A01062918).

Institutional Review Board Statement

Not applicable.

Informed Consent Statement

Not applicable.

Data Availability Statement

Data are contained within the article.

Acknowledgments

Dean of faculty of engineering, Horus University, Egypt, is acknowledged by the authors for facilitating laboratory work. The authors also want to express their sincere gratitude to Selim for his excellent editorial suggestions. We would like to thank Eng. Mostafa Al Saadawi for his assistance during the laboratory tests. The first author is really grateful to and proud of his family for their invaluable assistance.

Conflicts of Interest

The authors declare that they have no known competing financial interests or personal relationships that could have appeared to influence the work reported in this paper.

References

  1. Hakeem, I.Y.; Alharthai, M.; Amin, M.; Zeyad, A.M.; Tayeh, B.A.; Agwa, I.S. Properties of sustainable high-strength concrete containing large quantities of industrial wastes, nanosilica and recycled aggregates. J. Mater. Res. Technol. 2023, 24, 7444–7461. [Google Scholar] [CrossRef]
  2. Helmy, S.H.; Tahwia, A.M.; Mahdy, M.G.; Elrahman, M.A. Development and characterization of sustainable concrete incorporating a high volume of industrial waste materials. Constr. Build. Mater. 2023, 365, 130160. [Google Scholar] [CrossRef]
  3. Wang, P.; Wu, H.-L.; Ke, L.; Leung, C.K.Y. Mechanical and long-term durability prediction of GFRP rebars with the adoption of low-pH CSA concrete. Constr. Build. Mater. 2022, 346, 128444. [Google Scholar] [CrossRef]
  4. Sreenivasa, A.; Babu, T.S. Effect of Self Curing Compound on Strength and Durability of M25 Mix Concrete. Int. J. New Technol. Res. 2015, 1, 1–4. [Google Scholar]
  5. Ozer, B.; Ozkul, M.H. The influence of initial water curing on the strength development of ordinary portland and pozzolanic cement concretes. Cem. Concr. Res. 2004, 34, 13–18. [Google Scholar] [CrossRef]
  6. Memon, R.; Mohd, A.R.; Awang, A.; Huseien, G.; Memon, U. A review: Mechanism, materials and properties of self-curing concrete. J. Eng. Appl. Sci. 2018, 13, 24. [Google Scholar]
  7. Muthalvan, R.S.; Selvaraj, L.; Avudaiappan, S.; Liseitsev, Y. Performance evaluation of super absorbent polymer modified cement mortar with nano-silica/GGBS. Case Stud. Constr. Mater. 2023, 19, e02359. [Google Scholar] [CrossRef]
  8. Khan, R.A.; Gupta, C.; Alam, S. Strength and durability of self-curing concrete developed using calcium lignosulfonate. J. King Saud Univ. Eng. Sci. 2022, 34, 536–543. [Google Scholar] [CrossRef]
  9. Yang, J.; Fan, J.; Kong, B.; Cai, C.S.; Chen, K. Theory and application of new automated concrete curing system. J. Build. Eng. 2018, 17, 125–134. [Google Scholar] [CrossRef]
  10. Bentz, D.P. Influence of internal curing using lightweight aggregates on interfacial transition zone percolation and chloride ingress in mortars. Cem. Concr. Compos. 2009, 31, 285–289. [Google Scholar] [CrossRef]
  11. El-Hawary, M.; Al-Sulily, A. Internal curing of recycled aggregates concrete. J. Clean. Prod. 2020, 275, 122911. [Google Scholar] [CrossRef]
  12. Al Saffar, D.M.; Al Saad, A.J.K.; Tayeh, B.A. Effect of internal curing on behavior of high performance concrete: An overview. Case Stud. Constr. Mater. 2019, 10, e00229. [Google Scholar] [CrossRef]
  13. Mehta, P.K.; Monteiro, P.J.M. Concrete: Microstructure, Properties, and Materials; McGraw-Hill Education: New York, NY, USA, 2014. [Google Scholar]
  14. Neville, A.M. Properties of Concrete; Longman: London, UK, 1995; Volume 4. [Google Scholar]
  15. Sastry, K.; Kumar, P. Self-curing concrete with different self-curing agents. IOP Conf. Ser. Mater. Sci. Eng. 2018, 330, 12120. [Google Scholar] [CrossRef]
  16. Singh, K. Mechanical properties of self curing concrete studied using polyethylene glycol-400: A-review. Mater. Today Proc. 2021, 37, 2864–2871. [Google Scholar] [CrossRef]
  17. Makendran, C. Study on self-curing concrete using Polyethylene Glycol 600 for highway infrastructure project. Mater. Today Proc. 2023, 80, 1677–1682. [Google Scholar] [CrossRef]
  18. Khader, T.A.S.; Shabana, T.S. Experimental Investigation on the Mechanical Properties of Self Curing Concrete Using Sodium Lignosulphonate and Polyvinyl Alcohol. Int. J. Innov. Res. Sci. Eng. Technol. 2018, 10, 2580–2593. [Google Scholar]
  19. El-Dieb, A.S. Self-curing concrete: Water retention, hydration and moisture transport. Constr. Build. Mater. 2007, 21, 1282–1287. [Google Scholar] [CrossRef]
  20. Balasubramanian, D. Polyethylene glycol. J. Chem. Educ. 1983, 60, 77–78. [Google Scholar] [CrossRef]
  21. Ha, J.; Chae, S.; Chou, K.W.; Tyliszczak, T.; Monteiro, P.J.M. Effect of polymers on the nanostructure and on the carbonation of calcium silicate hydrates: A scanning transmission X-ray microscopy study. J. Mater. Sci. 2012, 47, 976–989. [Google Scholar] [CrossRef]
  22. Guan, W.; Ji, F.; Chen, Q.; Yan, P.; Pei, L. Synthesis and Enhanced Phosphate Recovery Property of Porous Calcium Silicate Hydrate Using Polyethyleneglycol as Pore-Generation Agent. Materials 2013, 6, 2846–2861. [Google Scholar] [CrossRef]
  23. Richardson, I.G. The calcium silicate hydrates. Cem. Concr. Res. 2008, 38, 137–158. [Google Scholar] [CrossRef]
  24. Cygan, R.T.; Greathouse, J.A.; Heinz, H.; Kalinichev, A.G. Molecular models and simulations of layered materials. J. Mater. Chem. 2009, 19, 2470–2481. [Google Scholar] [CrossRef]
  25. Makiniemi, R.O.; Das, P.; Honders, D.; Grygiel, K.; Cordella, D.; Detrembleur, C.; Yuan, J.; Walther, A. Conducting, Self-Assembled, Nacre-Mimetic Polymer/Clay Nanocomposites. ACS Appl. Mater. Interfaces 2015, 7, 15681–15685. [Google Scholar] [CrossRef] [PubMed]
  26. Krishnan, M.; Saharay, M.; Kirkpatrick, R.J. Molecular Dynamics Modeling of CO2 and Poly(ethylene glycol) in Montmorillonite: The Structure of Clay–Polymer Composites and the Incorporation of CO2. J. Phys. Chem. C 2013, 117, 20592–20609. [Google Scholar] [CrossRef]
  27. Zhou, Y.; Orozco, C.A.; Duque-Redondo, E.; Manzano, H.; Geng, G.; Feng, P.; Monteiro, P.J.; Miao, C. Modification of poly(ethylene glycol) on the microstructure and mechanical properties of calcium silicate hydrates. Cem. Concr. Res. 2019, 115, 20–30. [Google Scholar] [CrossRef]
  28. Singh, V.K.; Khatri, S.D.; Singh, R.K. Hydration and Some Other Properties of Polyethylene Glycol Modified Cement Products. Trans. Indian Ceram. Soc. 2002, 61, 152–161. [Google Scholar] [CrossRef]
  29. Zhou, Y.; Hou, D.; Geng, G.; Feng, P.; Yu, J.; Jiang, J. Insights into the interfacial strengthening mechanisms of calcium-silicate-hydrate/polymer nanocomposites. Phys. Chem. Chem. Phys. 2018, 20, 8247–8266. [Google Scholar] [CrossRef] [PubMed]
  30. Naik, T. Sustainability of Cement and Concrete Industries. In Proceedings of the International Conference on Achieving Sustainability in Construction, Dundee, UK, 5–6 July 2005. [Google Scholar] [CrossRef]
  31. Manjunatha, M.; Preethi, S.; Malingaraya; Mounika, H.G.; Niveditha, K.N.; Ravi. Life cycle assessment (LCA) of concrete prepared with sustainable cement-based materials. Mater. Today Proc. 2021, 47, 3637–3644. [Google Scholar] [CrossRef]
  32. Keshta, M.M.; Elshikh, M.M.Y.; Kaloop, M.R.; Hu, J.W.; ELMohsen, I.A. Effect of magnetized water on characteristics of sustainable concrete using volcanic ash. Constr. Build. Mater. 2022, 361, 129640. [Google Scholar] [CrossRef]
  33. Naran, J.M.; Gonzalez Gonzalez, R.E.; del Rey Castillo, E.; Toma, C.L.; Almesfer, N.; van Vreden, P.; Saggi, O. Incorporating waste to develop environmentally-friendly concrete mixes. Constr. Build. Mater. 2022, 314, 125599. [Google Scholar] [CrossRef]
  34. Ray, S.; Haque, M.; Sakib, M.N.; Mita, A.F.; Rahman, M.D.M.; Tanmoy, B.B. Use of ceramic wastes as aggregates in concrete production: A review. J. Build. Eng. 2021, 43, 102567. [Google Scholar] [CrossRef]
  35. Mustafa, A.; Abdullah, M.M.A.B.; Noor, N.M.; Kamarudin, H.; Salleh, M.A.A.M.; Abdullah, A. Strength of Concrete Based Cement Using Recycle Ceramic Waste as Aggregate. Adv. Mater. Res. 2013, 740, 734–738. [Google Scholar] [CrossRef]
  36. Meena, R.V.; Jain, J.K.; Chouhan, H.S.; Beniwal, A.S. Use of waste ceramics to produce sustainable concrete: A review. Clean. Mater. 2022, 4, 100085. [Google Scholar] [CrossRef]
  37. Soleimani, S.M.; Alaqqad, A.; Afrasiab, T.; Jumaah, A.; Behbehani, A.; Majeed, A.; AlSawwaf, M.H.; AlMuhanna, S. A sustainable solution for ceramic and steel wastes in self-consolidating, high-performance concrete. IOP Conf. Ser. Earth Environ. Sci. 2020, 588, 042062. [Google Scholar] [CrossRef]
  38. Suzuki, M.; Meddah, S.; Sato, R. Use of Porous Ceramic Waste Aggregates for Internal Curing of High-Performance Concrete. Cem. Concr. Res. 2009, 39, 373–381. [Google Scholar] [CrossRef]
  39. Decker, R.W.; Decker, B.B. Volcano Geology. Available online: https://www.britannica.com/science/volcano/additional-info#contributors (accessed on 1 May 2024).
  40. Yazıcı, H.; Yiğiter, H.; Karabulut, A.Ş.; Baradan, B. Utilization of fly ash and ground granulated blast furnace slag as an alternative silica source in reactive powder concrete. Fuel 2008, 87, 2401–2407. [Google Scholar] [CrossRef]
  41. Lemougna, P.N.; Wang, K.T.; Tang, Q.; Nzeukou, A.N.; Billong, N.; Melo, U.C.; Cui, X.M. Review on the use of volcanic ashes for engineering applications. Resour. Conserv. Recycl. 2018, 137, 177–190. [Google Scholar] [CrossRef]
  42. Alraddadi, S.; Assaedi, H. Characterization and potential applications of different powder volcanic ash. J. King Saud Univ. Sci. 2020, 32, 2969–2975. [Google Scholar] [CrossRef]
  43. Alraddadi, S. Surface and thermal properties of fine black and white volcanic ash. Mater. Today Proc. 2019, 26, 1964–1966. [Google Scholar] [CrossRef]
  44. Tchakoute, H.K.; Elimbi, A.; Yanne, E.; Djangang, C.N. Utilization of volcanic ashes for the production of geopolymers cured at ambient temperature. Cem. Concr. Compos. 2013, 38, 75–81. [Google Scholar] [CrossRef]
  45. Langmann, B.; Zakšek, K.; Hort, M.; Duggen, S. Volcanic ash as fertiliser for the surface ocean. Atmos. Chem. Phys. 2010, 10, 3891–3899. [Google Scholar] [CrossRef]
  46. Querol, X.; Umana, J.C.; Plana, F.; Alastuey, A.; Lopez-Soler, A.; Medinaceli, A.; Valero, A.; Domingo, M.J.; Garcia-Rojo, E. Synthesis of zeolites from fly ash at pilot plant scale. Examples of potential applications. Fuel 2001, 80, 857–865. [Google Scholar] [CrossRef]
  47. Hossain, K.M.A.; Lachemi, M. Strength, durability and micro-structural aspects of high performance volcanic ash concrete. Cem. Concr. Res. 2007, 37, 759–766. [Google Scholar] [CrossRef]
  48. Khurram, N.; Khan, K.; Saleem, M.U.; Amin, M.N.; Akmal, U. Effect of Elevated Temperatures on Mortar with Naturally Occurring Volcanic Ash and Its Blend with Electric Arc Furnace Slag. Adv. Mater. Sci. Eng. 2018, 2018, 5324036. [Google Scholar] [CrossRef]
  49. Alqarni, A.S. A comprehensive review on properties of sustainable concrete using volcanic pumice powder ash as a supplementary cementitious material. Constr. Build. Mater. 2022, 323, 126533. [Google Scholar] [CrossRef]
  50. Malhotra, V.M. Making Concrete ‘Greener’ with Fly Ash. Concr. Int. 1999, 21, 61–66. [Google Scholar]
  51. Mo, K.H.; Alengaram, U.J.; Jumaat, M.Z.; Yap, S.P.; Lee, S.C. Green concrete partially comprised of farming waste residues: A review. J. Clean. Prod. 2016, 117, 122–138. [Google Scholar] [CrossRef]
  52. Mousa, M.I.; Mahdy, M.G.; Abdel-Reheem, A.H.; Yehia, A.Z. Mechanical properties of self-curing concrete (SCUC). HBRC J. 2015, 11, 311–320. [Google Scholar] [CrossRef]
  53. Younis, M.O.; Amin, M.; Tahwia, A.M. Case Studies in Construction Materials Durability and mechanical characteristics of sustainable self-curing concrete utilizing crushed ceramic and brick wastes. Case Stud. Constr. Mater. 2022, 17, e01251. [Google Scholar] [CrossRef]
  54. BS EN 197-1; Cement. Composition, Specifications and Conformity Criteria for Common Cements. British Standards Institution: London, UK, 2011.
  55. ASTM C191-19; Standard Test Methods for Time of Setting of Hydraulic Cement by Vicat Needle. ASTM International: West Conshohocken, PA, USA, 2019.
  56. Egyptian Organization for Standardization and Quality. Egyptian Standards (1109/2021): Standard Specifications for the Physical and Mechanical Properties of Concrete; Egyptian Organization for Standardization and Quality: Cairo, Egypt, 2021. [Google Scholar]
  57. Egyptian Organization for Standardization and Quality. Egyptian Organization for Standards & Quality Standard (8615–1/2019): Standard for Volcanic Rocks; Egyptian Organization for Standardization and Quality: Cairo, Egypt, 2019. [Google Scholar]
  58. ASTM C494/C494M-15; Standard Specification for Chemical Admixtures for Concrete. ASTM International: West Conshohocken, PA, USA, 2015. [CrossRef]
  59. ASTM C33/C33M-13; Standard Specification for Concrete Aggregates. ASTM International: West Conshohocken, PA, USA, 2013. [CrossRef]
  60. Anderson, D.J.; Smith, S.T.; Au, F.T.K. Mechanical properties of concrete utilising waste ceramic as coarse aggregate. Constr. Build. Mater. 2016, 117, 20–28. [Google Scholar] [CrossRef]
  61. Zhao, W.; Yang, J.; Zhao, W.; Yang, C. Experimental study on the influence of mixing time on concrete performance under different mixing modes. Sci. Eng. Compos. Mater. 2021, 28, 638–651. [Google Scholar] [CrossRef]
  62. ASTM C143/C143M-15; Standard Test Method for Slump of Hydraulic Cement Concrete. ASTM International: West Conshohocken, PA, USA, 2015. [CrossRef]
  63. BS EN 12390; Testing of Hardened Concrete. Determination of Electrical Resistivity. BSI Standards: London, UK, 2023.
  64. ASTM C496/C496M-11; Standard Test Method for Splitting Tensile Strength of Cylindrical Concrete Specimens. ASTM International: West Conshohocken, PA, USA, 2011. [CrossRef]
  65. ASTM C78/C78M-15a; Standard Test Method for Flexural Strength of Concrete (Using Simple Beam with Third-Point Loading). ASTM International: West Conshohocken, PA, USA, 2015. [CrossRef]
  66. ASTM C192/C192M-16a; Standard Practice for Making and Curing Concrete Test Specimens in the Laboratory. ASTM International: West Conshohocken, PA, USA, 2016.
  67. Watanasrisin, P.; Supatnantakul, K.; Leelawat, T. Three Colorimetric Methods for Evaluating Chloride Penetration of Cracked and Coated Concrete. In Proceedings of the International Conference on Chemical, Civil and Environmental Engineering (CCEE’2014), Singapore, 18–19 November 2014. [Google Scholar]
  68. He, F.; Shi, C.; Yuan, Q.; Chen, C.; Zheng, K. AgNO3-based colorimetric methods for measurement of chloride penetration in concrete. Constr. Build. Mater. 2012, 26, 1–8. [Google Scholar] [CrossRef]
  69. Knapen, E.; Van Gemert, D. Cement hydration and microstructure formation in the presence of water-soluble polymers. Cem. Concr. Res. 2009, 39, 6–13. [Google Scholar] [CrossRef]
  70. Karolina, R.; Simanjuntak, M. The influence of using volcanic ash and lime ash as filler on compressive strength in self compacting concrete. IOP Conf. Ser. Earth Environ. Sci. 2018, 126, 12038. [Google Scholar] [CrossRef]
  71. Olawuyi, B.J.; Olusola, K.O. Compressive Strength of Volcanic Ash/Ordinary Portland Cement Laterized Concrete. Civ. Eng. Dimens. 2010, 12, 23–28. [Google Scholar] [CrossRef]
  72. Schröfl, C.; Mechtcherine, V.; Gorges, M. Relation between the molecular structure and the efficiency of superabsorbent polymers (SAP) as concrete admixture to mitigate autogenous shrinkage. Cem. Concr. Res. 2012, 42, 865–873. [Google Scholar] [CrossRef]
  73. Althoey, F.; Hakeem, I.Y.; Hosen, M.A.; Qaidi, S.; Isleem, H.F.; Hadidi, H.; Shahapurkar, K.; Ahmad, J.; Ali, E. Behavior of Concrete Reinforced with Date Palm Fibers. Materials 2022, 15, 7923. [Google Scholar] [CrossRef] [PubMed]
  74. Alizadeh, R.; Beaudoin, J.J.; Raki, L.; Terskikh, V. C–S–H/polyaniline nanocomposites prepared by in situ polymerization. J. Mater. Sci. 2011, 46, 460–467. [Google Scholar] [CrossRef]
  75. Pellenq, R.J.-M.; Lequeux, N.; van Damme, H. Engineering the bonding scheme in C–S–H: The iono-covalent framework. Cem. Concr. Res. 2008, 38, 159–174. [Google Scholar] [CrossRef]
  76. Beaudoin, J.J.; Dramé, H.; Raki, L.; Alizadeh, R. Formation and properties of C-S-H–PEG nano-structures. Mater. Struct. 2009, 42, 1003–1014. [Google Scholar] [CrossRef]
  77. Zeyad, A.; Shubaili, M.; Abutaleb, A. Using volcanic pumice dust to produce high-strength self-curing concrete in hot weather regions. Case Stud. Constr. Mater. 2023, 18, e01927. [Google Scholar] [CrossRef]
  78. Otsuki, N.; Nagataki, S.; Nakashita, K. Evaluation of AgNO3 Solution Spray Method for Measurement of Chloride Penetration into Hardened Cementitious Matrix Materials. ACI Mater. J. 1992, 89, 587–592. [Google Scholar] [CrossRef]
  79. Qaidi, S.; Al-Kamaki, Y.; Hakeem, I.; Dulaimi, A.F.; Özkılıç, Y.; Sabri, M.; Sergeev, V. Investigation of the physical-mechanical properties and durability of high-strength concrete with recycled PET as a partial replacement for fine aggregates. Front. Mater. 2023, 10, 1101146. [Google Scholar] [CrossRef]
  80. Al-Fakih, A.; Mohammed, B.S.; Liew, M.S.; Alaloul, W.S. Physical properties of the rubberized interlocking masonry brick. Int. J. Civ. Eng. Technol. 2018, 9, 656–664. [Google Scholar]
  81. ASTM C140/C140M-22b; Standard Test Methods for Sampling and Testing Concrete Masonry Units and Related Units. ASTM International: West Conshohocken, PA, USA, 2003.
  82. Ogawa, Y.; Bui, P.T.; Kawai, K.; Sato, R. Effects of porous ceramic roof tile waste aggregate on strength development and carbonation resistance of steam-cured fly ash concrete. Constr. Build. Mater. 2020, 236, 117462. [Google Scholar] [CrossRef]
  83. Zhang, S.P.; Zong, L. Evaluation of Relationship between Water Absorption and Durability of Concrete Materials. Adv. Mater. Sci. Eng. 2014, 2014, 650373. [Google Scholar] [CrossRef]
  84. Bui, P.T.; Ogawa, Y.; Nakarai, K.; Kawai, K.; Sato, R. Internal curing of Class-F fly-ash concrete using high-volume roof-tile waste aggregate. Mater. Struct. 2017, 50, 203. [Google Scholar] [CrossRef]
  85. Muragishi, Y.; Ogawa, Y.; Kawai, K.; Sato, R. Effect of Porous Ceramic Waste Aggregate on Durability of Steam Cured Fly Ash Concrete. Cem. Sci. Concr. Technol. 2014, 68, 337–344. [Google Scholar] [CrossRef]
  86. Higashiyama, H.; Yagishita, F.; Sano, M.; Takahashi, O. Compressive strength and resistance to chloride penetration of mortars using ceramic waste as fine aggregate. Constr. Build. Mater. 2012, 26, 96–101. [Google Scholar] [CrossRef]
  87. Ahmad, J.; Althoey, F.; Abuhussain, M.A.; Deifalla, A.F.; Özkılıç, Y.O.; Rahmawati, C. Durability and microstructure analysis of concrete made with volcanic ash: A review (Part II). Sci. Eng. Compos. Mater. 2023, 30, 20220211. [Google Scholar] [CrossRef]
  88. Siddique, R. Properties of concrete made with volcanic ash. Resour. Conserv. Recycl. 2012, 66, 40–44. [Google Scholar] [CrossRef]
  89. Alsaadawi, M.M.; Amin, M.; Tahwia, A.M. Thermal, mechanical and microstructural properties of sustainable concrete incorporating Phase change materials. Constr. Build. Mater. 2022, 356, 129300. [Google Scholar] [CrossRef]
  90. Erdem, S.; Dawson, A.R.; Thom, N.H. Impact load-induced micro-structural damage and micro-structure associated mechanical response of concrete made with different surface roughness and porosity aggregates. Cem. Concr. Res. 2012, 42, 291–305. [Google Scholar] [CrossRef]
  91. Tahwia, A.M.; Elgendy, G.M.; Amin, M. Durability and microstructure of eco-efficient ultra-high-performance concrete. Constr. Build. Mater. 2021, 303, 124491. [Google Scholar] [CrossRef]
  92. Huang, Q. Insights for global energy interconnection from China renewable energy development. Glob. Energy Interconnect. 2020, 3, 1–11. [Google Scholar] [CrossRef]
  93. Sorelli, L.; Constantinides, G.; Ulm, F.-J.; Toutlemonde, F. The nano-mechanical signature of Ultra High Performance Concrete by statistical nanoindentation techniques. Cem. Concr. Res. 2008, 38, 1447–1456. [Google Scholar] [CrossRef]
  94. Ahmed, S.F.U.; Maalej, M.; Paramasivam, P. Flexural responses of hybrid steel–polyethylene fiber reinforced cement composites containing high volume fly ash. Constr. Build. Mater. 2007, 21, 1088–1097. [Google Scholar] [CrossRef]
  95. Amin, M.; Tayeh, B.A.; Agwa, I.S. Effect of using mineral admixtures and ceramic wastes as coarse aggregates on properties of ultrahigh-performance concrete. J. Clean. Prod. 2020, 273, 123073. [Google Scholar] [CrossRef]
  96. Liu, J.; Shi, C.; Wu, Z. Hardening, microstructure, and shrinkage development of UHPC: A review. J. Asian Concr. Fed. 2019, 5, 1–19. [Google Scholar] [CrossRef]
  97. Amin, M.; Zeyad, A.M.; Tayeh, B.A.; Agwa, I.S. Effects of nano cotton stalk and palm leaf ashes on ultrahigh-performance concrete properties incorporating recycled concrete aggregates. Constr. Build. Mater. 2021, 302, 124196. [Google Scholar] [CrossRef]
  98. Jaf, D.; Abdulrahman, P.; Mohammed, A.; Kurda, R.; Qaidi, S.; Asteris, P. Machine learning techniques and multi-scale models to evaluate the impact of silicon dioxide (SiO2) and calcium oxide (CaO) in fly ash on the compressive strength of green concrete. Constr. Build. Mater. 2023, 400, 132604. [Google Scholar] [CrossRef]
  99. Ahmad, J.; Majdi, A.; Elhag, A.B.; AF, D.; Soomro, M.; Isleem, H.F.; Qaidi, S. A Step towards Sustainable Concrete with Substitution of Plastic Waste in Concrete: Overview on Mechanical, Durability and Microstructure Analysis. Crystals 2022, 12, 944. [Google Scholar] [CrossRef]
Figure 1. Processing steps to estimate the VP.
Sustainability 16 04659 g001
Figure 2. (a) Coarse aggregate of CC; (b) coarse aggregate of dolomite; (c) VP; (d) polyethylene glycol 6000.
Sustainability 16 04659 g002
Figure 3. Natural aggregate and light-weight aggregate grading curves.
Sustainability 16 04659 g003
Figure 4. Chloride penetration depth.
Sustainability 16 04659 g004
Figure 5. Slump results of SSC mixtures for (a) effect of PEG, (b) effect of VP, and (c) effect of curing temperature.
Sustainability 16 04659 g005
Figure 6. Compressive strength of SSC for different mixtures.
Sustainability 16 04659 g006
Figure 7. SEM photo of M08.
Sustainability 16 04659 g007
Figure 8. Splitting tensile strength of SSC mixtures for (a) effect of PEG, (b) effect of VP, and (c) effect of curing temperature.
Sustainability 16 04659 g008
Figure 9. Flexural strength of SSC mixtures for (a) effect of PEG, (b) effect of VP, and (c) effect of curing temperature.
Sustainability 16 04659 g009
Figure 10. Average chloride penetration depth after 28 days.
Sustainability 16 04659 g010
Figure 11. SEM images of cement paste.
Sustainability 16 04659 g011
Figure 12. SEM images of ITZ between cement paste and coarse aggregate.
Sustainability 16 04659 g012aSustainability 16 04659 g012b
Table 1. Physical characteristics of cement.
PropertyUnitValue
Specific gravity 3.15
Specific surface area(cm2/gm)3500
Density(Kg/m3)1440
Initial setting time(min)60
Final setting time(min)525
Table 2. VP’s characteristics.
PropertyValue
Physical
Specific gravity2.65
Bulk unit weight (Kg/m3)1650
Specific surface area (cm2/gm)3500
colorGrey
Chemical compositions (%)
Al2O313.91
Fe2O36.12
SiO265.66
CaO3.41
K2O3.32
MgO1.33
SO30.13
LOI0.67
Na2O3.93
Table 3. Characteristics of aggregates.
PropertyFine Aggregate (Sand)Coarse Aggregate (Dolomite)Lightweight Aggregate (Crushed Ceramic)
Bulk density (Kg/m3)165016001400
Specific gravity2.662.682.36
Water absorption (%)-2.159
Impact value (%)-16.821.3
Clay and fine materials (%)0.860.950.1
Los Angeles abrasion loss (%)-15.822.5
Table 4. PEG characteristics.
PEG TypePEG
Hydroxyl number, mg KOH/g.178–197
Average molecular weight.570–630
pH at 25 °C, 5% Aqueous solution.4.5–7.5
Liquid density, g/cc 20 °C.1.002
Melting or freezing range, °C.15–25
Average number of repeating Oxyethylene units.13.2
Viscosity at 100 °C.10.8
Solubility in water at 20 °C, % by weight.Complete
Table 5. Concrete mixture proportions (Kg/m3).
Mix IDPCVPWaterSPSandDolomiteCCPEG
M01 (air-cured control)400-18047341101--
M02 (water-cured control)400-18047341101--
M03 400-18047301095-4
M04400-18047281091-6
M05400-18047261088-8
M06400-1804706530530-
M07400-18047025275274
M08400-18047005255256
M09400-18046985235238
M103802018047261090-6
M113604018047241085-6
M123406018047231084-6
M133208018047221083-6
M14380201804704528528-
M15360401804703527527-
M16340601804701526526-
M17320801804701526526-
M183802018047005245246
M193604018046985245246
M203406018046975225226
M213208018046955215216
M22400018047005255256
M233802018047005245246
M243604018046985245246
M253406018046975225226
M263208018046955215216
Disclaimer/Publisher’s Note: The statements, opinions and data contained in all publications are solely those of the individual author(s) and contributor(s) and not of MDPI and/or the editor(s). MDPI and/or the editor(s) disclaim responsibility for any injury to people or property resulting from any ideas, methods, instructions or products referred to in the content.

