Abstract
The transportation sector plays a pivotal role in China’s efforts to achieve CO2 reduction targets. As the capital of China, Beijing has the responsibility to lead the era’s demand for low-carbon development and provide replicable and scalable low-carbon transportation development experience and knowledge for other cities in China. This study calculates the CO2 emissions of the transportation sector in Beijing from 1999 to 2019, constructs an extended STIRPAT model (population, affluence, technology, and efficiency), employs ridge regression to mitigate the effects of multicollinearity among the eight indicators, reveals the extent and direction of influence exerted by different indicators on CO2 emissions, and predicts the development trends, peak times, and quantities of transportation CO2 emissions in nine scenarios for Beijing from 2021 to 2035. Finally, adaptive low-carbon planning strategies are proposed for Beijing pertaining to population size and structure, industrial layout optimization, urban functional reorganization and adjustment, transportation infrastructure allocation, technological research and promotion, energy transition planning, and regional collaborative development. The results are as follows: (1) The total amount of CO2 emissions from Beijing’s transportation sector exhibits a trend of gradually stabilizing in terms of growth, with a corresponding gradual deceleration in the rate of increase. Kerosene, gasoline, and diesel are the main sources of transportation CO2 emissions in Beijing, with an annual average proportion of 95.78%. (2) The degree of influence of the indicators on transportation CO2 emissions, in descending order, is energy intensity, per capita GDP, population size, GDP by transportation sector, total transportation turnover, public transportation efficiency, possession of private vehicles, and clean energy structure. Among them, the proportion of clean energy structure and public transportation efficiency are negatively correlated with transportation CO2 emissions, while the remaining indicators are positively correlated. (3) In the nine predicted scenarios, all scenarios, except scenario 2 and scenario 4, can achieve CO2 emission peaks by 2030, while scenarios 7 and 9 can reach the peak as early as 2025. (4) The significant advancement and application of green carbon reduction technologies have profound implications, as they can effectively offset the impacts of population, economy, and efficiency indicators under extensive development. Effective population control, sustainable economic development, and transportation efficiency improvement are viable means to help achieve carbon peaking and peak value in the transportation sector.
1. Introduction
As the issue of global climate change becomes increasingly severe, there is an international consensus that low-carbon development should be pursued to address this problem. In 2021, the transportation sector accounted for 25% of global CO2 emissions, reaching 7.7 billion tons [1]. The transportation industry is therefore a key sector for achieving global CO2 emission reduction targets [2,3,4]. As the largest developing economy, China is undergoing rapid industrialization, motorization, and urbanization. This rapid development has led to a significant increase in energy consumption and greenhouse gas emissions. China is currently the world’s largest emitter of CO2 emissions [5,6], with its transportation sector ranking third in CO2 emissions across all industries [6,7,8,9]. Furthermore, China is also one of the countries experiencing the fastest growth rate of CO2 emissions from the transportation sector [10]. Consequently, the transportation industry will become a priority sector for achieving China’s “dual carbon” goals of a carbon peak by 2030 and carbon neutrality by 2060 [4,6].
As the capital of China, Beijing is also a national low-carbon pilot city and a low-carbon transportation pilot city; as such, Beijing must play a vital leading and demonstrative role in CO2 emission reductions in transportation. In 2019, transportation-related CO2 emissions in Beijing accounted for nearly 40% of energy-related CO2 emissions, ranking first among cities across the country [10]. Due to its unique urban economic structure, Beijing faces greater challenges in low-carbon transportation development than other cities. Therefore, it is crucial and urgent to clarify the mechanisms of CO2 emission growth in Beijing’s transportation sector during its development and to efficiently and accurately predict future trends in transportation CO2 emissions by using scientific methods. Based on the prediction results, the government and relevant decision-making departments can manage and control the development status and trends of transportation CO2 emissions in advance. By doing so, they can plan the main focus areas of low-carbon transportation development ahead of time, formulate targeted CO2 emission reduction strategies, and play a significant role in promoting the early realization of China’s “dual carbon” goals.
Current studies on predicting transportation CO2 emission mainly focus on two aspects: the identification of factors affecting transportation CO2 emissions and the prediction of trends in transportation CO2 emissions. Clarifying the influencing factors of transportation CO2 emissions is the basis for establishing prediction models. Researchers have explored the influencing factors of transportation CO2 emissions from different perspectives, including the influencing factors related to energy and industry, such as population size, economic growth [11], energy structure, energy efficiency [12], industrial structure [13], energy intensity [14,15], transportation intensity [4,16], urbanization level, technological innovation level [17], degree of trade openness [18], and fixed asset investment; the factors related to the transportation sector, such as transportation infrastructure investment [19], transportation mode [20], transportation industry added value [21], civilian car ownership [22], freight turnover [23], and passenger turnover [24]; and the factors related to transportation infrastructure, such as road mileage [25], public transportation [26,27], city size, urban road density, and private car ownership [28,29].
In terms of the prediction of transportation CO2 emission trends, researchers have built prediction models based on the abovementioned influencing factors to predict transportation CO2 emission trends under different scenarios and provide targeted strategies. Relevant model building methods include forecasting models based on environmental economics principles [30,31,32,33], grey prediction models based on grey system theory [34,35,36,37], the linear programming-based LEAP model [38,39,40,41,42,43], system dynamics models [44,45,46], combined applications of various machine learning models [47,48,49,50]. The objects of empirical research cover different scales such as countries, regions, provinces, and cities. The same influencing factor may have different effects at different scales, which means that transportation CO2 emission prediction is a very complicated process. Therefore, the particularity of the research object and the availability of data should be fully considered when selecting a prediction model.
Previous studies on the CO2 emission forecast of the transportation sector in Beijing mainly focus on the changes in energy consumption structure, predictions of CO2 emissions, and comparisons of CO2 emission reduction effects under different transportation policy scenarios, such as public transportation electrification substitution [51], vehicle purchase restrictions and promotion of new energy vehicles [52], growth in motor vehicle ownership [53], license plate restrictions and lottery [54], and various policy combinations [55]. Additionally, micro-level research has been conducted on the CO2 emissions from daily transportation [56] and commuting emissions forecasts [57,58]. However, few studies have examined the overall CO2 emission forecast of the transportation sector in Beijing, and there are also issues with data timeliness [59,60], which has limitations in reflecting the changing trends and peak predictions of Beijing’s transportation CO2 emissions in recent years. Moreover, this study needs to confirm the applicability of existing influencing factors and forecasting methods for empirical research in Beijing, due to its unique urban and economic structures.
Compared to existing research, this study offers the following contributions: (1) It presents transportation CO2 emissions in Beijing from 1999 to 2019 and forecasts their development trends and peak timeline during the period of 2021–2035, addressing the data currency limitations in prior studies on influencing factors and projections related to transportation carbon emissions in Beijing. These findings are crucial for assessing the risks and quality of Beijing’s low-carbon sustainable development. (2) This study expands the coverage of the indicators in the transportation CO2 emission forecasting model, incorporating “efficiency” as a new factor into the three traditional STIRPAT model factors (population, affluence, and technology), and further explores the influence of new variables, such as public transport efficiency, transportation turnover, and private car ownership, on Beijing’s transportation CO2 emission predictions. (3) In the forecasting model, three levels of change rates are set for variables—low speed, business as usual (BAU), and high speed—combined with Beijing’s recent development status and official planning objectives. This provides nine different characteristic forecasting scenarios, offering references for the development route and expected effects of low-carbon transportation planning in Beijing and differentiated decision-making guidance for matching scenarios. (4) This study also presents Beijing’s sustainable development strategies in terms of population, economy, technology, and efficiency, which provides important insights into ecological environment, low-carbon spatial planning of urban and rural areas as well as urban reconstruction and development in Beijing and its surrounding regions.
2. Materials and Methods
2.1. Data Sources
The time range examined in this study was from 1999 to 2019. In China, the transportation, storage, and postal services are considered as a single industrial sector, mainly including operational vehicles related to transportation operations such as public transport, freight transport, and passenger transport, excluding non-operational civilian vehicles (such as private cars). Given that the energy consumption of the storage and postal services is relatively small, the energy consumption data of the transportation, storage, and postal services are used when calculating the energy-related data of the transportation sector [61]. CO2 emissions and CES data for the transportation sector were obtained from the “China Energy Statistical Yearbook” for the years 2000–2020, while other indicator data were obtained from the “China Statistical Yearbook” and “Beijing Statistical Yearbook” for the years 2000 to 2020. To guarantee the comparability of economic indicators (PF and TG), the influences of price factors were excluded. The corresponding data from 1999 were taken as the baseline for recalculating at comparable prices.
Given the impact of the COVID-19 pandemic in Beijing from 2020 to 2022, home isolation policies significantly affected the operation of the transportation sector. Therefore, the growth values for the three indicators GDP by transportation sector (TG), total transportation turnover (TT), and public transportation efficiency (PTE) were calculated based on the 2020 statistical data during the pandemic period (2020–2022). By 2023, as the pandemic’s impact lifted, the transportation sector essentially returned to its pre-pandemic state, and these three indicators were calculated based on the 2019 pre-pandemic data. The growth values for the other five indicators were calculated according to the 2022 “China Statistical Yearbook” and “Beijing Statistical Yearbook”.
2.2. Calculation of Transportation CO2 Emissions
In this study, the total CO2 emissions of the transportation sector are composed of direct CO2 emissions from energy consumption in the transportation industry (excluding indirect CO2 emissions from electricity consumption) and CO2 emissions from gasoline and diesel consumption in residents’ lives [62,63]. The calculation of total CO2 emissions in the transportation sector is as follows:
where denotes the total CO2 emissions of the transportation sector, represents the CO2 emissions from fossil fuel consumption in the transportation sector, and represents the CO2 emissions from the consumption of gasoline and diesel related to transportation activities in residential life.
The CO2 emissions from energy consumption in the transportation sector are calculated as follows:
In the CO2 emission calculation of , represents the total consumption of the -th fossil fuel, and represents the total number of energy consumption statistics in the transportation sector, involving Raw Coal, Briquettes, Gasoline, Kerosene, Diesel Oil, Fuel Oil, Liquefied Petroleum Gas, Natural Gas, and other energy sources. is the heat value produced per physical unit of fossil fuel combustion. is the CO2 emissions per unit net calorific value produced by fuel (carbon content); is the oxidation ratio during fossil fuel combustion. For , only the CO2 emissions from the consumption of gasoline and diesel oil related to transportation in the residential life sector are calculated. The CO2 emission factors used in the above calculations are all derived from the study by Shan et al. [62].
2.3. Extended STIRPAT Model
Ehrlich and Holdren [64] first proposed the IPAT model, which considered the environmental impact of three factors: population, affluence, and technology. To overcome the limitations of the IPAT model in practical applications, York et al. [65] introduced random variables and regression methods to improve the IPAT model and proposed the STIRPAT model (Equation (3)). The STIRPAT model has various advantages such as flexibility, interpretability, and predictability. It has been widely applied in exploring influencing factors of carbon emissions and for prediction [30,31]. The logarithmic form of the STIRPAT model is shown in Equation (4).
where represents the environmental impact, represents population, represents affluence, represents the technology, represents the model coefficient, and , , and are the parameters to be estimated. denotes the random error term.
In order to comprehensively and systematically consider the factors affecting transportation-related CO2 emissions in Beijing, and to improve the explanatory power and accuracy of the prediction model, this paper builds upon the previously mentioned factors affecting transportation CO2 emissions. Furthermore, it refers to studies on the factors affecting transportation CO2 emissions in Beijing [66,67,68,69,70,71,72]. The STIRPAT model is expanded in four aspects—population, affluence, technology, and efficiency—and eight related indicators are constructed. (1) Population size (P) is represented by the permanent population in Beijing. (2) Affluence is represented by three indicators: the per capita gross domestic product (PG) reflects the overall economic development level of the city, the gross domestic product by the transportation sector (TG) reflects the prosperity of the economic development of the transportation sector, and the possession of private vehicles (PV) reflects the wealth of residents, which can also, to a certain extent, indicate the city’s transportation demand, energy consumption, and traffic congestion. (3) Technology is represented by two indicators: energy intensity (EI) reflects the overall energy utilization efficiency and energy conservation level of the transportation sector, and the clean energy structure (CES) reflects the level of clean energy technology application. (4) Efficiency is represented by two indicators: the total transportation turnover (TT) reflects the transportation demand, operational efficiency, and quality of the transportation system, while the public transportation efficiency (PTE) reflects the transportation capacity and efficiency of the public transportation system (Table 1).

Table 1.
Description of the STIRPAT model variables.
Thus, the extended STIRPAT model, a prediction model of transportation CO2 emissions, can be expressed as:
where represents CO2 emissions from the transportation sector, and , , , , , , , and are the abbreviations for the eight indicators listed in Table 1. , , , , , , , and are the regression coefficients of the respective variables, reflecting the elasticity relationship between each indicator and transportation CO2 emissions. When controlling other variables, a 1% change in the indicators PG, TG, PV, EI, CES, TT, PTE will cause the CO2 emissions to change by %, %, %, %, %, %, %, and %, respectively.
2.4. Ridge Regression Analysis
Ridge regression is a regularization method used for addressing linear regression problems; it is essentially an improved least squares method. By sacrificing the unbiasedness of the least squares method, it trades off the loss of some information and reduced accuracy to tackle multicollinearity and overfitting issues. By penalizing the model coefficients, it prevents the model from being overly complex, thus enhancing the robustness and generalization capability of the model.
Using SPSS 25.0 software, ordinary least squares linear regression was conducted to analyze the multicollinearity among the eight influencing factors of the extended STIRPAT model; the regression results are shown in Table 2. As can be seen from the regression results, the VIF values of , , , , , and are all greater than 10, indicating the presence of multicollinearity among the factors (Table 2). Only by eliminating multicollinearity in the model can the accuracy of the relationships between transportation CO2 emissions and influencing factors be ensured. Therefore, ridge regression was required for reanalysis in the prediction model.
Table 2.
The results of ordinary least squares regression.
2.5. Scenario Forecast Analysis
2.5.1. Setting Growth Rates of Influencing Factors in Different Scenarios
In this study, scenario analysis was employed to predict CO2 emissions from the transportation sector in Beijing. The growth rates of the eight influencing factors in the prediction model were set for low-speed, BAU, and high-speed scenarios, based on the planning and development goals for 2025 and 2035 in the 2017 “Beijing City Master Plan (2016–2035)” (“Policy I”), 2021 “The 14th Five-Year Plan for National Economic and Social Development of Beijing and the Outline of Long-Term Goals for 2035” (“Policy II”), 2022 “Beijing Transportation Development and Construction Plan in the 14th Five-Year Plan Period” (“Policy III”), and “Beijing Energy Development Plan in the 14th Five-Year Plan Period” (“Policy IV”), as shown in Table 3.
Table 3.
Setting of the indicator change rates.
- (1)
- Population size (P)
The annual average change rate of the population size was set based on the requirements of official policies “Policy I” and “Policy II”. Specifically, the population size is limited to ≤23 million people for 2021–2025 and strictly limited to 23 million people by 2035. It is evident that the future growth of the permanent population in Beijing will be significantly constrained. Therefore, under the high-speed scenario, the permanent populations for 2025 and 2035 cannot exceed the specified limits. Although the annual average growth rate of the permanent population in Beijing was 2.8% from 1999 to 2019, it has been in decline since reaching its peak in 2016, with an annual average growth rate of −0.081% from 2016 to 2019.
Based on the above analysis, under the BAU scenario, the annual average change rate of the permanent population in Beijing was set to −0.08% for 2021 to 2025, −0.03% for 2026 to 2030, and 0.02% for 2031 to 2035. Under the low-speed scenario, based on the BAU scenario, the annual average change rate of this indicator for each period decreases by 0.05%, i.e., −0.13% for 2021 to 2025, −0.18% for 2026 to 2030, and 0.23% for 2031 to 2035. Under the high-speed scenario, the annual average change rate of this indicator for each period increases by 0.05%, i.e., −0.03% for 2021 to 2025, 0.02% for 2026 to 2030, and 0.07% for 2031 to 2035 (Table 3).
- (2)
- Per capita GDP (PG)
“Policy I” aims for Beijing’s per capita GDP to reach RMB 2.1 million by 2025 and over RMB 3.2 million by 2035. Therefore, under the low-speed scenario, the per capita GDP values for 2025 and 2035 must meet the planned targets. Meanwhile, historical data show that Beijing’s per capita GDP (at comparable prices) had annual average growth rates of 10.62% from 1999 to 2019, 8.38% from 2011 to 2019, and 9.68% from 2016 to 2019.
Based on the analysis given above, under the BAU scenario, the annual average change rate of Beijing’s per capita GDP was set to 8.5% for 2021 to 2025, 6.5% for 2026 to 2030, and 4.5% for 2031 to 2035. Under the low-speed scenario, based on the BAU scenario, the annual average change rate of this indicator for each period decreases by 2%, i.e., 6.5% for 2021 to 2025, 4.5% for 2026 to 2030, and 2.5% for 2031 to 2035. Under the high-speed scenario, the annual average change rate of this indicator for each period increases by 2%, i.e., 10.5% for 2021 to 2025, 8.5% for 2026 to 2030, and 6.5% for 2031 to 2035.
- (3)
- GDP by the transportation sector (TG)
“Policy III” states that by 2035, Beijing will be the first to achieve a 2 h intra-city connection within the Beijing–Tianjin–Hebei urban agglomeration, a 3 h connection to major cities nationwide, and a global fast cargo logistics circle with 1-day domestic delivery, 2-day delivery to neighboring countries, and 3-day delivery to major cities worldwide. In terms of transportation hub system construction, a global international express hub cluster comprising Beijing–Tianjin–Xiong’an will be established. “Policy III” also specifies that by 2025, the number of air passenger throughput will increase from 50.6 million in 2020 to 140 million; the number of national railway passenger hubs will increase from 6 in 2020 to 8; and the length of rail transit will increase from 1091.7 km in 2020 to 1600 km. Furthermore, historical data show that the annual average growth rate of the GDP by the transportation sector in Beijing (at comparable prices) was 9.67% from 1999 to 2019 and 9.2% from 2016 to 2019. It is worth noting that Beijing is a city in the late stage of urbanization, with a high urbanization rate of 87.6% in 2022. Having passed the rapid expansion phase of transportation infrastructure construction, the economic development of the transportation sector will be affected by marginal effects.
Based on the above analysis, and referring to the setting method from existing studies [31], under the BAU scenario, the annual average change rate of the GDP by transportation sector in Beijing was set to 9% for 2021 to 2025, 7.5% for 2026 to 2030, and 6% for 2031 to 2035. Under the low-speed scenario, based on the BAU scenario, the annual average change rate of this indicator for each period decreases by 1%, i.e., 8% for 2021 to 2025, 6.5% for 2026 to 2030, and 5% for 2031 to 2035. Under the high-speed scenario, the annual average change rate of this indicator for each period increases by 1%, i.e., 10% for 2021 to 2025, 8.5% for 2026 to 2030, and 7% for 2031 to 2035.
- (4)
- Possession of private Vehicles (PV)
In “Policy I”, it is proposed that by 2035, more scientific and rational vehicle ownership and usage management strategies will be implemented, prioritizing the allocation of new energy vehicles and implementing differentiated parking supply and charging policies. However, there is no explicit requirement for the number of private vehicles. Meanwhile, according to historical data, the annual average growth rate of private vehicle ownership in Beijing was 3.11% from 2011 to 2015, and 3.18% from 2016 to 2019. It is noteworthy that Beijing is one of the cities with the largest vehicle ownership and most severe traffic congestion in China, with the strictest policies on new vehicle registration and traffic restrictions. In December 2020, Beijing established the principle of “a maximum of one vehicle per person” for vehicle purchase. With the continuous improvement of Beijing’s public transportation system and the diversification of residents’ travel modes (especially shared mobility), it can play a certain role in curbing the growth of private vehicles. Moreover, thanks to the technological development, policy support and market acceptance of new energy vehicles, private vehicles in Beijing in the future will mainly consist of new energy vehicles replacing aging fuel vehicles. Therefore, the number of private vehicles in Beijing is expected to gradually slow down and grow at a lower rate than it has historically.
Based on the above analysis, under the BAU scenario, the annual average change rate of private vehicle ownership in Beijing was set to 3% for 2021 to 2025, 2.5% for 2026 to 2030, and 2% for 2031 to 2035. Under the low-speed scenario, based on the BAU scenario, the annual average change rate of this indicator for each period decreases by 0.5% (i.e., 2.5% for 2021 to 2025, 2% for 2026 to 2030, and 1.5% for 2031 to 2035). Under the high-speed scenario, based on the BAU scenario, the annual average change rate of this indicator for each period increases by 0.5% (i.e., 3.5% for 2021 to 2025, 3% for 2026 to 2030, and 2.5% for 2031 to 2035).
- (5)
- Energy intensity (EI)
“Policy III” states that by 2025, the target proportion of green travel in the central urban area is 76.5%, with a green transportation ratio of at least 12% for the arrival and dispatch of goods across the entire city. Key energy-consuming enterprises in industries such as public transportation and rail transit should be managed to improve energy efficiency and thus promote green and low-carbon transformation in the transportation industry. The digital transformation and intelligent upgrading of transportation infrastructure should be promoted to enhance the network effect and operational efficiency. The efficiency of supply–demand matching between public transportation and rail transit should be improved, with the construction of smart roads exceeding a total mileage of 300 km. Meanwhile, historical data show that the annual average growth rate of energy intensity in the transportation sector in Beijing was −0.15% from 2011 to 2015 and −3.18% from 2016 to 2019.
Based on the above analysis, under the BAU scenario, the annual average change rate of energy intensity in the transportation industry in Beijing was set to −3.5% for 2021 to 2025, −4.5% for 2026 to 2030, and −5.5% for 2031 to 2035. Under the low-speed scenario, based on the BAU scenario, the annual average change rate of this indicator for each period decreases by 1%, i.e., −2.5% for 2021 to 2025, −3.5% for 2026 to 2030, and −4.5% for 2031 to 2035. Under the high-speed scenario, the annual average change rate of this indicator for each period increases by 1%, i.e., −4.5% for 2021 to 2025, −5.5% for 2026 to 2030, and −6.5% for 2031 to 2035.
- (6)
- Clean energy structure (CES)
In “Policy III”, it is proposed that by 2025, the total energy consumption control target in the transportation sector should be limited to 3.5 million tons of standard coal, compared to the previous target of 2.21 million tons of standard coal in 2020; the total CO2 emissions of operating vehicles in the transportation sector should decrease by 10% compared to those in 2019; and the proportion of new energy vehicles in the transportation sector should increase from 18% in 2020 to 50% in 2025. “Policy IV” states that by 2035, Beijing will be able to control its total energy consumption at around 90 million tons of standard coal. It can be seen that there is a significant demand for clean energy in the transportation sector in Beijing. Meanwhile, according to historical data, the annual average change rate of the clean energy structure in the transportation industry in Beijing was 5.19% from 1999 to 2019 and 5.11% from 2016 to 2019.
Based on the above analysis, under the low-speed scenario, the annual average change rate of the clean energy structure in the transportation sector in Beijing was set to 5% for 2021 to 2025, 7% for 2026 to 2030, and 9% for 2031–2035. Under the BAU scenario, based on the low-speed scenario, the annual average change rate of this indicator for each period increased by 2%, i.e., 7% for 2021 to 2025, 9% for 2026 to 2030, and 11% for 2031 to 2035. Under the high-speed scenario, based on the BAU scenario, the annual average change rate of this indicator for each period increased by 2%, i.e., 9% for 2021 to 2025, 11% for 2026 to 2030, and 13% for 2031 to 2035.
- (7)
- Total transportation turnover (TT)
“Policy III” outlines the transportation development goals for 2025 and 2035, as detailed in Section 3 above. In addition, “Policy I” also states the transportation development goals for 2035: to solidly promote the integration of mainline railways, intercity railways, suburban railways, and subways, achieving coordinated and integrated development of rail transit and urban areas; to enhance subway network service capabilities, improve the network density in key areas, and strengthen rapid connections between employment centers and residential clusters; to jointly build a highly efficient and integrated comprehensive transportation network; to adhere to the principle of prioritizing public transportation and improving the public transportation network; and to improve international tourism reception facilities and dedicated transportation services. Meanwhile, historical data show that the annual average growth rate of total transportation turnover in Beijing was 7.12% from 1999 to 2019 and 9.32% from 2016 to 2019.
Based on the above analysis, under the BAU scenario, the annual average change rate of the total transportation turnover in Beijing was set to 9% for 2021 to 2025, 7% for 2026 to 2030, and 5% for 2031 to 2035. Under the low-speed scenario, based on the BAU scenario, the annual average change rate of this indicator for each period increased by 2%, i.e., 7% for 2021 to 2025, 5% for 2026 to 2030, and 3% for 2031 to 2035. Under the high-speed scenario, based on the BAU scenario, the annual average change rate of this indicator for each period increased by 2%, i.e., 11% for 2021 to 2025, 9% for 2026 to 2030, and 7% for 2031 to 2035.
- (8)
- Public transportation efficiency (PTE)
In “Policy III”, it is stated that by 2025, an additional 300 km of urban rail transit will be in operation, with a total mileage of 1600 km, increasing the proportion of rail transit in public transportation to 56%. The proportion of public transportation in motorized travel in the central urban area will be increased from 49.5% in 2020 to 62.3% in 2025. “Policy I” states that it is necessary to improve public transportation efficiency, promote the construction of a public transportation system coordinated with rail transit development, optimize ground bus networks, scientifically set up dedicated bus lanes, and improve connection and transfer conditions. Additionally, intelligent transportation systems should be developed, and the digital transformation and intelligent upgrading of transportation should be promoted at a high level. According to historical data, the annual average growth rate of public transportation efficiency in Beijing was 2.25% from 2016 to 2019.
Based on the above analysis, under the BAU scenario, the annual average change rate of the public transportation efficiency in Beijing was set to 2.5% for 2021 to 2025, 1.5% for 2026 to 2030, and 0.5% for 2031 to 2035. Under the low-speed scenario, based on the BAU scenario, the annual average change rate of this indicator for each period decreases by 1%, i.e., 1.5% for 2021 to 2025, 0.5% for 2026 to 2030, and 0% for 2031 to 2035. Under the high-speed scenario, based on the BAU scenario, the annual average change rate of this indicator for each period increases by 1%, i.e., 3.5% for 2021 to 2025, 2.5% for 2026 to 2030, and 1.5% for 2031 to 2035.
2.5.2. Scenario Design for Transportation CO2 Emission Prediction
To streamline the scenario design for subsequent analysis and eliminate redundant scenarios with minor differences, while retaining full scenarios of peak, non-peak, and advanced peak, and referring to the scenario setting method proposed in an existing study [1], a scenario design method suitable for this study was established. Firstly, this study divided the scenarios into two types based on technological levels: technical stability and technical breakthrough. In the technical stability scenario, EI and CES were set at the values from the BAU scenario. In the technical breakthrough scenario, these two indicators were set at the values from the high-speed scenario. Secondly, this study divided the scenarios into two types based on efficiency levels: high efficiency and low efficiency. In the high-efficiency scenario, TT and PTE were set at the values from the high-speed scenario. In the low-efficiency scenario, these two indicators were set at the values from the low-speed scenario. Finally, this study divided the scenarios into two types based on population and affluence levels: high growth and low growth. In the high-growth scenario, the four indicators corresponding to population and affluence (P, PG, TG, and PV) were set at the values from the high-speed scenario. In the low-growth scenario, the four indicators were set at the values from the low-speed scenario. The BAU scenario assumes stable development in technology, efficiency, population, and economy in the future, with all eight indicators corresponding to their respective BAU scenario values. As a result, a total of nine scenarios were formed (Table 4).
Table 4.
Types of scenarios.
3. Results and Discussion
3.1. Accounting Results of CO2 Emissions from the Transportation Sector in Beijing
Based on Equation (1), this study calculated the CO2 emissions of Beijing’s transportation sector from 1999 to 2019. The results are presented in Figure 1 and Table 5. The total amount of CO2 emissions emitted by Beijing’s transportation sector exhibits a trend of gradual stabilization in terms of growth, with a corresponding gradual deceleration in the rate of increase. CO2 emissions increased from 5.43 million tons in 1999 to 37.84 million tons in 2019, with an annual average growth rate of 10.42%. The annual average growth rate during 2011–2015 (the 12th Five-Year Plan period) was 4.49%, and it was 5.29% during 2016–2019 (the 13th Five-Year Plan period). This study found that 2009 was a turning point for CO2 emissions in Beijing’s transportation sector. Before 2009, the annual growth rate of transportation CO2 emissions fluctuated significantly. After 2009, the growth rate stabilized, which is consistent with the findings of Sun et al. [70] that the growth rate of CO2 emissions in Beijing’s transportation sector was faster before 2008 and stabilized after 2010. In a different approach to CO2 emission accounting based on energy consumption, Wang et al. [74] conducted bottom-up transportation CO2 emission accounting based on travel modes (such as buses, taxis, and subways) and reached a similar conclusion, i.e., that the annual average growth rate of transportation CO2 emissions in Beijing stabilized from 2006 to 2018. A possible reason for this is that after 2008, Beijing implemented the national fourth phase of motor vehicle emission standards and restrictions on license plate numbers [68].

Figure 1.
Total CO2 emissions and annual growth rate of transportation sector in Beijing from 1999 to 2019.
Table 5.
CO2 emissions and annual growth rate of Beijing transportation sector from 1999 to 2019 (104 t).
This study further analyzed the energy consumption types contributing to CO2 emissions in Beijing’s transportation sector from 1999 to 2019 (Figure 2, Table 6) and found that the annual average proportion attributed to kerosene was 50.88%, related to the rapid development of Beijing’s aviation industry. The annual average proportion of gasoline was 30.5%, and their combined annual average proportion reached as high as 81.38%. Diesel accounted for an annual average of 14.4%. These three energy sources are the main contributors to CO2 emissions in Beijing’s transportation sector, with a combined annual average proportion of 95.78%. The proportions of natural gas and liquefied petroleum gas are relatively small. The same conclusion was made by Fan and Lei [69] on the main energy consumption types in Beijing’s transportation sector from 1995 to 2014. Although Sun et al. [70] mainly focused on road transportation and did not account for kerosene consumption in the transportation sector from 1995 to 2016 (i.e., excluding the aviation sector), they found that over 85% of urban transportation CO2 emissions were caused by gasoline and diesel, which is similar to our finding of the high proportions of these two energy sources, excluding kerosene.
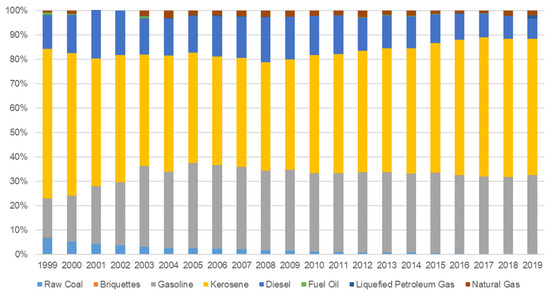
Figure 2.
Contribution of Beijing’s transportation energy consumption types to CO2 emissions.
Table 6.
Contribution of Beijing’s transportation energy consumption types to CO2 emissions (%).
3.2. The Results of Ridge Regression
Before constructing a ridge regression model, it is crucial to determine the value of the ridge parameter K, which is used to adjust the size of the penalty function. Ridge regression is a biased estimation, as the value of K increases, the influence of multicollinearity decreases. The smaller the K value, the smaller the deviation will be. When the K value is 0, it becomes an ordinary least squares linear regression model. Thus, the minimum K value, when the standardized coefficient of determination and the coefficients of each variable tend to be stable, was used as the value of the ridge parameter K.
Ridge regression analysis was conducted using SPSS 25.0 software, with the range of the regression coefficient K value set from 0 to 1, and the data interval set at 0.005. When the K value was 0.005, the standardized determination coefficients and independent variable coefficients tended to be stable, and the ridge trace plot started to stabilize. Therefore, the optimal K value was 0.005, while the R2 and adjusted R2 were 0.9998 and 0.9997, respectively, indicating a high degree of model fit. The F value was 8450.084, with a corresponding sig. value of 0.000, indicating the overall strongly significance of the regression equation. Moreover, all the influencing indicators passed the 5% and 1% significance level tests. Thus, the ridge regression parameters are as shown in Table 7, and the extended STIRPAT regression equation is obtained as follows:
Table 7.
The results of ridge regression.
The results showed that the P, PG, TG, PV, EI, and TT have a positive impact on the CO2 emissions of Beijing’s transportation sector, while the CES and PTE have a negative impact. The degree of influence among the indicators varied significantly. When the influencing indicators, P, PG, TG, PV, EI, CES, TT, PTE, changed by 1%, the CO2 emissions of Beijing’s transportation sector would change by 0.39%, 0.44%, 0.331%, 0.09%, 0.849%, -0.043%, 0.15%, and -0.107%, respectively. The order of impact from greatest to smallest was EI > PG > P > TG > TT > PTE > PV > CES.
For the indicators with greater impact, similar conclusions were drawn in previous studies on CO2 emissions in Beijing’s transportation sector. Li et al. [75] pointed out that transportation energy intensity is a significant main driving factor for CO2 emission reduction in the transportation sector. Further research showed that transportation energy intensity, economic development, population size, and transportation turnover intensity are also major factors affecting Beijing’s transportation CO2 emissions [66,67,68,70,71].
Among the indicators with a smaller impact, Li et al. [71] found in their study of Beijing’s transportation sector from 2004 to 2013 that the possession of private vehicles has a positive impact on transportation CO2 emissions. The smaller impact in our study may be attributed to the widespread application of new energy vehicles in Beijing in recent years, which has diminished the impact of traditional fuel vehicles on transportation CO2 emissions. Fan and Lei [68] and Sun et al. [70] found that the inhibitory effect of clean energy structure on Beijing’s transportation CO2 emissions is not evident. The impact found in our study may be due to the significant improvement in clean energy in the transportation sector in Beijing in recent years (data timeliness impact). Although the negative impact of the clean energy structure proportion on transportation CO2 emissions is small in numerical terms, an increase in the clean energy structure proportion can greatly promote the low-carbon, intelligent, and efficient upgrading and transformation of the transportation sector with broader scope, thereby significantly reducing the transportation energy intensity. Therefore, it is a key driving force for energy conservation and emission reduction in Beijing’s transportation sector [52,75,76] and the first priority for achieving China’s carbon peak and carbon neutrality targets [77,78].
3.3. Forecast Model
According to Equation (6), the prediction model for transportation CO2 emissions in Beijing based on the extended STIRPAT model is as follows:
To assess the predictive performance of the model, this study simulated transportation CO2 emissions for Beijing from 1999 to 2019 by using historical data and compared the results with actual values. As shown in Figure 3 and Table 8, the average error rate between the predicted values and the actual values was only 0.818%, with the maximum error of 1.94% occurring in 2011. The predictive performance of the model was found to be satisfactory.
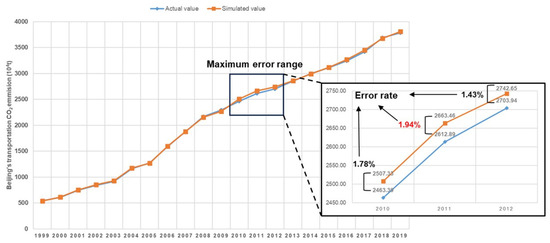
Figure 3.
Comparison of simulated and actual values of CO2 emissions from transportation in Beijing.
Table 8.
Comparison of simulated and actual values of CO2 emissions from transportation in Beijing (104 t).
3.4. Forecast under Multiple Scenarios
Based on the nine predefined scenarios and the prediction model, this study forecasts the peak of transportation CO2 emissions in Beijing for the period 2021 to 2035. The results for each scenario are displayed in Figure 4 and Table 9.
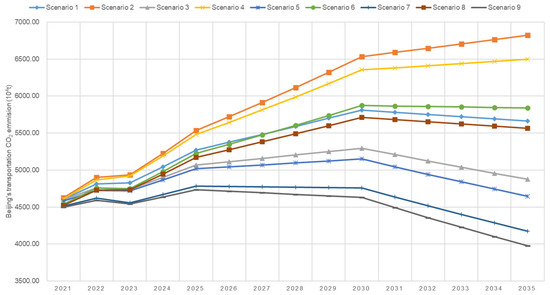
Figure 4.
Scenario forecast of Beijing’s transportation CO2 emissions from 2021 to 2035.
Table 9.
Forecast of transportation CO2 emissions in Beijing from 2021 to 2035 (104 t).
In Scenario 1 (BAU scenario), the eight influencing factors continue their current development trends. Transportation CO2 emissions in Beijing are expected to peak in 2030 at 58.12 million tons, approximately 1.54 times the level in 2019. After 2030, transportation CO2 emissions will gradually decrease. In this scenario, the transportation sector in Beijing can achieve its carbon peak target by 2030.
In scenario 2 (technical stability–high efficiency–high growth), the green carbon reduction technologies (EI, CES) do not experience disruptive breakthroughs but develop steadily. The efficiency of passenger and freight transport (TT) and public transportation (PTE) significantly improves, while population and economic factors (P, PG, TG, PV) exhibit high growth rates. The growth rate of transportation CO2 emissions in Beijing will slow down after 2030, and by 2035, transportation CO2 emissions will increase to 68.21 million tons, approximately 1.8 times the level in 2019. Under this scenario, the transportation sector in Beijing cannot achieve its carbon peak target by 2030.
In scenario 3 (technical stability–high efficiency–low growth), the green carbon reduction technologies develop steadily. The efficiency of passenger and freight transport and public transportation significantly improves, while population and economic factors exhibit low growth rates. Transportation CO2 emissions in Beijing are expected to peak in 2030 at 52.96 million tons, approximately 1.4 times the level in 2019. Under this scenario, the transportation sector in Beijing can achieve its carbon peak target by 2030.
In scenario 4 (technical stability–low efficiency–high growth), the green carbon reduction technologies develop steadily. The efficiency of passenger and freight transport and public transportation experiences low growth rates, while population and economic factors exhibit high growth rates. The growth rate of transportation CO2 emissions in Beijing will slow down after 2030, and by 2035, transportation CO2 emissions will increase to 64.99 million tons, approximately 1.72 times the level in 2019. Under this scenario, the transportation sector in Beijing cannot achieve its carbon peak target by 2030.
In scenario 5 (technical stability–low efficiency–low growth), the green carbon reduction technologies develop steadily. The efficiency of passenger and freight transport and public transportation experiences low growth rates, while population and economic factors exhibit low growth rates. Transportation CO2 emissions in Beijing are expected to peak in 2030 at 51.51 million tons, approximately 1.36 times the level in 2019, and then gradually decrease. In this scenario, the transportation sector in Beijing can achieve its carbon peak target by 2030.
In scenario 6 (technical breakthrough–high efficiency–high growth), the green carbon reduction technologies achieve significant breakthroughs and are effectively applied (i.e., the TT and PTE significantly increase). The efficiency of passenger and freight transport and public transportation significantly improves. Population and economic factors also exhibit high growth rates. Transportation CO2 emissions in Beijing are expected to peak in 2030 at 58.73 million tons, approximately 1.55 times the level in 2019, and then gradually decrease. In this scenario, the transportation sector in Beijing can achieve its carbon peak target by 2030.
In scenario 7 (technical breakthrough–high efficiency–low growth), the green carbon reduction technologies achieve significant breakthroughs and are effectively applied. The efficiency of passenger and freight transport and public transportation significantly improves, while population and economic factors exhibit low growth rates. Transportation CO2 emissions in Beijing are expected to peak in 2025 at 47.83 million tons, approximately 1.26 times the level in 2019. In this scenario, the transportation sector in Beijing can achieve its carbon peak target ahead of schedule by 2025.
In scenario 8 (technical breakthrough–low efficiency–high growth), the green carbon reduction technologies achieve significant breakthroughs and are effectively applied. The efficiency of passenger and freight transport and public transportation experiences low growth rates, while population and economic factors exhibit high growth rates. Transportation CO2 emissions in Beijing are expected to peak in 2030 at 57.12 million tons, approximately 1.51 times the level in 2019, and then gradually decrease. In this scenario, the transportation sector in Beijing can achieve its carbon peak target by 2030.
In scenario 9 (technical breakthrough–low efficiency–low growth), the green carbon reduction technologies achieve significant breakthroughs and are effectively applied. The efficiency of passenger and freight transport and public transportation experiences low growth rates. Population and economic factors also exhibit low growth rates. Transportation CO2 emissions in Beijing are expected to peak in 2025 at 47.35 million tons, approximately 1.25 times the level in 2019. In this scenario, the transportation sector in Beijing can achieve its carbon peak target by 2025, ahead of schedule.
In summary, in the prediction of CO2 emissions in Beijing’s transportation sector, excluding scenarios 2 and 4, all scenarios can reach the CO2 emission peak by 2030. Notably, scenarios 7 and 9 are expected to reach the peak as early as 2025. This study found that in terms of their impact on achieving carbon peak and the magnitude of carbon emissions, green carbon reduction technologies (namely EI and CES) are most significant. Their significant progress and application carry great significance, as they can effectively offset the impacts of population, economy, and efficiency indicators under extensive development. Therefore, in all scenarios of technical breakthroughs, transportation CO2 emissions can meet the targeted carbon peak. Existing research also proves that technological progress is the most critical way to reduce energy intensity [79,80]. It not only improves production efficiency [81], but also contributes to the development of new energy and the adjustment of industrial structure [82,83], thus facilitating the realization of transportation CO2 emission reduction goals [55].
In terms of the influence on the magnitude of carbon emissions from transportation, besides the most significant technological factors indicators (EI and CES), indicators of population and economic factors also have important impacts, followed by indicators of efficiency. This suggests that under the uncertainty of whether green carbon reduction technology can achieve significant breakthroughs and widespread application in the future, effective population control, sustainable economic development, and transportation efficiency improvement are viable means to help achieve carbon peaking and peak value in the transportation sector. Existing research based on different countries and regions also proves that population size is the primary influencing factor of transportation CO2 emissions [4,11,12,13,14,15,70]. Sun et al. [13] pointed out that population growth leads to increased demand for material resources, resulting in greater energy consumption and promoting the expansion of the transportation sector (e.g., an increase in the number of motor vehicles), generating more travel activities, and thereby producing more transportation CO2 emissions [67]. Wang et al. [84] stated that increasing the urban population density in mega-cities in China is an effective measure to reduce CO2 emissions. Chen and Lei [67] emphasized that improving population quality can play a restraining role in transportation CO2 emissions by reducing the energy intensity and transportation intensity.
Existing research shows that sustained economic growth is the leading factor in increasing transportation CO2 emissions [4,11,12,13,14,15,70]. Sun et al. [13] pointed out that the growth rate of Beijing’s transportation CO2 emissions is faster than the population growth rate, showing an extensive growth mode. Chen and Lei [67] found that transformation of the economic growth mode can suppress the growth rate of transportation CO2 emissions to a certain extent by directly reducing energy intensity and indirectly reducing transportation intensity. Therefore, Beijing’s economic development must shift from an extensive growth mode to a more intensive economic growth mode.
Regarding the improvement of transportation efficiency, Fan and Lei [68] and Chen and Lei [67] pointed out that as residents’ income levels continue to rise, the demand for tourism and private cars will gradually increase, thereby promoting the generation of transportation CO2 emissions. Hou et al. [42] and Tang et al. [46] emphasized that private cars are the key to reducing transportation CO2 emissions. Zhu and Li [14] found that under the combined effects of improving public transportation efficiency, developing the availability of public bicycles, improving energy efficiency, and promoting electric vehicles, Beijing’s daily transportation CO2 emissions can be reduced by 43%. In our study, this study found that a 1% change in the Total Transportation Turnover (TT) and Public Transportation Efficiency (PTE) indicators would result in a 0.15% increase (positive impact) and a 0.107% decrease (negative impact), respectively, in carbon dioxide emissions from Beijing’s transportation sector. Furthermore, existing studies have relatively limited exploration of the role of public transportation efficiency, represented by the PTE indicator, in predicting transportation CO2 emissions. Consequently, our research contributes to the development of more refined low-carbon passenger and freight transportation, as well as public transit planning strategies. Regarding the development of low-carbon transportation efficiency in Beijing, it is necessary to promote new transportation modes, such as autonomous vehicles, shared mobility, and intelligent transportation systems, to enhance transportation efficiency and reduce CO2 emissions from the sector [58].
4. Conclusions and Policy Implications
4.1. Conclusions
Firstly, this study quantified the growth of CO2 emissions from Beijing’s transportation sector from 1999 to 2019, increasing from 5.43 million tons to 37.84 million tons, with an annual average growth rate of 10.42%. Overall, the growth exhibited a trend of gradual stabilization in terms of growth, with a corresponding gradual deceleration in the rate of increase. Kerosene, gasoline, and diesel were identified as the primary sources of CO2 emissions from Beijing’s transportation sector, addressing the data currency limitations in existing studies. Secondly, the study extended the traditional STIRPAT model by incorporating “efficiency” as a new influencing factor in addition to the three existing factors (population, affluence, and technology). Furthermore, it explored the effects of new indicators, such as PTE, TT, and PV, on predicting CO2 emissions from Beijing’s transportation sector, broadening the indicator coverage in transportation CO2 emission prediction research. To address multicollinearity among indicators, ridge regression was employed to establish the predictive relationships between the indicator set and CO2 emissions. The degree of influence of the indicators, from highest to lowest, was EI > PG > P > TG > TT > PTE > PV > CES. Subsequently, based on the extended STIRPAT model, nine scenarios for the development trends and peak scenarios of CO2 emissions from Beijing’s transportation sector were projected for the period 2021–2035. These comprehensive scenarios encompassed the peak scenario in 2030, the non-peak scenario, and the advanced peak scenario in 2025. The prediction results indicate that the progress and application of green carbon reduction technologies are of great significance, as they can effectively offset the impacts of population, economic, and efficiency indicators under extensive development scenarios. Effective population control, sustainable economic development, and transportation efficiency improvements emerge as viable means to help achieve carbon peaking and control peak values in Beijing’s transportation sector. Finally, it is crucial to note that the importance of the predictive model in forecasting transportation CO2 emissions cannot be solely determined by the numerical magnitude of indicator impacts, as indirect effects are also highly significant. For instance, while the clean energy structure (CES) exhibited the least apparent numerical impact on transportation CO2 emissions in this study, improving the clean energy structure can greatly facilitate broader low-carbon, intelligent, and efficient upgrades and transformations in the transportation industry, thereby significantly reducing transportation energy intensity, which is an important measure for low-carbon transportation development.
4.2. Guidelines for Policy Makers
In terms of technology, according to the prediction model, energy intensity (EI) has the most significant positive impact on transportation CO2 emissions in Beijing. For every 1% reduction in EI, transportation CO2 emissions will decrease by 0.849%. Therefore, Beijing should fully leverage its favorable research environment and the agglomeration effect of high-end talents to vigorously promote the development and popularization of energy-saving and carbon-reducing transportation technologies, as well as facilitating the introduction of relevant advanced technologies from abroad. Although the negative impact of clean energy structure (CES) on transportation CO2 emissions is relatively small in numerical terms, improving the CES can greatly promote the low-carbon, intelligent, and efficient upgrading and transformation of the transportation sector on a broader scale, thereby significantly reducing transportation energy intensity. Beijing should prioritize promoting an energy transition plan for electrification in the transportation sector, phasing out older fossil fuel vehicles, and continuing to support subsidy policies and driving policies (such as unrestricted driving, parking fee reductions, etc.) for new energy vehicles. Furthermore, the city should expand the deployment of new energy transportation infrastructure (such as fast charging stations, wireless charging, etc.) in terms of quantity and service scope, to reduce public usage costs and improve user experience.
In terms of population, affluence, and efficiency development, firstly, Beijing should further control the scale of the permanent population while ensuring steady economic development, preventing it from exceeding the transportation service capacity baseline. The city should focus on continuously optimizing the structure and quality of the population to improve the overall quality of the population. Secondly, the optimization of industrial structure and the reorganization of internal functions are conducive to the sustainable development of Beijing’s economy and can effectively control the population size. Therefore, it is necessary to further promote the rational reorganization of Beijing’s internal functions, and effectively disperse non-core functions and non-capital functions. For instance, Beijing should (1) extend industries and functions to surrounding areas through government guidance, collaborative construction, and market operation; (2) strengthen the industrial cooperation between urban sub-centers and surrounding areas, encourage Beijing enterprises and industrial parks to dock with key industrial parks in surrounding areas, and optimize the regional industrial chain layout; and (3) continue to promote the relocation of local universities to surrounding cities (such as Xiong’an New Area).
Lastly, to steadily promote the transition of Beijing’s transportation sector to a more quality- and efficiency-focused intensive development model, it is necessary to promote the integrated and coordinated development of the transportation sector and emission reduction systems in Beijing–Tianjin–Hebei, build efficient and diverse regional and internal transportation networks, and promote the integrated development and radiation effects of Beijing’s transportation sector in tourism, modern logistics, and public transportation. At the same time, the city should encourage the development of multimodal transportation to continuously promote the shift of passenger and freight transport from high-energy-consumption, high-pollution road transportation to low-carbon transportation modes, such as railways, urban public transportation, new energy, and shared travel. This would further achieve effective connections in goods transportation and efficient transfers in passenger transportation, thereby improving the overall transportation efficiency of the transportation sector and promoting the coordinated and sustainable development of the various transportation modes.
Author Contributions
Y.Y. conceived and designed the study, conducted data processing and analysis, and drafted the manuscript. R.D. and X.R. performed dataset collection and organization, including data from various statistical yearbooks in Beijing from 1999–2019. Y.Y., R.D. and X.R. performed software analysis and mapping, R.D. and M.F. performed model testing and data validation, R.D. revised the paper, and M.F. performed project management and funding acquisition. All authors have read and agreed to the published version of the manuscript.
Funding
This research was funded by the “National Natural Science Foundation of China”, grant numbers “52308084“, “The Key R&D and Promotion Projects of Henan Province”, grant number “222102110125”, and “The Key Research Base of Philosophy and Social Sciences in Chengdu: Research Center for Beautiful Countryside Construction and Development”, grant number “CCRC2024-15”.
Institutional Review Board Statement
Not applicable.
Informed Consent Statement
Informed consent was obtained from all subjects involved in the study.
Data Availability Statement
Data are available on request from the corresponding author.
Acknowledgments
The authors would like to thank the anonymous reviewers for their comments and suggestions.
Conflicts of Interest
Author Yuhao Yang was employed by Sichuan Hongtai Tongji Architectural Design Co., Ltd. The remaining authors declare that the research was conducted in the absence of any commercial or financial relationships that could be construed as a potential conflict of interest.
References
- IEA. World Energy Outlook 2022—Analysis. Available online: https://www.iea.org/reports/world-energy-outlook-2022 (accessed on 24 March 2024).
- Cohan, D.S.; Sengupta, S. Net Greenhouse Gas Emissions Savings from Natural Gas Substitutions in Vehicles, Furnaces, and Power Plants. Int. J. Glob. Warm. 2016, 9, 254–273. [Google Scholar] [CrossRef]
- Shao, H.; Wang, Z. Spatial Network Structure of Transportation Carbon Emission Efficiency in China and Its Influencing Factors. Chin. J. Popul. Resour. Environ. 2021, 19, 295–303. [Google Scholar] [CrossRef]
- Cai, J.; Ma, S.; Ji, H.; Jiang, W.; Bai, Z. Spatial–Temporal Characteristics and Decoupling Effects of China’s Transportation CO2 Emissions. Environ. Sci. Pollut. Res. 2023, 30, 32614–32627. [Google Scholar] [CrossRef] [PubMed]
- Ortega-Ruiz, G.; Mena-Nieto, A.; Golpe, A.A.; García-Ramos, J.E. CO2 Emissions and Causal Relationships in the Six Largest World Emitters. Renew. Sustain. Energy Rev. 2022, 162, 112435. [Google Scholar] [CrossRef]
- Bai, C.; Chen, Z.; Wang, D. Transportation Carbon Emission Reduction Potential and Mitigation Strategy in China. Sci. Total Environ. 2023, 873, 162074. [Google Scholar] [CrossRef]
- IEA. CO2 Emissions from Fuel Combustion 2019; Organisation for Economic Co-operation and Development: Paris, France, 2019. [Google Scholar]
- Lin, D.; Zhang, L.; Chen, C.; Lin, Y.; Wang, J.; Qiu, R.; Hu, X. Understanding Driving Patterns of Carbon Emissions from the Transport Sector in China: Evidence from an Analysis of Panel Models. Clean Technol. Environ. Policy 2019, 21, 1307–1322. [Google Scholar] [CrossRef]
- Xu, H.; Li, Y.; Zheng, Y.; Xu, X. Analysis of Spatial Associations in the Energy–Carbon Emission Efficiency of the Transportation Industry and Its Influencing Factors: Evidence from China. Environ. Impact Assess. Rev. 2022, 97, 106905. [Google Scholar] [CrossRef]
- Foster, V.; Dim, J.U.; Vollmer, S.; Zhang, F. Understanding Drivers of Decoupling of Global Transport CO2 Emissions from Economic Growth: Evidence from 145 Countries; Policy Research Working Papers; The World Bank: Washington, DC, USA, 2021. [Google Scholar]
- Kim, S. Decomposition Analysis of Greenhouse Gas Emissions in Korea’s Transportation Sector. Sustainability 2019, 11, 1986. [Google Scholar] [CrossRef]
- Bai, C.; Chen, Y.; Yi, X.; Feng, C. Decoupling and Decomposition Analysis of Transportation Carbon Emissions at the Provincial Level in China: Perspective from the 11th and 12th Five-Year Plan Periods. Environ. Sci. Pollut. Res. 2019, 26, 15039–15056. [Google Scholar] [CrossRef]
- Sun, Y.; Liu, S.; Li, L. Grey Correlation Analysis of Transportation Carbon Emissions under the Background of Carbon Peak and Carbon Neutrality. Energies 2022, 15, 3064. [Google Scholar] [CrossRef]
- Zhu, X.; Li, R. An Analysis of Decoupling and Influencing Factors of Carbon Emissions from the Transportation Sector in the Beijing-Tianjin-Hebei Area, China. Sustainability 2017, 9, 722. [Google Scholar] [CrossRef]
- Zhu, C.; Wang, M.; Yang, Y. Analysis of the Influencing Factors of Regional Carbon Emissions in the Chinese Transportation Industry. Energies 2020, 13, 1100. [Google Scholar] [CrossRef]
- Meng, M.; Li, M. Decomposition Analysis and Trend Prediction of CO2 Emissions in China’s Transportation Industry. Sustainability 2020, 12, 2596. [Google Scholar] [CrossRef]
- Shi, T.; Si, S.; Chan, J.; Zhou, L. The Carbon Emission Reduction Effect of Technological Innovation on the Transportation Industry and Its Spatial Heterogeneity: Evidence from China. Atmosphere 2021, 12, 1169. [Google Scholar] [CrossRef]
- Zhu, C.; Gao, D. A Research on the Factors Influencing Carbon Emission of Transportation Industry in “the Belt and Road Initiative” Countries Based on Panel Data. Energies 2019, 12, 2405. [Google Scholar] [CrossRef]
- Oladunni, O.J.; Olanrewaju, O.A. Effects of the Impact Factors on Transportation Sector’s CO2-Eq Emissions: Panel Evaluation on South Africa’s Major Economies. Atmosphere 2022, 13, 1705. [Google Scholar] [CrossRef]
- Liang, Y.; Niu, D.; Wang, H.; Li, Y. Factors Affecting Transportation Sector CO2 Emissions Growth in China: An LMDI Decomposition Analysis. Sustainability 2017, 9, 1730. [Google Scholar] [CrossRef]
- Wang, Y.; Zhou, Y.; Zhu, L.; Zhang, F.; Zhang, Y. Influencing Factors and Decoupling Elasticity of China’s Transportation Carbon Emissions. Energies 2018, 11, 1157. [Google Scholar] [CrossRef]
- Sun, H.; Hu, L.; Geng, Y.; Yang, G. Uncovering Impact Factors of Carbon Emissions from Transportation Sector: Evidence from China’s Yangtze River Delta Area. Mitig. Adapt. Strateg. Glob. Change 2020, 25, 1423–1437. [Google Scholar] [CrossRef]
- Li, R.; Li, L.; Wang, Q. The Impact of Energy Efficiency on Carbon Emissions: Evidence from the Transportation Sector in Chinese 30 Provinces. Sustain. Cities Soc. 2022, 82, 103880. [Google Scholar] [CrossRef]
- Xu, B.; Lin, B. Investigating the Differences in CO2 Emissions in the Transport Sector across Chinese Provinces: Evidence from a Quantile Regression Model. J. Clean. Prod. 2018, 175, 109–122. [Google Scholar] [CrossRef]
- Chen, Z.; Antunes, J.; Wanke, P.; Zhou, M. Sustainability Drivers in Road Transportation System: Evidence from China. Sci. Total Environ. 2021, 798, 149259. [Google Scholar] [CrossRef] [PubMed]
- Jiang, Y.; Zhou, Z.; Liu, C. The Impact of Public Transportation on Carbon Emissions: A Panel Quantile Analysis Based on Chinese Provincial Data. Environ. Sci. Pollut. Res. 2019, 26, 4000–4012. [Google Scholar] [CrossRef] [PubMed]
- Jing, Q.-L.; Liu, H.-Z.; Yu, W.-Q.; He, X. The Impact of Public Transportation on Carbon Emissions—From the Perspective of Energy Consumption. Sustainability 2022, 14, 6248. [Google Scholar] [CrossRef]
- Yang, W.; Li, T.; Cao, X. Examining the Impacts of Socio-Economic Factors, Urban Form and Transportation Development on CO2 Emissions from Transportation in China: A Panel Data Analysis of China’s Provinces. Habitat Int. 2015, 49, 212–220. [Google Scholar] [CrossRef]
- Yang, W.; Wang, W.; Ouyang, S. The Influencing Factors and Spatial Spillover Effects of CO2 Emissions from Transportation in China. Sci. Total Environ. 2019, 696, 133900. [Google Scholar] [CrossRef] [PubMed]
- Li, C.; Zhang, Z.; Wang, L. Carbon Peak Forecast and Low Carbon Policy Choice of Transportation Industry in China: Scenario Prediction Based on STIRPAT Model. Environ. Sci. Pollut. Res. 2023, 30, 63250–63271. [Google Scholar] [CrossRef] [PubMed]
- Zhu, L.; Li, Z.; Yang, X.; Zhang, Y.; Li, H. Forecast of Transportation CO2 Emissions in Shanghai under Multiple Scenarios. Sustainability 2022, 14, 13650. [Google Scholar] [CrossRef]
- Chen, Q.; Wang, Q.; Zhou, D.; Wang, H. Drivers and Evolution of Low-Carbon Development in China’s Transportation Industry: An Integrated Analytical Approach. Energy 2023, 262, 125614. [Google Scholar] [CrossRef]
- Schmitz Gonçalves, D.N.; Goes, G.V.; de Almeida D’Agosto, M.; Albergaria de Mello Bandeira, R. Energy Use and Emissions Scenarios for Transport to Gauge Progress toward National Commitments. Energy Policy 2019, 135, 110997. [Google Scholar] [CrossRef]
- Ye, L.; Xie, N.; Hu, A. A Novel Time-Delay Multivariate Grey Model for Impact Analysis of CO2 Emissions from China’s Transportation Sectors. Appl. Math. Model. 2021, 91, 493–507. [Google Scholar] [CrossRef]
- Huang, S.; Xiao, X.; Guo, H. A Novel Method for Carbon Emission Forecasting Based on EKC Hypothesis and Nonlinear Multivariate Grey Model: Evidence from Transportation Sector. Environ. Sci. Pollut. Res. 2022, 29, 60687–60711. [Google Scholar] [CrossRef] [PubMed]
- Trofimenko, Y.; Komkov, V.; Trofimenko, K. Forecast of Energy Consumption and Greenhouse Gas Emissions by Road Transport in Russia up to 2050. Transp. Res. Procedia 2020, 50, 698–707. [Google Scholar] [CrossRef]
- Zhang, H.; Kong, X.; Ren, C. Influencing Factors and Forecast of Carbon Emissions from Transportation—Taking Shandong Province as an Example. IOP Conf. Ser. Earth Environ. Sci. 2019, 300, 032063. [Google Scholar] [CrossRef]
- Kang, D.W.; Holbrook, J.H. Use of NH3 Fuel to Achieve Deep Greenhouse Gas Reductions from US Transportation. Energy Rep. 2015, 1, 164–168. [Google Scholar] [CrossRef]
- Hong, S.; Chung, Y.; Kim, J.; Chun, D. Analysis on the Level of Contribution to the National Greenhouse Gas Reduction Target in Korean Transportation Sector Using LEAP Model. Renew. Sustain. Energy Rev. 2016, 60, 549–559. [Google Scholar] [CrossRef]
- Li, Y.; Bao, L.; Li, W.; Deng, H. Inventory and Policy Reduction Potential of Greenhouse Gas and Pollutant Emissions of Road Transportation Industry in China. Sustainability 2016, 8, 1218. [Google Scholar] [CrossRef]
- Ma, H.; Sun, W.; Wang, S.; Kang, L. Structural Contribution and Scenario Simulation of Highway Passenger Transit Carbon Emissions in the Beijing-Tianjin-Hebei Metropolitan Region, China. Resour. Conserv. Recycl. 2019, 140, 209–215. [Google Scholar] [CrossRef]
- Hou, L.; Wang, Y.; Zheng, Y.; Zhang, A. The Impact of Vehicle Ownership on Carbon Emissions in the Transportation Sector. Sustainability 2022, 14, 12657. [Google Scholar] [CrossRef]
- Zhang, X.; Chen, Y.; Jiang, P.; Liu, L.; Xu, X.; Xu, Y. Sectoral Peak CO2 Emission Measurements and a Long-Term Alternative CO2 Mitigation Roadmap: A Case Study of Yunnan, China. J. Clean. Prod. 2020, 247, 119171. [Google Scholar] [CrossRef]
- Heidari, E.; Bikdeli, S.; Mansouri Daneshvar, M.R. A Dynamic Model for CO2 Emissions Induced by Urban Transportation during 2005–2030, a Case Study of Mashhad, Iran. Environ. Dev. Sustain. 2023, 25, 4217–4236. [Google Scholar] [CrossRef]
- Asasuppakit, P.; Thiengburanathum, P. System dynamics model of CO2 emissions from urban transportation in Chiang Mai City. GEOMATE J. 2020, 18, 209–216. [Google Scholar] [CrossRef]
- Tang, M.; Zhang, Z.; Liu, Y.; Zhang, H. Regional-Based Strategies for Municipality Carbon Mitigation: A Case Study of Chongqing in China. Energy Rep. 2022, 8, 4672–4694. [Google Scholar] [CrossRef]
- Ağbulut, Ü. Forecasting of Transportation-Related Energy Demand and CO2 Emissions in Turkey with Different Machine Learning Algorithms. Sustain. Prod. Consum. 2022, 29, 141–157. [Google Scholar] [CrossRef]
- Li, X.; Ren, A.; Li, Q. Exploring Patterns of Transportation-Related CO2 Emissions Using Machine Learning Methods. Sustainability 2022, 14, 4588. [Google Scholar] [CrossRef]
- Javanmard, M.E.; Tang, Y.; Wang, Z.; Tontiwachwuthikul, P. Forecast Energy Demand, CO2 Emissions and Energy Resource Impacts for the Transportation Sector. Appl. Energy 2023, 338, 120830. [Google Scholar] [CrossRef]
- Huo, Z.; Zha, X.; Lu, M.; Ma, T.; Lu, Z. Prediction of Carbon Emission of the Transportation Sector in Jiangsu Province-Regression Prediction Model Based on GA-SVM. Sustainability 2023, 15, 3631. [Google Scholar] [CrossRef]
- Wen, L.; Wang, A. System Dynamics Model of Beijing Urban Public Transport Carbon Emissions Based on Carbon Neutrality Target. Environ. Dev. Sustain. 2022, 25, 12681–12706. [Google Scholar] [CrossRef]
- Yang, X.; Lin, W.; Gong, R.; Zhu, M.; Springer, C. Transport Decarbonization in Big Cities: An Integrated Environmental Co-Benefit Analysis of Vehicles Purchases Quota-Limit and New Energy Vehicles Promotion Policy in Beijing. Sustain. Cities Soc. 2021, 71, 102976. [Google Scholar] [CrossRef]
- Zeng, Y.; Tan, X.; Gu, B.; Wang, Y.; Xu, B. Greenhouse Gas Emissions of Motor Vehicles in Chinese Cities and the Implication for China’s Mitigation Targets. Appl. Energy 2016, 184, 1016–1025. [Google Scholar] [CrossRef]
- Wen, L.; Bai, L. System Dynamics Modeling and Policy Simulation for Urban Traffic: A Case Study in Beijing. Environ. Model. Assess. 2017, 22, 363–378. [Google Scholar] [CrossRef]
- Liu, X.; Ma, S.; Tian, J.; Jia, N.; Li, G. A System Dynamics Approach to Scenario Analysis for Urban Passenger Transport Energy Consumption and CO2 Emissions: A Case Study of Beijing. Energy Policy 2015, 85, 253–270. [Google Scholar] [CrossRef]
- Yang, Y.; Wang, C.; Liu, W.; Zhou, P. Microsimulation of Low Carbon Urban Transport Policies in Beijing. Energy Policy 2017, 107, 561–572. [Google Scholar] [CrossRef]
- Wang, H.; Cao, R.; Zeng, W. Multi-Agent Based and System Dynamics Models Integrated Simulation of Urban Commuting Relevant Carbon Dioxide Emission Reduction Policy in China. J. Clean. Prod. 2020, 272, 122620. [Google Scholar] [CrossRef]
- Wang, H.; Shi, W.; He, W.; Xue, H.; Zeng, W. Simulation of Urban Transport Carbon Dioxide Emission Reduction Environment Economic Policy in China: An Integrated Approach Using Agent-Based Modelling and System Dynamics. J. Clean. Prod. 2023, 392, 136221. [Google Scholar] [CrossRef]
- Feng, Y.Y.; Chen, S.Q.; Zhang, L.X. System Dynamics Modeling for Urban Energy Consumption and CO2 Emissions: A Case Study of Beijing, China. Ecol. Model. 2013, 252, 44–52. [Google Scholar] [CrossRef]
- Yu, H.; Mu, D. Carbon Emission Research of Beijing Transportation System Based on SD. In Proceedings of the 2016 International Conference on Logistics, Informatics and Service Sciences (LISS), Sydney, Australia, 24–27 July 2016; pp. 1–4. [Google Scholar]
- Wang, L.; Fan, J.; Wang, J.; Zhao, Y.; Li, Z.; Guo, R. Spatio-Temporal Characteristics of the Relationship between Carbon Emissions and Economic Growth in China’s Transportation Industry. Environ. Sci. Pollut. Res. 2020, 27, 32962–32979. [Google Scholar] [CrossRef]
- Shan, Y.; Guan, D.; Zheng, H.; Ou, J.; Li, Y.; Meng, J.; Mi, Z.; Liu, Z.; Zhang, Q. China CO2 Emission Accounts 1997–2015. Sci. Data 2018, 5, 170201. [Google Scholar] [CrossRef]
- Eggleston, H.S.; Buendia, L.; Miwa, K.; Ngara, T.; Tanabe, K. (Eds.) 2006 IPCC Guidelines for National Greenhouse Gas Inventories; IPCC: Tokyo, Japan, 2006. [Google Scholar]
- Ehrlich, P.R.; Holdren, J.P. Impact of Population Growth. Science 1971, 171, 1212–1217. [Google Scholar] [CrossRef]
- York, R.; Rosa, E.A.; Dietz, T. STIRPAT, IPAT and ImPACT: Analytic Tools for Unpacking the Driving Forces of Environmental Impacts. Ecol. Econ. 2003, 46, 351–365. [Google Scholar] [CrossRef]
- Guo, M.; Meng, J. Exploring the Driving Factors of Carbon Dioxide Emission from Transport Sector in Beijing-Tianjin-Hebei Region. J. Clean. Prod. 2019, 226, 692–705. [Google Scholar] [CrossRef]
- Chen, W.; Lei, Y. Path Analysis of Factors in Energy-Related CO2 Emissions from Beijing’s Transportation Sector. Transp. Res. Part D Transp. Environ. 2017, 50, 473–487. [Google Scholar] [CrossRef]
- Fan, F.; Lei, Y. Decomposition Analysis of Energy-Related Carbon Emissions from the Transportation Sector in Beijing. Transp. Res. Part D Transp. Environ. 2016, 42, 135–145. [Google Scholar] [CrossRef] [PubMed]
- Fan, F.; Lei, Y. Responsive Relationship between Energy-Related Carbon Dioxide Emissions from the Transportation Sector and Economic Growth in Beijing—Based on Decoupling Theory. Int. J. Sustain. Transp. 2017, 11, 764–775. [Google Scholar] [CrossRef]
- Sun, Y.; Zhang, Y.; Liu, X. Driving Factors of Transportation CO2 Emissions in Beijing: An Analysis from the Perspective of Urban Development. Chin. J. Urban Environ. Stud. 2020, 08, 2050013. [Google Scholar] [CrossRef]
- Li, Z.; Deng, X.; Peng, L. Uncovering Trajectories and Impact Factors of CO2 Emissions: A Sectoral and Spatially Disaggregated Revisit in Beijing. Technol. Forecast. Soc. Chang. 2020, 158, 120124. [Google Scholar] [CrossRef]
- Zhang, X.; Nie, S.; He, M.; Wang, J. Charging System Analysis, Energy Consumption, and Carbon Dioxide Emissions of Battery Electric Buses in Beijing. Case Stud. Therm. Eng. 2021, 26, 101197. [Google Scholar] [CrossRef]
- Wang, J.; Wang, Z.; Zhao, Y. Determination of the Conversion Factor of Highway Passenger Turnover in the Perspective of Energy. J. Transp. Eng. 2016, 16, 31–34. (In Chinese) [Google Scholar] [CrossRef]
- Wang, H.; Shi, W.; Xue, H.; He, W.; Liu, Y. Performance Evaluation of Fee-Charging Policies to Reduce the Carbon Emissions of Urban Transportation in China. Atmosphere 2022, 13, 2095. [Google Scholar] [CrossRef]
- Li, G.; Zeng, S.; Li, T.; Peng, Q.; Irfan, M. Analysing the Effect of Energy Intensity on Carbon Emission Reduction in Beijing. Int. J. Environ. Res. Public Health 2023, 20, 1379. [Google Scholar] [CrossRef]
- Li, Y.; Zhao, J. Decomposition Analysis of Growth in Transportation Carbon Emissions and Low-Carbon Path Exploration in Beijing. In Low-Carbon City and New-Type Urbanization; Springer: Berlin/Heidelberg, Germany, 2015; pp. 337–345. [Google Scholar]
- Huang, R.; Zhang, S.; Wang, P. Key Areas and Pathways for Carbon Emissions Reduction in Beijing for the “Dual Carbon” Targets. Energy Policy 2022, 164, 112873. [Google Scholar] [CrossRef]
- Ai, Y.; Cui, Y.; Ge, Y.; Wu, X.; Wu, T.; Liu, X.; Shen, Y.; Liu, M.; Wan, Y.; Yi, H.; et al. Study on the Control Targets and Measures for Total Diesel Consumption from Mobile Sources in Beijing, China. Front. Environ. Sci. 2022, 10, 1068861. [Google Scholar] [CrossRef]
- Pan, X.; Wei, Z.; Han, B.; Shahbaz, M. The Heterogeneous Impacts of Interregional Green Technology Spillover on Energy Intensity in China. Energy Econ. 2021, 96, 105133. [Google Scholar] [CrossRef]
- Yang, Y.; Yan, F. An Inquiry into the Characteristics of Carbon Emissions in Inter-Provincial Transportation in China: Aiming to Typological Strategies for Carbon Reduction in Regional Transportation. Land 2024, 13, 15. [Google Scholar] [CrossRef]
- Wang, D.; Han, B. Effects of Indigenous R&D and Foreign Spillover on Energy Intensity in China. J. Renew. Sustain. Energy 2017, 9, 035901. [Google Scholar] [CrossRef]
- Wu, N.; Liu, Z. Higher Education Development, Technological Innovation and Industrial Structure Upgrade. Technol. Forecast. Soc. Change 2021, 162, 120400. [Google Scholar] [CrossRef]
- Shen, X.; Lin, B. Does Industrial Structure Distortion Impact the Energy Intensity in China? Sustain. Prod. Consum. 2021, 25, 551–562. [Google Scholar] [CrossRef]
- Wang, S.; Liu, X.; Zhou, C.; Hu, J.; Ou, J. Examining the Impacts of Socioeconomic Factors, Urban Form, and Transportation Networks on CO2 Emissions in China’s Megacities. Appl. Energy 2017, 185, 189–200. [Google Scholar] [CrossRef]
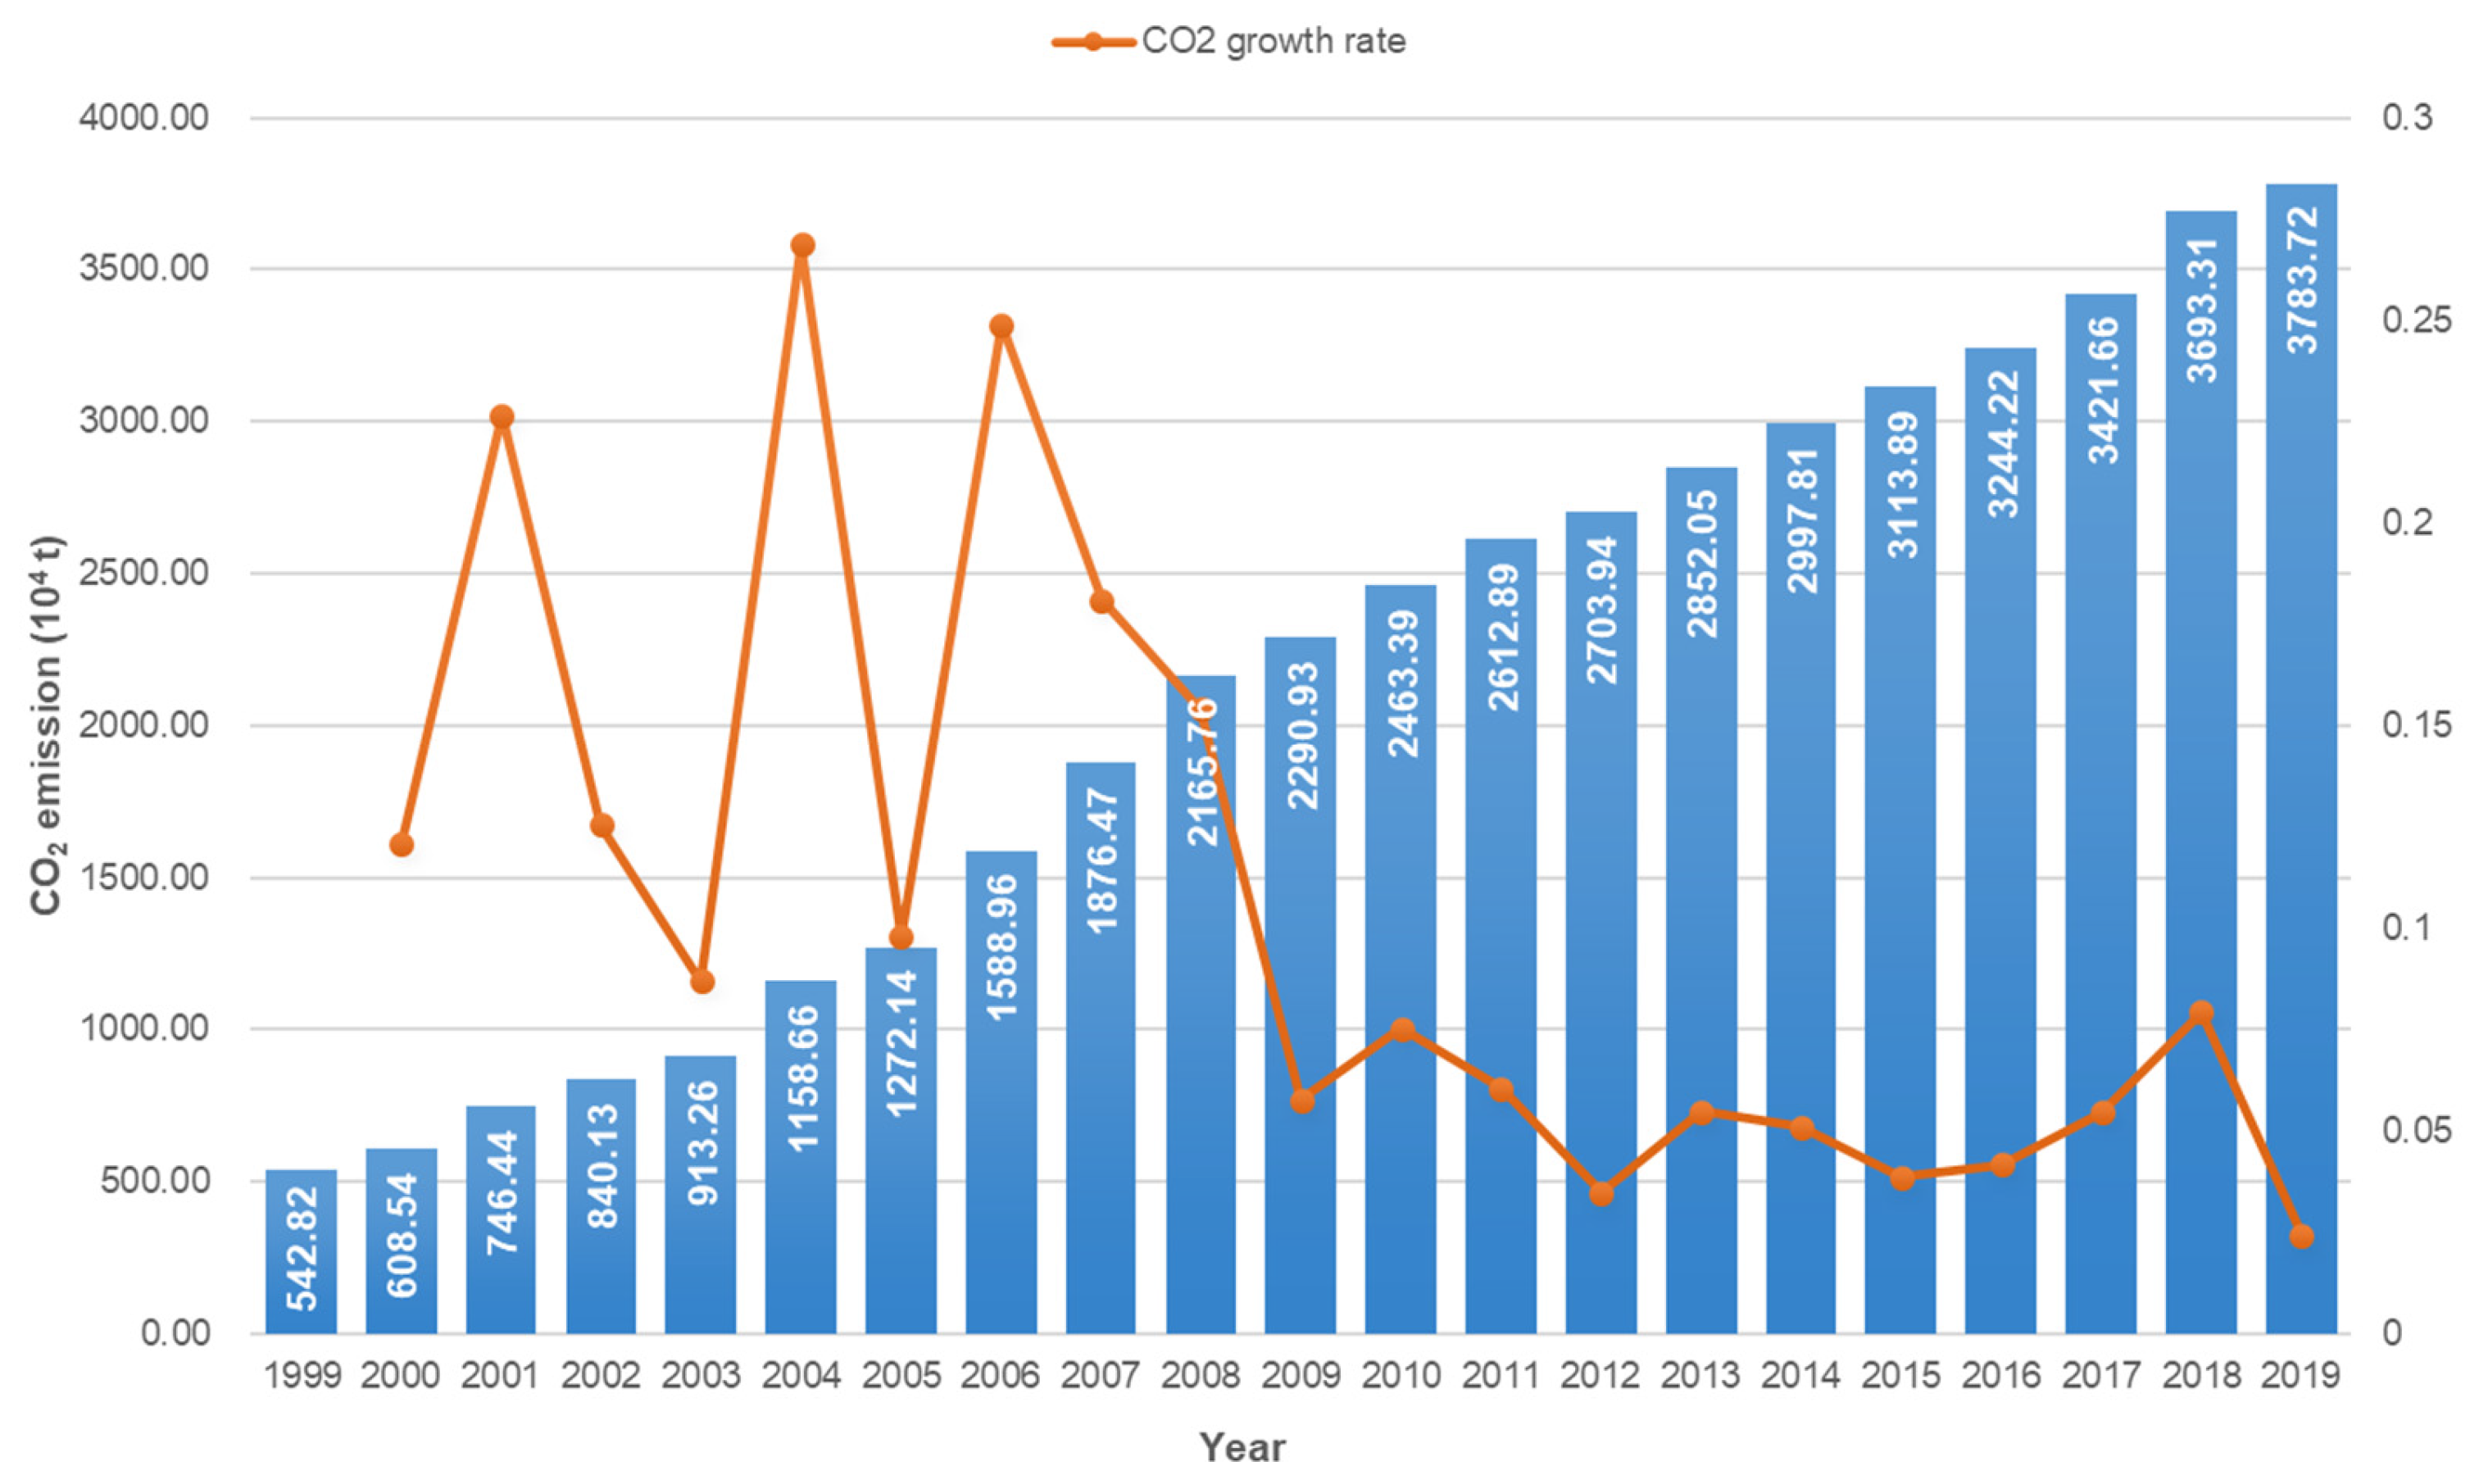
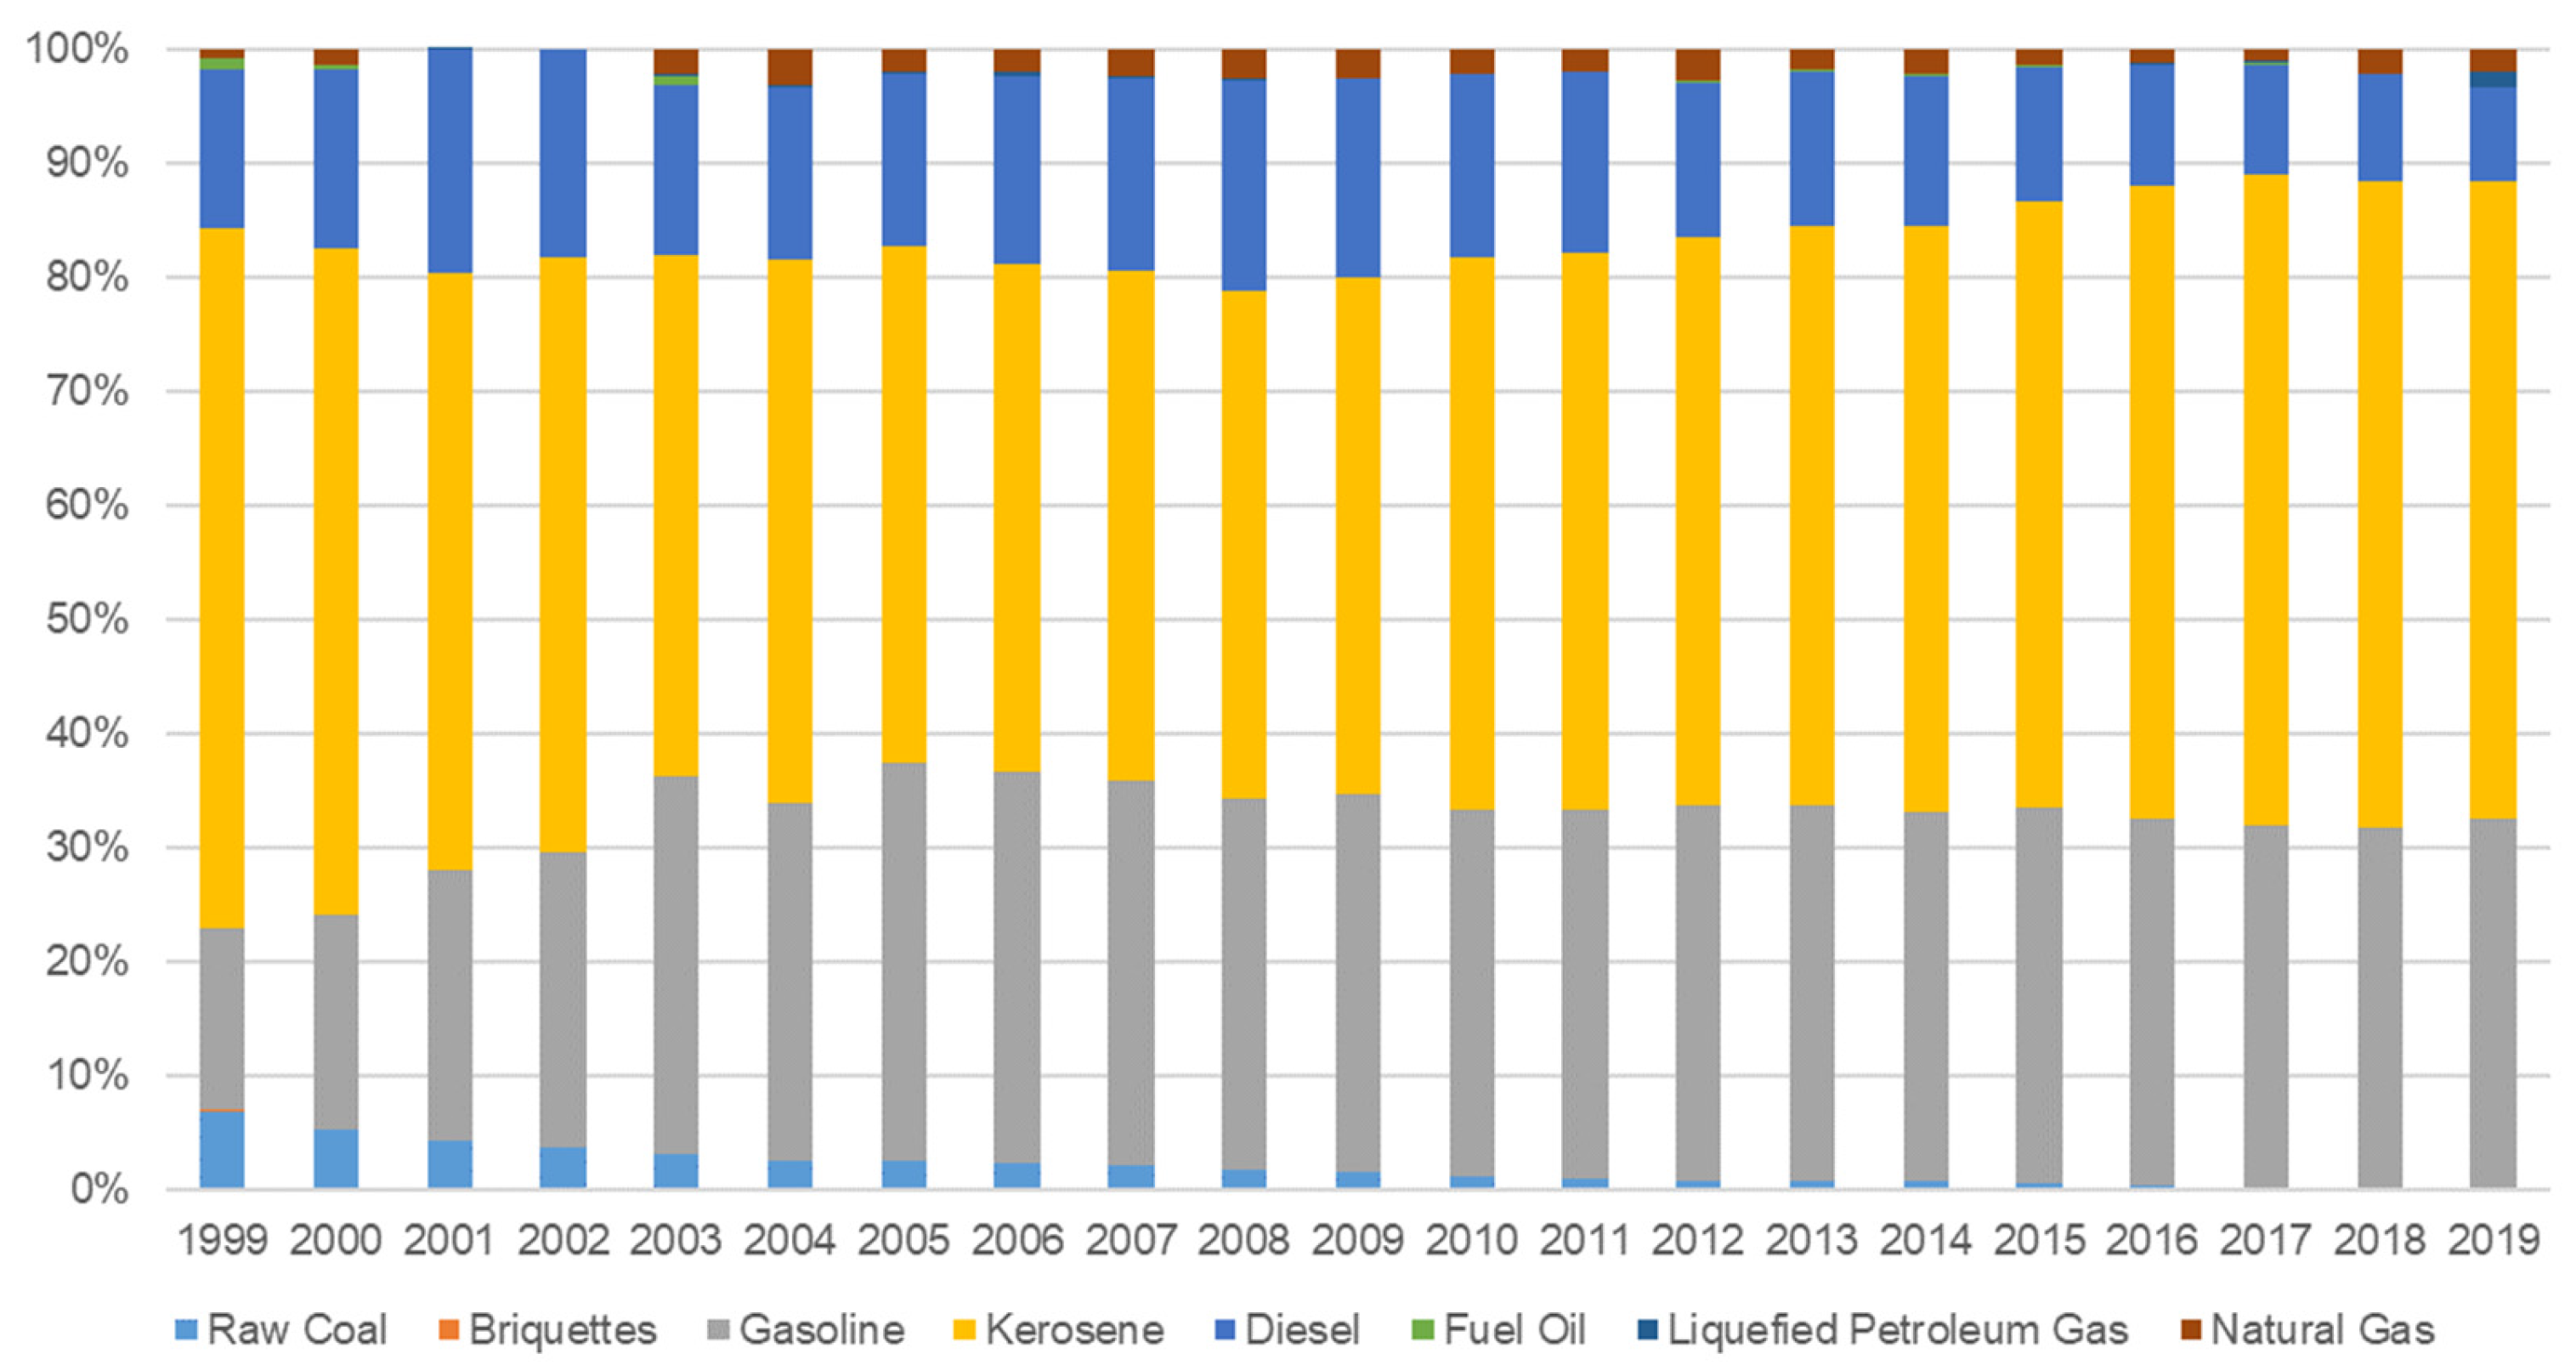
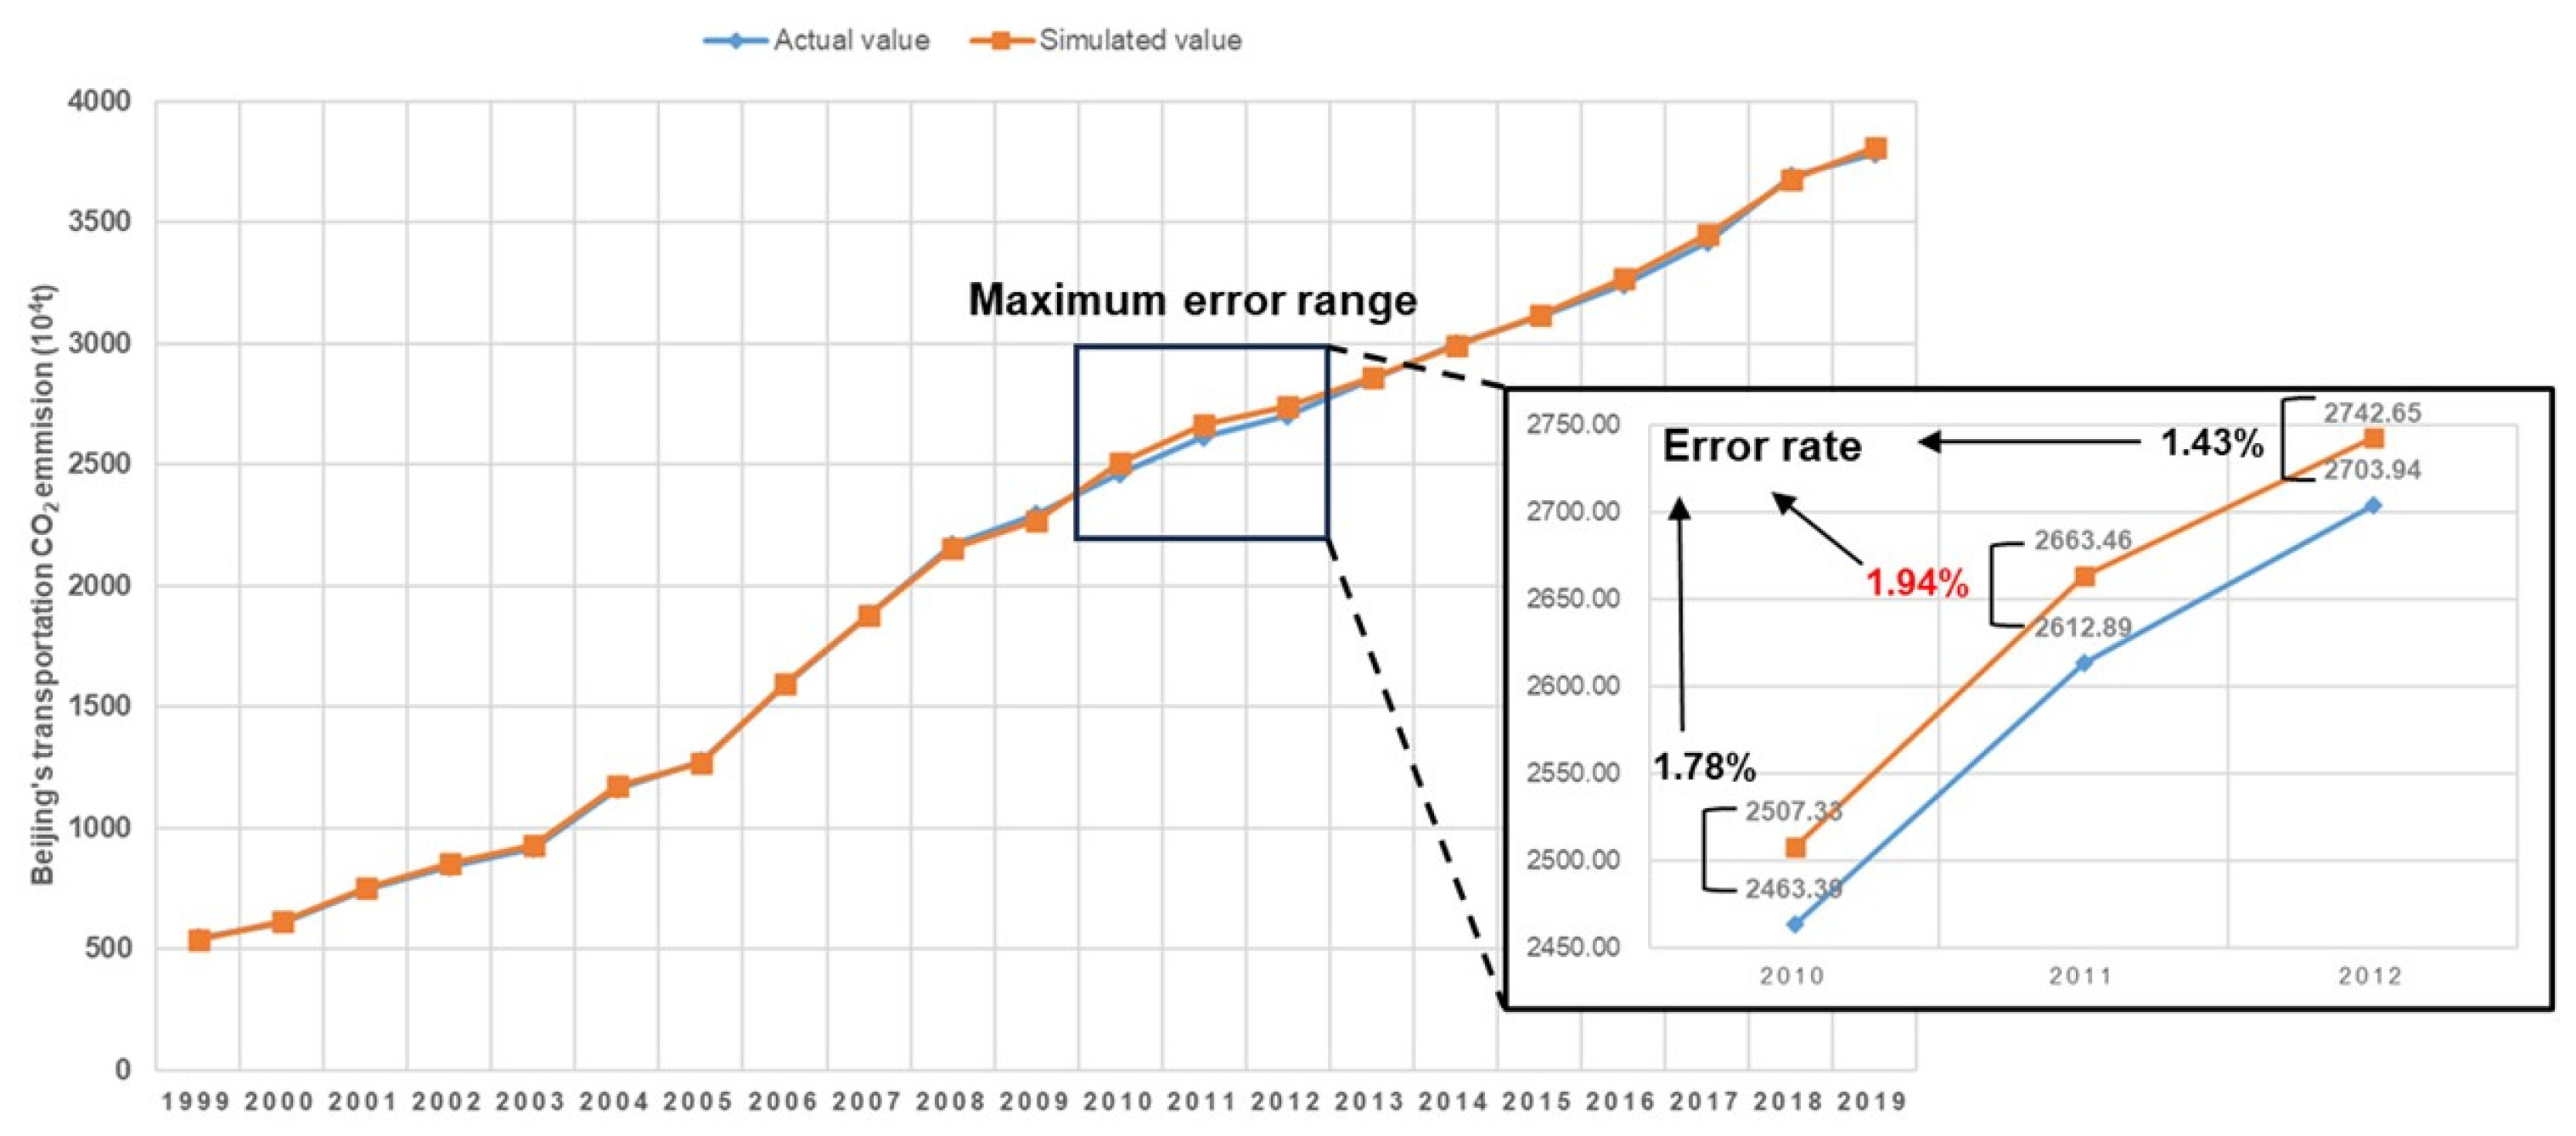
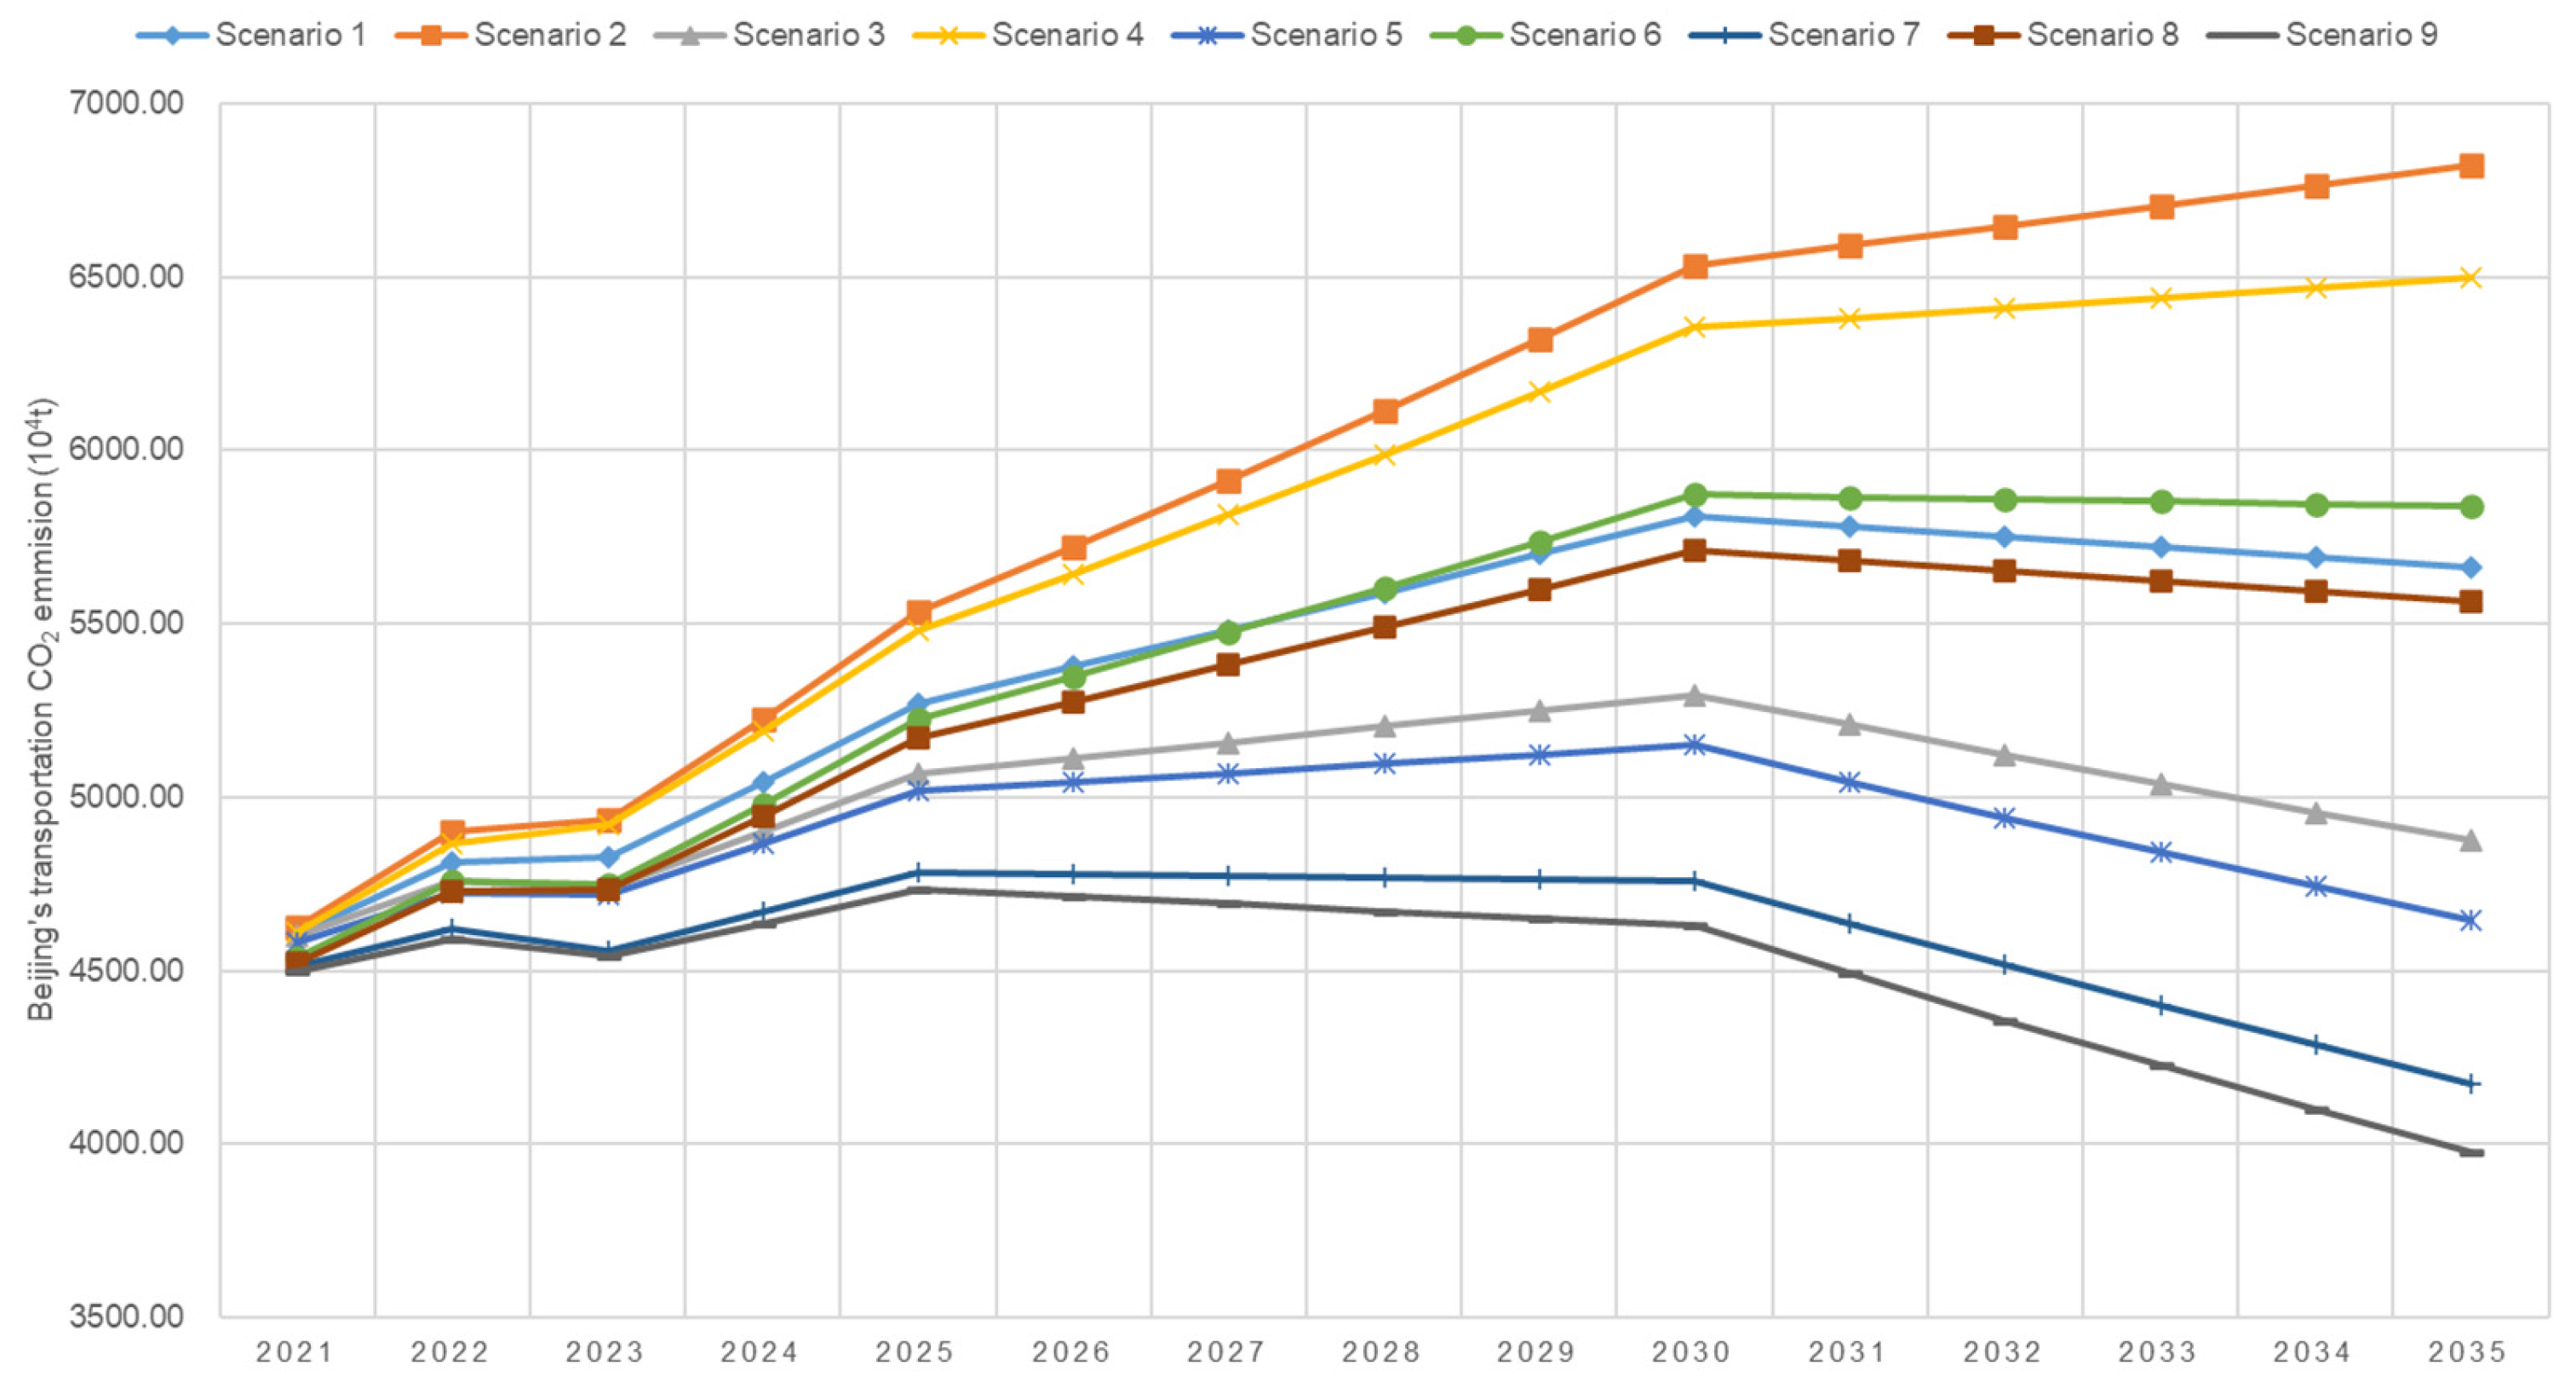
Disclaimer/Publisher’s Note: The statements, opinions and data contained in all publications are solely those of the individual author(s) and contributor(s) and not of MDPI and/or the editor(s). MDPI and/or the editor(s) disclaim responsibility for any injury to people or property resulting from any ideas, methods, instructions or products referred to in the content. |
© 2024 by the authors. Licensee MDPI, Basel, Switzerland. This article is an open access article distributed under the terms and conditions of the Creative Commons Attribution (CC BY) license (https://creativecommons.org/licenses/by/4.0/).