Abstract
The purpose of this study is to explore the sustainability of island tourism by investigating the increasingly dangerous climate conditions that tourists encounter under climate change. The exploratory case of Hawaii, United States is offered to explore how thermal stress risks have (1) changed as a process of climate change and (2) are associated with airport arrivals of domestic tourists from states other than Hawaii (dependent variable). Hawaii is a destination-based island in the lower-latitudes of the Pacific Ocean that attracts more tourists than many stand-alone countries. Thermal stress—our independent variable—is a climate measure for heat exposure and has medically prescribed levels (°C) for heat-related risks to recreationalists and workers. The findings indicate that (1) thermal stress is increasing as a process of climate change over the past four decades (1984–2023), (2) moderate thermal stress risks are positively related to tourists’ demand (2015–2023), and (3) moderate thermal stress risks are more strongly related to tourists’ demand than lower risk levels. The results suggest that despite increased thermal stress, the demand for tourists’ arrivals remains sustainable for Hawaii. Though not significant, we also observed a decline in tourists’ arrivals with moderately high thermal stress risks. Implications are broken down for each of the sustainable tourism stakeholders: visitors, communities, industry, and the natural environment.
Keywords:
tourist demand; climate change; weather; sustainable tourism; Hawaii; thermal stress; WBGT 1. Introduction
The purpose of this study is to explore the sustainability of island tourism by investigating the increasingly dangerous climate conditions that tourists encounter under climate change. The effects of climate change are inequivalently impacting lower-latitude and island destinations in the United States [1]. Climate change has received increased interest in the sustainable tourism literature [2,3]. Climate change is the deviation from long-term weather averages (i.e., climate) typically over the span of three decades or more. Sustainable tourism is defined as “tourism that takes full account of its current and future economic, social and environmental impacts, addressing the needs of visitors, the industry, the environment and host communities” [4] (par. I). The effects of climate change are of consequence to each of these sustainable facets and stakeholder groups [1]; thus, the implications of the study will focus on how results of the study pertain to each.
The reliance of tourism activities on the natural environment makes the industry particularly susceptible to the effects of climate change, including warming temperatures [3]. For example, island states expect sea level rise from climate change to inundate coastal beaches [5,6]. Further, warming ocean temperatures attributable to climate change are salient risks to biodiversity, coral reefs, and fisheries in coastal environments [7,8,9]. Of concern, unsustainable destination characteristics (e.g., coastal degradation) are inversely related to destination demand among beach tourists [10].
In addition to degradation, researchers have also explored how climate (un)favourability influences the sustainability of tourist demand for destinations. In Turkey (a coastal country), Aygün and Baycan [11] projected tourism demand would decline in the latter part of the 21st century under scenarios of a warming climate. Retrospective studies have also established an inverse relationship between warming and tourism demand. Rutty et al. [12] reported that tourism demand (airport arrivals) to the Caribbean islands declined when thermal comfort declined (i.e., a combination of temperature and humidity increases) during the summer months. Demand was higher during the historically non-peak winter months when thermal comfort levels were near ideal. Thermal comfort is a measure of temperature and humidity conducive to tourism and travel. Missing from these inquiries is how climate risks, not favourability, are related to the sustainability of tourists’ demand for a destination. In other words, studies have explored how favourable climate conditions support coastal tourism [7,11,12] but not how increasingly dangerous thermal stress (i.e., heat) climate conditions deter tourism.
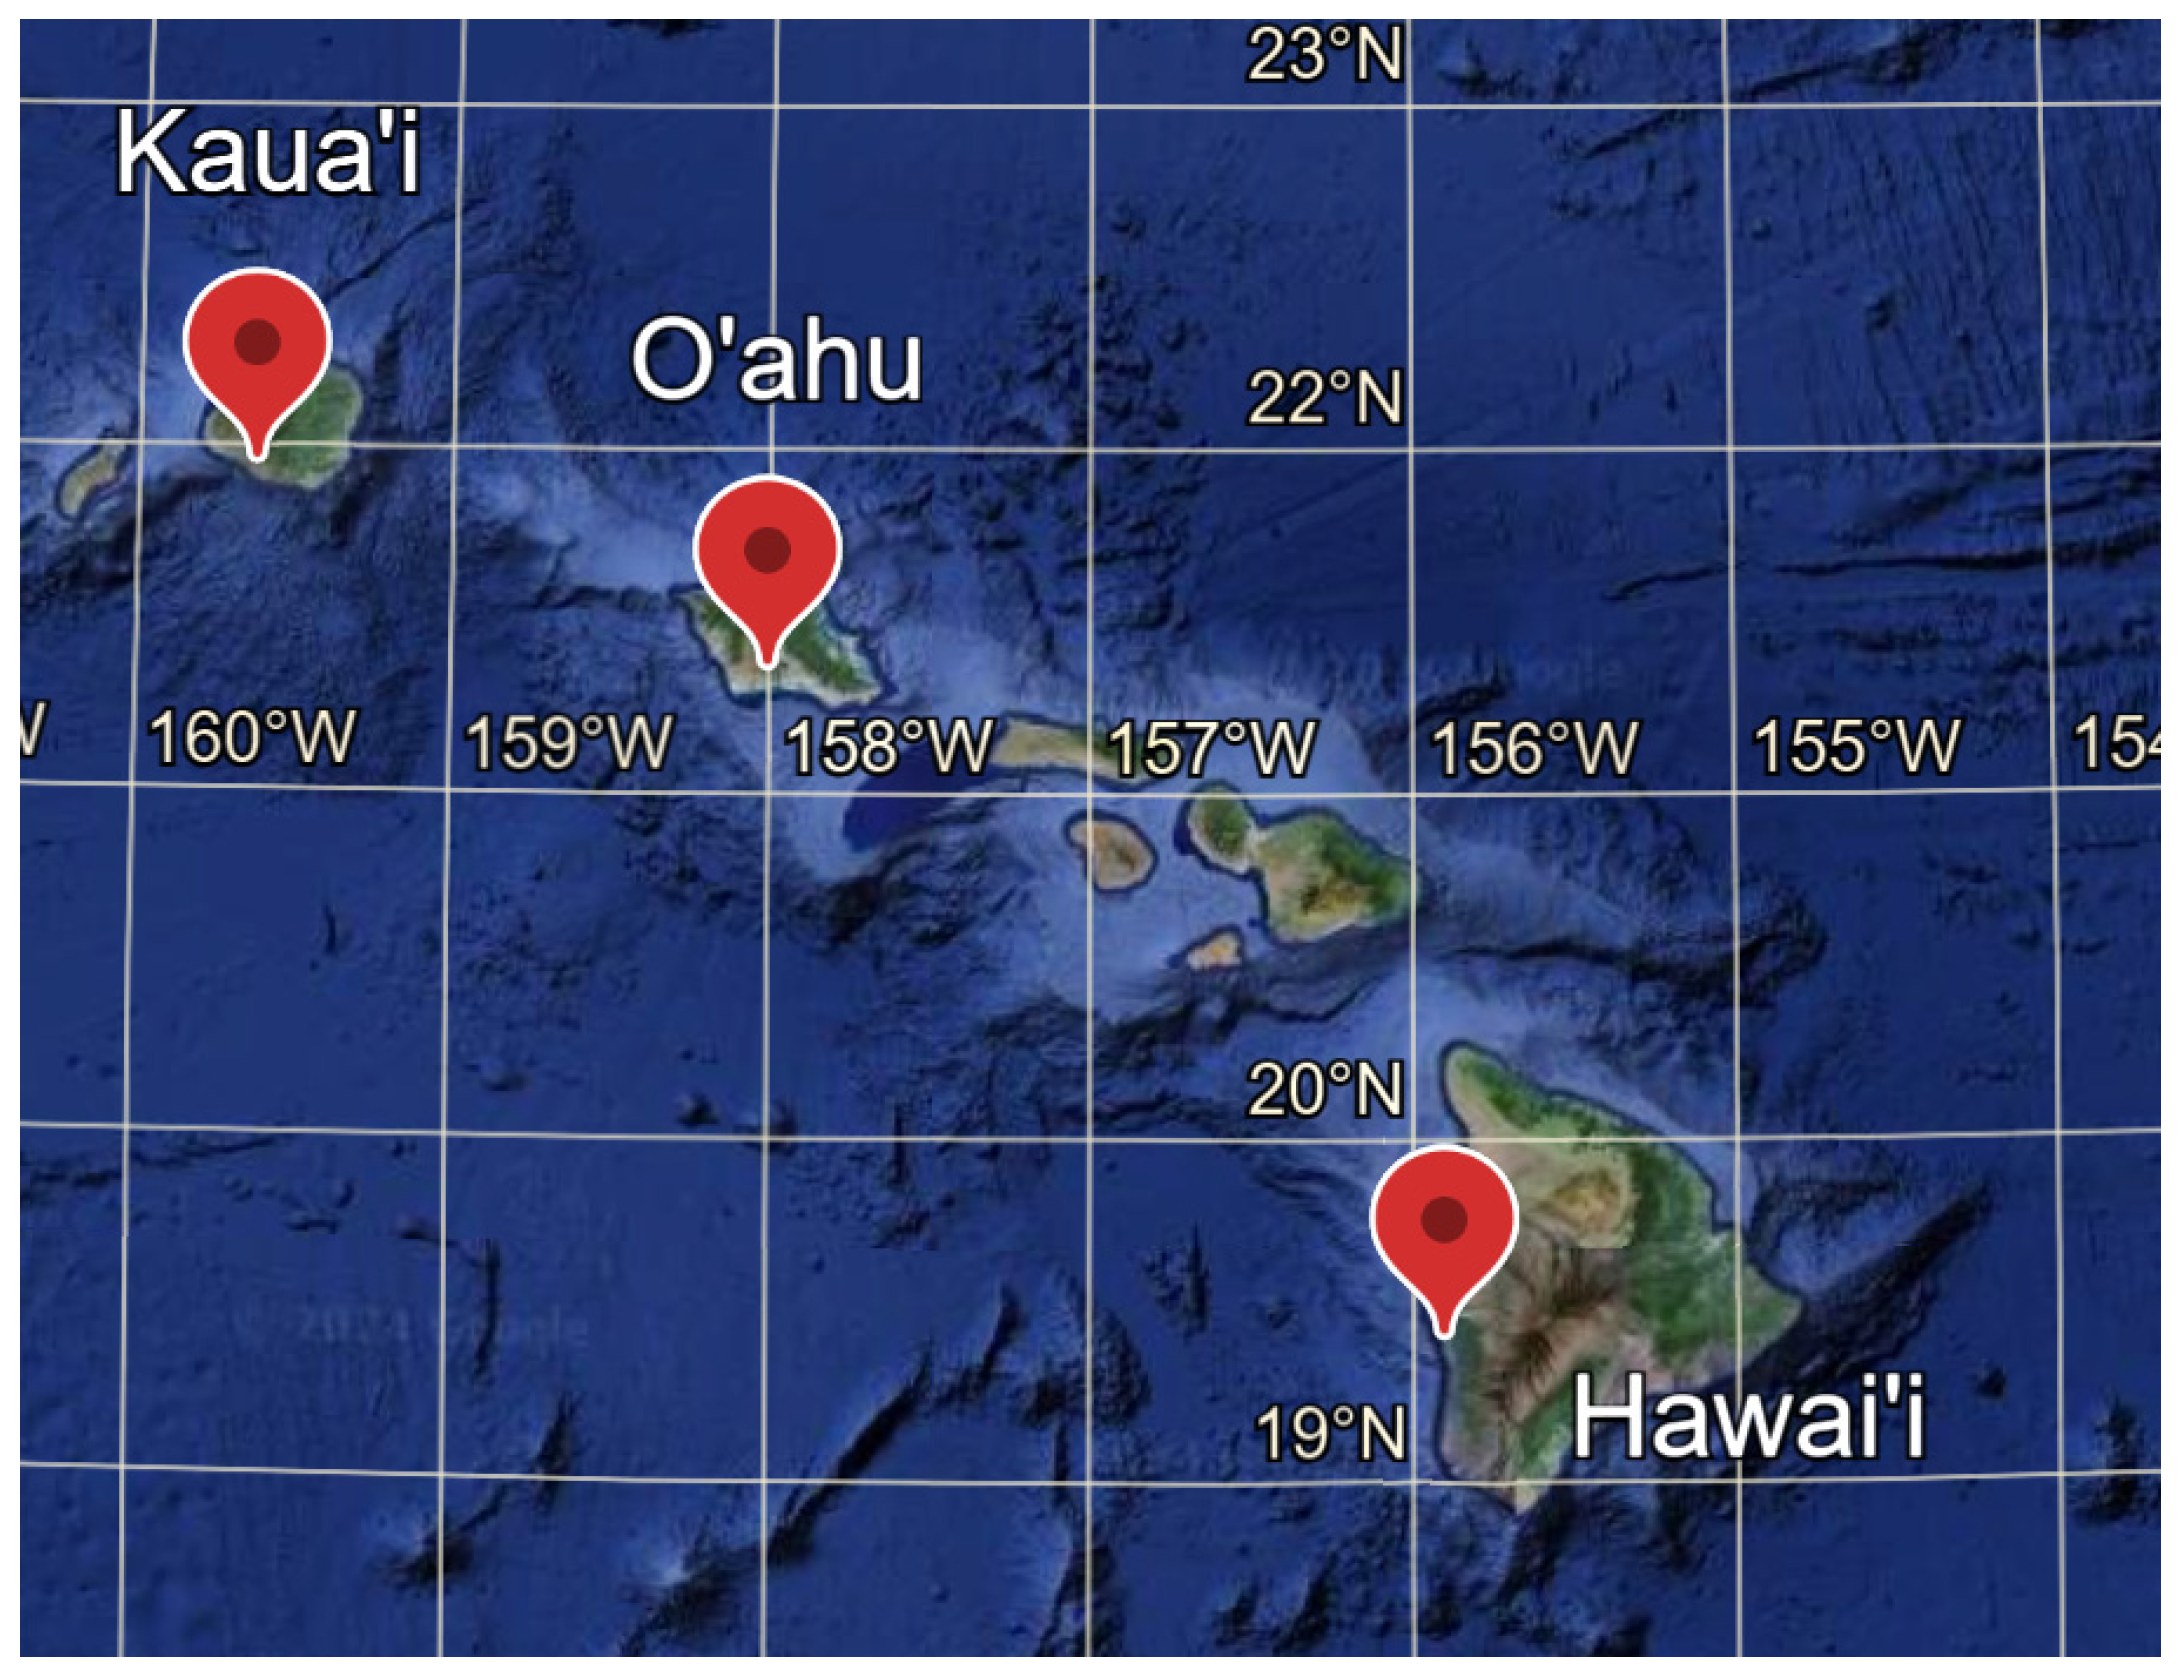
To address this research gap, we present the case of the destination-based island state of Hawaii (United States). Hawaii provides an insightful case to assess the sustainability of tourism demand because it has already experienced intensified heat with climate change [13]. Furthermore, the state’s proximity to the equator leads to extended periods of direct sunlight and solar radiation [14]. There are four major airports in Hawaii located on the islands of Hawai’i, Kuau’i, Maui, and O’ahu. Maui was omitted from the analysis because it experienced a devastating wildfire in 2023 that restricted tourists’ arrivals [15]. The dependent variable for the study is domestic inbound airport arrivals (i.e., domestic tourist arrivals not from the state of Hawaii) to three of the state’s islands (see Figure 1). International arrivals are omitted from our inquiry because some countries (e.g., China) have not returned to pre-pandemic levels of international travel, including to Hawaii [16,17].

Figure 1.
Leeward beach locations on three of Hawaii’s islands. Hawai’i: 19.3798649, −155.8974978; Kaua’i: 21.9003555, −159.6072986; O’ahu: 21.3143940, −157.9917770.
Rather than assess comfort, this study assesses thermal stress, which captures risks associated with climate conditions. The independent variable is thermal stress, operationalized via the Wet Bulb Globe Temperature (WBGT) equation. According to the National Weather Service [18] (par. I), WBGT “is a measure of the heat stress in direct sunlight, which takes into account: temperature, humidity, wind speed, sun angle and cloud cover (solar radiation)”. Additional details about how the WBGT is calculated are located in the next section. The use of the WBGT is appropriate for our study because it estimates heat risks for work and recreation dependent on whether or not an individual is acclimated to the local climatic conditions [18,19]. We acknowledge that there are risk levels available for more sedentary activities [20], though we defer to risk levels for non-acclimated recreationalists not knowing individual characteristics and/or the nature of hospitality and recreational motivations for macro-level airport arrivals. WBGT ranges (°C) and coordinating thermal risk levels are provided in Table 1.

Table 1.
WBGT thermal stress risk classifications for non-acclimated recreationalists (from Roberts et al. [21]).
Historically, the two most widespread uses of the equation have been (1) outdoor worker safety [22,23] and (2) sports athlete safety [21]. More recently, the equation has been applied to risk assessment for tourism behaviours, including attendance at major sporting events [19] and national park visitation [13]. We extend the application of WBGT to (1) document how thermal conditions have changed as a process of climate change and (2) investigate the influence of thermal stress risks on tourists’ demand for the islands of Hawaii (i.e., becoming unsustainable). Because the explanatory study examines previously un-investigated phenomenon at the destination, we offer the following two research questions:
Research Question 1 (RQ1): How has thermal stress changed?
Research Question 2 (RQ2): How are thermal stress risks associated with tourists’ arrivals?
2. Materials and Methods
Monthly data for domestic airport arrivals were obtained from the Hawaii Tourism Authority [16] for the three focal islands of Hawai’i, Kuau’i, and O’ahu (Figure 1). The data capture the overall monthly number of domestic visitors from states other than Hawaii. Data were available from 2015 to 2023. To account for COVID-19, monthly averages were calculated (2015–2019). Monthly arrivals were then removed from the timeseries until a month either met or exceeded the 2015–2019 average. The Hawai’i and O’ahu post-COVID-19 dates are May 2021 through December 2023, and the Kuau’i post-COVID-19 dates are July 2021 through December 2023. Monthly inflation data [24] from the United States were matched with the dataset to utilize as a control in the analysis.
According to NOAA [14], the leeward side (i.e., protected from wind by mountains) of the Hawaiian Islands are the sunniest, meaning the experience the most exposure to the solar duration and radiation. Using Google Earth, coordinates for three representative leeward beaches were identified as locations from which to retrieve climate data. Using macro-level arrivals data, there is no way to know where tourists recreate while on the islands. Thus, we felt it prudent to err on the side of selecting recreational areas with the most thermal stress exposure. However, prior survey results of tourists to Hawaii indicate that the primary motivation for visiting is the state’s natural beauty (88% of respondents) [25]. The second most popular motivation is to relax on the beach. Taken together, the extraordinarily high percentage of outdoor recreation is an indication that tourists are exposed to the natural environment and thermal stress.
Daily weather data were obtained from 1981 to 2023 from NASA [26] to calculate black globe temperature (Tbg) and the WBGT equation (see Hajizadeh et al. [27]). Measures for Tbg were all sky solar radiation (Rs), relative humidity (Hr), and ambient temperature (Ta). Tbg and WBGT take the following equations:
Tbg = 0.01498Rs + 1.184Ta − 0.0789Hr − 2.739
WBGT = (Twb × 0.7) + (Tbg × 0.2) + (Ta)
Daily values for WBGT were calculated and then aggregated monthly. Daily data were used initially to run higher-resolution analysis for R1 (i.e., paired-sample t-tests). WBGT data were then aggregated to monthly, and risk levels were assigned based on the risk-level scheme from Table 1.
To test R1, paired-sample t-tests were run for daily WBGT data (°C) and each of the thermal stress risk levels for the most historic (1981–1990) and most modern 10 years of the dataset (2014–2023). The t-statistic will tell if a significant change is observed.
To test R2, a univariate ANOVA was run with aggregated arrivals as the dependent variable (2015–2023). The three independent variables were monthly risk levels (0–3) meteorological season (1 = winter, 2 = spring, 3 = summer, 4 = fall), and inflation. Seasonality is a factor for many nature-based activities [26], providing logic for its inclusion. Inflation was included as a random factor because it varies month-to-month. The ANOVA method is appropriate because (1) the timeseries was broken when COVID-19-impacted months were removed, (2) there was only one dependent variable (i.e., arrivals), and (3) there were fixed effects (i.e., risks and season) and a random factor (i.e., inflation). The results will indicate if there are any differences between risk levels and monthly arrivals, where a post hoc Sheffe’s test will indicate where (if any) differences between risks emerged.
3. Results
Descriptives are reported in Table 2 for arrivals and thermal stress variables (2015–2023). Arrivals peaked in the summer meteorological season (mean = 193,476 visitors) followed by spring, fall, and winter. The highest WBGT averages were in the summer and fall meteorological seasons, where the most Level 2 thermal stress risk days were also observed on average. Findings indicate that on average, the WBGT mean for most recent 10 years reside within the moderate risk (Level 2 from Table 1) level for Kaua’i and O’ahu; we also observed intensified WBGT for Hawai’i, though the risk level still resides in the low (Level 1) category.
Table 2.
Descriptives for arrivals and thermal stress (2015–2023).
R1 asked if thermal stress changed during the observational period (1984–2023). Paired-sample t-tests for daily WBGT values for at each island indicate that change occurred when comparing the most historic (1984–1993) to the most modern (2014–2023) decades (see Table 3). The WBGT differences were significant for the islands of Hawai’i (t = −27.21, df = 3651, p = 0.000), Kauai’ (t = −42.36, df = 3651, p = 0.000), and O’ahu (t = −41.45, df = 3651, p = 0.000). The results indicate a significant WBGT increase ranging from 0.6 °C (Hawai’i) to 1.0 °C (Kauai’) throughout the study period. Results indicate a very large effect size for each paired sample (i.e., Cohen’s d > 1.0) [28].
Table 3.
Paired-sample t-tests for most historic (1984–1993) and modern (2014–2023) decades.
R2 asked if thermal stress risks were associated with monthly domestic tourists’ arrivals to the aggregate of the islands of Hawaii (2015–2023). Results from univariate ANOVA analysis demonstrate a significant main effect for thermal stress risk levels (F = 28.04, p = 0.000, df = 3). Season (i.e., the second independent variable) approached significance (F = 2.67, p = 0.050, df = 3), as did inflation, the study’s co-variate (F = 1.79, p = 0.094, df = 29). The intercept was the most significant model variable (F = 784.54, p = 0.000, df = 1), an indication that arrivals are associated with prior arrivals. There were no observed interaction effects. In other words, there were no combinations of variables that had a significant impact on arrivals.
To provide additional details, Scheffe’s post hoc test was run for thermal stress risk levels. Results indicate that Level 2 risks are more significant predictors than both Level 0 and Level 1 risks (p = 0.000), though not Level 3 risks. There were only nine observed Level 3 risks, so the lack of significance is to be expected. Figure 2 depicts the relationships shared between risk levels with arrivals sorted by season, where the comparatively high estimated marginal arrival means for Level 2 demonstrate the comparative impact of the other risk levels.
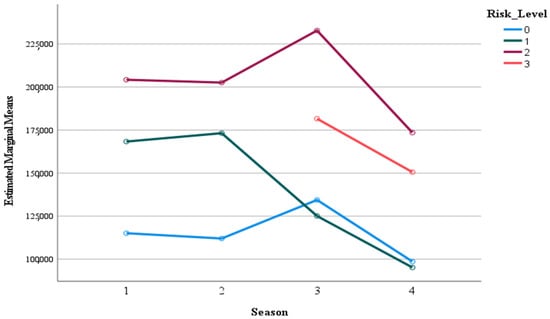
Figure 2.
Estimated marginal means for risk level and meteorological season. Meteorological seasons (x-axis): winter = 1; spring = 2; summer = 3; fall = 4. Estimated marginal mean (y-axis) units = domestic airport arrivals.
4. Discussion
Here, we explore the influence of thermal stress on tourists’ demand via arrivals to three islands of Hawaii. One of the early research gaps in the sustainable tourism literature was tourists’ demand for sustainable destinations [29]. Multiple researchers have since investigated this gap. For instance, Weber [30] reviewed the literature, finding that approximately a third of tourists are interested in sustainable tourism or some facet of sustainability at a destination (i.e., positive demand effects). More closely related to this study’s context, Brau [10] stressed the importance of favourable coastal destination characteristics (e.g., lack of beach overcrowding) to sustain tourists’ demand. Comparably, tourism climatologists have also assessed how (un)favourable climate conditions impact tourists’ destination demand [12,31,32]. A knowledge gap we explicitly address here is how climate risks (not favourability) are related to sustained tourists’ demand to three of Hawaii’s islands. This inquiry is of the utmost importance, considering that (1) almost all tourists’ motivations to travel to Hawaii involve exposure to the natural environment (e.g., thermal stress) [25] and (2) 2023 was the hottest global year on record, attributed to climate change [33].
The findings demonstrate that climate is changing when measured as thermal stress at the three focal leeward beach locations in Hawai’i, Kaua’i, and O’ahu. Observations also show that arrivals are positively related to the Level 2 moderate risks (Table 4), an indication that tourists’ demand persists despite thermal stress conditions becoming riskier throughout the observational period. A post hoc analysis of the variables in Equations (1) and (2) indicate that in relative terms, humidity (Hr) declined throughout the study, which would in turn elevate black globe temperature (Tbg) if all else remained constant. The other variables did not remain constant, however; ambient temperature (Ta) and solar radiation (Sr) both trended higher. Like other islands located on the cool waters of the Pacific Island (e.g., Channel Islands in California, United States) [34], Hawaii’s heat does have a moderating factor. However, in scenarios of warming as a result of climate change [35] it is likely that tourists’ demand will invert at some heat threshold, like other islands (e.g., Caribbean Islands) [12].
Table 4.
Univariate ANOVA analysis.
4.1. Stakeholder Implications
According to the UNWTO [4], the four sustainable tourism stakeholder groups are visitors, communities, the industry, and the environment, all of which are directly impacted by a changing climate. Stakeholder groups are vital to the success of most organizations and firms [36] and, therefore, require some examination in terms of how our results could potentially impact each.
4.1.1. Visitors
The first stakeholder group is visitors, who are arguably at the greatest risks to thermal stress measured as WBGT. Travellers are often not acclimated to the conditions that exist in Hawaii and, therefore, could be subject to various health and safety risks, especially in future scenarios of greater heat. On average, it takes about two weeks to become acclimated to local heat conditions [21]. The recreational activities of tourists also raise their relative heat exposure compared to workers on the island (see Table 1 and Table 5). Reidmiller et al. [1] explain that on days of increased temperatures, hospital admissions and emergency room visits trend higher, mainly due to heat-related illnesses. This is particularly true during the early parts of the summer season, “when populations are less accustomed to experiencing elevated temperatures” [1] (p. 536). The risks are so pervasive that the Centers for Disease Control [37] and NOAA released the “HeatRisk Forecast Tool” in April 2024 to identify dangerous heat conditions throughout the United States using a 7-day forecast.
Table 5.
Scheffe’s post hoc tests for thermal stress risk levels.
While our research focused primarily on weather risks (i.e., thermal stress), there is also a body of literature that explores the favourability of weather conditions for tourists. For instance, Rutty et al. [12] found that that there are heat thresholds when beach recreation becomes less favourable for visitors. Though not causal, our results demonstrate a similar directionality, where the nine moderately elevated (Level 3) months were less predictive of estimated tourists’ arrivals than moderate (Level 2) risk months (see Figure 2). In other words, the relationship inverted to negative when risks increased to moderately high. Specific to WBGT, high heat levels have already proven to be restrictive of national parks visitation in Hawaii [13]. Under various warming scenarios, tourists may need to (1) change the timing of travel to Hawaii, (2) consider safer and/or more favourable recreational options once on the island, or (3) choose another destination.
4.1.2. Communities
Visitors are not the only individuals who experience heat at destinations. One such stakeholder group often overlooked is the workforce from the local community (e.g., resort employees). Table 6 shows thermal stress risk for specific to workers. Heat stress and heat-related illnesses can have a myriad of negative psychological and physiological outcomes (e.g., cardiopulmonary issues, electrolyte imbalance), which can affect visitors and workers alike [1]. Even when these workers are local residents and, therefore, likely acclimated to the increased temperature, dangers with a warming climate are becoming more salient. For instance, high-level moderate and moderately high thermal stress risks observed for recreationalists (Table 2) correspond with high risks and potentially unsafe conditions for unacclimated and acclimated workers, respectively.
Table 6.
Simplified thermal stress risks for workers (from Occupational Safety and Health Administration [OSHA], [38].
Due to the possibility of increased resident employee and visitor medical needs, local medical infrastructure could become strained. For instance, Faurie et al. [39] conducted a meta-analysis finding that a 1 °C increase in temperature correlated to an average increase of 18% in the morbidity rate from heat-related illnesses. Emergency services, hospitals, and pharmacies could all expect to see increased needs for their services during the hottest months, both in terms of emergency preparedness and normal medical practices. A community-based adaptive strategy to a warming climate would be to ensure adequate medical infrastructure to respond to the increased likelihood of health risks.
4.1.3. Industry
A third stakeholder group is the broader tourism industry. Given a warming climate, the industry should consider both adaptive and mitigative measures. One such adaptation for lower-latitude islands like Hawaii is cooling equipment, which will raise operational costs under scenarios of increasing thermal stress (i.e., WBGT). In fact, tourism demand and temperature are two factors that researchers have linked to higher operational costs [40]. Air-conditioned buildings, rooms, and the availability of pools will all increase electricity consumption, causing economic (i.e., lower profits) and potentially environmental (i.e., emissions) impacts, both of which are counter to the tenets of sustainable tourism [4]. Tourism operators may also choose to expand recreation into other seasons and/or expand recreational offering during warm seasons not at elevated risks to warming conditions [41].
Another potential adaptive measure to increased heat is increased wages. For workers exposed to unabated heat, much like a beach recreationalist, heat conditions could constitute hazardous working conditions [38] and require extra compensation. Even with the extra pay, tourism operators should expect to see decreased productivity corresponding with high temperatures [42]. In fact, some researchers suggest that 30–40% of annual daylight hours will become too hot to work in for some regions and could result in over 20% global GDP loss by 2100 [43]. If employers adhere to Occupational Safety and Health Administration (OSHA) rest recommendations—and other best practices such as mandatory hydration and time away from direct sunlight [38]—it may become necessary to hire more workers to complete the same number of tasks.
The tourism industry will also need to be active in climate change mitigation. For instance, coastal and island destinations, such as those in the state of Hawaii, are likely to experience more flooding, the erosion of shores, and the destruction of nature-based and natural habitats [1]. Reidmiller et al. [1] estimate “that between $66 billion and $106 billion worth of real estate will be below sea level by 2050” in the United States under an intermediate sea level rise scenario (p. 321). Two mitigative measures to offset economic losses include insurance and weather futures; however, for at-risk coastal geographies like those in California, Florida, and Hawaii, United States, insurers are starting to drop services [13]. At a global scale, Hawaii’s tourism industry and the United States government should consider an expanded role in climate change mitigation. Presently, Hawaii remains a part of the global climate change problem due to emissions from air travel to the destination [44]. Its coastal features also make it one of the most exposed to changes, which will require a delicate balance between accommodating travellers while contributing to emissions reductions at a large scale to counteract the state’s carbon footprint.
4.1.4. Environment
The fourth sustainable tourism stakeholder is the environment. Climate is one of the three facets that comprise the natural environment, alongside physical resources and wildlife [45]. Temperature is one climate factor that influences the health and safety of tourists, but it is not the only factor. For instance, climate indices like the HCI-beach have measures of thermal comfort built into the equations alongside aesthetic (e.g., cloud cover) and physical (e.g., precipitation, wind speed) dimensions of climate [12]. These other facets can counteract unfavourable thermal comfort conditions, indicating to tourists and/or tourism operators that conditions are acceptable or perhaps even favourable. When concerned with climate dangers, especially at lower latitudes and altitudes, we believe that an approach that assesses thermal stress via the WBGT is more appropriate because (1) pre-prescribed risks levels are known, (2) mitigative steps are medically prescribed for the risk levels [21], and (3) real-time and forecasted WBGT levels (°C) are publicly accessible [18,36]. Our findings indicate that while climate change is observed with increasing WBGT values, the relationship with arrivals remains positive. The sustainability of tourists’ demand based on thermal stress for domestic arrivals for the time being is sustainable. Yet, the presence of moderately high risk months—and the lost estimated arrivals compared to moderate risks (Figure 2)—provide anecdotal evidence that heat could lead to unsustainable demand situations in the future.
4.2. Limitations and Future Research
This study offers a novel approach, though it is not without limitations. First, the influence of COVID-19 required that months be removed from the time series. Otherwise, we would have had methodological freedom to use more advance time series methodologies, like ARIMA models. Second, arrivals data were only available monthly. Future researchers would be well-served (1) collaborating with tourism authorities to obtain daily arrivals data or (2) using alternative data sources with higher resolution. For instance, Wilkins et al. [46] tracked the real-time movements of visitors to national parks in the United States using geo-tagged locations from social media. Third, the range of the dataset was limited to 2015–2023. This is a common shortcoming for arrivals data. For example, Australia only has monthly data publicly available for arrivals to its coastal airports from 2009 [7]. Fourth, we had to omit arrivals from the second busiest airport, Maui, due to a wildfire that, like COVID-19, restricted travel to the island. Relatedly, it would be useful to explore the influence of distinct weather extremes, like wildfire or tropical cyclones, on tourists’ demand. This approach would likely require daily data. Lastly, the recreational motivations of tourists arriving to Hawaii are unknown using a macro-level approach. The Hawaii Tourism Authority [16] tracks recreational reasons for travel using the inbound arrivals survey, though it does not publicly link these data to arrivals to specific airports. Comparably, the macro-level approach precludes knowing what media may have influenced tourists’ decisions to visit or not. A better understanding of travel motives would help to better understand the relationship between heat and tourism to the islands of Hawaii.
Author Contributions
Conceptualization: C.A.C. and R.A.O.; methodology: C.A.C.; software: C.A.C.; formal analysis: C.A.C.; investigation: C.A.C.; writing—original draft: C.A.C. and R.A.O.; visualization: C.A.C. All authors have read and agreed to the published version of the manuscript.
Funding
This research received no external funding.
Institutional Review Board Statement
Not applicable because arrivals data was obtained from a publicly accessible deidentified database.
Informed Consent Statement
Not applicable.
Data Availability Statement
All data used for this study are publicly accessible, as described in the methods.
Conflicts of Interest
The authors declare no actual or perceived conflicts of interest.
References
- Reidmiller, D.R.; Avery, C.W.; Easterling, D.R.; Kunkel, K.E.; Lewis, K.L.M.; Maycock, T.K.; Stewart, B.C. (Eds.) Impacts, Risks, and Adaptation in the United States: Fourth National Climate Assessment; U.S. Global Change Research Program: Washington, DC, USA, 2018.
- Scott, D. Why sustainable tourism must address climate change. J. Sustain. Tour. 2011, 19, 17–34. [Google Scholar] [CrossRef]
- Scott, D. Sustainable tourism and the grand challenge of climate change. Sustainability 2021, 13, 1966. [Google Scholar] [CrossRef]
- UNWTO. Sustainable Development. Available online: https://www.unwto.org/sustainable-development (accessed on 31 March 2024).
- Dodds, R.; Kelman, I. How climate change is considered in sustainable tourism policies: A case of the Mediterranean islands of Malta and Mallorca. Tour. Rev. Int. 2008, 12, 57–70. [Google Scholar] [CrossRef]
- Mycoo, M. Sustainable tourism, climate change and sea level rise adaptation policies in Barbados. Nat. Resourc. Forum 2014, 38, 47–57. [Google Scholar] [CrossRef]
- Craig, C.A. Nature-based tourism and climate favourability: A case of the Great Barrier Reef, Australia. Tour. Recreat. Res. 2023. [Google Scholar] [CrossRef]
- Lincoln, S.; Buckley, P.; Howes, E.L.; Maltby, K.M.; Pinnegar, J.K.; Ali, T.S.; Alosairi, Y.; Al-Ragum, A.; Baglee, A.; Balmes, C.O.; et al. A regional review of marine and coastal impacts of climate change on the ROPME sea area. Sustainability 2021, 13, 13810. [Google Scholar] [CrossRef]
- Rivera, H.; Chan, A.; Luu, V. Coral reefs are critical for our food supply, tourism, and ocean health. We can protect them from climate change. MIT Sci. Pol. Rev. 2021, 1, 18–33. [Google Scholar] [CrossRef]
- Brau, R. Demand-driven sustainable tourism? A choice modelling analysis. Tour. Econ. 2008, 14, 691–708. [Google Scholar] [CrossRef]
- Aygün Oğur, A.; Baycan, T. Assessing climate change impacts on tourism demand in Turkey. Environ. Dev. Sustain. 2023, 25, 2905–2935. [Google Scholar] [CrossRef]
- Rutty, M.; Scott, D.; Matthews, L.; Burrowes, R.; Trotman, A.; Mahon, R.; Charles, A. An inter-comparison of the Holiday Climate Index (HCI: Beach) and the Tourism Climate Index (TCI) to explain Canadian tourism arrivals to the Caribbean. Atmosphere 2020, 11, 412. [Google Scholar] [CrossRef]
- Craig, C.A. Climate Resource View (CRV): A case of thermal safety at United States national parks. J. Outdoor Recreat. Tour. 2024, 45, 100737. [Google Scholar] [CrossRef]
- NOAA. Climate of Hawai’i. Available online: https://www.weather.gov/hfo/climate_summary (accessed on 5 April 2024).
- National Interagency Fire Center. National Significant Wildland Fire Potential Outlook. 1 September 2023. Available online: https://www.nifc.gov/sites/default/files/NICC/2-Predictive%20Services/Outlooks/monthly_seasonal_outlook.pdf (accessed on 20 March 2024).
- Hawaii Tourism Authority. Monthly Visitor Statistics. Available online: https://www.hawaiitourismauthority.org/research/monthly-visitor-statistics/ (accessed on 11 March 2024).
- Sun, X.; Wandelt, S.; Zhang, A. A data-driven analysis of the aviation recovery from the COVID-19 pandemic. J. Air Transp. Manag. 2023, 109, 102401. [Google Scholar] [CrossRef] [PubMed]
- National Weather Service. WetBulb Globe Temperature. Available online: https://www.weather.gov/tsa/wbgt (accessed on 10 April 2024).
- Kakamu, T.; Wada, K.; Smith, D.R.; Endo, S.; Fukushima, T. Preventing heat illness in the anticipated hot climate of the Tokyo 2020 Summer Olympic Games. Environ Health Prev. Med. 2017, 22, 1–6. [Google Scholar] [CrossRef] [PubMed]
- Japanese Society of Biometeorology. Guidelines for the prevention of heat illness in daily life (Ver. 4 in English). Jpn. J. Biometeorol. 2023, 60, 75–96. [Google Scholar] [CrossRef]
- Roberts, W.O.; Armstrong, L.E.; Sawka, M.N.; Yeargin, S.W.; Heled, Y.; O’Connor, F.G. ACSM expert consensus statement on exertional heat illness: Recognition, management, and return to activity. Curr. Sports Med. Rep. 2021, 20, 470–484. [Google Scholar] [CrossRef] [PubMed]
- Kakaei, H.; Omidi, F.; Ghasemi, R.; Sabet, M.R.; Golbabaei, F. Changes of WBGT as a heat stress index over the time: A systematic review and meta-analysis. Urban Climat. 2019, 27, 284–292. [Google Scholar] [CrossRef]
- Centers for Disease Control and Prevention (CDC). Heat Stress. Available online: https://www.cdc.gov/niosh/topics/heatstress/default.html (accessed on 10 April 2024).
- United States Bureau of Labor Statistics. Databases, Tables, and Calculators by Subject. Available online: https://data.bls.gov/timeseries/CUUR0000SA0L1E?output_view=pct_12mths (accessed on 14 May 2024).
- Gitlin, J. Why Hawaii Attracts More Tourists Than Most Countries. Available online: https://www.surveymonkey.com/curiosity/why-hawaii-attracts-more-tourists-than-most-countries/ (accessed on 14 May 2024).
- NASA. Data Access Viewer. Available online: https://power.larc.nasa.gov/data-access-viewer/ (accessed on 5 February 2024).
- Hajizadeh, R.; Farhang Dehghan, S.; Golbabaei, F.; Jafari, S.M.; Karajizadeh, M. Offering a model for estimating black globe temperature according to meteorological measurements. Meteor. Appl. 2017, 24, 303–307. [Google Scholar] [CrossRef]
- Cohen, J. Statistical Power Analysis for the Behavioral Sciences; Routledge: London, UK, 2013. [Google Scholar]
- Liu, Z. Sustainable tourism development: A critique. J. Sustain. Tour. 2003, 11, 459–475. [Google Scholar] [CrossRef]
- Weber, F. Demand for sustainable tourism. In Corporate Sustainability and Responsibility in Tourism; Springer: Berlin/Heidelberg, Germany, 2019; pp. 265–281. [Google Scholar]
- Ma, S.; Craig, C.A.; Feng, S.; Liu, C. Climate resources at United States National Parks: A tourism climate index approach. Tour. Recreat. Res. 2023, 48, 710–724. [Google Scholar] [CrossRef]
- Scott, D.; Rutty, M.; Amelung, B.; Tang, M. An inter-comparison of the holiday climate index (HCI) and the tourism climate index (TCI) in Europe. Atmosphere 2016, 7, 80. [Google Scholar] [CrossRef]
- NOAA. 2023 Was the World’s Warmest Year on Record, by Far. Available online: https://www.noaa.gov/news/2023-was-worlds-warmest-year-on-record-by-far (accessed on 31 March 2024).
- Craig, C.A.; Ma, S.; Feng, S. Climate Resources for Camping: A Resource-based theory perspective. Tour. Manag. Perspect. 2023, 45, 101072. [Google Scholar] [CrossRef]
- Masson-Delmotte, V.; Zhai, P.; Pirani, A.; Connors, S.L.; Péan, C.; Berger, S.; Huang, M.; Yelekçi, O.; Yu, R.; Zhou, B.; et al. (Eds.) Climate Change 2021: The Physical Science Basis. Contribution of Working Group I to the Sixth Assessment Report of the Intergovernmental Panel on Climate Change; IPCC: Geneva, Switzerland, 2021; Available online: https://www.ipcc.ch/report/ar6/wg1/downloads/report/IPCC_AR6_WGI_FrontMatter.pdf (accessed on 7 April 2023).
- Donaldson, T.; Preston, L.E. The stakeholder theory of the corporation: Concepts, evidence, and implications. Acad. Manag. Rev. 1995, 20, 65–91. [Google Scholar] [CrossRef]
- Centers for Disease Control and Prevention. CDC Announces Important Advances in Protecting Americans from Heat. Available online: https://www.cdc.gov/media/releases/2024/p0422-heat-protection.html (accessed on 22 April 2024).
- Occupational Safety and Health Administration. Heat. Available online: https://www.osha.gov/heat-exposure/hazards#:~:text=OSHA%20recommends%20the%20use%20of,the%20potential%20for%20evaporative%20cooling (accessed on 12 April 2024).
- Faurie, C.; Varghese, B.M.; Liu, J.; Bi, P. Association between high temperature and heatwaves with heat-related illnesses: A systemic review and meta-analysis. Sci. Total Environ. 2022, 852, 158332. [Google Scholar] [CrossRef] [PubMed]
- Pablo-Romero, M.d.P.; Pozo-Barajas, R.; Sanchez-Rivas, J. Tourism and temperature effects on electricity consumption on the hospitality sector. J. Clean. Prod. 2019, 240, 118168. [Google Scholar] [CrossRef]
- Scott, D.; McBoyle, G. Climate change adaptation in the ski industry. Mitig. Adaptat Strat. Glob. Chang. 2007, 12, 1411–1431. [Google Scholar] [CrossRef]
- Kjellstrom, T.; Kovats, S.; Lloyd, S.J.; Holt, T.; Tol, R.S.J. The direct impact of climate change on regional labor productivity. Arch. Environ. Occup. Health 2009, 64, 217–227. [Google Scholar] [CrossRef]
- Kjellstrom, T.; Briggs, D.; Freyberg, C.; Lemke, B.; Otto, M.; Hyatt, O. Heat, human performance, and occupational health: A key issue for the assessment of global climate change impacts. Ann. Rev. Public Health 2016, 37, 97–112. [Google Scholar] [CrossRef]
- Lenzen, M.; Sun, Y.Y.; Faturay, F.; Ting, Y.P.; Geschke, A.; Malik, A. The carbon footprint of global tourism. Nat. Clim. Chang. 2018, 8, 522–528. [Google Scholar] [CrossRef]
- Wheelen, T.L.; Hoffman, J.D.H.A.N.; Bamford, C.E. Strategic Management and Business Policy; Pearson: Upper Saddle River, NJ, USA, 2018. [Google Scholar]
- Wilkins, E.J.; Howe, P.D.; Smith, J.W. Social media reveal ecoregional variation in how weather influences visitor behavior in US National Park Service units. Sci. Rep. 2021, 11, 2403. [Google Scholar] [CrossRef]
Disclaimer/Publisher’s Note: The statements, opinions and data contained in all publications are solely those of the individual author(s) and contributor(s) and not of MDPI and/or the editor(s). MDPI and/or the editor(s) disclaim responsibility for any injury to people or property resulting from any ideas, methods, instructions or products referred to in the content. |
© 2024 by the authors. Licensee MDPI, Basel, Switzerland. This article is an open access article distributed under the terms and conditions of the Creative Commons Attribution (CC BY) license (https://creativecommons.org/licenses/by/4.0/).