Abstract
The Tibetan plateau, with complex and diverse ecosystems, is an important ecological security barrier to China. However, climate change and the spread of invasive plant species have imperiled the once pristine and diverse ecosystem of the region. To prevent the further spread and control of invasive plants, it is important to delineate the potential distribution patterns of alien invasive plants at the regional scale across Tibet and understand their responses to climate change. Galinsoga parviflora Cav., a member of the family Asteraceae, is an annual herbaceous plant distributed globally as an invasive weed and possesses characteristics that make it highly invasive, such as a strong ability to proliferate and disperse. The species is also known to have an allelopathic effect. There has been no report on the spatial distribution of G. parviflora in Tibet. Using field survey data, we investigated the risk of G. parviflora invasion and its impacts on the ecological safety of Tibet. We employed the MaxEnt model using the R language and SPSS software to optimize and select model parameters and data. We acquired various environmental variables along with current and future climate change scenarios (two carbon emission scenarios, SSP126 and SSP585, for the years 2050 and 2090) to predict the geographic distribution and potential risk areas in Tibet that G. parviflora can invade. The MaxEnt model accurately predicted the distribution of G. parviflora in Tibet with an average AUC of 0.985. The most suitable environmental conditions in which G. parviflora performed the best in Tibet included a mean annual temperature of 6.2–10.0 °C and an elevation range of 2672–3744 m above sea level. Our results indicate that low precipitation during the coldest quarter of the year (mean temperature −2–3 °C) was the most important variable predicting G. parviflora distribution. The results also showed that the species was hardly found when precipitation in the coldest quarter exceeded 155 mm. The current potential invasion risk areas for G. parviflora included the river valleys of central, southeastern, and eastern Tibet. With future climate change scenarios (i.e., SSP126, SSP585), the suitable habitats for G. parviflora distribution will likely shift to northwest regions from the southeast. Particularly under the highest carbon emission scenario (i.e., SSP585), the potential risk area expands more rapidly, and the center of distribution shifts to northwest regions. These findings provide useful information about the current and future changes in G. parviflora distribution in Tibet, which is crucial for the comprehensive and proactive management and control of G. parviflora under future climate change.
1. Introduction
Biological invasions are a growing threat to biodiversity and human economics, as invasions cause the major decline and loss of native species and economic assets worldwide [1]. As such, the invasion of alien species has become a major ecological issue for national ecological security in various countries [2]. Biological invasions also have a direct impact on human health, as pollens from some invasive plant species can cause diseases such as pollen allergy [3].
Tibet has the highest plateau terrace in the world, with an average elevation of 4500 m above sea level (asl). With complex and diverse ecosystems, the Tibetan plateau is a crucial ecological barrier to China. However, the region is facing a significant threat from globalization and increasing human activities, combined with diverse geomorphological conditions, which provide conducive environments for invasive species to establish. Moreover, invasive species can establish stable populations in areas with similar abiotic conditions to their native habitats, extending their distribution and causing ecological harm to the invaded areas [4]. Invasive species can be established readily in areas with weak ecosystem structure by efficiently utilizing suitable ecological niches, negatively impacting ecosystem functions provided by native ecosystems [4,5,6]. Therefore, it is important to conduct research on invasive alien plants and their distributions in the ecologically vulnerable Tibetan region.
Galinsoga parviflora is native to Mexico and has spread worldwide, mainly in temperate and subtropical regions, covering over 130 countries except Greenland [7,8], through natural seed dispersal and human activities [9]. The species was identified as a worldwide invasive weed at the end of the 20th century and received significant attention due to its prolific invasive characteristics [8,10]. G. parviflora has attributes that make it highly invasive in new environments, including high levels of reproductive outputs, dispersal ability, and allelopathic effects [7]. The species outcompetes native species in invaded areas, causing serious ecological and economic damage, including biodiversity loss [8].
Global climate change, population growth, habitat fragmentation, invasive alien species, and the overexploitation of natural resources are damaging the integrity of ecosystem structure and functions [11,12]. In addition, climate change is affecting the distribution of some plant species, including invasive species, by altering environmental and climate variables such as temperature and precipitation. Particularly, climate change may exacerbate the rapid expansion of invasive species in the introduced regions [10,11]. In this context, predicting and describing the current and potential future distribution of invasive species is crucial for monitoring and managing invasive alien species [13,14].
We used ecological niche models to undertake a risk assessment of invasive species and the ecological harm they may cause. Of the many species distribution models, the MaxEnt is the most commonly used model to predict the habitat suitability and potential distribution areas for invasive alien species [4,15,16,17]. The model’s outcome provides us with more direct information about the likelihood and manner of invasion, which may help with early warning, monitoring, and proactive management strategies to prevent the spread of invasive species. We obtained G. parviflora distribution data across Tibet through a comprehensive field survey. We combined G. parviflora distribution data along with various natural environmental, bioclimatic (temperature and precipitation), edaphic (soil water content and pH), topographic (elevation, slope, and aspect), and anthropogenic factors in ArcGIS and MaxEnt niche models to determine the habitat suitability and potential invasion risk areas of G. parviflora in the Tibetan Region. The findings of the study provide useful ecological information for developing integrated prevention, control, and dynamic monitoring and management plans for G. parviflora invasion risks in Tibet.
2. Materials and Methods
2.1. Field Survey
We conducted a field survey using the actual sample line method to obtain actual G. parviflora distribution locations in Tibet. During the plant growing seasons from June 2022 to October 2023, we surveyed areas with high human activities, predominantly comprising urban areas and arteria highways covering most counties in seven regions of Tibet. We surveyed and recorded data from 60 G. parviflora occurrence points. The longitude and latitude were located using Google Earth (international common geographic coordinate system WGS84 (World Geodetic System 1984). The rotation minute-second was in the decimal format, and the longitude and latitude were recorded. Since the environmental and climatic data are comparable under the same grid, we kept only one distribution point of the species to avoid clustering. ENMTools.pl (https://github.com/danlwarren/ENMTools, accessed on 6 November 2023) was used to trim occurrence points so that only one observation was retained in each 30 s grid cell (corresponding to the environment variable) and mitigate the sampling bias [18]. In the end, 54 G. parviflora distribution points were used to develop models and obtain the distribution of G. parviflora in Tibet (Figure 1).
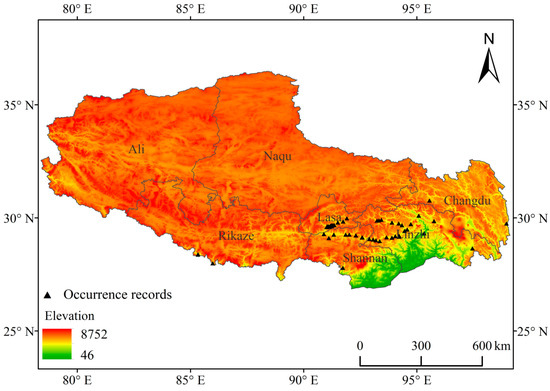
Figure 1.
Location map of the study area in Tibet showing G. parviflora occurrence points.
2.2. Collection of Climate and Environmental Variables
We acquired the climate data for 1970–2000 from the WorldClim database (https://www.worldclim.org/, accessed on 6 November 2023), containing 19 variables [19]. The latest WorldClim version 2.1 (https://worldclim.org/, accessed on 6 November 2023) was used to obtain climate data. We selected the average values of four Shared Socio-economic Pathways (SSPs) under the future BCC–CSM2–MR climate model to predict the changes in species habitat suitability from 2041 to 2060 and from 2081 to 2100 [20].
The SSPs included SSP126 (low greenhouse gas emission) and SSP585 (high greenhouse gas emission) scenarios, and the projected future periods included 2041–2060 and 2081–2100, representing the middle (2050) and end (2090) of this century, respectively. In addition, for environment variables, we also considered terrain, soils, and the Global Human Influence Index [21]. We downloaded the elevation data from the Geospatial Data Cloud (http://www.gscloud.cn/, accessed on 6 November 2023) and soil data obtained from the Harmonized World Soil Database (HWSD, https://www.fao.org/, accessed on 6 November 2023). The Human Impact Intensity Index (HII) was derived from the Human Footprint (HF, Human Footprint Score) provided in the Global Human Influence Intensity geographic dataset (Global Human Influence Index, HII) for the period 1995–2004, developed by the Columbia University International Center for Earth Science Information Networking Institutions (CIESIN) NASA Socioeconomic Data and Applications Center (SEDAC) platform released in December 2005 (https://sedac.ciesin.columbia.edu/data/set/wildareas-v2-human-influence-index-geographic/, accessed on 6 November 2023). We used the software ArcGIS version 10.4.1 (ESRI, Redlands, CA, USA, https://www.arcgis.com/, accessed on 6 November 2023) to obtain all the environment variables data, with a spatial resolution of 30 s (1 km × 1 km).
In order to avoid the risk of multicollinearity, spatial autocorrelation, and model overfitting arising from redundant data across environmental factors, a pair of strongly correlated variables was removed from the model [16]. We used ArcGIS to overlay the distribution points of G. parviflora with the environmental factors for the numerical sampling of each variable. We then performed Pearson correlation analysis between sampled data using SPSS statistical software (Version 20), and we retained the factors with correlation coefficient |r| < 0.8. We first conducted a preliminary simulation using all the environmental variables that can be included in the MaxEnt model [22]. For those variables with phase coefficient |R| > 0.8 between them, we included them in the MaxEnt model based on their contribution rate to the model and the replacement important value. To avoid overfitting, the variables with a larger contribution rate and replacement important value were incorporated into the model [23]. While soil is an important variable for the establishment of invasive plant species locally in their introduced range, the intensity of anthropogenic disturbances determines the extent of their spread regionally, because many invasive plants are introduced by humans for economic benefits [24]. Therefore, combining the results from previous studies [15,25] and the significance of local and regional scale climatic and anthropogenic variables on plant invasion, we selected a total of 12 variables, including six bioclimatic, two soil, and three topographic, as well as an index of the intensity of anthropogenic impacts to run ecological niche modeling and predict G. parviflora distribution. In order to keep the model operational and comparable, we kept soil and topographic variables and the index of intensity of anthropogenic impacts for both 2050 and 2090 time periods.
2.3. Parameters Optimization and Construction of the Model
We used the Kuenm package (https://github.com/marlonecobos/kuenm, accessed on 7 November 2023) in the R version 3.6.3 software (Vienna, Austria, https://www.r-project.org/, accessed on 7 November 2023) to optimize the regularization multiplier and feature class parameters [26], the two important parameters essential for building the species distribution model with the MaxEnt version 3.4.4 software (New York, NY, USA, https://biodiversityinformatics.amnh.org/open_source/maxent/, accessed on 7 November 2023). During the model development process, 75% of the data set was used as the training set, and 25% was used to validate the model. We generated 1160 candidate models, with parameters reflecting all combinations of 40 regularization multiplier settings (ranging from 0.1 to 4 and increment of 0.1), of which 29 feature class combinations were evaluated [21].
We employed a hierarchical approach to select the best-performing model, where priority was given to statistical significance (partial ROC), followed by predictive ability (low omission rates) and model complexity (i.e., Akaike Information Criterion, AICc values). During the sequential model selection steps, we first screened the candidate models for statistical significance and then reduced the set of models based on the omission rate criterion (<5% where possible). We selected the final models with the lowest delta AICc values (<2) from the subset of models that were statistically significant and had low omission rates. The model operation is set to 10 replicates. The relative contribution of each environmental variable to the model was evaluated using the Jackknife test [27,28].
2.4. Changes in Potential Risk Area and Characteristics of Centroid Shift under Climate Change
The ASCII results from the MaxEnt model were imported into ArcGIS10.4, and the reclassification tool was used to carry out spatial analysis and visualization mapping. In the final model, the suitability maps have values ranging from 0 to 1, indicating the probability (p) of occurrence of the G. parviflora. The number of counted rasters and the proportion of rasters were calculated to identify the changes in G. parviflora invasion risk areas and non-risk areas under the current conditions and the future (i.e., two greenhouse gas emission scenarios) time periods. The final model generated the habitat suitability maps of G. parviflora with values ranging from 0 to 1, indicating the probability (p) of the occurrence of G. parviflora. The MTSPS (Maximum Test Sensitivity Plus Specificity) threshold was used as the breakpoint for the model [29]. Based on the species distribution data and the fitting of suitable areas, the following criteria were used to classify habitat suitability according to the existence probability of G. parviflora MTSPS = 0.0372 [30]. Therefore, areas where the invasion risk of G. parviflora was high were represented by p > 0.0372, while p ≤ 0.0372 indicated non risk areas.
Taking the values from either side of the threshold value (i.e., 0.0372) representing risky vs. non-risky areas, we converted those values into binary data. Then, the ‘Universal Tools’ subdirectory ‘Distribution Changes Between Binary SDMs’ tool was selected in the ‘SDMTools’ module to calculate the potential expansion, stability, and contraction areas for G. parviflora under current and future climate change scenarios. The ‘Centroid Changes (Line)’ tool was used to calculate the displacement of the geometric center of the predicted distribution of G. parviflora in different time periods and to detect the overall trends in its invasion risk areas.
3. Results
3.1. Reliability Analysis of Models Established for G. parviflora
Based on the AICc, the best model setting for G. parviflora distribution was the feature classes (FC): Quadratic (Q), Threshold (T), and regularization multiplier (RM) equal to 0.8. ROC (Receiver Operating Characteristic) curve verification results showed that the average AUC value over 10 replicates was 0.985 (Figure 2), which is close to 1.0 and much higher than the random AUC value (0.5). Here, the specificity was defined using predicted area rather than true commission, indicating that the constructed model is reliable and can predict the distribution of G. parviflora in Tibet.
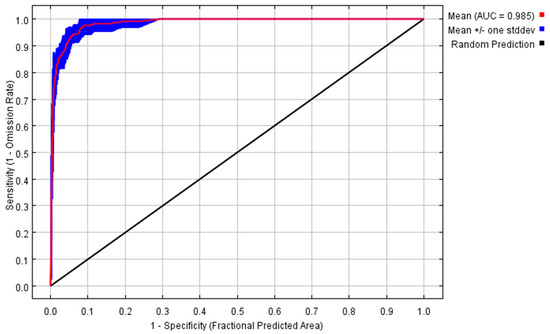
Figure 2.
Area under the Receiver Operating Characteristic (ROC) curve for the training data, averaged over the replicate runs. The specificity was based on the predicted area. The average training AUC for the replicate runs was 0.985.
3.2. Assessing Contributions of Environmental Factors on G. parviflora Distribution
Among the 12 environmental variables used in the modeling, bioclimatic variables had the highest contribution to the model prediction (Table 1), with mean annual temperature (Bio1) contributing the most (39.2%), followed by Precipitation of the Coldest Quarter (Bio19). The monthly minimum temperature in the coldest months (Bio6) had the lowest contribution (5.4%). Among the topographic factors, elevation (Elev) contributed the most (20%) to the model. Together, bioclimatic and topographic variables contributed 85.0% of model prediction, playing a decisive role in the potential invasion trends of G. parviflora in Tibet.

Table 1.
Relative contribution (%) of environmental variables to model prediction.
The environmental response curves of the four major environmental variables (bio1, elev, bio19, and bio11) (Figure 3) predicted the probability of occurrence of G. parviflora by greater than 0.5, suggesting that the selected data range of the variables encompassed the optimal environmental conditions for its growth and development. Therefore, G. parviflora likely performs the best in Tibet with an average annual temperature of 6.2–10.0 °C, elevation 2672–3744 m asl, and low precipitation during the coldest season. Our results showed that the probability of occurrence of G. parviflora reached the maximum at 6.8 °C and 2927 m asl. Since low precipitation during the coldest season increased the survival of G. parviflora, the species did not exist when the precipitation in the coldest season exceeded 155 mm. With respect to species occurrence during the coldest quarter, with temperatures ranging from −2 °C to 3 °C, the probability of occurrence reached the highest level at 0 °C.
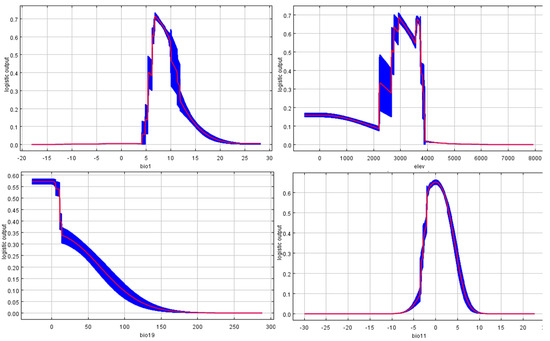
Figure 3.
Response curves of four major environmental variables (bio1, elev, bio19, and bio11). The red line is the mean value for the 10 MaxEnt runs, and the blue bar represents ± standard deviation.
3.3. Potential Risk Areas for G. parviflora Invasion under Current and Future Climate Change Scenarios
The field survey showed that the main occurrence sites for G. parviflora in Tibet include the Lhasa River Basin in Chengguan District, Dazi District, Dulong Deqing District, and Mozhugongka County in Lhasa. The species was also reported from the middle and lower basin of the Yarlung Zangbo River in Gonggar County, Zhanang County, Sangri County, NaiDong County, Gyaca County, Lang County, and Milin County. In addition, G. parviflora was reported from the Niyang River Basin in Bayi County and Kungbujianda County of Linzhi, representing the southeastern part of Tibet, and the Parlung Tsangpo Basin in Bomi County, Basu County, and Chayu County. In particular, G. parviflora was concentrated along the river basins and the main roads, Yarlung Zangbo River and tributaries of the Lhasa River, Niyang River, Palong Zangbo, Nujiang, Lancang River, Jinsha River, and other valleys along low elevation areas. Consistent with our field observation, the MaxEnt model under current climate conditions (1970–2000) also demonstrated that G. parviflora invasion risk areas in Tibet are mainly concentrated along the major rivers and their tributaries (Figure 4). However, with the predicted climate change and altered environmental variables in the future, G. parviflora may spread from the southeast to the northwest region of Tibet.
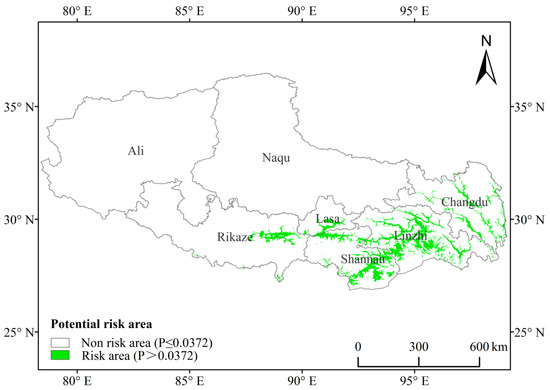
Figure 4.
Predicted potential invasion risk areas of G. parviflora in Tibet using MaxEnt model under the current climate (1970–2000).
Under the current climate (i.e., 1970–2000), the proportions of invasive risk and non-risk areas of G. parviflora in Tibet constituted 4.08% and 95.92%, respectively (Figure 4; Table 2). Under the lowest carbon emission scenario (SSP126), by 2050, the proportions of invasion risk and non-risk areas were 3.61% and 96.39%, respectively (Figure 5a; Table 2), with a decrease in the current risk areas. However, the proportions of areas at risk and non-risk of invasion by 2090 represented 5.09% and 94.91%, respectively (Figure 5b; Table 2).

Table 2.
Proportion of risk areas of G. parviflora invasion in Tibet.
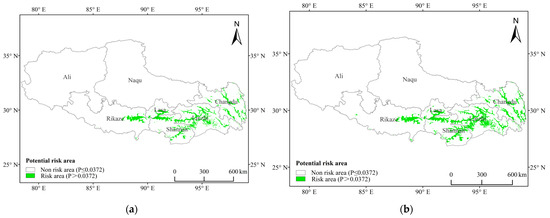
Figure 5.
Predicted potential risk areas of G. parviflora invasion in Tibet using MaxEnt model under the lowest carbon emission scenario (SSP126) by (a) 2050 and (b) 2090.
By 2050 and under the highest carbon emission scenario (SSP585), the proportions of invasion risk and non-risk areas were 6.21% and 93.79%, respectively (Figure 6a; Table 2). By 2090, the proportion of invasion risk areas increased significantly and reached 19.97% (Figure 6b; Table 2).
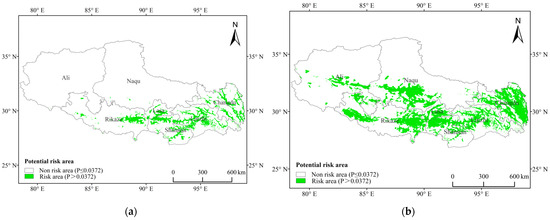
Figure 6.
Predicted potential risk areas of G. parviflora invasion in Tibet using the MaxEnt model under the highest carbon emission scenario (SSP585) in (a) 2050 and (b) 2090.
3.4. Spatial Transfer Characteristics of Risk Areas for G. parviflora
Under the SSP126 scenario, the model showed that G. parviflora invasion risk by 2050 mainly concentrated in the Lhasa and Rikaze regions, central Tibet, and Chamdo in the east (Figure 7a), covering a 2.21 × 10⁴ km2 area (Table 3). However, the species distribution may contract from the Shannan and Linzhi regions in the southeast (Figure 7a), with a contraction of 0.95 × 10⁴ km2 (Table 3). By 2090, the model estimated a small expansion (0.17 × 10⁴ km2, Table 3) of G. parviflora in the Shannan and Linzhi regions in the southeast and a small contraction (0.18 × 10⁴ km2, Table 3) in the Lhasa and Rikaze regions in central Tibet (Figure 7b). The centroid transfer trajectory of the risk area by 2050 moved to the Linzhi area, which is 26.59 km northwest from the current centroid but moved 10.06 km in the reverse direction in 2090 (Figure 8).
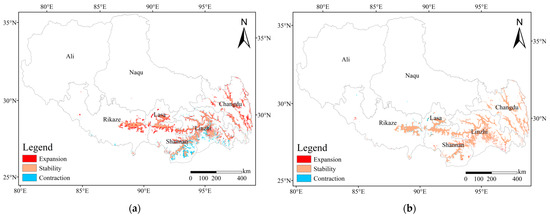
Figure 7.
Spatial transfer characteristics of G. parviflora under the SSP126 scenario for (a) current–2050 and (b) 2050–2090.

Table 3.
Changes in G. parviflora invasion risk areas from current to 2050 and 2050 to 2090 in Tibet under different climate change scenarios.
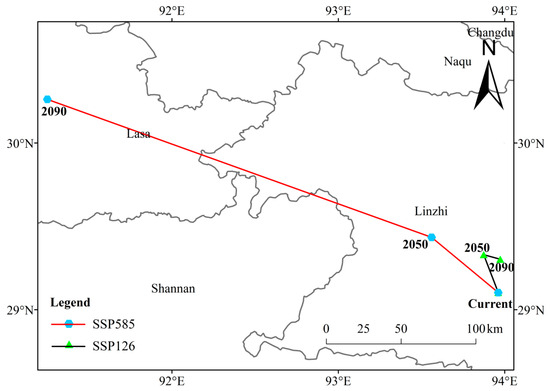
Figure 8.
The centroid relocation trajectory of G. parviflora risk area in Tibet under different climate change scenarios.
For the highest carbon emission scenario (SSP585), the trend of expansion of G. parviflora invasion risk area in Tibet was much more significant. By 2050, the expansion of the invasion risk area mainly concentrated in the Lhasa and Rikaze regions in central Tibet and Chamdo in the east (Figure 9a), covering 3.62 × 10⁴ km2 (Table 3). At the same time, the model showed that the species likely contracted from Shannan and Linzhi regions in the southeast (Figure 9a), with a 1.00 × 10⁴ km2 area (Table 3). By the end of the century (2090), G. parviflora is likely to expand across almost the entire Tibetan region, covering 17.59 × 10⁴ km2 (Table 3) and contracting (0.69 × 10⁴ km2, Table 3) from the southeastern Shannan and Linzhi regions (Figure 9b). By 2050, the model estimated a 53.46 km movement of the centroid transfer trajectory to the northwest from the present (from Linzhi to Lhasa) and will continue to move northwest by 2090, covering a distance of 240.83 km from 2050 (Figure 8).
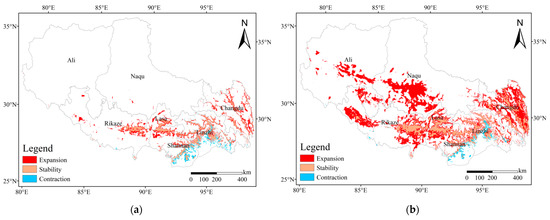
Figure 9.
Spatial transfer characteristics of G. parviflora under the SSP585 scenario in (a) current–2050 and (b) 2050–2090.
4. Discussion
The invasion of alien species is a long-term historical process in which the initial introduction, establishment, and spread of introduced species usually take decades or more [31]. The geographic distribution patterns of the species are closely related to their biological characteristics as well as various natural and anthropogenic factors [32]. Therefore, predicting the geographic distribution of invasive species using simulation models, such as MaxEnt, may not accurately predict the distribution patterns [15]. However, using real-world field data, representing species presence/absence and environmental variables, in the species distribution model likely helps accurately predict the species distribution, because known presence data can reflect the environmental and ecological niches of species of concern [15]. Species distribution models help establish the link between species and their ecological requirements while identifying key environmental variables for the presence of a species in a given geographic area [33].
Here, we conducted a field survey to record the presence/absence of invasive G. parviflora, derived 12 different bioclimatic and environmental variables, and used ecological modeling, MaxEnt, to predict the geographical distribution of the species under current and future climate change scenarios in Tibet. Our model prediction indicated that among the 12 bioclimatic and environmental variables selected, five variables, including mean annual temperature, elevation, precipitation of the coldest quarter, mean temperature of the coldest quarter, and coldest monthly minimum temperature, played a decisive role in determining the potential invasion trend of G. parviflora in Tibet. Particularly, mean annual temperature and elevation were the most important variables explaining the distribution and potential future expansion of G. parviflora in Tibet. Two variables together contributed 60% of the model prediction. Elevation may also explain the current lack of distribution of G. parviflora in the high elevation areas of Ali and Nagqu in Tibet. Generally, the climate of the Tibetan Plateau is cold and dry, with the mean annual temperature ranging from 6.9 °C in the southeast to −4.9 °C in the northwest and the annual precipitation ranging from 593 mm to 84 mm in the same river section [34]. These harsh climatic conditions may limit the proliferation of G. parviflora in some areas of the Tibetan plateau. Consistent with our findings, researchers also carried out modeling to predict the distribution pattern of G. parviflora in the Greater Caucasus Mountains of Mexico and found that temperature and topographic variables play an important role in its distribution [35]. However, these patterns may not exist over time because warming climates may shift the distribution patterns of animals and plants as they migrate towards higher elevations and latitudes [36]. Therefore, we must prioritize research on invasive plant species in the Tibetan Plateau ecosystem.
In general, areas with a high concentration of commercial activities, such as land border crossings for freight vehicles, seaports, and airports, are more likely to contribute to the spread of non-native species. However, their significance may sometimes become less important compared to the natural dispersal of these species [4]. Our field survey data suggest a relatively broad ecological niche for G. parviflora in the Tibet region, occurring in diverse habitats, such as roadsides, wasteland, river floodplains, forest edges, underneath the native forests, farmland, and close to residential areas. Notably, the human footprint was not important for the spread of G. parviflora in Tibet. This result also suggests that the extent of G. parviflora expansion in the Tibetan plateau, including at high elevation and under harsh environmental conditions, is likely caused by natural means, as the species possesses some of the important characteristics that make it a highly invasive and prolific spreader. For instance, G. parviflora seeds have crown hairs similar to dandelion, contributing to easy dispersal by wind and water. Similar characteristics have been observed in several other invasive species, indicating that natural dispersal may be key in driving the successful invasion of many wind-dispersed invasive species, including G. parviflora [4].
The model predictions (AUC = 0.985) determining habitat suitability for G. parviflora under the current climatic conditions are comparable with the actual field distributions, indicating the reliability of the predictions. Particularly, urban areas of Lhasa, Nyingchi, Shannan, and Chamdo have the highest risk of G. parviflora invasion. Under the SSP585 scenario, we observed a significant increase in G. parviflora invasion risk areas in Tibet. This suggests that the rate of spread of G. parviflora will be faster under the highest CO2 emission scenario. Nevertheless, the current distribution range of G. parviflora in Tibet is far from reaching its potential distribution range under future climate change. Therefore, in the future, G. parviflora expansion will occur on two fronts. First, G. parviflora will continue to spread and become dominant in its current distribution range. Second, it will spread to suitable but currently un-colonized areas, including further upstream of the Yarlung Tsangpo, Nujiang, Lancang, and Jinsha rivers, some river valleys, and low elevation areas in other parts of Tibet.
Invasive species represent one of the biggest threats to biodiversity conservation. Managing existing invasions and employing proactive detection and mitigation strategies for future invasions are important steps to reduce the negative impacts of invasive species [37]. However, some invasive species can be utilized economically, and excessive harvesting can diminish their spread. For G. parviflora, repeated mowing can effectively control its existing populations and further spread, as mowing reduces the growth of the aboveground parts and inhibits sexual reproduction [38]. G. parviflora has a high growth rate, producing a large biomass that can be used for economic purposes. The biomass of the species is considered an underutilized vegetable that offers both medicinal and dietary benefits [39]. Previous studies have shown that G. parviflora contains various aromatic compounds and has antibacterial, antifungal, antioxidant, and antidiabetic pharmacological properties with economic benefits [39,40]. In addition, G. parviflora also has a strong capability to bioaccumulate heavy metals [41,42], which presents a good prospect for the remediation of heavy-metal-contaminated soil. More importantly, G. parviflora is non-toxic and could be used as a food source [9].
As a prolific invader, G. parviflora has no noticeable maternal effect during most stages of the progeny lifecycle, and the growth rate, average height, and phenological phases of the two generations seem to be synchronized, with a strong chemosensory effect [39,43]. The species has a short reproduction cycle of less than 50 days and can produce an average of 65 million non-dormant seeds per hectare, with a high potential to form a seed bank in the soil [44]. Therefore, G. parviflora poses a significant ecological threat to native vegetation. Other scholars also studied the responsiveness and differential ecological impacts of exotic species on the Tibetan Plateau and argued that management actions against invasive plants should prioritize widely distributed species [45], such as G. parviflora. In addition, a previous study evaluating the distribution dynamics of 31 invasive plants from the family Asteraceae showed a dispersal pattern from the southeast to the northwest [24], comparable to G. parviflora’s current and potential future expansion direction in this study. Our study further demonstrates that G. parviflora has the ability to widely distribute in Tibet, including under native pine vegetation in some of the remote and alpine mountain forests [46]. These results highlight that G. parviflora can demonstrate phenotypic plasticity, adapt to various environmental conditions as suggested previously [45], and spread to the entirety of Tibet. Indeed, our model predictions under the high carbon emission scenario suggest the potential expansion of G. parviflora to the entirety of Tibet. Therefore, to better prevent and control the invasion of G. parviflora and to understand the growth and development patterns of the species at high elevations, it is necessary to study its targeted response mechanism. In summary, with future climate change, the potential invasion risk of G. parviflora in Tibet will likely shift and expand to the northwest. Moreover, since alpine ecosystems are not naturally immune to invasions, it is important to carry out early detection and preventive measures in advance to limit the negative impacts of invasions on alpine ecosystems [47].
5. Conclusions
Under the current climate scenarios, the potential invasion risk areas of G. parviflora are mainly distributed along the river valleys in the central, southeastern, and eastern regions of Tibet, with Lang, Gacha, Chengguan, Bomi, Gongga, and Bayi Counties and Naidong District as the center of radial spread. With future climate change, the invasion risk areas of G. parviflora will gradually expand from the southeast to the northwest region of Tibet. Along with expanding the distribution range, the distribution center also moves in the northwestern direction. The main environmental factors affecting the current and future distribution of G. parviflora in Tibet include mean annual temperature, elevation, precipitation of the coldest quarter, and coldest seasonal average temperature, with the optimal mean annual temperature range of 6.2–10.0 °C and elevation of 2672–3744 m asl. In addition, the species performs well under minimal precipitation during the coldest quarter but hardly exists when the precipitation exceeds 155 mm.
In summary, with global warming and increased greenhouse gas emissions, the invasion of G. parviflora in Tibet is expected to increase significantly. Over time, the potential risk areas of G. parviflora will expand, significantly increasing its diffusion area. In order to safeguard the ecology and biodiversity of the Tibetan Plateau and prevent the ecological threat posed by the large-scale invasion of G. parviflora, it is necessary to adopt a comprehensive approach of preventive and control measures along with the dynamic monitoring of its invasion and proliferation trends. This will help to construct an ecological security barrier for the Tibetan Plateau and ensure its long-term conservation. Finally, our results provide optimum suitable ranges of important environmental factors affecting the distribution of G. parviflora, which has important implications for managing and dynamically monitoring invasive G. parviflora in Tibet.
Author Contributions
Conceptualization, J.W; methodology, J.W.; software, J.W., Z.Z. and Q.L.; formal analysis, Z.Z.; investigation, J.W., Z.Z. and Y.C.; writing—original draft preparation, J.W.; writing—review and editing, Q.L.; visualization, J.W. All authors have read and agreed to the published version of the manuscript.
Funding
This research was funded by Tibet Autonomous Region Natural Science Foundation Project (ZRKX2024000019) and the Tibet Autonomous Region Science and Technology Plan Project (XZ202303ZY0002G).
Institutional Review Board Statement
Not applicable.
Informed Consent Statement
Not applicable.
Data Availability Statement
All links to input data are reported in the manuscript and all output data are available upon request to the authors.
Conflicts of Interest
The authors declare no conflicts of interest.
References
- Wang, R.; Huang, H.K.; Zhang, H.B.; Zhang, Y.P.; Xue, L.; Chen, B.X.; Yang, N.W.; Guo, J.Y.; Liu, W.X.; Wan, F.H. Analysis of gaps in regulations and management mechanisms for the prevention and control of invasive alien species in China. Plant Prot. 2022, 48, 2–9. [Google Scholar]
- Wei, F.W.; Nie, Y.G.; Miao, H.X.; Lu, H.; Hu, Y.B. Advancements of the researches on biodiversity loss mechanisms. Chin. Sci. Bull. 2014, 59, 430–437. [Google Scholar] [CrossRef]
- Hulme, P.E. Trade, transport and trouble: Managing invasive species pathways in an era of globalization. J. Appl. Ecol. 2009, 46, 10–18. [Google Scholar] [CrossRef]
- Pintilioaie, A.M.; Sfîcă, L.; Baltag, E.S. Climatic Niche of an Invasive Mantid Species in Europe: Predicted New Areas for Species Expansion. Sustainability 2023, 15, 10295. [Google Scholar] [CrossRef]
- Ren, J.L.; Chen, J.S.; Xu, C.L.; Koppel, J.V.D.; Thomsen, M.S.; Qiu, S.Y.; Cheng, F.Y.; Song, W.J.; Liu, Q.X.; Xu, C.; et al. An invasive species erodes the performance of coastal wetland protected areas. Sci. Adv. 2021, 7, eabi8943. [Google Scholar] [CrossRef] [PubMed]
- Zhang, P.; Li, B.; Wu, J.H.; Hu, S.J. Invasive plants differentially affect soil biota through litter and rhizosphere pathways: A meta-analysis. Ecol. Lett. 2019, 22, 200–210. [Google Scholar] [CrossRef] [PubMed]
- Warwick, S.I.; Sweet, R.D. The biology of Canadian weeds.:58. Galinsoga parviflora and G. quadriradiata (=G. ciliata). Can. J. Plant Sci. 1983, 63, 695–709. [Google Scholar] [CrossRef]
- Liu, H.Y.; Yang, R.; Jiang, Y.Y.; Liu, Q.R. Taxonomy and distribution of invasive Galinsoga Ruiz & Pavón in China. J. Beijing Norm. Univ. 2022, 58, 216–222. [Google Scholar]
- Iany, J.A.; Sweet, R.D. Germination, growth, development, and control of Galinsoga. Weed Sci. 1973, 21, 41–45. [Google Scholar] [CrossRef]
- Damalas, C.A. Distribution, biology, and agricultural importance of Galinsoga parviflora (Asteraceae). Weed Biol. Manag. 2008, 8, 147–153. [Google Scholar] [CrossRef]
- Adhikari, D.; Barik, S.; Upadhaya, K. Habitat distribution modelling for reintroduction of Ilex khasiana Purk., a critically endangered tree species of northeastern India. Ecol. Eng. 2012, 40, 37–43. [Google Scholar] [CrossRef]
- Barnosky, A.D.; Matzke, N.; Tomiya, S.; Wogan, G.O.; Swartz, B.; Quental, T.B.; Marshall, C.; McGuire, J.L.; Lindsey, E.L.; Maguire, K.C. Has the Earth’s sixth mass extinction already arrived? Nature 2011, 471, 51–57. [Google Scholar] [CrossRef] [PubMed]
- Çoban, H.O.; Örücü, Ö.K.; Arslan, E.S. MaxEnt Modeling for Predicting the Current and Future Potential Geographical Distribution of Quercus libani Olivier. Sustainability 2020, 12, 2671. [Google Scholar] [CrossRef]
- Gaston, K.J. Species richness: Measure and measurement. In Biodibersity: A Biology of Numbers and Difference; Blackwell Science: Hoboken, NJ, USA, 1996; pp. 77–113. [Google Scholar]
- Wang, J.W.; Chen, Y.H.; Xu, M.; Chen, J.F.; La, Q. Prediction of potential risk area of the invasive plant Datura stramonium L. in Tibet under the background of climate change. Acta Ecol. Sin. 2023, 43, 8620–8630. [Google Scholar]
- Liu, D.; Xie, C.; Jim, C.Y.; Liu, Y.; Hou, S. Predicting the Potential Distribution of the Alien Invasive Alligator Gar Atractosteus spatula in China. Sustainability 2023, 15, 6419. [Google Scholar] [CrossRef]
- Sorbe, F.; Gränzig, T.; Förster, M. Evaluating sampling bias correction methods for invasive species distribution modeling in Maxent. Ecol. Inform. 2023, 76, 102–124. [Google Scholar] [CrossRef]
- Warren, D.L.; Seifert, S.N. Ecological niche modeling in Maxent: The importance of model complexity and the performance of model selection criteria. Ecol. Appl. 2011, 21, 335–342. [Google Scholar] [CrossRef] [PubMed]
- Wu, T.W.; Lu, Y.X.; Fang, Y.J.; Xin, X.G.; Li, L.; Li, W.P.; Jie, W.H.; Zhang, J.; Liu, Y.M.; Zhang, L.; et al. The Beijing climate center climate system model (BCC-CSM): The main progress from CMIP5 to CMIP6. Geosci. Model Dev. 2019, 12, 1573–1600. [Google Scholar] [CrossRef]
- Fick, S.E.; Hijmans, R.J. WorldClim 2: New 1-km spatial resolution climate surfaces for global land areas. Int. J. Climatol. 2017, 37, 4302–4315. [Google Scholar] [CrossRef]
- Zhang, K.L.; Yao, L.J.; Meng, J.S.; Tao, J. Maxent modeling for predicting the potential geographical distribution of two peony species under climate change. Sci. Total Environ. 2018, 634, 1326–1334. [Google Scholar] [CrossRef]
- Li, D.X.; Li, Z.X.; Liu, Z.W.; Yang, Y.J.; Khoso, A.G.; Wang, L.; Liu, D. Climate change simulations revealed potentially drastic shifts in insect community structure and crop yields in China’s farmland. J. Pest Sci. 2023, 96, 55–69. [Google Scholar] [CrossRef]
- Simberloff, D.; Martin, J.L.; Genovesi, P.; Maris, V.; Wardle, D.A.; Aronson, J.; Courchamp, F.; Galil, B.; García-Berthou, E.; Pascal, M.; et al. Impacts of biological invasions: What’s what and the way forward. Trends Ecol. Evol. 2013, 28, 58–66. [Google Scholar] [CrossRef]
- Yang, W.J.; Sun, S.X.; Wang, N.X.; Fan, P.X.; You, C.; Wang, R.Q.; Zheng, P.M.; Wang, H. Dynamics of the distribution of invasive alien plants (Asteraceae) in China under climate change. Sci. Total Environ. 2023, 903, 166260. [Google Scholar] [CrossRef] [PubMed]
- Phillips, S.J.; Anderson, R.P.; Schapire, R.E. Maximum entropy modeling of species geographic distributions. Ecol. Model. 2006, 190, 231–259. [Google Scholar] [CrossRef]
- Zhang, Q.C.; Wang, J.G.; Lei, Y.H. Predicting Distribution of the Asian Longhorned Beetle, Anoplophora glabripennis (Coleoptera: Cerambycidae) and Its Natural Enemies in China. Insects 2022, 13, 687. [Google Scholar] [CrossRef] [PubMed]
- Phillips, S.J.; Anderson, R.P.; Dudik, M.; Schapire, R.E.; Blair, M.E. Opening the black box: An open-source release of Maxent. Ecography 2017, 40, 887–893. [Google Scholar] [CrossRef]
- Cobos, M.E.; Peterson, A.T.; Barve, N.; Osorio-Olvera, L. kuenm: An R package for detailed development of ecological niche models using Maxent. PeerJ 2019, 7, e6281. [Google Scholar] [CrossRef]
- Aidoo, O.F.; Souza, P.G.C.; da Silva, R.S.; Santana, J.P.A.; Picanço, M.C.; Kyerematen, R.; Sètamou, M.; Ekesi, S.; Borgemeister, C. Climate-induced range shifts of invasive species (Diaphorina citri Kuwayama). Pest Manag. Sci. 2022, 78, 2534–2549. [Google Scholar] [CrossRef]
- Lemke, P.; Ren, J.F.; Alley, R.B.; Allison, I.; Carrasco, J.F.; Flato, G.; Fujii, Y.; Kaser, G.; Mote, P.; Thomas, R.H. IPCC: Contribution of Working Groups I, II, III to the Fourth Assessment Report of the Intergovernmental Panel on Climate Change; Cambridge University Press: Cambridge, UK; New York, NY, USA, 2007. [Google Scholar]
- Lambrinos, J.G. The expansion history of a sexual and asexual species of Cortaderia in California, USA. J. Ecol. 2001, 89, 88–98. [Google Scholar] [CrossRef]
- Xing, D.L.; Zhang, J.; He, F.L. Comment on “Interspecific competition limits bird species’ ranges in tropical mountains”. Science 2023, 369, eade2109. [Google Scholar] [CrossRef]
- Khwarahm, N.R. Predicting the Spatial Distribution of Hyalomma ssp., Vector Ticks of Crimean–Congo Haemorrhagic Fever in Iraq. Sustainability 2023, 15, 13669. [Google Scholar] [CrossRef]
- Ding, J.; Li, F.; Yang, G.B.; Chen, L.Y.; Zhang, B.B.; Liu, L.; Fang, K.; Qin, S.Q.; Chen, Y.L.; Peng, Y.F.; et al. The permafrost carbon inventory on the Tibetan Plateau: A new evaluation using deep sediment cores. Glob. Chang. Biol. 2016, 22, 2688–2701. [Google Scholar] [CrossRef]
- Pshegusov, R.H.; Chadaeva, V.A. Ecological Niche Modeling of Galinsoga Ruiz et Pav. Species in the Native and Caucasian Part of the Invasive Ranges. Russ. J. Biol. Invasions 2022, 13, 245–258. [Google Scholar] [CrossRef]
- Parmesan, C.; Yohe, G. A globally coherent fingerprint of climate change impacts across natural systems. Nature 2003, 421, 37–42. [Google Scholar] [CrossRef] [PubMed]
- Brundu, G.; Richardson, D.M. Planted forests and invasive alien trees in Europe: A code for managing existing and future plantings to mitigate the risk of negative impacts from invasions. NeoBiota 2016, 30, 5–47. [Google Scholar] [CrossRef]
- Chu, L.S.; Li, H.Y.; Yang, Y.F.; Guo, J. Effects of mowing on growth and reproductive characteristics of invasive plant Galinsoga parviflora. J. Plant Resour. Environ. 2022, 31, 34–42. [Google Scholar]
- Ripanda, A.; Luanda, A.; Sule, K.S.; Mtabazi, G.S.; Makangara, J.J. Galinsoga parviflora (Cav.): A comprehensive review on ethnomedicinal, phytochemical and pharmacological studies. Heliyon 2023, 9, e13517. [Google Scholar] [CrossRef]
- Afza, N.; Yasmeen, S.; Ferheen, S.; Malik, A.; Ali, M.I.; Kalhoro, M.A.; Ifzal, R. New aromatic esters from Galinsoga parviflora. J. Asian Nat. Prod. Res. 2012, 14, 424–428. [Google Scholar] [CrossRef]
- Yang, K.B. Chinese farmland soil heavy metal pollution and its phytoremediation. World Agricult. 2007, 340, 58–61. [Google Scholar]
- Wang, Y.; Wang, X.; Deng, Q.X.; Mao, M.J.; Xia, H.; Wang, J.; Lv, X.L.; Wang, Y.Q.; Zhang, H.F.; Zhang, X.A.; et al. Living plants and straws of four hyperaccumulator plants increase the cadmium uptake of Ziziphus acidojujuba seedlings. Int. J. Environ. Anal. Chem. 2023, 103, 1804–1816. [Google Scholar] [CrossRef]
- Kucewicz, M.; Gojło, E. Influence of achene heteromorphism on life-cycle traits in the annual weed gallant soldier (Galinsoga parviflora Cav.). Flora-Morphol. Distrib. Funct. Ecol. Plants 2014, 209, 649–654. [Google Scholar] [CrossRef]
- Lorenzi, H.; Souza, H.M. Ornamental Plants of Brazil: Shrubs, Herbs and Vines, 3rd ed.; Plantarum: Nova Odessa, Brazil, 2014; p. 558. [Google Scholar]
- Guan, S.P.; Chen, P.D.; Qu, X.L.; Wang, X.L.; Wang, S.P.; Li, H.Y.; Fang, J.P.; Wang, Y.; Chen, J.R.; Huang, W.; et al. Invasiveness and impact of invasive species on the Tibetan Plateau are inconsistent. J. Plant Ecol. 2023, 16, rtad039. [Google Scholar] [CrossRef]
- Areington, C.A.; Neto, M.C.L.; Watt, P.M. Assessing the utility of selected photosynthetic and related traits in screening Amaranthus dubius Mart. ex Thell. and Galinsoga parviflora Cav. 1796 seedlings for elevated temperature stress tolerance. S. Afr. J. Bot. 2022, 145, 444–457. [Google Scholar] [CrossRef]
- Alexander, J.M.; Lembrechts, J.J.; Cavieres, L.A.; Daehler, C.; Haider, S.; Kueffer, C.; Liu, G.; McDougall, K.; Milbau, A.; Pauchard, A.; et al. Plant invasions into mountains and alpine ecosystems: Current status and future challenges. Alp. Bot. 2016, 126, 89–103. [Google Scholar] [CrossRef]
Disclaimer/Publisher’s Note: The statements, opinions and data contained in all publications are solely those of the individual author(s) and contributor(s) and not of MDPI and/or the editor(s). MDPI and/or the editor(s) disclaim responsibility for any injury to people or property resulting from any ideas, methods, instructions or products referred to in the content. |
© 2024 by the authors. Licensee MDPI, Basel, Switzerland. This article is an open access article distributed under the terms and conditions of the Creative Commons Attribution (CC BY) license (https://creativecommons.org/licenses/by/4.0/).