Article

Exploring and Predicting Landscape Changes and Their Driving Forces within the Mulan River Basin in China from the Perspective of Production–Living–Ecological Space

1
State Key Laboratory for Subtropical Mountain Ecology, Ministry of Science and Technology and Fujian Province, Fujian Normal University, Fuzhou 350007, China
2
College of Geographical Science, College of Carbon Neutral Future Technology, Fujian Normal University, Fuzhou 350007, China
3
Postdoctoral Research Station of Ecology, Fujian Normal University, Fuzhou 350007, China
4
School of Culture, Tourism and Public Administration, Fujian Normal University, Fuzhou 350117, China
*
Authors to whom correspondence should be addressed.
Sustainability 2024, 16(11), 4708; https://doi.org/10.3390/su16114708
Submission received: 29 March 2024 / Revised: 9 May 2024 / Accepted: 20 May 2024 / Published: 31 May 2024

Abstract

:
With rapid economic development and urban expansion, China faces a serious imbalance between production, living, and ecological land use, in which the erosion of water ecological space by urban expansion is especially notable. In order to alleviate or solve this imbalance, this study constructs the water ecological space in the Mulan River Basin based on national land spatial planning using remote sensing statistics and the 2000–2020 statistical yearbooks for the Mulan River Basin. A landscape index is applied to explore this landscape in terms of its production–living–ecological space (PLES) patterns and evolutionary characteristics. Factors affecting the drivers of PLES changes are analyzed through Geo-Detector, and predictions are made using the cellular automata Markov (CA-Markov) model. It was found that (1) PLES distribution patterns in the Mulan River Basin from 2000 to 2020 are dominated by non-watershed ecological spaces, with a significant expansion of living space. Its ecological space is shrinking, and there is significant spatial variation between its near-river and fringe areas. (2) Of the PLES conversions, the most dramatic conversions are those of production space and living space, with 81.14 km2 of production space being transferred into living space. Non-water ecological space and water ecological space are also mainly transferred into production space. (3) As shown by the results of the landscape index calculation, non-water ecological space in the Mulan River Basin is the dominant landscape, the values of the Shannon diversity index (SHDI) and Shannon homogeneity index (SHEI) are small, the overall level of landscape diversity is low, the aggregation index (AI) is high, and the degree of aggregation is obvious. (4) The progressive PLES changes in the Mulan River Basin are influenced by a combination of natural geographic and socioeconomic factors, with the mean population density and mean elevation being the most important factors affecting PLES changes among social and natural factors, respectively. (5) The Kappa coefficient of the CA-Markov model simulation is 0.8187, showing a good simulation accuracy, and it is predicted that the area of water ecological space in the Mulan River Basin will increase by 3.66 km2 by 2030, the area of production space and non-water ecological space will further decrease, and the area of construction land will increase by 260.67 km2. Overall, the aquatic ecological space in the Mulan River Basin has made progress in terms of landscape ecological protection, though it still faces serious erosion. Therefore, attaching importance to the restoration of the water ecological space in the Mulan River Basin, integrating multiple elements of mountains, water, forests, fields, and lakes, optimizing the spatial structure of its PLES dynamics, and formulating a reasonable spatial planning policy are effective means of guaranteeing its ecological and economic sustainable development. This study offers recommendations for and scientific defenses of the logical design of PLES spatial functions in the Mulan River Basin.

1. Introduction

A landscape pattern is created by arranging diverse pieces in different spatial places that vary in size and shape [1]. Changes in landscape patterns can reflect changes in natural resource use patterns due to human activities and hidden ecological insecurities [2], and a region’s sustainable development can be aided by the application of landscape metrics, which measure variations in the layout and composition of land characteristics [3]. Production–living–ecological space stands for production space, living space, and ecological space. Production space is the land used to obtain products for purposes such as agriculture, industry, and commerce; living space refers to the land used for human life and residential functions; and ecological space is the land used for regulating, maintaining, and guaranteeing ecological security [4]. Cities are growing larger all over the world as part of a global social and economic phenomenon [3,5]. The patterns of landscapes have changed in recent years due to the speed of urbanization as well as industrialization. This has resulted in a few social and environmental issues, including the destruction of forests, the waste of land resources, spatial imbalances, and more. In developing nations, these imbalances between urban, agricultural, and ecological spaces are especially noticeable [6,7,8], and determining how to mitigate the adverse impacts brought by spatial imbalances has become a hot topic of increasing concern globally. Therefore, exploring landscape pattern variations and their drivers from a PLES perspective can alleviate regional spatial imbalances and optimize regional spatial layouts, which, in the context of rapidly urbanizing regions, are essential for regional conservation, management, and equitable development [8,9,10].
Researchers from both domestic and international universities have studied the evolution of landscape designs and the variables that propel urbanization [11,12,13], mainly focusing on two aspects: the static analysis of landscape pattern distributions on a spatial scale and the dynamic analysis of landscape pattern changes on a temporal scale [14,15]. Foreign scholars’ research on landscape pattern analysis is mostly about the analysis of changes within selected regions [13], dynamic changes in long time series, landscape transfer matrices, etc. [14]. Taken together, relevant studies in the literature in China and in the global literature have made some progress in the study of landscape patterns, but their conclusions differ for different regions and different time scales. Furthermore, China’s coordinated land development pattern now encompasses both production and ecological space, replacing the previous production-space-oriented design [16]. Constructing a PLES planning system with the goal of “intensive and efficient production space, livable and moderate living space, and clear and beautiful mountains and rivers in ecological space” is an important initiative for China to realize sustainable development. When studying the multifunctional utilization of land and the function of urban space, PLES dynamics should be taken into account in spatial management planning [17]. Previous studies have focused on the theoretical framework, spatial classification, evaluation optimization, and landscape functional processes of PLES planning [18,19,20]. As water ecological space research is currently for specific management purposes, research on the classification system and evolution of production–living–ecological space has not yet been updated, resulting in a certain limitation on the operationalization of analyses on the evolutionary convergence and drivers of water ecological space changes based on the PLES model, and fewer studies have been conducted.
Rapid urban development and expansion have caused ecological space to shrink and landscape fragmentation to increase [21,22,23]. Spatial conflicts between living space and ecological and productive space, especially water ecological space, are becoming increasingly prominent. As conflicts within the PLES model intensify, the imbalance in the relationship between these spaces will lead to an imbalance in the landscape pattern of watersheds. Research on water ecological space has steadily become more and more popular as ecological civilization construction continues to progress and dispersed land management functions are consolidated [24,25]. The water ecological space classification system was constructed based on PLES. However, the link between landscape patterns and landscape processes was neglected, and quantitative studies were lacking at the same time. To further refine the connection between PLES and the study area, a landscape index was introduced, a quantitative study index meant to explain the patterns in the landscape, and how they change, and show how the patterns are related to the processes in the environment [26]. The use of landscape indices not only allows quantitative features to be analyzed in terms of the evolution of the landscape pattern of the PLES in a watershed, but also indicates the features of watersheds’ geographic distribution of water ecology in order to support watersheds’ sustainable development, which helps to further clarification of water ecosystem spatial resource objects and national spatial planning subjects [24] and prevent ecological degradation in watersheds. Therefore, in this context, quantitatively analyzing the evolutionary trend of PLES and its relationship with drivers is an essential step toward protecting the landscape ecology, especially water ecology, of watersheds.
Previous studies have found that PLES landscape evolution is related to social and natural factors [27,28,29], and the degree of landscape evolution in the watershed is influenced by human activities. In impact factor studies, the conventional model of global linear correlation, known as ordinary least squares (OLS) regression, uses “global correlation” to gauge the drivers affecting the coupled and coordinated relationships of PLES [30]. It can only estimate “average” or “global” parameters, without considering the spatiotemporal characteristics of the variables [4]. The main research focus of foreign researchers on this topic is how the landscape pattern has evolved throughout time to represent the forces that have shaped the terrain, but for the cause of the evolution of the landscape driving factors, driving force is also primarily used in the quantitative analysis of a single factor [31,32]. Geo-Detector detects the drivers of the dependent variable through differences in the spatial representation treatment of the dependent variable and detects the relationship between the drivers and geographic phenomena without making any assumptions of linearity, and it is receiving growing recognition in the literature as a method of spatial analysis [33,34]. In addition, in recent years, Geo-Detector has been used to investigate the spatial variability in the connection between the evolution of landscape patterns and their drivers [30,35]. Therefore, this study captures the relationship between PLES evolution, especially water ecological space, and drivers through Geo-Detector. Scholars at home and abroad conduct research and exploration to analyze the evolution of landscape patterns based on land use cover change (LUCC) and predict the future trend of landscape pattern changes [36]. Currently, the commonly used prediction models include the Gray prediction model, the CLUS-S model [37], the SLEUTH model [38], the FLUS model [19], and the CA-Markov model [39]. Among them, the CA-Markov model couples the respective advantages of the CA model and the Markov model, which can effectively reduce simulation errors when landscape types are transformed into each other and better predict the spatial and temporal evolution of complex nonlinear landscape patterns. Therefore, this study uses the CA-Markov model to predict the landscape pattern of the Mulan River Basin in 2030.
As one of the six crucial watersheds in Fujian Province, the Mulan River Basin is an essential point of origin of General Secretary Xi Jinping’s ideas on water ecological civilization. During his work in Fujian, General Secretary Xi Jinping commanded and promoted the governance of the Mulan River Basin watershed. The Mulan River Basin became the first river in the country to be systematically governed on a basin-wide basis. The “Mulan River Basin Sample” of ecological governance was formed through the concept of innovative systematic governance. Through the management of the Mulan River Basin, the face of the “river of floods” has been changed, becoming a “safe river” and “ecological river” and benefiting the people. Several studies have shown that [40], in the context of accelerated urbanization, the Mulan River Basin is also facing problems of ecological degradation and water quality pollution because of urbanization and population increase, especially the reduction in water ecology due to PLES imbalance caused by human activities. However, existing research results seldom quantitatively explore the PLES evolutionary driving mechanisms from the water ecological space. Currently, less attention is given to the evolution of the landscape pattern in the Mulan River Basin, so the spatial imbalance can be effectively addressed by quantitatively analyzing the process of PLES changes in the Mulan River Basin and analyzing the factors that drive its evolution [4].
The following objectives are the focus of this study: (1) to explore the overall distribution of PLES in the Mulan River Basin in the last 20 years; (2) to investigate PLES’s temporal and spatial dynamics within the Mulan River Basin; (3) to investigate the socioeconomic and natural climate variables influencing the shift in PLES in the Mulan River Basin, especially the impact on the water ecological space. To further explore the geospatial evolution of the Mulan River Basin, this study establishes a landscape dataset, analyzes the trend of PLES evolution in the Mulan River Basin by methods such as standard ellipse difference and landscape indices, and analyzes the driving mechanisms, especially the characteristics of the water ecological spatial evolution and the driving factors affecting its changes, employing Geo-Detector. By studying the PLES evolution and driving mechanisms in the Mulan River Basin, we will explore the ecological status and development trend under the national spatial planning of river and lake basins. The Mulan River Basin’s ecological preservation, PLES management, and balance can all be supported scientifically by the findings of this study, better promoting the conservation and recovery of the basin’s aquatic ecology and providing valuable cases for the management of aquatic ecology and spatial planning in river and lake basins.

2. Materials and Methods

2.1. Study Area and Data Source

2.1.1. Study Area

The Mulan River Basin (118°38′~119°6′ E, 25°22′~25°25′ N) is in the eastern part of Fujian Province, with a basin area of about 1732 km2 and a forest coverage of 60%. The Mulan River runs through Putian City, flowing alone into the sea, and is known as the “mother river” of Putian City, with a total length of 105 km. (Figure 1).
The basin is characterized by mountains and hills, with an average annual temperature of 20.0 °C and an average annual rainfall of about 1100–1900 mm, with a subtropical monsoon climate. The Mulan River Basin, as a national ecological model, is the origin of General Secretary Xi Jinping’s idea of water ecological civilization, and, in terms of ecological development, Mulan River was included in the first batch of demonstration rivers and lakes by the Ministry of Water Resources; in 2020, the Mulan River Basin Comprehensive Management Model was selected in the National Ecological Civilization Pilot Area Reform Initiatives and Experiences and Practices Promotion List. In terms of economy, in 2022, Putian’s gross regional product was CNY 311,626 billion, GDP per capita in the upper and middle reaches of the watershed was CNY 50,800, and GDP per capita in the middle and lower reaches of the watershed was CNY 112,100. It is worth noting that the economic development of the basin is rapid, with GDP increasing from CNY 18.386 billion in 2000 to CNY 311.626 billion in 2020. However, given the impact of rapid economic growth on the natural world, the question arises as to how to achieve a balance between the promotion of economic growth and the protection of natural areas in the context of rapid urbanization.

2.1.2. Data Source

This study used land use data of Mulan River in 2000, 2010, and 2020, digital elevation model (DEM) data (with a resolution of 30 m) from the Data Centre for Resource and Environmental Sciences of the Chinese Academy of Sciences (http://www.resdc.cn, accessed on 27 January 2023), and digital elevation model (DEM) data from the China Spatial Data Cloud (https://www.gscloud.cn/, accessed on 27 January 2023). The socioeconomic, population, temperature, and precipitation data needed for the driving mechanism study were acquired from the China Meteorological Network (http://data.cma.cn/, accessed on 27 January 2023) and Fujian Statistical Yearbook, Putian City Statistical Yearbook, and Statistical Bulletin. The vector data of the Mulan River Basin boundary was acquired from the Putian Mulan River Basin Management Office. Table 1 lists more descriptive details of the data resources.

2.2. Research Methods

2.2.1. Building a Spatial Classification System for Water Ecology Based on Territorial Spatial Planning

Water is the carrier of material exchange, energy transfer, and information exchange of watershed units and is an important bridge connecting multiple sub-ecosystems or landscape units, and its ecological significance is self-evident. As a limiting element of ecological space, water ecological space has a vital position in constructing watershed ecological civilization. To measure the spatial evolution of water ecology in the river basin and serve as a foundation for water resource management, a spatial classification system for water ecology should be established, for water ecology protection and spatial zoning of river and lake waters in the basin.
To realize the functional objectives of water ecological space, a water ecological space classification system was established based on PLES, i.e., production space, living space, and ecological space, in territorial spatial planning [41,42]. This classification method can achieve the functional integrity of water ecological space, involving water bodies, beach shoals, and other land classes in the watershed [41], which is conducive to the protection and development of water ecological space. The spatial classification system of water ecological space in the Mulan River Basin constructed (Figure 2 and Table 2) based on PLES has the following characteristics: Water ecological space is subordinate to ecological space, with clear boundaries and separate spatial functions. As a result, the Mulan River Basin’s space is separated into four primary categories: dwelling space, production space, non-water ecological space, and water ecological space. Among them, the water ecological space, as an essential subcategory of ecological space, constitutes the whole ecological space with the non-water ecological space [24]. The water ecological space contains three types—water bodies, mudflats, and mudflats, of which the water bodies are mainly the main streams of the Mulan River, and the mudflats and mudflats are mainly the mudflat wetlands at the mouth of the Mulan River into the sea. The Mulan River Basin includes ditches and canals, which are subordinate to water resources in the identification of land classes but mainly function as agricultural products in the spatial functional use, so they are categorized as production space in this study.

2.2.2. Space Analysis Method

Standard Alleviation Ellipse

The standard alleviation ellipse (SDE) is widely used in the discipline to measure the characteristics of the spatial statistical distribution of geographic elements [43]. This research used the SDE method and center of gravity approach to analyze the spreading range, center of gravity, degree of aggregation, and azimuth changes of PLES in the Mulan River Basin in each time section. The center of gravity, the long and short axes, and the azimuth angle of the spatial distribution ellipse are the fundamental characteristics of the SDE method. Variations in the SDE’s area show how the elements tend to contract and expand in space [44], the azimuth reflects the primary trend direction of the spatial distribution of elements, the short axis reflects the degree of dispersion of the elements in both the primary trend direction and the secondary direction, and the center of gravity migration orientation is used to characterize the overall spatial development of geographic elements in the direction of change.
The SDE analysis is calculated in ArcGIS 10.8 using the following formulas:
(1) Center of gravity
X ¯ = i = 1 n ω i x i i = 1 n ω i , Y ¯ = i = 1 n ω i y i i = 1 n ω i
(2) Azimuth
t a n = i = 1 n ω i 2 x ¯ i 2 i = 1 n ω i 2 y ¯ i 2 + i = 1 n ω i 2 x ¯ i 2 i = 1 n ω i 2 y ¯ i 2 2 + 4 i = 1 n ω i 2 x ¯ i y ¯ i 2 i = 1 n ω i 2 x ¯ i y ¯ i
(3) Standard deviation of long and short axes
δ x = i = 1 n ω i x ¯ i cos θ ω i y ¯ i sin θ 2 i = 1 n ω 2
δ y = i = 1 n ω i x ¯ i sin θ ω i y ¯ i cos θ 2 i = 1 n ω 2
where X ¯ ,   Y ¯ are the PLES-weighted mean center of gravity coordinates of the Mulan River Basin; n denotes the number of land class patches; xi, yi represent the latitude and longitude of each space; δx, δy are the standard deviation along the x-axis and y-axis, respectively; ω i is the weight; θ is the elliptical azimuthal angle, which denotes the angle between the ellipse’s positive north side and the long axis.

Intensity of Spatial Variation

In this research, the PLES change intensity index (WCI) is defined to measure the intensity of spatial change, and the calculation formula is as follows:
W C I = S t 1 S t 0 S t 0 × 100 %
where WCI is the intensity of spatial change of water ecology in each county and district, and the value range is [−1,1]; the closer the value is to 1, the more obvious the spatial expansion of water ecology is, and the closer the value is to −1, the more the obvious scale shrinkage is. St1, St0 are the spatial scales of the end-period and early-period PLES, respectively.

Space Transfer Matrix

The monitoring of LULC change and detailed transition information can be elaborated using the spatial transfer matrix [45]. The PLES change scenario’s direction and amplitude were revealed through a spatial transfer matrix. The calculation formula is as follows:
S i j = S 11 S 1 n S n 1 S n n
where the scale of PLES transfer out of/into other types of space is denoted, and n is the number of space types. In this study, the ArcGIS spatial statistics tool was used to process the PLES transformation and construct the transfer matrix in Excel.

2.2.3. Landscape Pattern Analysis

To quantify the evolutionary characteristics of PLES, the landscape index method was selected for this study. Landscape indices have complex and diverse characteristics [45], so the key to scientifically analyzing the landscape evolution of PLES is to select landscape indices that are consistent with the study area and content, and Fragstats 4.2 is a software for calculating the landscape indices with powerful computing and analytical capabilities. Three landscape index levels can be calculated by it, namely patches, categories, and landscapes [46], using the standard method and the moving window method. With reference to previous research, 900 m was selected as the moving window analysis scale [47]; in this paper, according to the research results of previous scholars and combined with the landscape characteristics of the Mulan River Basin, the category and landscape level indices are selected, and the selection and meaning of landscape indices are shown in Table 3. The mathematical expressions of landscape indices [48] are as follows.
(1) Percentage of patches in landscape area (PLAND)
P L A N D = j = 1 n a i j A × 100
where aij is the area of ij; A is the total area of all landscapes.
(2) Landscape shape index (LSI)
L S I = 0.25 E A
where E is the total length of all borders and A is the total area.
(3) Aggregation index (AI)
A I = g i j m a x g i j
where gij is the number of similar neighboring patches of the corresponding landscape type.
(4) Shannon diversity index (SHDI)
S H D I = i = 1 m p i ln p i
where pi denotes the ratio occupied by landscape patches.
(5) Shannon uniformity index (SHEI)
S H E I = i = 1 m p i ln p i ln m
where pi denotes the probability of patch type i appearing in the landscape; m denotes the assumption that there are m types of patches in the landscape. Its value range is 0 ≤ SHDI ≤ 1. The closer the value of SHDI is to 1, the more uniform the distribution of patches is.

2.2.4. Driver Analysis

Through the geographical dissimilarity of its performance processing, Geo-Detector is a new statistical method that can identify the driving forces behind each factor on the dependent variable [49]. Geo-detector is used to analyze whether there is an interaction between these two factors by comparing the single factor values and the q-values of two factors superimposed on each other [33]. The formulas are as follows:
q = 1 h = 1 L N h σ h 2 N σ 2 = 1 S S W S S T
S S   W = h = 1 L N h σ h 2 ,     S S T = N σ 2
where h = 1,..., L is the stratification (Strata), i.e., categorization or partitioning, of the variable Y or factor X; Nh and N are the number of cells in stratum h and the whole region, respectively; σh2 and σ2 are the variance of the Y values in stratum h and in the whole region, respectively. SSW and SST are the sum of within-stratum variance (Within Sum of Squares) and the total variance in the whole region, respectively (Total Sum of Squares).
When any two drivers, X1 and X2, interact, the interaction detector is utilized to assess if this interaction increases, decreases, or has no effect on the explanatory power of the synergy on the Y divergence [50].
In this paper, we analyze the elements affecting the evolution of PLES in the Mulan River Basin from the dimensions of natural geographic conditions and socioeconomic factors, and a total of eight indicators were selected, among which the indicators of natural factors were average slope (X1), mean elevation (X2), mean temperature (X3), average hours of sunshine (X4), and mean precipitation (X5) and the indicators of socioeconomic factors were gross domestic product (GDP) (X6), mean population density (X7), and nighttime lights (X8).

2.2.5. Landscape Pattern Prediction Models

The Markov model is a spatial transformation model based on raster data and is used to predict event probabilities [51]. The state and development trend of incidents were predicted by a transition probability matrix between different time states [52]. The equation is as follows:
N t + 1 = N t P i j
where, Nt, Nt+1 represent the land cover types at two time points; t is time; Pij is the state transition probability matrix.
The cellular automata (CA) model is a discontinuous spatiotemporal dynamics model characterized by discrete time, space, and state [53]. Each image element in the CA system has a discrete state, and each raster image element corresponds to an image element whose transformation rule is localized in both time and space [54]. It is represented by the following mathematical formula:
S t + 1 = f S t , N
where S(t+1) is the state of the tuple at the previous moment, St is the state of the tuple at the current moment, N is the tuple domain, and f is the local space tuple passing rule.
The CA-Markov model combines the ability of CA models to simulate complex spatial variations with the strengths of Markov models in temporal prediction [54], and it has both the ability of CA models to simulate the spatial variations of complex systems and the numerical analysis capability of Markov models to predict the long-term dynamics [51]. Therefore, in this study, the CA-Markov model in IDRISI Selva software was used to simulate and predict the distribution of landscape patterns in 2030 from the land use data of each period.

3. Results

3.1. Analysis of the Spatial and Temporal Evolution of PLES

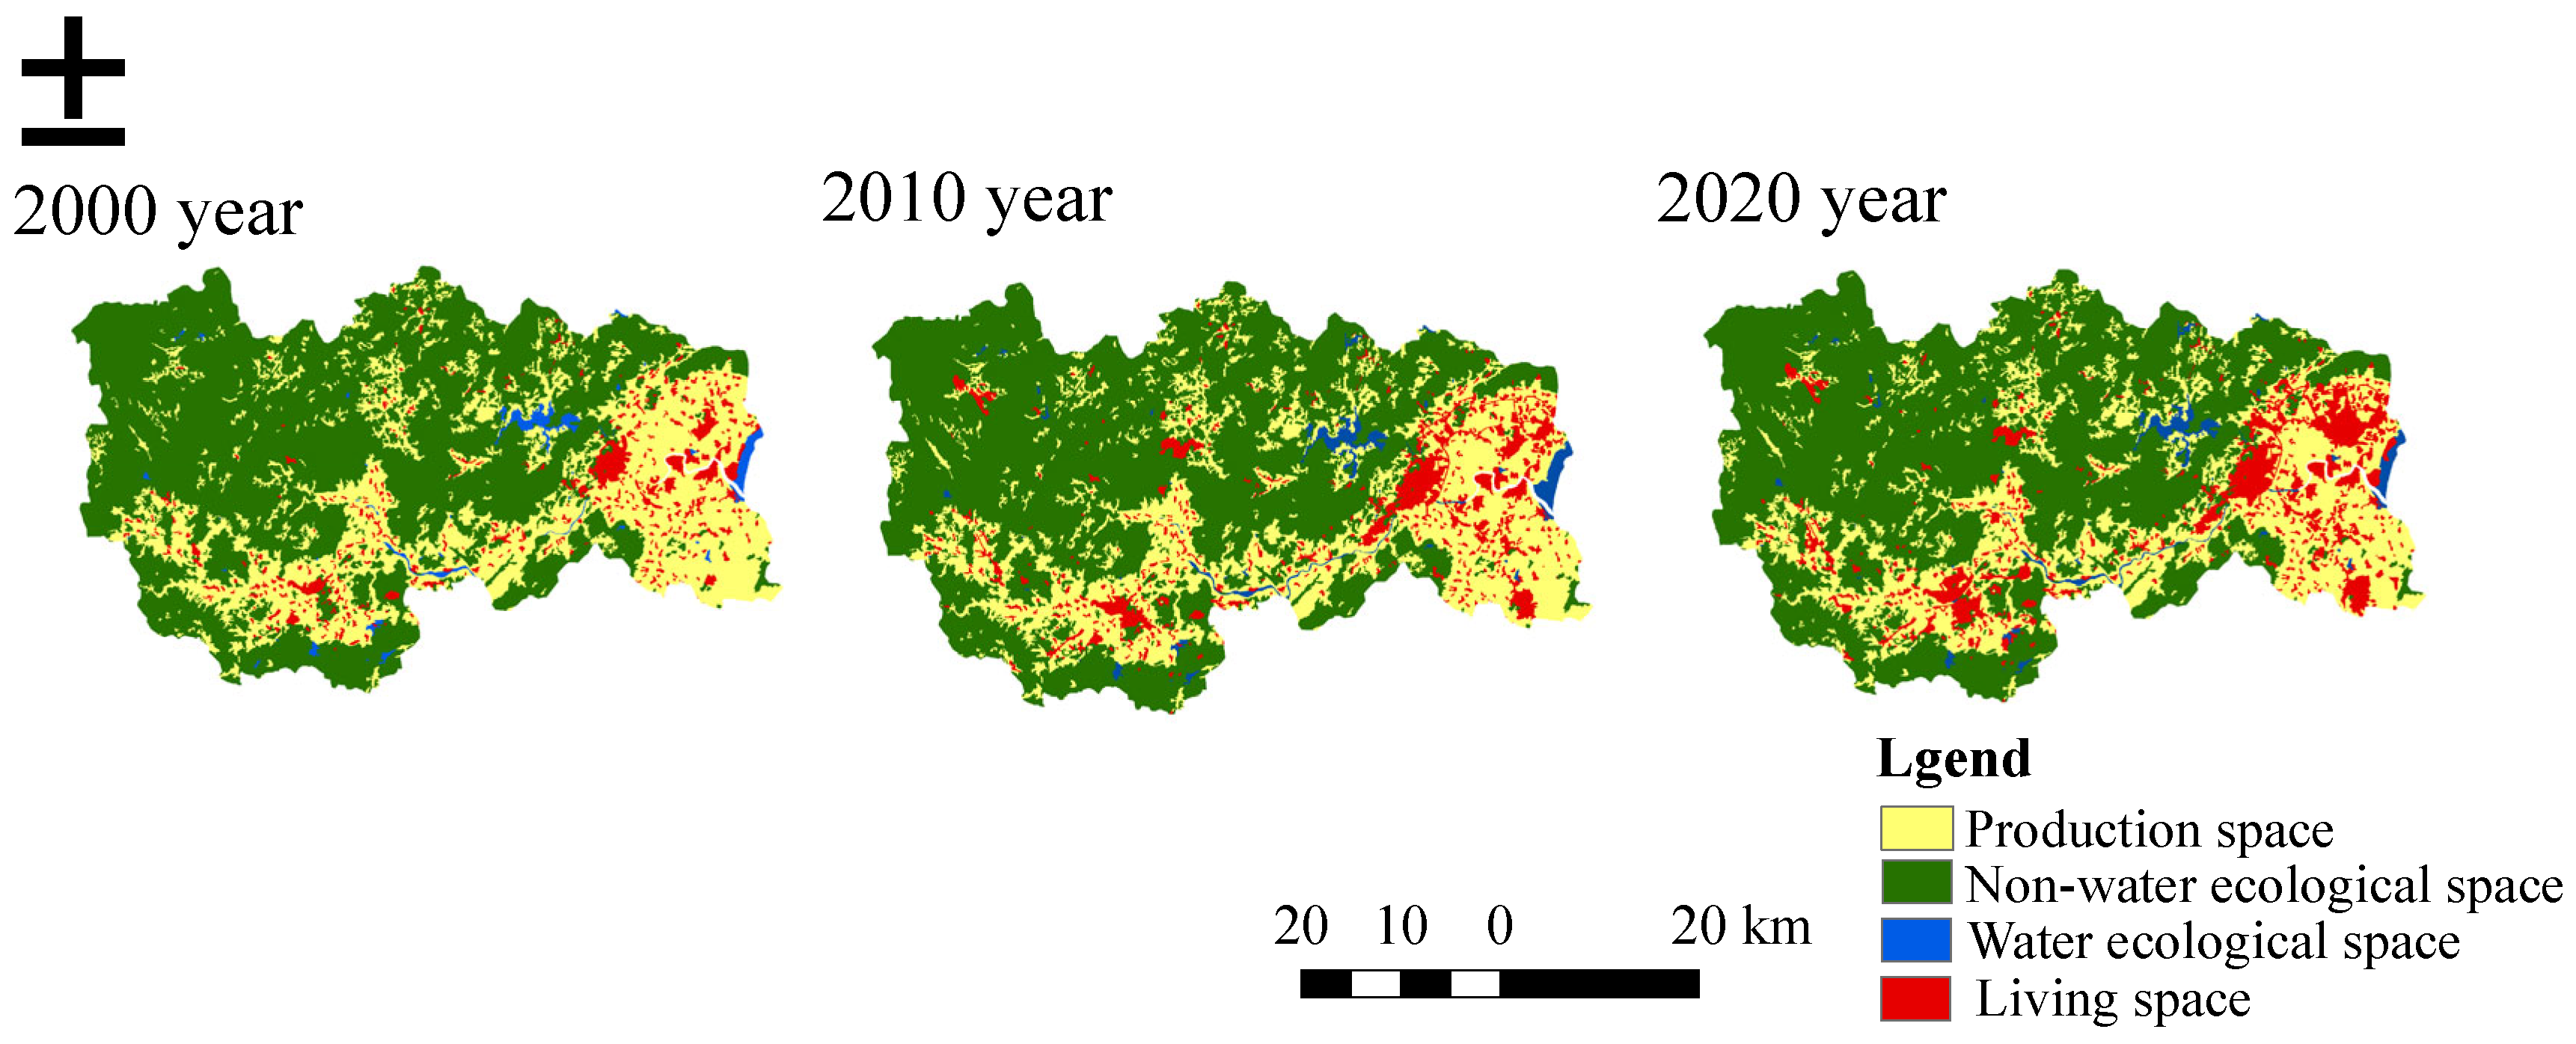
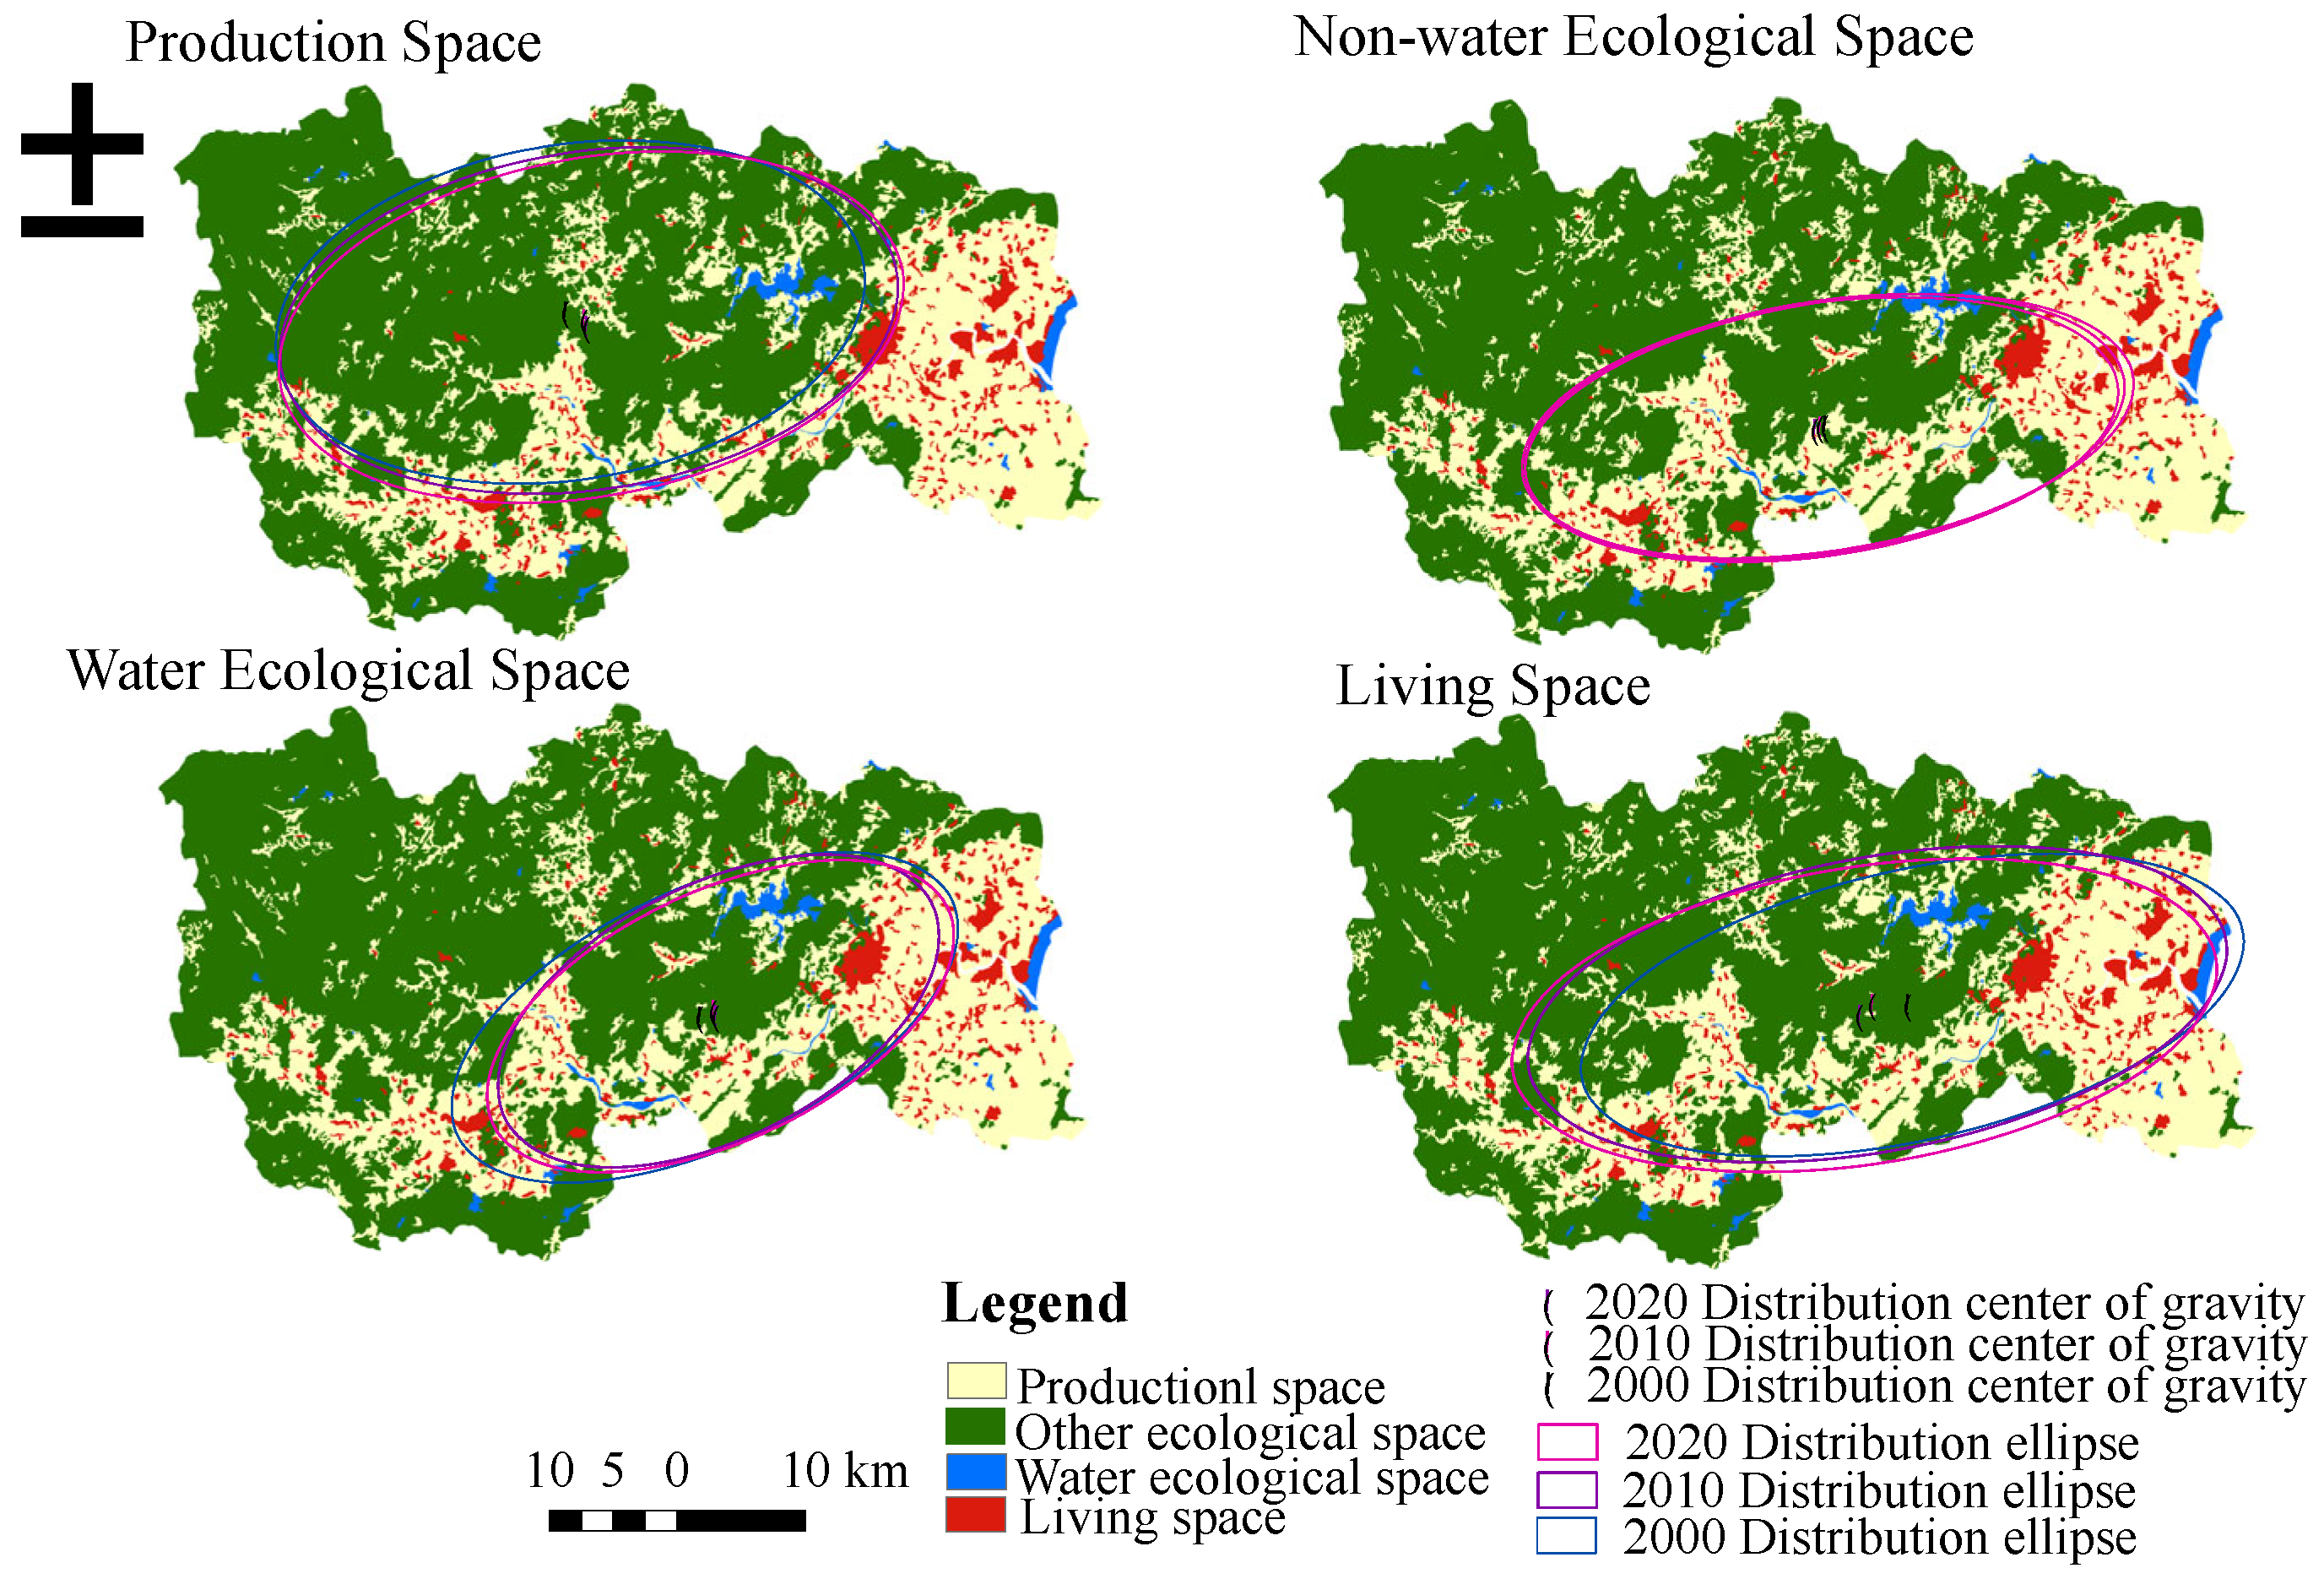
3.1.1. Characteristics of Spatial and Temporal Variations in PLES

The Mulan River Basin’s non-water ecological space was determined to be the dominant landscape by counting the evolution of PLES during the previous 20 years (Figure 3), accounting for more than 60% of the annual gross area, but with an overall decreasing trend between 2000 and 2020. In addition, according to Table 4, the production space was the second largest, accounting for about 30% of the total area, with a gradual downward trend. The size of living space increased from 101.0079 km2 in 2000 to 201.9087 km2 in 2020, and this is the only space in PLES that continues to grow. It is important to keep in mind that the total area of water ecological space is relatively modest, making up about 1.5% of the entire area. The area tends to increase first, then decrease, peaking at 1.73% of the total area in 2010. This investigation reveals the following: ① During the observation period (2000–2020), the expansion of living space (100 km2) led to a reduction in productive and non-water ecological space. Accelerated urbanization and growth in the scale and number of human migrations, in turn, compressed other spatial areas. ② The Mulan River Basin has a massive area of living and production space, including woods, grasslands, croplands, and residential land; the overall scale of water ecological space is tiny. This shows that other spaces are seriously encroaching on the water ecological space, and there is a spatial imbalance. ③ From Figure 3, it can be seen that productive land and living land are defined by grouping along the river. The development intensity of the Mulan River Basin is significant. At the same time, it is affected by industrial wastewater, urban sewage, and agricultural surface pollution, resulting in a declining trend in water quality and scale in the basin year by year. After 1999, Xi Jinping, then deputy secretary of the Fujian Provincial Party Committee and acting governor of Fujian Province, personally drew up a plan to improve the water ecology of the Mulan River and strengthen water pollution control. The research results indicate that the size of the water ecological space has grown to a certain extent in 2010.
In summary, the water ecological space of the Mulan River Basin has improved. However, the overall proportion is lower, and non-water ecological space is also decreasing from year to year, so it is important to strengthen ecological protection.

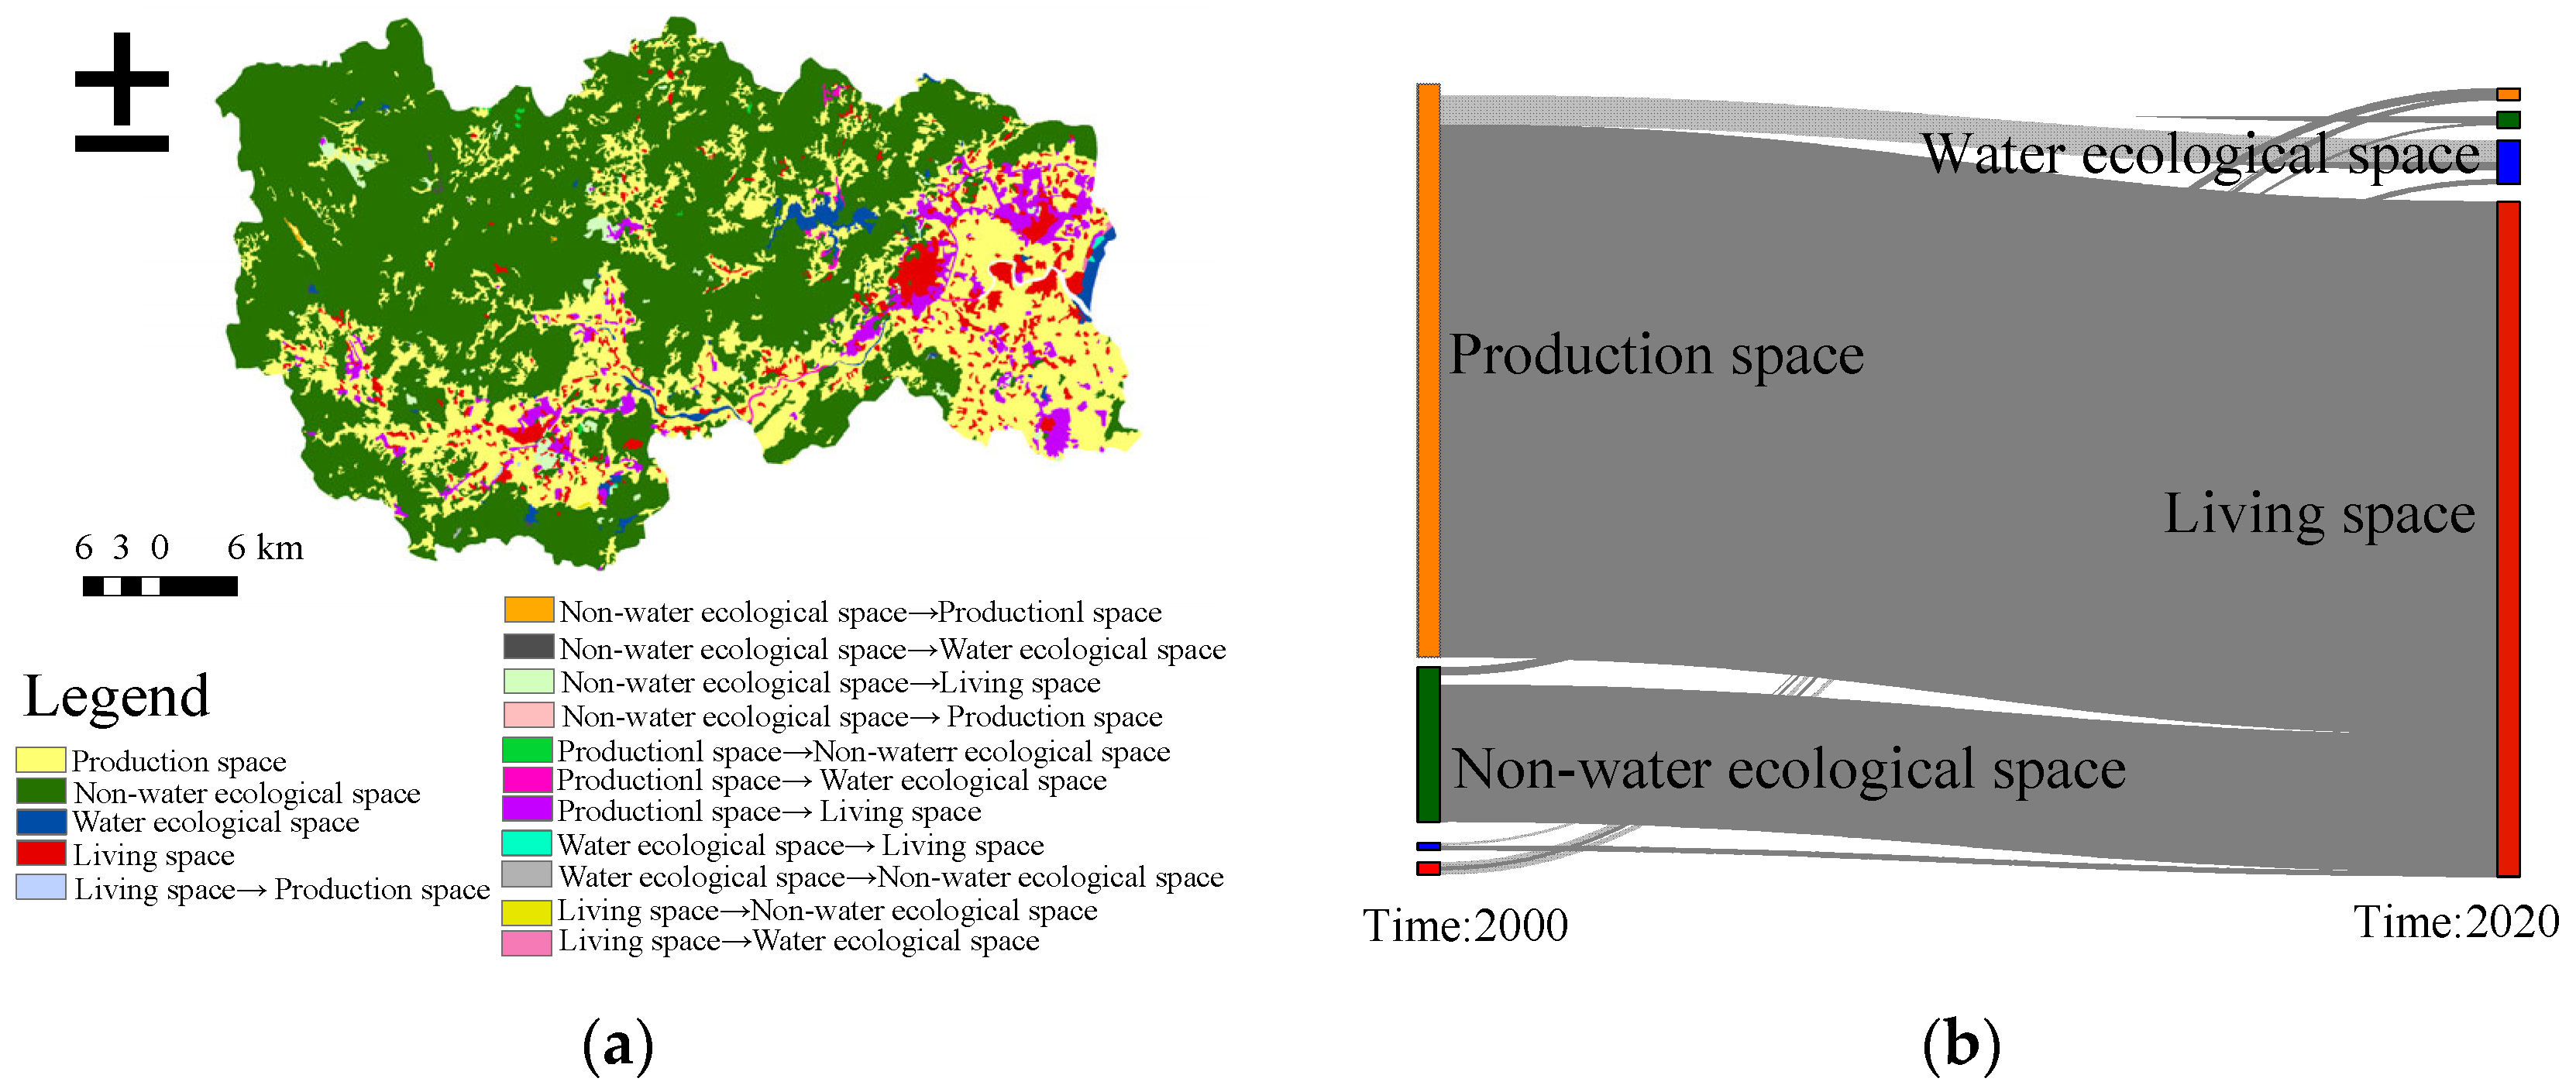
3.1.2. Inter-Conversion Characteristics of PLES

From the overall analysis (Figure 4), the centers of gravity of water ecological space, non-water ecological space, and production space landscapes were in the middle and higher portions of the watershed, while dwelling space landscapes were all roughly situated in the middle and lower reaches of the Mulan River Basin. Living space has the most significant shift in the center of gravity, with a comparatively sizeable standard deviation ellipse area of production.
The study area’s standard elliptic difference of water ecological space first increased before declining (Table 5), and the area of standard elliptic difference of production space, non-water ecological space, and living space continued to rise. The area of standard elliptic difference of production space reaches the maximum value of 1014.2272 km2 in 2020, and the values of standard elliptic difference of long and short axes change obviously, among which the values of short axes of production space and living space show a continuous rise, while the values of non-water ecological spaces show a continuous decline, and the values of long axes of production space are rising and falling as the water ecological space, living space, and non-water ecological spaces show an increasing trend, while the water ecological space shows a decreasing trend. The long axis values of production space, living space, and non-water ecological space all show an increasing trend, while the water ecological space is decreasing.
In summary, the Mulan River Basin exhibits a sharp conflict between living space, non-water ecological space, and water ecological space. This conflict is primarily located in the center and upper portions of the river’s main stem and in the city’s more affluent neighborhoods.
From 2000 to 2020, PLES in the Mulan River Basin underwent a notable change (Table 6 and Figure 5), and the most significant transfer was the transformation of industrial space into residential areas, with only 0.66 km2 transferred in and 81.14 km2 transferred out. Non-water ecological space and water ecological space are mainly converted to living space, with transfer out and transfer out and in areas of 20.84 km2 and 0.75 km2, of which the non-water ecological space migration scale is larger. For the spatial composition of the three living spaces between 2000 and 2020, the production space will be converted into water ecological space by 4.48 km2, and 81.14 km2 will be converted into living space. This suggests that while the more extensive migration of production space to living space area will negatively affect agricultural productivity and food security, the transfer of water ecological space to the primary source of production space may be related to policy measures for ecological environmental protection and land consolidation.
When considered collectively, the most extreme conversion from the other three spaces to the production space in the Mulan River Basin suggests that human activities have most severely disrupted the production space, non-water ecological spaces, and water ecological space in highly urbanized areas close to the brainstem river.

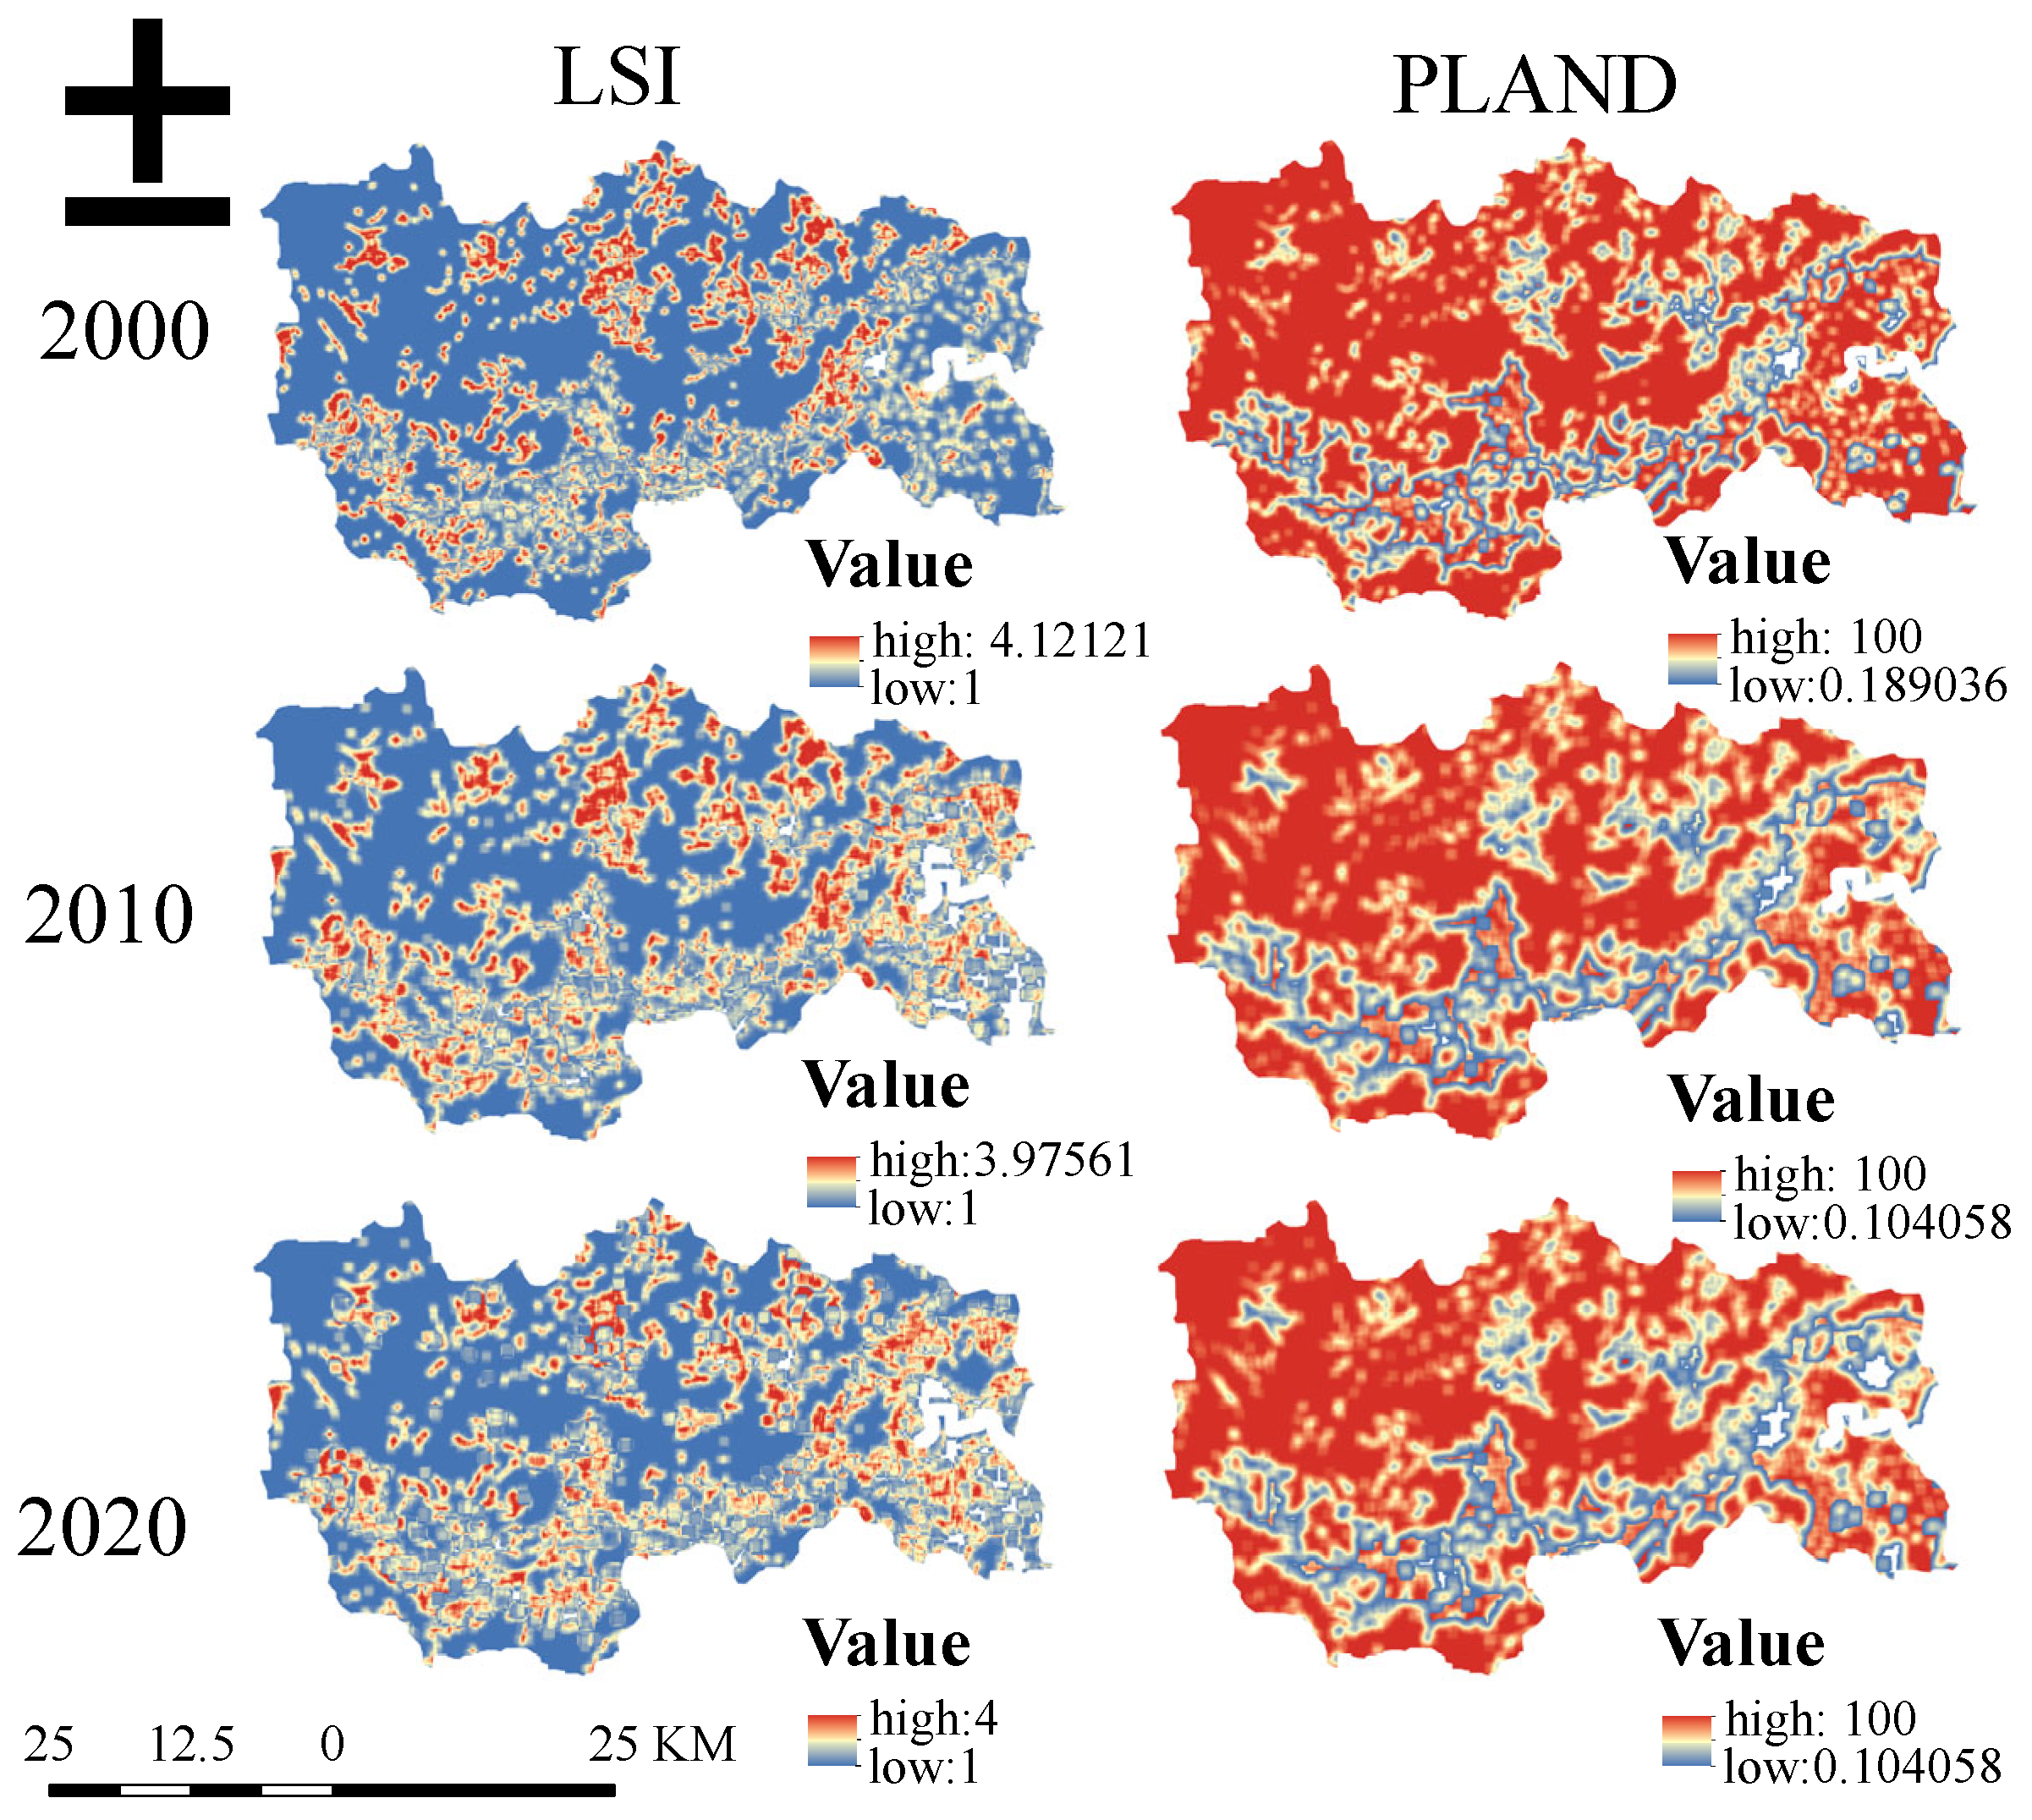
3.1.3. Landscape Index Analysis of PLES

Type Level

Landscape pattern indices at the landscape type level and patch type level for PLES in the Mulan River Basin were calculated using Fragstats 4.2 for the years 2000, 2010, and 2020. As demonstrated in Figure 6, the area ratio of patches occupied by non-water ecological space had the largest PLAND value between 2000 and 2020; thus, non-water ecological space was the predominant landscape in the study areas, followed by home, aquatic, and production ecological areas. The PLAND value of non-water ecological space was much larger than that of the other three spaces and generally showed a downward trend in amplitude. The PLAND value of water ecological space initially rose before declining, peaking at 1.73 in 2010, but its overall worth was minimal. The PLAND value of agricultural space decreased yearly, but the decrease was slight. The PLAND value of living space has increased yearly, with the largest intensification compared to the other three spaces. Regarding the landscape shape index (LSI), the variation in LSI values was slight in all four spaces, but the water ecological space rose year by year, from 12.15 in 2000 to 14.41 in 2020; the production space and non-water ecological spaces also show a year-by-year growth trend, from 38.65 to 43.90 and 23.02 to 23.77, respectively; and there is a living space demonstrating a pattern of first increasing and then decreasing, of which the LSI value in 2020 is still greater than that in 2000. From the LSI values, the landscape shape of the four spaces in the study area tends to be irregular.
An analysis of landscape patterns using the moving window approach (Figure 7) characterized the spatial differentiation of the Mulan River Basin, and the LSI and PLAND values of the research area between 2000 and 2020 showed a polarized trend near the river and in other areas, with higher LSI values along the river and smaller PLAND values in general, which suggested that the terrain was more varied close to the river, and the overall change was not significant from one year to the next, which was mainly because the river was more disturbed by the outside world. The primary cause is that the area near the river is more disturbed by the outside world.

Landscape Level

The terrain’s overall structural features are reflected in the indices at the landscape level, and the Shannon diversity index (SHDI), aggregation index (AI), and Shannon homogeneity index (SHEI) in the study area were analyzed. From 2000 to 2020, the SHEI in the study area first increased and then decreased, with an overall upward trend from 0.07 in 2000 to 0.812 in 2020. However, the overall value of the SHDI index was smaller (Figure 8), indicating that landscape patches in the Mulan River Basin increased, and landscape heterogeneity increased. The SHEI also showed a trend of first increasing and then decreasing during this period, increasing from 0.1009 in 2000 to 0.1171 in 2020, but the overall value of the SHDI index was smaller (Figure 8), indicating an increase in the number of landscape patches in the Mulan River Basin and an increase in landscape heterogeneity. The aggregation index (AI) gradually declined, but the decline was small and less than 0.1, and the overall value of the AI index was high, with a high degree of landscape aggregation in the Mulan River Basin, which showed a decreasing trend with a small degree of decline.
In the analysis of the moving window in Figure 9 from 2000 to 2020, the three indicators SHDI, AI, and SHEI have a sizeable spatial change; the AI index has a lower value around the river, and the SHDI and SHEI are higher. All of them have a complex change near the river. The main reason is that the area near the river is the living and gathering area, the human activity patches increase, the human activity disturbance is more extensive, and the landscape fragmentation increases.

3.2. Analysis of PLES Drivers

3.2.1. Single-Factor Detection

As shown in Table 7, changes in PLES area in the Mulan River Basin are impacted by a confluence of natural and socioeconomic elements, and the degree of influence of each factor on PLES varies. The q-statistic found by Geo-Detector can be characterized as follows: ① The highest q-value of mean elevation was found in the production space, demonstrating that the primary environmental factor influencing the change in the production space area was elevation, followed by mean temperature and mean population density, suggesting that the primary factor influencing the shift in the production space was the population distribution. ② The highest q-value of mean elevation in non-water ecological spaces indicates that the mean elevation is the most important factor affecting the change in the area of non-water ecological spaces, in addition to the influence of natural factors such as average air temperature and mean precipitation. The highest q-value of mean population density among the social factors indicates that population distribution is the most important social factor affecting non-water ecological spaces. ③ The water ecological space has the highest q-value of mean sunshine hours, followed by GDP and POP, and the difference between the three is slight. This indicates that the water ecological space is subject to critical environmental and anthropogenic influences, of which the anthropogenic influence is the most obvious. ④ The influence of each factor on the town space is small, the change in living space area is mainly affected by night lights and average altitude, followed by the social factor, namely mean population density, and the average altitude of natural components has a more immense influence on it.
In conclusion, the main social factor affecting changes in the four spatial areas is the mean population density, which suggests that the primary social element influencing changes in the spatial region is population. On the other hand, mean altitude is the most important environmental factor that affects the change in each spatial area.

3.2.2. Interactive Detection of Multiple Factors

A total of eight indicators were selected for this study, of which the indicators of natural factors were average slope (X1), mean elevation (X2), mean temperature (X3), mean sunshine hours (X4), and mean precipitation (X5) and the indicators of socioeconomic factors were gross domestic product (GDP) (X6), mean population density (X7), and nighttime lights (X8).
As shown in Figure 10, a single factor’s impact on PLES is less than the sum of its effects from several factors. ① In the production space, mean precipitation ∩ mean population density (1.00), mean temperature ∩ mean elevation (0.68), mean sunshine hours ∩ GDP (0.65), and the rest of the two-factor interactions have less than 50% explanatory power on the modifications to the living space’s size. And some of these interactions are stronger than a single factor. ② In the non-water ecological space, mean precipitation ∩ mean population density (1.00), mean elevation ∩ mean temperature (0.83), mean sunshine hours ∩ GDP (0.66), and mean slope ∩ mean sunshine hours (0.65) possessed a greater capacity to explain the shift in the non-water ecological space’s extent, among which eight were negatively correlated with each other with weaker interactions than the single factor, but in general, the interaction factor effects were greater. ③ In the water ecological space, GDP ∩ mean sunshine hours (0.7) and mean population density ∩ mean sunshine hours (0.69) were considered. The interaction of the remaining two factors has a low explanatory power for changes within the water space. ④ In the living space, mean precipitation ∩ mean population density (1.00), mean temperature ∩ mean elevation (0.65), mean sunshine hours ∩ mean population density (0.56), mean sunshine hours ∩ mean precipitation (0.56), mean population density ∩ gross regional product (0.52), mean precipitation ∩ gross regional product (0.52), mean temperature ∩ mean slope (0.51), and the rest of the two-factor interactions explained less than 50% of the variation in spatial area of towns. In summary, the combined effect of multiple factors affects PLES more profoundly than a single factor, with mean precipitation ∩ mean population density having the greatest impact on the three spaces of living, production, and other ecological spaces and GDP ∩ mean sunshine hours having the greatest impact on the water ecological space.

3.3. PLES Landscape Pattern Changes Predicted

Using IDRISI Selva software, the trend prediction of landscape patterns in 2030 was based on the landscape data of three periods from 2000 to 2020, and the prediction results were examined for accuracy. The Kappa coefficient was calculated to be 0.8187, which was greater than 0.75, indicating that the simulation results of the CA-Markov model were better, and the spatial distribution map of the Mulan River Basin watershed in 2030 was predicted by the CA-Markov model. The results are shown in Figure 11.
In 2030, the area of production space is 500.58 km2, non-water ecological space is 1095.43 km2, and water ecological space is 36.75 km2; the area is 462.57 km2 in the Mulan River Basin in 2020, so water ecological space and living space increased by 3.66 km2 and 260.67 km2, respectively, while non-water ecological space and production space decreased by 188,7584 km2 and 75.6 km2, respectively. Although the area of water ecological space is recovering, the increase in urban expansion will lead to threats to agriculture and the ecological environment.

4. Discussion

4.1. Driving Mechanisms and Landscape Predictions for PLES Evolution in the Mulan River Basin

Various environmental issues might arise from alterations in landscape patterns [2]. Since the quantification of landscape patterns in the 20th century [55], scholars from several nations have employed distinct techniques to unveil the spatial arrangement of landscape structures and their evolving attributes at the level of individual patches, categories of landscapes, and entire landscapes [42,56]. With “3S” technology, the dynamic evolution of the landscape pattern across time and space is fully observed and evaluated, among which the spatial transfer matrix, standard elliptic difference, and landscape indices are the main methods to study the evolution of the landscape pattern. It makes sense for the spatial transfer matrix to reflect the spatial morphological change of each space [4] and provide an in-depth understanding of the internal transfer of PLES in the Mulan River Basin. This study showed that the transition from the other three spaces to the production space was the most drastic. The use of a landscape pattern index is a typical method for quantitatively describing landscape patterns and has been widely applied to land use landscapes, vegetation landscapes, wetland landscapes, etc. [57] However, few studies have been conducted on the water ecology component of PLES. On the one hand, the classification system and evolution study of water ecological space in the context of territorial spatial planning have not been updated, which will lead to limitations in research. On the other hand, water ecosystems are complex, and complex elements such as groundwater cannot be effectively identified. This makes it difficult to use landscape indices to analyze water ecological space based on PLES spatial planning delineation. To cope with this limitation, this study, based on existing literature, obtained the spatial distribution of water ecosystems in the Mulan River Basin watershed in a short period of time based on land use data, established a classification system, and analyzed two key endogenous factors in the landscape pattern, i.e., SHEI and SHDI, and the results showed that the values of SHEI and SHDI have been increasing over the past two decades, which indicates that there is an increasing landscape fragmentation in the Mulan River Basin watershed. In addition, further identification of hydro-ecological elements is needed in the future to improve the quantitative analysis of PLES.

4.2. Driving Mechanism of PLES Evolution in the Mulan River Basin

In this study, we analyzed the landscape evolution, especially the water ecosystem, of the Mulan River Basin from the perspective of PLES by forming a research framework of “classification system construction–landscape pattern evolution–driving mechanism analysis”. The analyses showed that each driver had different impacts on the transformation of the PLES area. When analyzing the factors affecting spatial evolution, previous researchers have mainly studied the changes in landscape patterns to reflect the drivers affecting the landscape [21] or used single-factor quantitative analyses, Pearson’s correlation analyses [6], and regression analyses [58], which have certain limitations. Geo-Detector does not require linearity assumptions, is not affected by multivariate covariance [23], and can reflect bifactorial effects on landscape evolution. Therefore, Geo-Detector was employed to examine the inherent and social factors affecting the Mulan River Basin. Deriving the extent of correlation between single and dual factors and the change in each spatial area can present a scientific basis for regional spatial planning, which has a favorable impact on advancing water ecology’s spatial management planning.
In the analysis of the factors affecting PLES area change in the Mulan River Basin, the main influencing indicators affecting the landscape evolution of PLES were identified, including the mean population density and mean elevation. The increasing explanation for the multifactor interactions includes the interaction between mean precipitation and mean population density and the interactions between mean elevation and mean temperature, and the interaction between GDP and average sunshine hours affects the water ecological space. This is consistent with previous findings [4] suggesting that the main factors affecting landscape evolution are population, precipitation, and elevation. The Mulan River Basin is dominated by mountains and hills with large topographic relief and has a monsoon climate that is subtropical with suitable production space. With economic development, human demand for living space grows, the contradiction between ecological space and living space increases, and the Mulan River Basin has less natural space made up of water. Therefore, the Mulan River Basin is jointly influenced by natural and social factors, among which consideration ought to be given to the influence of GDP, population density, and precipitation on PLSE.
In terms of landscape prediction for Mulan River Basin, the CA-Markov models have been widely used for feature prediction and historical reconstruction of surface type changes [59], and the landscape prediction for the “Mulan River Basin Sample” as ecological management can contribute to the proactive planning and management process of the Mulan River Basin. Although the CA-Markov model in this paper can better simulate the amount of transfer changes of each land type in a complex nonlinear land system, it does not consider the influences of human activities and policy planning. In future research, the future direction of PLES landscape changes in the Mulan River Basin watershed will be better explored by combining qualitative and quantitative aspects and incorporating natural and socioeconomic influences. The economic development in the Mulan River Basin must be based on ecological protection. The expansion of construction land is the most direct representation of urban construction and an important indicator of urban ecological pressure [60], and the results of this study predicted a substantial increase in living space, so there is a need to limit the over-expansion of non-agricultural land to ensure the stability of the ecosystem. At the same time, it is necessary to formulate a reasonable land use planning policy, optimize the land use structure, improve the efficiency of land resources, and achieve the sustainable development of the ecology and economy of the Mulan River Basin.

4.3. Suggestions for Countermeasures for Landscape Ecological Protection in the Mulan River Basin

Previous spatial and temporal landscape evolution focused on large-scale areas, such as cities, counties, and districts, and lacked the overall spatial planning analysis of the watershed, especially the spatial analysis of water ecology. As the watershed is a landscape area of ecologically fragile and highly populated areas on a global regional scale [4], landscape ecological protection is a necessary condition for the planned advancement of regional green space, which is of great significance for achieving happy rivers and lakes. On the basis of the water ecological space divided by previous scholars [16], this study delineated the water ecological space of the Mulan River Based on the national spatial planning PLES, explored the changes in the landscape pattern of each space and the influence of the driving factors on it, and put forward scientific suggestions for spatial planning. Due to the lack of data collection and classification systems, it is impossible to accurately identify more elements of the water ecological space. Further, in-depth research can be carried out in the future.
Accordingly, landscape protection recommendations are made: ① It is important for us to focus on restoring the ecological space surrounding water bodies and incorporating various aspects of mountains, water, forests, farmland, and lakes. ② Slow down the development of areas along the primary flow of the Mulan River Basin, increase the source of living land indicators, ensure that the scale of living land is within the prescribed limits, create a “lifeline” for rivers and lakes, avoid encroaching on the ecological space of water and maximize the restoration of the water ecology and the linkage’s ecological worth. ③ Promote the circulation of PLES elements and the complementary advantages of each space; strengthen the publicity of water conservation and environmental protection; set up a data channel and establish a digital management platform to achieve accurate management. ④ In terms of improving the environment, energy conservation and saving is one of the important measures for improving the environment. Emissions of pollutants should be reduced, for example, by reducing vehicle exhaust emissions, industrial emissions, and wastewater discharges, to reduce environmental pollution. Implement garbage classification and resource recovery, and separate recyclable garbage and hazardous waste to reduce the pollution of garbage to the environment. Promote green travel and forms of clean energy transportation such as electric cars to reduce pollution to the environment further. Plant trees to improve environmental quality and reduce soil erosion.
This study’s findings can provide useful information for PLES spatial planning and ecological protection in the Mulan River Basin, as well as valuable cases for ecological protection and spatial management planning in the basin area.

5. Conclusions

In this paper, according to Landsat remote sensing images of the Mulan River Basin from 2000 to 2020, we divided the water ecological space based on PLES, explored the temporal and spatial evolution of the PLES landscape pattern in the research area by using landscape indices, and analyzed the influencing factors affecting the evolution of PLES by using Geo-Detector. The findings indicate the following:
(1)
Based on the PLES system constructed from surface cover data extracted from Fujian LUCC remote sensing monitoring data in the Mulan River Basin, and based on the relevant articles, a water ecological space classification system was delineated, which can be used to assess how the water ecological space pattern has changed over time and what factors led to area alterations. The results of this study showed that although the water ecological space in the Mulan River Basin was negligible during the study period, it was improved after the treatment. Although the non-water ecological space showed a decreasing trend from year to year, it was the dominant landscape.
(2)
Conflicts between PLES in the Mulan River Basin are mainly reflected in urban and economically more developed areas; the most significant scale of conversion is the transformation of industrial space into habitation, which mainly occurs around the mainstream of the river, and the transfer of water ecological space mainly comes from production space.
(3)
According to the results of the landscape indices, the non-water ecological space in the Mulan River Basin is the dominant landscape, and the ecological management of the Mulan River is more effective; the SHDI and SHEI of the Mulan River Basin are lower. The AI is higher, which indicates that the Mulan River Basin as a whole has less landscape diversity, the degree of aggregation is evident, and the Mulan River Basin is dominated by dominant landscapes in each region.
(4)
Physical geography and socioeconomic factors influence PLES evolution in the Mulan River Basin simultaneously, and the effects of various causes on spatial changes vary. The primary social factors influencing the spatial variations of PLES water ecology are GDP and population density; the primary natural element influencing the geographical variations of PLES water ecology is mean sunshine hours. The interaction between GDP and mean sunshine hours had the greatest effect on the spatial changes of water ecology. In contrast, the interaction between mean precipitation and mean population density had the greatest effect on the spatial changes in living, production, and non-water areas.
(5)
Based on the use of the CA-Markov model to simulate the distribution of PLES landscape pattern in the Mulan River Basin watershed, without considering the influence of anthropogenic factors, the area of production space and non-water ecological space in the Mulan River Basin watershed will show a decreasing trend in 2030. The area of water ecological space and living space will increase by 3.66 km2 and 26,067 km2, respectively. Living space will increase, which can be seen from the fact that living space mainly comes from production and non-water ecological space. Without rational planning and utilization of land resources, the area of the Mulan River Basin will keep expanding, and the area of arable land will keep decreasing, which will lead to local climate change and threaten the food security and ecological safety of China.
In conclusion, these results provide important direction for managing the Mulan River Basin’s spatial balance and protecting its water ecology. They also offer a scientific path for managing geospatial resources in comparable regions.

Author Contributions

Y.Z.: conceptualization, formal analysis, methodology, software, validation, writing—original draft, writing—review and editing. L.W.: conceptualization, supervision, writing—review and editing. F.W.: validation, writing—review and editing. C.X.: writing—review and editing. A.W.: conceptualization, methodology. Y.L.: data curation, funding acquisition, validation, writing—review and editing. B.L.: supervision, validation, project administration, resources, writing—review and editing. All authors have read and agreed to the published version of the manuscript.

Funding

The research was supported by the Natural Science Foundation of Fujian Province (2023J01514), National Natural Science Foundation of China (Grant No. 41901221 and 31971643), the Science and Technology Project of Fujian Provincial of Water Resources Department (Grant No. SC-290), Science and the Technology Project of Fujian Forestry Bureau (Grant No. SC-259).

Institutional Review Board Statement

Not applicable.

Informed Consent Statement

Not applicable.

Data Availability Statement

The study used 2000, 2010, and 2020 land use data of the Mulan River, digital elevation model (DEM) data (with a resolution of 30 m) from the Data Centre for Resource and Environmental Sciences of the Chinese Academy of Sciences (http://www.resdc.cn, accessed on 27 January 2023), and digital elevation model (DEM) data from the China Spatial Data Cloud (https://www.gscloud.cn/, accessed on 27 January 2023). The socioeconomic, population, temperature, and precipitation data needed for the driving mechanism study were obtained from China Meteorological Network (http://data.cma.cn/, accessed on 27 January 2023) and Fujian Statistical Yearbook, Putian City Statistical Yearbook, and Statistical Bulletin. Vector data for the Mulan River Basin boundary were obtained from the Putian Mulan River Basin Management Office.

Conflicts of Interest

The authors declare no conflicts of interest.

References

  1. Wu, X.; Gang, J.; Zhang, L. Dynamic Change Analysis of Landscape Pattern in Daqing City Based on 3s Technology. In Proceedings of the 2022 IEEE International Geoscience and Remote Sensing Symposium (IGARSS 2022), Kuala Lumpur, Malaysia, 17–22 July 2022; pp. 2422–2425. [Google Scholar]
  2. Zhao, C.; Gong, J.; Zeng, Q.; Yang, M.; Wang, Y. Landscape Pattern Evolution Processes and the Driving Forces in the Wetlands of Lake Baiyangdian. Sustainability 2021, 13, 9747. [Google Scholar] [CrossRef]
  3. Luo, P.; Mu, D.; Xue, H.; Thanh, N.-D.; Kha, D.-D.; Takara, K.; Nover, D.; Schladow, G. Flood inundation assessment for the Hanoi Central Area, Vietnam under historical and extreme rainfall conditions. Sci. Rep. 2018, 8, 12623. [Google Scholar] [CrossRef] [PubMed]
  4. Fu, J.; Gao, Q.; Jiang, D.; Li, X.; Lin, G. Spatial-temporal distribution of global production-living-ecological space during the period 2000–2020. Sci. Data 2023, 10, 589. [Google Scholar] [CrossRef] [PubMed]
  5. Wu, J.; Li, X.; Luo, Y.; Zhang, D. Spatiotemporal effects of urban sprawl on habitat quality in the Pearl River Delta from 1990 to 2018. Sci. Rep. 2021, 11, 13981. [Google Scholar] [CrossRef] [PubMed]
  6. Zhang, R.; Li, S.; Wei, B.; Zhou, X. Characterizing Production-Living-Ecological Space Evolution and Its Driving Factors: A Case Study of the Chaohu Lake Basin in China from 2000 to 2020. ISPRS Int. J. Geo-Inf. 2022, 11, 447. [Google Scholar] [CrossRef]
  7. Zhu, J.; Shang, Z.; Long, C.; Lu, S. Functional Measurements, Pattern Evolution, and Coupling Characteristics of “Production-Living-Ecological Space” in the Yangtze Delta Region. Sustainability 2023, 15, 16712. [Google Scholar] [CrossRef]
  8. Hou, Y.; Zhang, Z.; Wang, Y.; Sun, H.; Xu, C. Function Evaluation and Coordination Analysis of Production-Living-Ecological Space Based on the Perspective of Type-Intensity-Connection: A Case Study of Suzhou, China. Land 2022, 11, 1954. [Google Scholar] [CrossRef]
  9. Zhu, Z.; Liu, B.; Wang, H.; Hu, M. Analysis of the Spatiotemporal Changes in Watershed Landscape Pattern and Its Influencing Factors in Rapidly Urbanizing Areas Using Satellite Data. Remote Sens. 2021, 13, 1168. [Google Scholar] [CrossRef]
  10. Liu, K.; Wang, C.; Song, S.; Li, Q. Evaluation on Sustainable Development Level—A Case Study of Liaocheng City. Appl. Mech. Mater. 2013, 361, 111–114. [Google Scholar] [CrossRef]
  11. Liu, M.; Chen, G.; Li, G.; Huang, Y.; Luo, K.; Zhan, C. Landscape Evolution and Its Driving Forces in the Rapidly Urbanized Guangdong-Hong Kong-Macao Greater Bay Area, a Case Study in Zhuhai City, South China. Sustainability 2023, 15, 13045. [Google Scholar] [CrossRef]
  12. Medeiros, A.; Fernandes, C.; Goncalves, J.F.; Farinha-Marques, P. A diagnostic framework for assessing land-use change impacts on landscape pattern and character—A case-study from the Douro region, Portugal. Landsc. Urban Plan. 2022, 228, 104580. [Google Scholar] [CrossRef]
  13. Ocloo, M.D.; Huang, X.; Fan, M.; Ou, W. Study on the spatial changes in land use and landscape patterns and their effects on ecosystem services in Ghana, West Africa. Environ. Dev. 2024, 49, 100947. [Google Scholar] [CrossRef]
  14. Ding, J.; Dai, W. The Review of Landscape Pattern Analysis based on Landscape Index. Archit. Cult. 2022, 5, 231–232. [Google Scholar] [CrossRef]
  15. Tang, J.; Di, L.; Rahman, M.S.; Yu, Z. Spatial-temporal landscape pattern change under rapid urbanization. J. Appl. Remote Sens. 2019, 13, 024503. [Google Scholar] [CrossRef]
  16. Shi, Z.; Deng, W.; Zhang, S. Spatio-temporal pattern changes of land space in Hengduan Mountains during 1990–2015. J. Geogr. Sci. 2018, 28, 529–542. [Google Scholar] [CrossRef]
  17. Rojas Quezada, C.; Jorquera, F. Urban Fabrics to Eco-Friendly Blue-Green for Urban Wetland Development. Sustainability 2021, 13, 13745. [Google Scholar] [CrossRef]
  18. Paracchini, M.L.; Pacini, C.; Jones, M.L.M.; Perez-Soba, M. An aggregation framework to link indicators associated with multifunctional land use to the stakeholder evaluation of policy options. Ecol. Indic. 2011, 11, 71–80. [Google Scholar] [CrossRef]
  19. Tian, F.; Li, M.; Han, X.; Liu, H.; Mo, B. A Production-Living-Ecological Space Model for Land-Use Optimisation: A case study of the core Tumen River region in China. Ecol. Model. 2020, 437, 109310. [Google Scholar] [CrossRef]
  20. Wang, T.; Kazak, J.; Han, Q.; de Vries, B. A framework for path-dependent industrial land transition analysis using vector data. Eur. Plan. Stud. 2019, 27, 1391–1412. [Google Scholar] [CrossRef]
  21. Cai, G.; Xiong, J.; Wen, L.; Weng, A.; Lin, Y.; Li, B. Predicting the ecosystem service values and constructing ecological security patterns in future changing land use patterns. Ecol. Indic. 2023, 154, 110787. [Google Scholar] [CrossRef]
  22. Shi, F.; Liu, S.; Sun, Y.; An, Y.; Zhao, S.; Liu, Y.; Li, M. Ecological network construction of the heterogeneous agro-pastoral areas in the upper Yellow River basin. Agric. Ecosyst. Environ. 2020, 302, 107069. [Google Scholar] [CrossRef]
  23. Cai, G.; Lin, Y.; Zhang, F.; Zhang, S.; Wen, L.; Li, B. Response of Ecosystem Service Value to Landscape Pattern Changes under Low-Carbon Scenario: A Case Study of Fujian Coastal Areas. Land 2022, 11, 2333. [Google Scholar] [CrossRef]
  24. Bo, L.; Wei, W.; Yi, L.; Zhao, L.; Xia, J. Evolution characteristics and influencing factors of hydro-ecological space pattern in the Yangtze River Economic Belt from 2000 to 2020. China Environ. Sci. 2023, 43, 874–885. [Google Scholar] [CrossRef]
  25. Yan, D.; Chen, L.; Sun, H.; Liao, W.; Chen, H.; Wei, G.; Zhang, W.; Tuo, Y. Allocation of ecological water rights considering ecological networks in arid watersheds: A framework and case study of Tarim River basin. Agric. Water Manag. 2022, 267, 107636. [Google Scholar] [CrossRef]
  26. Luo, W.; Cao, F. Study on the Evolution of Landscape Patterns in Shaoguan City from 2005 to 2021. J. Green Sci. Technol. 2022, 24, 66–70. [Google Scholar] [CrossRef]
  27. Yohannes, H.; Soromessa, T.; Argaw, M.; Dewan, A. Impact of landscape pattern changes on hydrological ecosystem services in the Beressa watershed of the Blue Nile Basin in Ethiopia. Sci. Total Environ. 2021, 793, 148559. [Google Scholar] [CrossRef] [PubMed]
  28. Gong, Y.; You, G.; Chen, T.; Wang, L.; Hu, Y. Rural Landscape Change: The Driving Forces of Land Use Transformation from 1980 to 2020 in Southern Henan, China. Sustainability 2023, 15, 2565. [Google Scholar] [CrossRef]
  29. Deng, L.; Zhang, Q.; Cheng, Y.; Cao, Q.; Wang, Z.; Wu, Q.; Qiao, J. Underlying the influencing factors behind the heterogeneous change of urban landscape patterns since 1990: A multiple dimension analysis. Ecol. Indic. 2022, 140, 108967. [Google Scholar] [CrossRef]
  30. Li, Z.; Zhang, X.; Liu, Y. Evaluation of ur ban bearing capacity and driving factor s from the per spective of civilization: A case study of Xinjiang. J. Shihezi Univ. (Nat. Sci.) 2018, 36, 783–791. [Google Scholar] [CrossRef]
  31. Ayre, K.K.; Landis, W.G. A Bayesian Approach to Landscape Ecological Risk Assessment Applied to the Upper Grande Ronde Watershed, Oregon. Hum. Ecol. Risk Assess. 2012, 18, 946–970. [Google Scholar] [CrossRef]
  32. Mann, D.; Anees, M.M.; Rankavat, S.; Joshi, P.K. Spatio-temporal variations in landscape ecological risk related to road network in the Central Himalaya. Hum. Ecol. Risk Assess. 2021, 27, 289–306. [Google Scholar] [CrossRef]
  33. Wang, J.; Xu, C. Geodetector: Principle and prospective. Dili Xuebao/Acta Geogr. Sin. 2017, 72, 116–134. [Google Scholar] [CrossRef]
  34. Yang, T.; Sun, F.; Liu, W.; Wang, H.; Wang, T.; Liu, C. Using Geo-detector to attribute spatio-temporal variation of pan evaporation across China in 1961–2001. Int. J. Climatol. 2019, 39, 2833–2840. [Google Scholar] [CrossRef]
  35. Yang, Y.; Qin, T.; Yan, D.; Liu, S.; Feng, J.; Wang, Q.; Liu, H.; Gao, H. Analysis of the evolution of ecosystem service value and its driving factors in the Yellow River Source Area, China. Ecol. Indic. 2024, 158, 111344. [Google Scholar] [CrossRef]
  36. Su, L.; Zhu, J.; Zeng, L.; Liu, M. Landscape pattern change prediction of Jinhu coastal area based on CA-Markov model. In Proceedings of the 2012 World Automation Congress (WAC), Puerto Vallarta, Mexico, 24–28 June 2012. [Google Scholar]
  37. Xu, K.; Chi, Y.; Ge, R.; Wang, X.; Liu, S. Land use changes in Zhangjiakou from 2005 to 2025 and the importance of ecosystem services. PeerJ 2021, 9, e12122. [Google Scholar] [CrossRef] [PubMed]
  38. Saxena, A.; Jat, M.K. Land suitability and urban growth modeling: Development of SLEUTH-Suitability. Comput. Environ. Urban Syst. 2020, 81, 101475. [Google Scholar] [CrossRef]
  39. Cai, L.; Wang, M. Effect of the thematic resolution of land use data on urban expansion simulations using the CA-Markov model. Arab. J. Geosci. 2020, 13, 1250. [Google Scholar] [CrossRef]
  40. Wu, D.; Zhang, L.; Yu, L.; Ding, N.; Tang, Z. Ecological Water Management under High-Quality Territorial Spatial Development —Guangming District of Shenzhen as an Example. Urban Plan. Forum 2021, 4, 66–73. [Google Scholar] [CrossRef]
  41. Deng, W.; Yan, D.; He, Y.; Zhang, G. Study on ecological storeroom of water in the watershed. Adv. Water Sci. 2004, 15, 341–345. [Google Scholar]
  42. Kankam, S.; Osman, A.; Inkoom, J.N.; Fuerst, C. Implications of Spatio-Temporal Land Use/Cover Changes for Ecosystem Services Supply in the Coastal Landscapes of Southwestern Ghana, West Africa. Land 2022, 11, 1408. [Google Scholar] [CrossRef]
  43. Lin, G.; Jiang, D.; Dong, D.; Fu, J.; Li, X. Spatial Characteristic of Coal Production-Based Carbon Emissions in Chinese Mining Cities. Energies 2020, 13, 453. [Google Scholar] [CrossRef]
  44. Duman, Z.; Mao, X.; Cai, B.; Zhang, Q.; Chen, Y.; Gao, Y.; Guo, Z. Exploring the spatiotemporal pattern evolution of carbon emissions and air pollution in Chinese cities. J. Environ. Manag. 2023, 345, 118870. [Google Scholar] [CrossRef] [PubMed]
  45. Berihun, M.L.; Tsunekawa, A.; Haregeweyn, N.; Meshesha, D.T.; Adgo, E.; Tsubo, M.; Masunaga, T.; Fenta, A.A.; Sultan, D.; Yibeltal, M. Exploring land use/land cover changes, drivers and their implications in contrasting agro-ecological environments of Ethiopia. Land Use Policy 2019, 87, 104052. [Google Scholar] [CrossRef]
  46. Alhamad, M.N.; Alrababah, M.A.; Feagin, R.A.; Gharaibeh, A. Mediterranean drylands: The effect of grain size and domain of scale on landscape metrics. Ecol. Indic. 2011, 11, 611–621. [Google Scholar] [CrossRef]
  47. Li, D.; Ding, S.Y.; Liang, G.F.; Zhao, Q.; Tang, Q.; Kong, L.B. Landscape heterogeneity of mountainous and hilly area in the western Henan Province based on moving window method. Acta Ecol. Sin. 2014, 34, 3414–3424. [Google Scholar]
  48. Chen, W.; Xiao, W.; Li, X. Classification, application, and creation of landscape indices. Chin. J. Appl. Ecol. 2002, 13, 121–125. [Google Scholar]
  49. Gong, C.; Wang, S.-X.; Lu, H.-C.; Chen, Y.; Liu, J.-F. [Research Progress on Spatial Differentiation and Influencing Factors of Soil Heavy Metals Based on Geographical Detector]. Huan Jing Ke Xue 2023, 44, 2799–2816. [Google Scholar] [CrossRef] [PubMed]
  50. Wang, X.; Zhang, M.; Yin, L.; Huang, P.; Lesi, M. Study on the driving factors in desertification process in arid and semi-arid region of China from 2000 to 2015. Ecol. Environ. Sci. 2019, 28, 948–957. [Google Scholar] [CrossRef]
  51. Yan, D.; Li, J.; Xie, S.; Liu, Y.; Sheng, Y.; Luan, Z. Examining the expansion of Spartina alterniflora in coastal wetlands using an MCE-CA-Markov model. Front. Mar. Sci. 2022, 9, 964172. [Google Scholar] [CrossRef]
  52. Adhikari, S.; Southworth, J. Simulating Forest Cover Changes of Bannerghatta National Park Based on a CA-Markov Model: A Remote Sensing Approach. Remote Sens. 2012, 4, 3215–3243. [Google Scholar] [CrossRef]
  53. Fu, X.; Wang, X.; Yang, Y.J. Deriving suitability factors for CA-Markov land use simulation model based on local historical data. J. Environ. Manag. 2018, 206, 10–19. [Google Scholar] [CrossRef] [PubMed]
  54. Hou, G.; Zhang, H.; Liu, Z.; Chen, Z.; Cao, Y. Historical reconstruction of aquatic vegetation of typical lakes in Northeast China based on an improved CA-Markov model. Front. Ecol. Evol. 2022, 10, 1031678. [Google Scholar] [CrossRef]
  55. Gustafson, E.J. How has the state-of-the-art for quantification of landscape pattern advanced in the twenty-first century? Landsc. Ecol. 2019, 34, 2065–2072. [Google Scholar] [CrossRef]
  56. Bai, L.; Xiu, C.; Feng, X.; Liu, D. Influence of urbanization on regional habitat quality:a case study of Changchun City. Habitat Int. 2019, 93, 102042. [Google Scholar] [CrossRef]
  57. Saura, S.; Estreguil, C.; Mouton, C.; Rodriguez-Freire, M. Network analysis to assess landscape connectivity trends: Application to European forests (1990–2000). Ecol. Indic. 2011, 11, 407–416. [Google Scholar] [CrossRef]
  58. Guo, X.; Ye, J.; Hu, Y. Analysis of Land Use Change and Driving Mechanisms in Vietnam during the Period 2000–2020. Remote Sens. 2022, 14, 1600. [Google Scholar] [CrossRef]
  59. Yang, J.; Yang, R.; Chen, M.-H.; Su, C.-H.; Zhi, Y.; Xi, J. Effects of rural revitalization on rural tourism. J. Hosp. Tour. Manag. 2021, 47, 35–45. [Google Scholar] [CrossRef]
  60. El Garouani, A.; Mulla, D.J.; El Garouani, S.; Knight, J. Analysis of urban growth and sprawl from remote sensing data: Case of Fez, Morocco. Int. J. Sustain. Built Environ. 2017, 6, 160–169. [Google Scholar] [CrossRef]
Figure 1. Research location: (a) the location of Putian City in Fujian Province, (b) DEM of Mulan River Basin, and (c) the administrative division of Putian.
Sustainability 16 04708 g001
Figure 2. The background of land spatial planning is the connection between the subdivision of groundwater ecological space and the type of land use system.
Sustainability 16 04708 g002
Figure 3. Spatial and temporal distribution of landscape in the Mulan River Basin from 2000 to 2020.
Sustainability 16 04708 g003
Figure 4. The standard elliptic difference distribution of three species in the Mulan River Basin.
Sustainability 16 04708 g004
Figure 5. Transfer distribution of PLES: (a) the Mulan River Basin; (b) Sankey diagram.
Sustainability 16 04708 g005
Figure 6. PLES landscape type level landscape index map in Mulan River Basin.
Sustainability 16 04708 g006
Figure 7. Spatial distribution of landscape type indices (LSI and PLAND) in the Mulan River Basin from 2000 to 2020.
Sustainability 16 04708 g007
Figure 8. Landscape index map of three life spatial landscape levels in the Mulan River Basin.
Sustainability 16 04708 g008
Figure 9. Spatial distribution of landscape indices (AI, SHEEI, and SHDI) in the Mulan River Basin from 2000 to 2020.
Sustainability 16 04708 g009
Figure 10. PLES interactive factor correlation coefficient map of the Mulan River Basin: (a) living space, (b) production space, (c) water ecological space, and (d) non-water ecological space.
Sustainability 16 04708 g010
Figure 11. The Mulan River Basin 2030 landscape pattern distribution projections.
Sustainability 16 04708 g011
Table 1. Basic data.
Data TypeDataYearResolution Source
Base DataLand use data2000–202030 mCAS (https://www.resdc.cn/, accessed on 27 January 2023)
Natural factorsDEM201630 mhttps://www.gscloud.cn, accessed on 27 January 2023
Slope Extracted from DEM
Temperature20191 kmCAS (https://www.resdc.cn/, accessed on 27 January 2023)
Precipitation
Socioeconomic
factors
Night-light201830 mCAS (https://www.resdc.cn/, accessed on 27 January 2023)
GDP
Population1 km
Table 2. The connection between the classification system of water ecology spatial research and the CNLUCC data classification system in the Mulan River Basin.
PLES Classification SystemCNLUCC Data Classification System
Main ClassSubcategoriesClass ISecondary Land Types and Content
Ecological spaceWater ecological spacebody of waterAreas covered by land-wide liquid water, including rivers, lakes, reservoirs, pits, etc.
mudflatThe area of tide that separates a coastal high tide’s high and low tide levels and the land between the water level of the river or lake during the flat-water period and the level of the water level during the flooding period.
Non-water ecological spacewoodlandRefers to forestry land with trees, shrubs, bamboo, and coastal mangroves.
grasslandsRefers to all kinds of grasslands where the predominant flora is herbaceous with a coverage of five percent or above. This includes pasture-dominated scrub grasslands and open grasslands with a closure of less than ten percent.
unutilized landCurrently unutilized land, including bare land, bare rock.
Production space plow landCropland includes ripe land, recently opened land, recreational land, rotation land, and grassland rotation cropland; it is mostly used to cultivate crops for forestry, agriculture, fruit, and mulberry.
Living space urban, rural, industrial, mining, and residential landRefers to both urban and rural settlements as well as the land outside of them that is utilized for mining, industry, transportation, etc.
Table 3. Landscape index selection.
Type of IndicatorIndex NameIndex Name
Type levelPercentage of patches in landscape area (PLAND)Percentage of the overall landscape area occupied by one type of patch in the landscape.
Landscape shape index (LSI)The degree of aggregation or disaggregation of patches in the landscape.
Landscape levelShannon diversity index (SHDI)Reflects the richness and diversity of patch types in the landscape.
Aggregation index (AI)Indicates the degree of aggregation of different patch types.
Shannon homogeneity index (SHEI)Indicates changes in diversity across landscapes or over time in the same landscape.
Table 4. Spatial area of the Mulan River Basin from 2000 to 2020.
2000 Year2010 Year2020 Year
Space (km2)Percentage of Overall Area Share of Overall Area (%)Space (km2)Percentage of Overall Area Share of Overall Area (%)Space (km2)Percentage of Overall Area Share of Overall Area (%)
Water ecological space27.521.31%36.2791.73%33.101.58%
Non-water ecological space1305.1962.29%1287.9161.46%1284.1961.29%
Living space101.014.28%156.937.49%201.919.64%
Production space661.6631.58%614.2629.31%576.1927.50%
Table 5. Primary data of standard elliptic difference in the Mulan River Basin from 2000 to 2020.
PLESArea/km2LongitudeDimensionShort Axis/kmLong Axis/kmAzimuth/°
2000Production space955.12137.8327.6423.2213.1080.92
Non-water ecological space732.20138.7227.5624.049.7080.61
Water ecological space675.24139.0027.5721.4010.0564.51
Living space876.90139.3027.5926.4610.5177.15
2010Production space1010.100964137.9827.6324.3213.2281.40
Non-water ecological space732.74138.6827.5623.689.8580.85
Water ecological space581.10139.1127.5818.679.9163.01
Living space998.76139.0327.5927.7011.4579.36
2020Production space1025.77138.0027.6324.7113.2279.42
Non-water ecological space728.78138.6427.5623.529.8681.36
Water ecological space600.94139.1227.5719.679.7264.41
Living space1014.23138.9327.5827.8211.6180.94
Table 6. The spatial transfer matrix of three generations in the Mulan River Basin.
2000–2020 (km2)Production SpaceNon-Water Ecological SpaceWater Ecological SpaceLiving SpaceTotal
Production space574.361.674.4881.14661.66
Non-water ecological spaces1.151281.741.4520.841305.18
Water ecological space0.010.3126.460.7527.52
Living space0.660.470.6999.18101.01
Total576.181284.1933.09201.912095.37
Table 7. Detection results of driving factors of PLES spatial evolution in the Mulan River Basin.
PLES Impact FactorProduction SpaceNon-Water Ecological SpaceWater Ecological SpaceLiving Space
qpqpqpqp
Mean slope (X1)0.3850.0000.3340.0000.0500.1590.0950.000
Mean altitude (X2)0.5070.0000.4620.0000.0400.1300.1020.000
Mean temperatures (X3)0.4850.0000.4490.0000.1040.0110.0920.000
Mean sunshine hours (X4)0.0290.0000.0330.0000.3540.0000.0110.000
Mean precipitation (X5)0.4230.0000.4130.0000.1260.0050.0750.000
GDP (X6)0.3180.0000.2870.0000.3340.0000.0590.000
Mean population density (X7)0.4230.0000.4130.0000.3350.0000.0750.000
Nighttime lights (X8)0.4180.0000.3400.0000.0960.0460.1660.000
Disclaimer/Publisher’s Note: The statements, opinions and data contained in all publications are solely those of the individual author(s) and contributor(s) and not of MDPI and/or the editor(s). MDPI and/or the editor(s) disclaim responsibility for any injury to people or property resulting from any ideas, methods, instructions or products referred to in the content.

