
Risk and Energy Based Optimization for Fire Monitoring System in Utility Tunnel Using Cellular Automata

 ,
, 
Abstract
:1. Introduction
2. Methodology
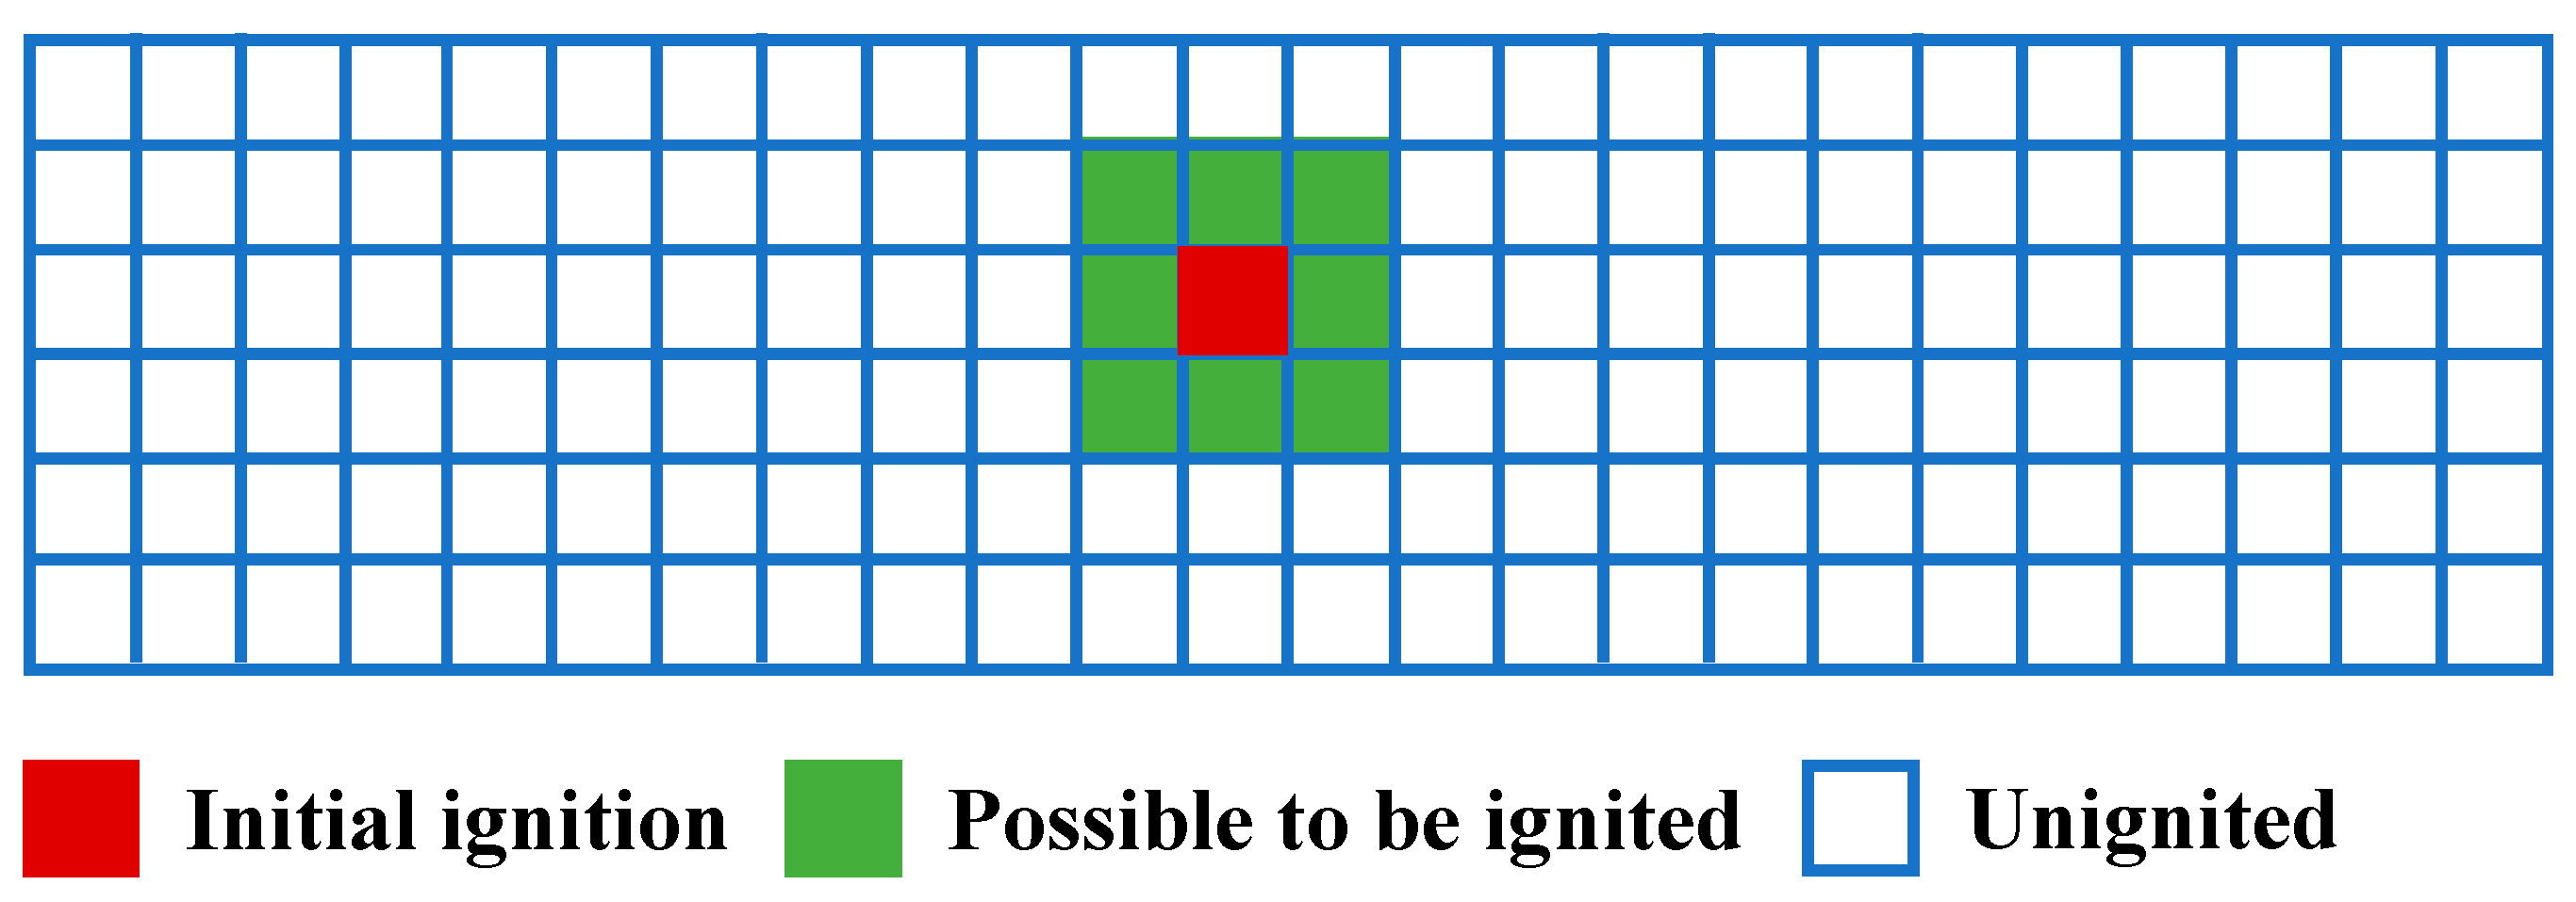
2.1. Fire Simulation
2.2. Design Variables
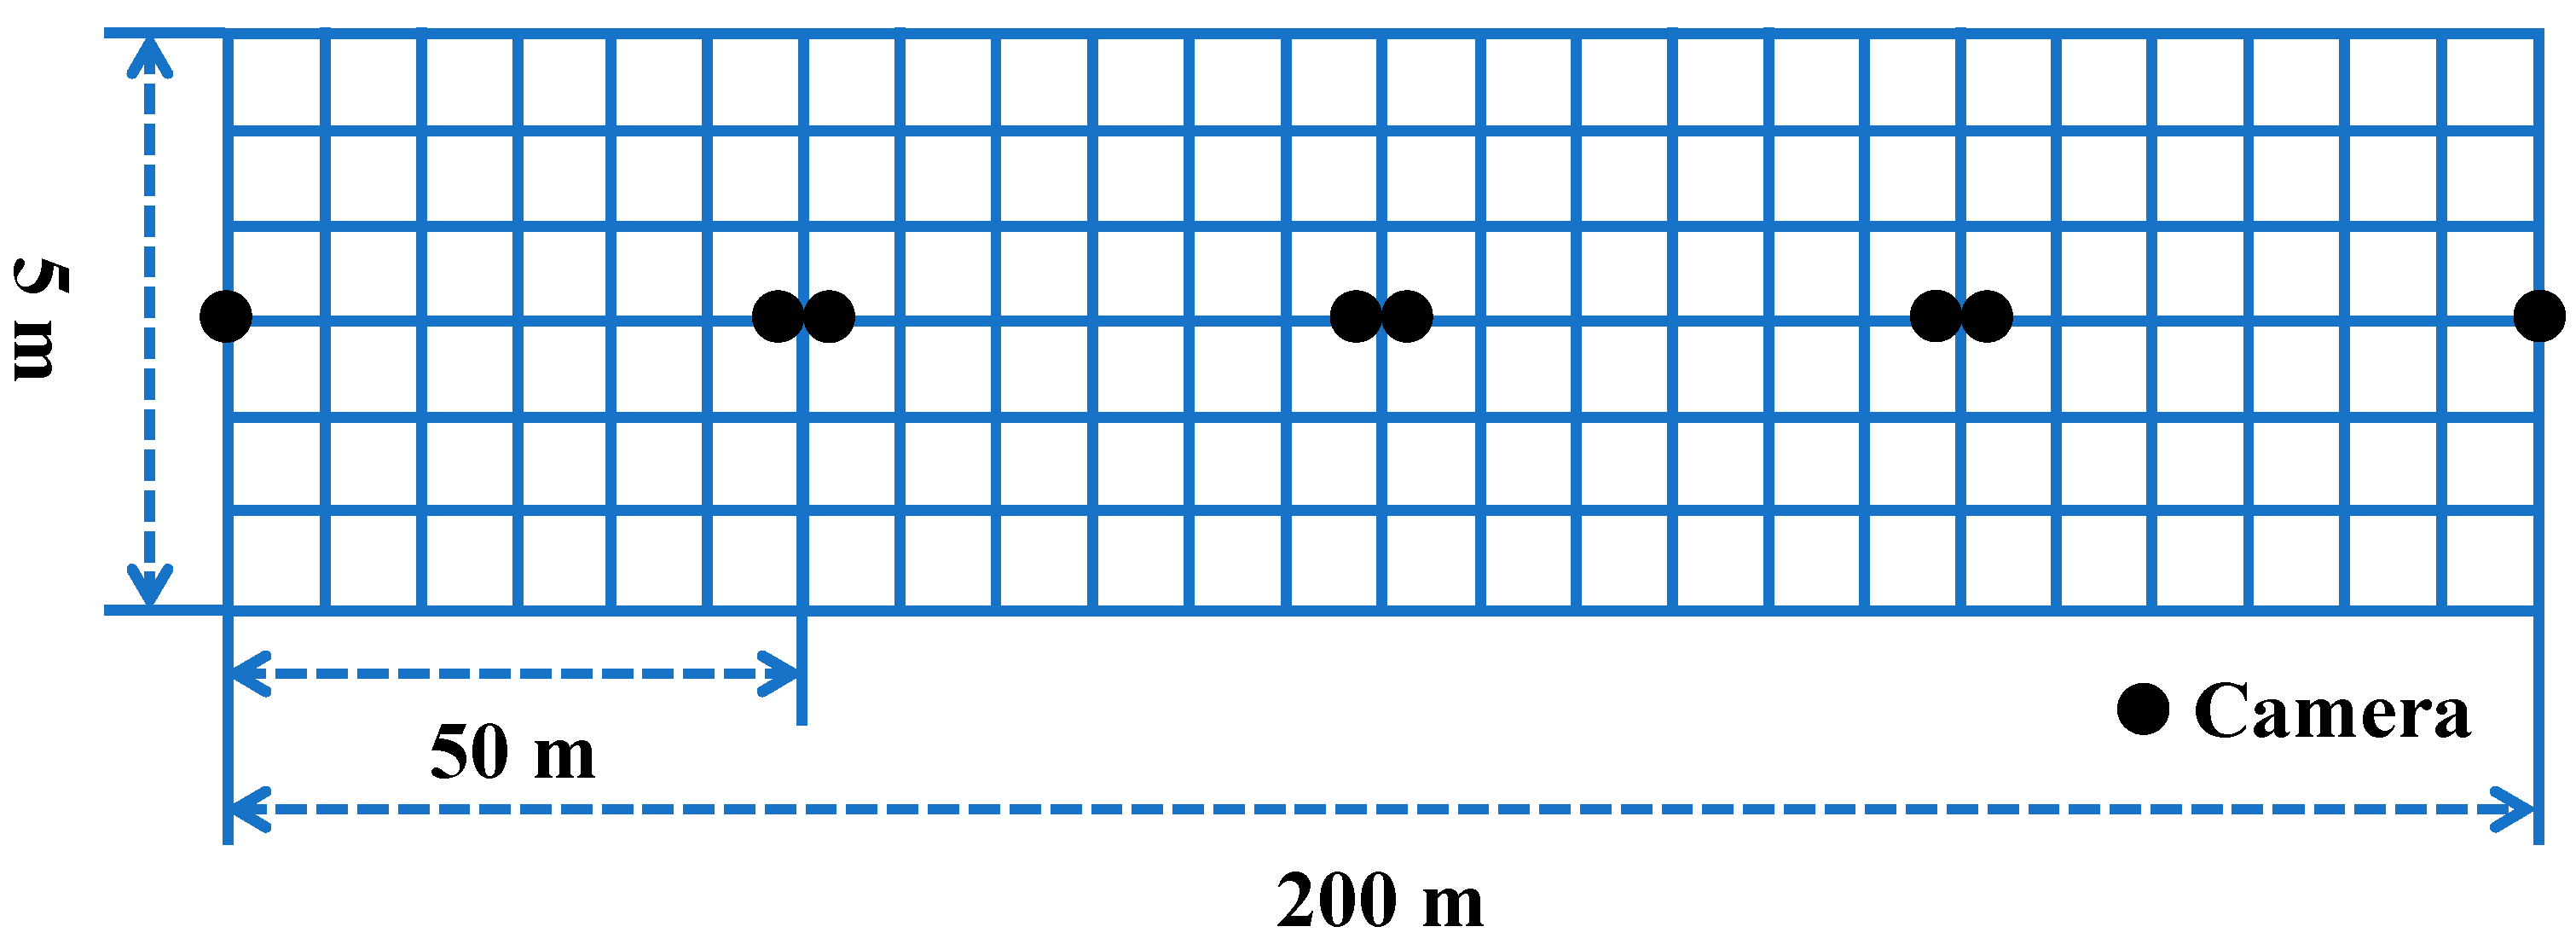
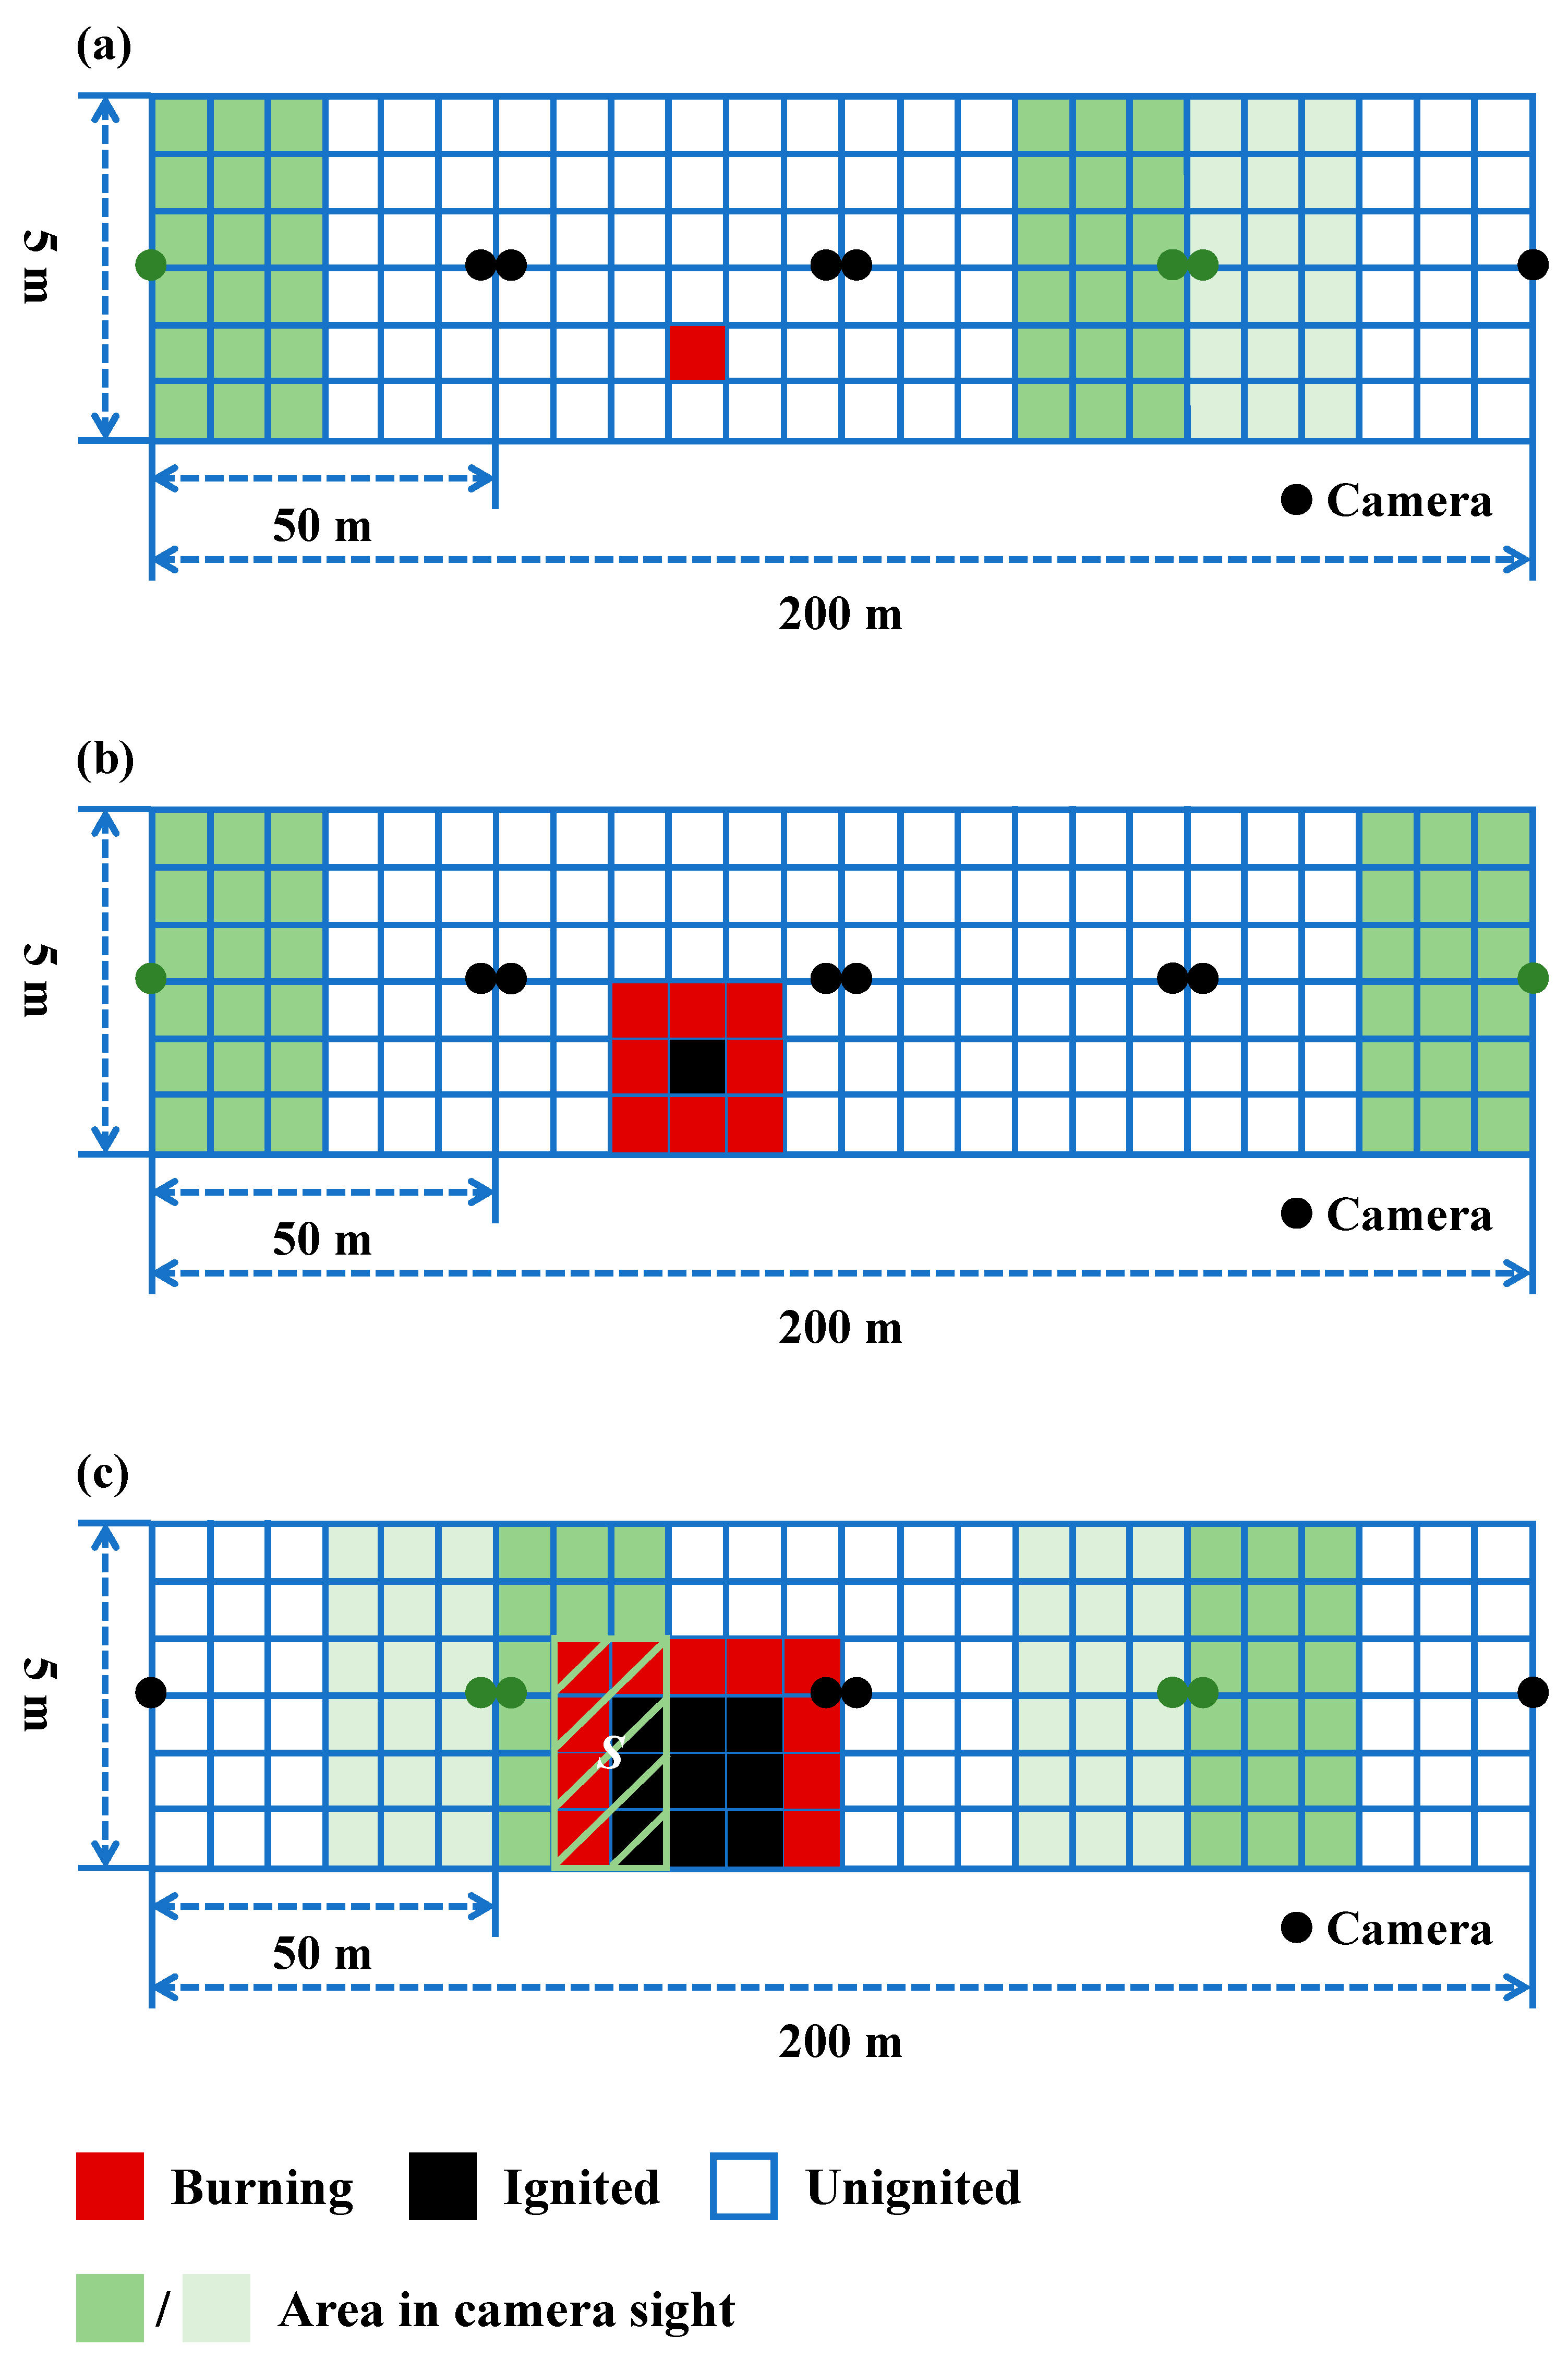
2.3. Experimental Setup
3. Results and Discussion
3.1. Fire Risk
3.1.1. Cases with Blind Monitoring Area (R < 25 m)
3.1.2. Cases with Tangent Monitoring Area (R = 25 m)
3.1.3. Cases with Overlapping Monitoring Area (R > 25 m)
3.2. Energy Consumption
3.2.1. Cases with Blind Monitoring Area (R < 25 m)
3.2.2. Cases with Tangent Monitoring Area (R = 25 m)
3.2.3. Cases with Overlapping Monitoring Area (R > 25 m)
3.3. Optimal Design
3.3.1. Number of Cameras in Simultaneous Operation (N)
3.3.2. Camera Sight (R)
3.3.3. Duration of Camera Operation (T)
4. Conclusions
- (1)
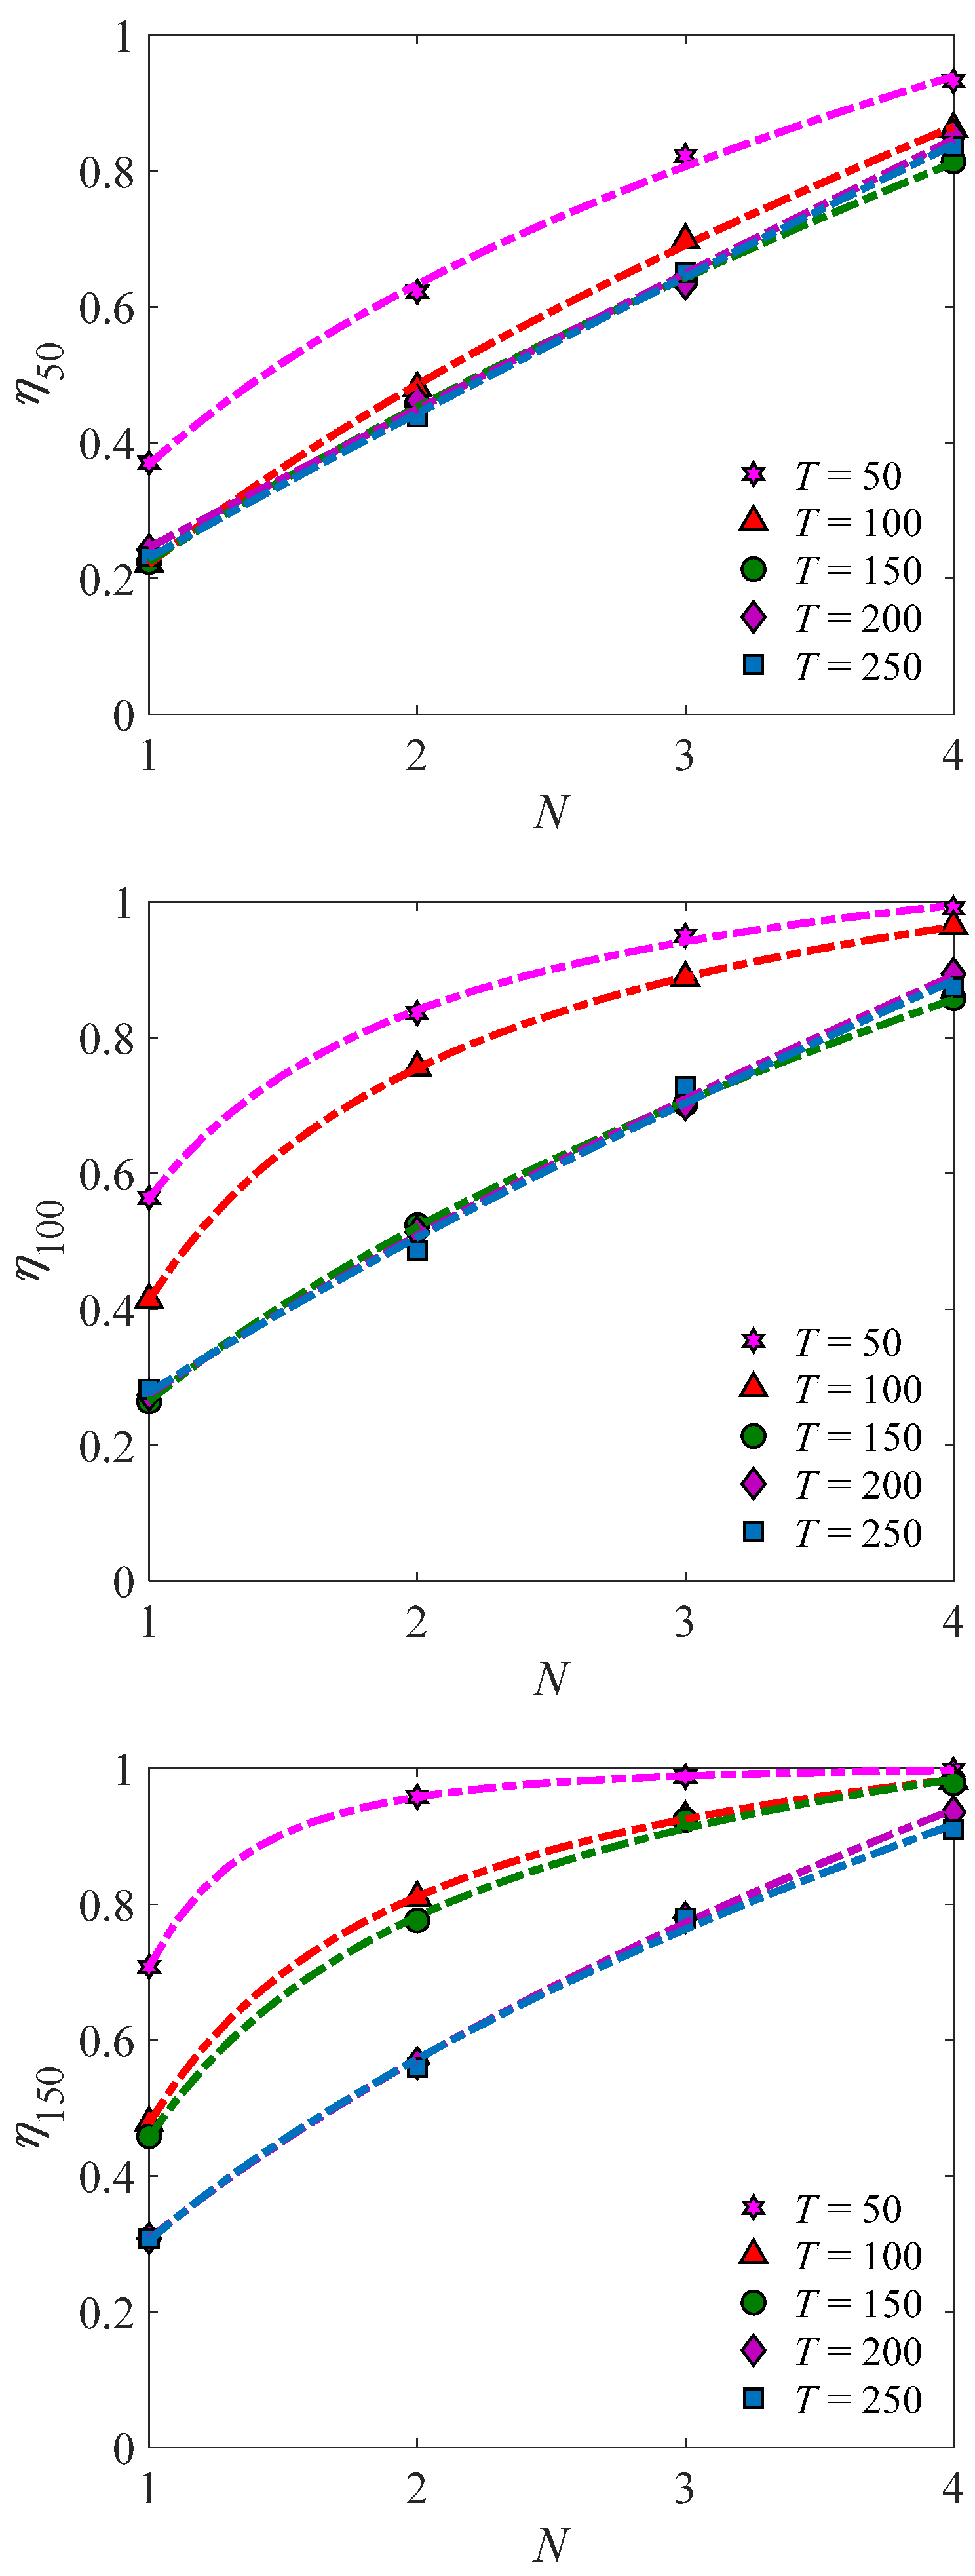
- As the number of cameras in simultaneous operation increases, the probability of fire capture also increases, but the increasing rate gradually slows down, which is especially obvious for the cases with lower T values. Such a correlation can be well described with a power model. A lower T value can lead to higher probability of fire capture, and the probability of fire capture for a T value less than or equal to the allowable time is significantly higher than that for a T value larger than the allowable time. While for a T value greater than the allowable time, the probability is roughly the same. Increasing the camera sight can increase the probability of fire finding. But when there is no blind monitoring area, continuous increase in camera sight contributes little to the increase of the probability.
- (2)
- As the duration of camera operation increases, the total energy consumption of the monitoring system also increases, and the relation can be described with a hyperbolic model. Using one camera at a time consumes much more energy than using multiple cameras simultaneously, and the more of the cameras in simultaneous operation, the lower is the energy consumption. However, when the number of cameras in simultaneous operation exceeds one (N > 1), the difference in total energy consumption is not that significant. Increasing the camera sight can effectively reduce the total energy consumption when a blind monitoring area exists. But once the camera sight has increased to form a tangent monitoring area, continuous increase in camera sight will not save more energy.
- (3)
- The optimal design for the discussed case is suggested to be two cameras in simultaneous operation with a camera sight of 25 m (i.e., a tangent monitoring area). The duration of camera operation should be as short as possible, at least shorter than the allowable time.
Author Contributions
Funding
Institutional Review Board Statement
Informed Consent Statement
Data Availability Statement
Conflicts of Interest
References
- Kim, H.; Lee, M.; Jung, W.-S.; Oh, S.-H. Temperature monitoring techniques of power cable joints in underground utility tunnels using a fiber Bragg grating. ICT Express 2022, 8, 626–632. [Google Scholar] [CrossRef]
- Wang, W.; Zhu, Z.; Jiao, Z.; Mi, H.; Wang, Q. Characteristics of fire and smoke in the natural gas cabin of urban underground utility tunnels based on CFD simulations. Tunn. Undergr. Space Technol. 2021, 109, 103748. [Google Scholar] [CrossRef]
- He, F.; Chen, J.; Li, C.; Xiong, F. Temperature tracer method in structural health monitoring: A review. Measurement 2022, 200, 111608. [Google Scholar] [CrossRef]
- Lin, C.L.; Chien, C.F. Lessons learned from critical accidental fires in tunnels. Tunn. Undergr. Space Technol. 2021, 113, 103944. [Google Scholar] [CrossRef]
- Bai, J.; Diao, Y.; Jia, C.; Liu, C.; Zhang, M.; Wang, C. A review of advances in triaxial tests: Instruments, test techniques and prospects. KSCE J. Civ. Eng. 2022, 26, 3325–3341. [Google Scholar] [CrossRef]
- Zhu, R.; Fang, J.; Li, S.; Wang, Q.; Xu, H.; Xue, J.; Yu, H. Vehicle re-identification in tunnel scenes via synergistically cascade forests. Neurocomputing 2020, 381, 227–239. [Google Scholar] [CrossRef]
- Wang, X.; Tan, Y.; Zhang, T.; Zhang, J.; Yu, K. Diffusion process simulation and ventilation strategy for small-hole natural gas leakage in utility tunnels. Tunn. Undergr. Space Technol. 2020, 97, 103276. [Google Scholar] [CrossRef]
- Bian, H.; Zhu, Z.; Zang, X.; Luo, X.; Jiang, M. A CNN based anomaly detection network for utility tunnel fire protection. Fire 2022, 5, 212. [Google Scholar] [CrossRef]
- Loveček, T.; Boroš, M.; Mäkká, K.; Mariš, L. Designing of Intelligent Video-Surveillance Systems in Road Tunnels Using Software Tools. Sustainability 2023, 15, 5702. [Google Scholar] [CrossRef]
- Lin, C.; Zhang, C.-L.; Chen, J.-H. Optimal arrangement of structural sensors in soft rock tunnels based industrial IoT applications. Comput. Commun. 2020, 156, 159–167. [Google Scholar] [CrossRef]
- Liu, X.; Sun, B.; Xu, Z.-D.; Liu, X. An adaptive Particle Swarm Optimization algorithm for fire source identification of the utility tunnel fire. Fire Saf. J. 2021, 126, 103486. [Google Scholar] [CrossRef]
- Liu, X.; Sun, B.; Xu, Z.-D.; Liu, X.; Xu, D. Identification of multiple fire sources in the utility tunnel based on a constrained particle swarm optimization algorithm. Fire Technol. 2022, 58, 2825–2845. [Google Scholar] [CrossRef]
- Liu, X.; Sun, B.; Xu, Z.-D.; Liu, X.; Xu, D. An intelligent fire detection algorithm and sensor optimization strategy for utility tunnel fires. J. Pipeline Syst. Eng. Pract. 2022, 13, 04022009. [Google Scholar] [CrossRef]
- Liu, X.; Xu, Z.-D.; Sun, B.; Liu, X.; Xu, D. Smart prediction for tunnel fire state evolution based on an improved fire simulation curve through particle swarm optimization algorithm. Fire Saf. J. 2023, 136, 103763. [Google Scholar] [CrossRef]
- Sun, B.; Liu, X.; Xu, Z.-D.; Xu, D. Temperature data-driven fire source estimation algorithm of the underground pipe gallery. Int. J. Therm. Sci. 2022, 171, 107247. [Google Scholar] [CrossRef]
- Jiang, H.; Zhao, Y.; Wang, C.; Cui, L. A DIDE-FPP Composite Algorithm for Accurate Tunnel Fire Location. Photonics 2023, 10, 272. [Google Scholar] [CrossRef]
- Zhang, X.; Wu, X.; Park, Y.; Zhang, T.; Huang, X.; Xiao, F.; Usmani, A. Perspectives of big experimental database and artificial intelligence in tunnel fire research. Tunn. Undergr. Space Technol. 2021, 108, 103691. [Google Scholar] [CrossRef]
- Wu, X.; Zhang, X.; Jiang, Y.; Huang, X.; Huang, G.G.; Usmani, A. An intelligent tunnel firefighting system and small-scale demonstration. Tunn. Undergr. Space Technol. 2022, 120, 104301. [Google Scholar] [CrossRef]
- Yuan, W.; Ji, W.; Zhang, J.; Du, T.; Yuan, Y. Examining smoke control in fires occurring in railroad tunnels: A review. J. Therm. Anal. Calorim. 2024, 149, 13–39. [Google Scholar] [CrossRef]
- Li, H.; Chen, Z.; Lu, Y.; Li, P.; Wang, Q.-A.; Liu, Z.; Li, S. Research on Intelligent Monitoring of Fire Safety and Fire Rescue Plan for Tunnel Operation under Quasi-Unattended Background. Buildings 2023, 13, 2110. [Google Scholar] [CrossRef]
- Liu, G.; Meng, H.; Qu, G.; Wang, L.; Ren, L.; Lu, H. Real-time monitoring and prediction method of commercial building fire temperature field based on distributed optical fiber sensor temperature measurement system. J. Build. Eng. 2023, 70, 106403. [Google Scholar] [CrossRef]
- Jiang, H.; Wang, C.; Zhao, Y.; Tang, R. A fast wavelength detection method based on OTDR and 1-DDCNN in series overlapping spectra. Opt. Fiber Technol. 2023, 80, 103458. [Google Scholar] [CrossRef]
- Zhang, X.; Wu, X.; Huang, X. Smart real-time forecast of transient tunnel fires by a dual-agent deep learning model. Tunn. Undergr. Space Technol. 2022, 129, 104631. [Google Scholar] [CrossRef]
- Sun, B.; Liu, X.; Xu, Z.-D.; Xu, D. BP neural network-based adaptive spatial-temporal data generation technology for predicting ceiling temperature in tunnel fire and full-scale experimental verification. Fire Saf. J. 2022, 130, 103577. [Google Scholar] [CrossRef]
- He, Q.; Cao, Z.; Tang, F.; Gu, M.; Zhang, T. Experimental analysis and machine learning research on tunnel carriage fire spread and temperature evolution. Tunn. Undergr. Space Technol. 2023, 133, 104940. [Google Scholar] [CrossRef]
- Guo, C.; Guo, Q.; Zhang, T.; Li, W.; Zhu, H.; Yan, Z. Study on real-time heat release rate inversion for dynamic reconstruction and visualization of tunnel fire scenarios. Tunn. Undergr. Space Technol. 2022, 122, 104333. [Google Scholar] [CrossRef]
- Wu, X.; Park, Y.; Li, A.; Huang, X.; Xiao, F.; Usmani, A. Smart detection of fire source in tunnel based on the numerical database and artificial intelligence. Fire Technol. 2021, 57, 657–682. [Google Scholar] [CrossRef]
- Zhang, Z.; Wang, L.; Liu, S.; Yin, Y. Intelligent fire location detection approach for extrawide immersed tunnels. Expert Syst. Appl. 2024, 239, 122251. [Google Scholar] [CrossRef]
- Wang, Q.; Jiang, X.; Park, H.; Wang, M. HGV fire risk assessment method in highway tunnel based on a Bayesian network. Tunn. Undergr. Space Technol. 2023, 140, 105247. [Google Scholar] [CrossRef]
- Bai, Y.; Wu, J.; Yuan, S.; Reniers, G.; Yang, M.; Cai, J. Dynamic resilience assessment and emergency strategy optimization of natural gas compartments in utility tunnels. Process Saf. Environ. Prot. 2022, 165, 114–125. [Google Scholar] [CrossRef]
- Zhou, K.; Li, F.; Cai, H.; Jing, Y.; Zhuang, J.; Li, M.; Xing, Z. Estimation of the natural gas leakage source with different monitoring sensor networks in an underground utility Tunnel: From the perspectives of energy security. Energy Build. 2022, 254, 111645. [Google Scholar] [CrossRef]
- Zeng, P.; He, J.; Gao, B. Reliable robot-flock-based monitoring system design via a mobile wireless sensor network. IEEE Access 2021, 9, 47125–47135. [Google Scholar] [CrossRef]
- Wu, J.; Cai, J.; Liu, Z.; Yuan, S.; Bai, Y.; Zhou, R. BI-IEnKF coupling model for effective source term estimation of natural gas leakage in urban utility tunnels. Tunn. Undergr. Space Technol. 2023, 136, 105080. [Google Scholar] [CrossRef]
- Rinaudo, P.; Paya-Zaforteza, I.; Calderón, P.A. Improving tunnel resilience against fires: A new methodology based on temperature monitoring. Tunn. Undergr. Space Technol. 2016, 52, 71–84. [Google Scholar] [CrossRef]
- Li, Y.Z.; Ingason, H. Parametric study of design fires for tunnels with water-based fire suppression systems. Fire Saf. J. 2021, 120, 103107. [Google Scholar] [CrossRef]
- Wan, H.; Xiao, Y.; Wei, S.; Zhang, Y. Performance of ceiling jet induced by dual unequal strong plumes in a naturally ventilated tunnel. Appl. Therm. Eng. 2022, 211, 118447. [Google Scholar] [CrossRef]
- Król, A.; Król, M. Numerical investigation on fire accident and evacuation in a urban tunnel for different traffic conditions. Tunn. Undergr. Space Technol. 2021, 109, 103751. [Google Scholar] [CrossRef]
- Glasa, J.; Valasek, L.; Weisenpacher, P.; Kubisova, T. Improvement of Modeling Velocity of Airflow Created by Emergency Ventilation in a Road Tunnel Using FDS 6. Appl. Sci. 2023, 13, 2762. [Google Scholar] [CrossRef]
- Han, J.; Wang, Z.; Geng, P.; Wang, F.; Wen, J.; Liu, F. The effect of blockage and tunnel slope on smoke spread and ceiling temperature distribution in a natural-ventilated metro depot. Energy Build. 2021, 253, 111540. [Google Scholar] [CrossRef]
- Kallianiotis, A.; Papakonstantinou, D.; Tolias, I.C.; Benardos, A. Evaluation of fire smoke control in underground space. Undergr. Space 2022, 7, 295–310. [Google Scholar] [CrossRef]
- Zhang, X.; Chen, L.; Jiang, J.; Ji, Y.; Han, S.; Zhu, T.; Xu, W.; Tang, F. Risk analysis of people evacuation and its path optimization during tunnel fires using virtual reality experiments. Tunn. Undergr. Space Technol. 2023, 137, 105133. [Google Scholar] [CrossRef]
- Bai, J.; Zhang, S.; Liang, J.; Zhao, Y.; Li, W.; Diao, Y.; Shang, D. A systematic design method for green buildings based on the combined system of flexible solar cells and reactors on buildings. Build. Environ. 2022, 209, 108657. [Google Scholar] [CrossRef]
- Xu, J.; Chang, F.; Bai, J.; Liu, C. Statistical analysis on the fracture behavior of rubberized steel fiber reinforced recycled aggregate concrete based on acoustic emission. J. Mater. Res. Technol. 2023, 24, 8997–9014. [Google Scholar] [CrossRef]
- Bai, J.; Wang, C.; Zhang, M.; Diao, Y. A review on drainage of dredged marine soils: Advances and prospects. Mar. Georesources Geotechnol. 2024, 1–11. [Google Scholar] [CrossRef]
- Ouyang, K.; Wang, C.; Li, X.; Xue, F. Analysis of current situation of energy consumption and energy saving potential of a utility tunnel. Heat. Vent. Air Cond. 2022, 52, 53–58. [Google Scholar]


| Design Variables | Values |
|---|---|
| 15 m | |
| 20 m | |
| 25 m | |
| 30 m | |
| 35 m | |
| 1 | |
| 2 | |
| 3 | |
| 4 | |
| 50 Step | |
| 100 Step | |
| 150 Step | |
| 200 Step | |
| 250 Step |
Disclaimer/Publisher’s Note: The statements, opinions and data contained in all publications are solely those of the individual author(s) and contributor(s) and not of MDPI and/or the editor(s). MDPI and/or the editor(s) disclaim responsibility for any injury to people or property resulting from any ideas, methods, instructions or products referred to in the content. |
© 2024 by the authors. Licensee MDPI, Basel, Switzerland. This article is an open access article distributed under the terms and conditions of the Creative Commons Attribution (CC BY) license (https://creativecommons.org/licenses/by/4.0/).
Share and Cite
Zhang, Y.; Bai, J.; Diao, Y.; Chen, Z.; Wang, C.; Yang, K.; Gao, Z.; Wei, H. Risk and Energy Based Optimization for Fire Monitoring System in Utility Tunnel Using Cellular Automata. Sustainability 2024, 16, 4717. https://doi.org/10.3390/su16114717
Zhang Y, Bai J, Diao Y, Chen Z, Wang C, Yang K, Gao Z, Wei H. Risk and Energy Based Optimization for Fire Monitoring System in Utility Tunnel Using Cellular Automata. Sustainability. 2024; 16(11):4717. https://doi.org/10.3390/su16114717
Chicago/Turabian StyleZhang, Ying, Jitao Bai, Yu Diao, Zhonghao Chen, Chu Wang, Kun Yang, Zeng Gao, and Huajie Wei. 2024. "Risk and Energy Based Optimization for Fire Monitoring System in Utility Tunnel Using Cellular Automata" Sustainability 16, no. 11: 4717. https://doi.org/10.3390/su16114717
APA StyleZhang, Y., Bai, J., Diao, Y., Chen, Z., Wang, C., Yang, K., Gao, Z., & Wei, H. (2024). Risk and Energy Based Optimization for Fire Monitoring System in Utility Tunnel Using Cellular Automata. Sustainability, 16(11), 4717. https://doi.org/10.3390/su16114717