Abstract
The rise of the e-commerce industry has markedly changed the global economy, providing customers with unparalleled access to goods and services. This study empirically examines online shoppers’ perceptions and preferences, focusing on their experiences with last-mile delivery (LMD) services and its impact on their shopping behaviour. This research employs machine learning classification and regression models for a large-scale analysis of customers’ responses, collected using an online survey in the main cities in Saudi Arabia, which is experiencing rapid e-commerce growth amidst a broader digital transformation. The findings highlight a strong consumer preference for timely LMD services, typically within a day of purchase, while noting dissatisfaction with exceedingly early delivery windows. The research emphasises the need to address customer dissatisfaction with delivery services to retain clientele, as many may switch retailers without informing the retailers. Additionally, a considerable trend towards preferring digital over cash-on-delivery payment methods was observed among online shoppers. Overall, this study provides valuable insights into the significant influence of LMD services on customer satisfaction and behaviour in the e-commerce sector. The use of robust machine learning models has revealed critical factors that can guide retailers and LMD providers in enhancing service delivery and customer experience, contributing to the broader discourse on e-commerce logistics efficiency and customer satisfaction.
1. Introduction
The value creation of e-commerce hinges on its providing a positive experience to online customers [1]. In the face of intensifying rivalry among e-commerce platforms, it is imperative to examine the elements that impact customers’ buying process, and failure to do so may risk businesses losing their clientele to rival competitors [2,3]. This is especially relevant as repeat purchases from the same consumer are always desirable. Attracting new consumers is more cost-intensive from the perspective of an e-commerce platform [4]. The authors of [5] investigated factors affecting e-shopping behaviour in Bangladesh using structural equation modelling and artificial neural networks, and found that trust, habit, and intention significantly impact e-shopping behaviour. The authors of [6] explored how delivery attributes like time, fees, and reception impact e-consumer behaviour in Brazil, finding that factors like age, gender, and product type influence the importance of these attributes in e-shopping decisions.
The surge in online shopping has significantly increased the demand for last-mile delivery (LMD) services, which are a crucial element of the online retail experience [7]. LMD’s role in shaping online purchasing decisions is pivotal, with customer satisfaction with delivery services being a key influencer [8]. Moreover, LMD experience acts as a mediator between the online shopping journey and overall customer satisfaction [9,10]. Customer inclination towards online shopping is influenced by the perceived usefulness of and positive attitudes towards online shopping [11], where the quality of LMD services, including the delivery speed, tracking options, and variety of delivery locations, plays a significant role [12]. However, the exact relationship between these factors and overall LMD and online shopping satisfaction remains to be fully explored. This area requires further research, as indicated by recent calls to understand the retail experience in customer journey management and to map customer behaviour specifically in the LMD context [13,14].
This study shifts focus from well-established e-commerce markets to the emerging economy of Saudi Arabia, where e-commerce is rapidly growing, especially post-COVID-19, amidst digital transformations [15]. The existing literature indicates a discernible dearth of research concerning the potential determinants of Saudi Arabian online shopping practices [16]. With the largest economy in the Middle East and North Africa region, one of the highest internet penetrations globally, and a recent surge in cashless payments, Saudi Arabia presents a unique case for study [17,18]. Although traditional brick-and-mortar stores continue to enjoy a high degree of popularity amongst Saudi consumers, there has been an observable uptick in e-commerce transactions in the aftermath of the COVID-19 pandemic [19].
The research aims to empirically examine online shoppers’ perceptions, focusing on last-mile delivery (LMD) services and their impact on shopping behaviours. The study objectives are to explore online purchasing habits, understand customer preferences and expectations for LMD in relation to its perceived quality, and investigate factors driving satisfaction with LMD services and their influence on future purchasing intentions. This approach aims to contribute novel insights into the behavioural attributes of e-commerce customers in Saudi Arabia.
To achieve these objectives, customer responses, collected using an online survey in Saudi Arabia, were analysed using machine learning classification and regression models. These models were adept at capturing non-linear relationships, handling multi-collinearity, and providing robust results amidst outliers and data noise. While this is not the first empirical study on LMD experiences, this study contributes to the existing knowledge and provides practical and useful insights in the following ways. First, the comprehensive nature of the questionnaire not only enabled factors related to customer propensity for online shopping to be captured, but also facilitated the assessment of factors influencing the quality of LMD services and customer satisfaction in this context. Second, its focus on an emerging economy adds to the logistics and retail literature, aligning with recent calls for more emerging market data, as highlighted by the authors of [20]. Third, its large scale provides statistical power to confirm or disprove some of the results from smaller-scale surveys. Finally, the machine learning models used in this study provide more robust results compared to traditional models.
This study makes several distinct contributions to the literature and practice regarding e-commerce in emerging markets, particularly within the context of Saudi Arabia. Firstly, it empirically investigates how the quality of LMD services influences customer satisfaction and future purchasing intentions, offering a comprehensive analysis of factors like delivery speed, tracking capabilities, and the variety of delivery options. Secondly, the findings illuminate the growing consumer expectations for rapid product delivery and the shift towards non-cash payment methods, which are critical for e-commerce businesses aiming to enhance customer retention and loyalty. Thirdly, by employing advanced machine learning techniques, this study provides a nuanced understanding of non-linear relationships and interaction effects that traditional statistical models might overlook, thus offering more robust and actionable insights. Finally, the research offers practical recommendations for improving LMD services, such as the implementation of personalised delivery options and the importance of real-time tracking. These contributions are not only relevant for the academic community but also provide valuable guidelines for e-retailers and policymakers in emerging markets striving to optimise their e-commerce strategies in the post-pandemic era.
The paper is structured as follows. Section 2 provides an overview of the relevant literature on customers’ preferences and requirements regarding LMD. Section 3 briefly describes the data and the modelling approaches applied in the study, and Section 4 presents the modelling results and analysis. Section 5 discusses the main takeaways and policy implications, while Section 6 provides concluding remarks.
2. Literature Review
The attitudinal and behavioural factors pertaining to online shopping trends have been documented in the literature. Online shopping engagement and the extent of online shopping are notably influenced by perceived usefulness and a positive attitude towards online shopping [11]. Contemporary studies show that perceived usefulness, convenience, and ease of use significantly impact online shopping decisions, with perceived risks playing a less dominant role [21,22]. The authors of [23] explored consumer acceptance of last-mile delivery methods in e-commerce, finding that ease of use and usefulness are pivotal, while perceived costs limit acceptance, with significant variations across environmental, economic, and social sustainability factors. With new digital platforms, customers’ online shopping intentions, satisfaction, and usage have increased, aided by a variety of digital payment methods [24]. For instance, credit card usage has boosted spending and online purchasing [25].
Notwithstanding the myriad advantages inherent to online shopping, a contingent of consumers may harbour reservations pertaining to its perceived risks and perceived lack of trustworthiness [26]. This apprehension is, however, counterbalanced by the enticements offered by ancillary services, notably encompassing complimentary shipping, cash-on-delivery modalities, and adaptable protocols for product exchange and returns. Moreover, it is noteworthy that a subset of individuals who have engaged in online shopping have encountered predicaments, including the receipt of compromised or substandard merchandise, instances of counterfeit deliveries, logistical impediments, or the regrettable circumstance of non-receipt of duly ordered products [27]. The delivery of substandard or damaged goods can significantly undermine the comprehensive worth of the entire supply chain operation, thereby influencing customer satisfaction and potential future purchase decisions [28]. Extending that line of research, this study explicitly considers how a bad delivery outcome affects customer perceptions of the LMD’s quality as well as how this experience translates into their attitude towards the retailer.
The fundamental purpose intrinsic to the sphere of LMD resides in the speedy delivery of goods, a mandate characterised by the dual objectives of optimising profit margins and simultaneously reaching the benchmark of customer satisfaction [29]. Within the purview of retail enterprises, the endeavour of managing the surging influx of parcels within urban agglomerations, a task intermediated by the prism of last-mile logistics, is progressively encumbered by the multifaceted requisites and complex dynamics entailed in the realm of omnichannel retailing. During the LMD phase, the service experience can significantly influence the overall satisfaction of the end consumers [12]. The authors of [30] explored the influence of service expectations on last-mile delivery in Brazil, revealing cost and tracking as critical factors, with smart lockers being the preferred means of enhancing customer satisfaction in delivery services. There are several key factors embedded in a convenient LMD experience for a customer, such as same-day delivery service, delivery being made available at convenient time slots, pick-up facilities from nearby stores, the digital tracking of shipments, and option for “free returns” of shipments. Building on that literature, this article further investigates whether and how these factors affect the customer’s perception of LMD quality and their satisfaction with LMD services.
Contemporary empirical evidence substantiates the pivotal role played by the delivery lead time and its interplay with consumer buying behaviour in shaping the customer experience and overall satisfaction [31]. This complex relationship reverberates across multiple facets, not only encompassing the cognitive aspect but also covering the behavioural as well as emotional dimensions of a customer receiving a delivery service for desired products or goods [32]. As such, a thorough understanding of the intricate interconnections between delivery lead time, consumer behaviour, and the resulting customer experience is imperative for businesses and service providers aiming to enhance customer satisfaction and loyalty. At the same time, the relationship between an unsatisfactory delivery outcome and the customer’s likelihood of making repeat purchases from the same retailer is less explored, and thus is a subject of the present study. Exploring innovative solutions for delivery challenges in urban areas, the authors of [33] identified optimal locations for collection-and-delivery points (CDPs) in Christchurch, New Zealand, using a consumer-centric approach that factors in socio-demographic characteristics and suggests supermarkets and dairies as potential CDP locations to encourage active transport like walking and cycling.
Access to information about the order fulfilment process is another key area of customer satisfaction and value creation for online retailers. The latest technological advancements have enabled e-businesses to leverage high-tech tracking technologies to provide the status of the order fulfilment process to their customers in real time [34]. After processing the order, online retailers apprise consumers of anticipated delivery timelines. In the realm of commerce, there are instances where merchants go above and beyond by expediting the shipment of orders before the formally communicated delivery date. Customers receiving later deliveries are keen to provide lower ratings for the chosen e-retailers and, on average, post their ratings on the same day as receipt [35]. Before making purchases, customers take advantage of online reviews and usually have certain ideas about how quickly an e-commerce company will process their orders and deliver them. Consequently, in the present research, the relationship between the delivery updates and the customer’s perception of the quality of LMD services is explicitly tested.
The authors of [36] examined LMD within the broader context of a social–ecological system, identifying strategic orientations—such as digital, people, and learning—that enhance resilience to disruptions like the COVID-19 pandemic. This perspective is critical in understanding how supply chains can adapt to external challenges through stabilisation, adaptation, and transformation strategies. Further emphasising the resilience of supply chains, the authors of [37] employed Google API to analyse disruptions such as traffic and parking issues in urban LMD. Their model, validated using data from diverse cities, including Boston and Bogotá, provides insights into how to manage urban transport systems more efficiently and highlights the importance of robust logistical frameworks during operational disruptions.
The role of social and cultural factors in shaping online shopping preferences is also critical. The authors of [38] explored how socio-behavioural factors, such as attitudes, subjective norms, and perceived behavioural control, significantly predict US consumers’ intentions to choose green delivery options. This study underscores the influence of utilitarian and experiential motivations on e-shopping behaviour, revealing a nuanced understanding of consumer preferences for environmentally friendly delivery solutions. Similarly, the authors of [39] delved into the trade-offs that consumers make between sustainability, speed, and cost in LMD. Their findings suggest that while delivery speed is often prioritised, there is a substantial opportunity to educate consumers about the environmental impacts of their choices, potentially shifting their priorities towards more sustainable practices.
The effectiveness of analytical techniques in e-commerce research is further demonstrated by the authors of [40], who provided a comparative analysis of the use of parcel lockers versus home delivery costs in both urban and rural settings. Their model offers valuable insights into the logistical costs associated with different delivery methods, aiding in strategic decision-making for LMD. In the realm of predictive modelling, the authors of [41] showed how integrating travel-time predictors with order-assignment optimisation can significantly enhance the efficiency of LMD. Their approach, which adapts predictive models to actual delivery operations, highlights the potential of data-driven methodologies to refine operational strategies and improve service delivery performance. The authors of [42] proposed a comprehensive data-driven framework to support decision-making in urban last-mile operations. By integrating diverse analytical techniques such as optimisation, machine learning, and simulation, their methodology addresses the complex challenges of urban distribution in congested cities. This approach not only enhances operational efficiency but also contributes to environmental sustainability, showcasing the dynamic capabilities of data analytics in optimising LMD services.
Within the academic discourse, a corpus of research endeavours has undertaken an evaluative exploration of economic sustainability from the consumer-oriented perspective. For instance, the authors of [43] implemented a novel adaptive choice modelling approach with customers in the US for the first time in logistics research and found that the fiscal outlay entailed by delivery is contingent upon the discernment of the chosen delivery mechanism. The authors of [44] examined the barriers to last-mile delivery adoption in Egypt, identifying complexities, collaboration needs, and technical knowledge as key challenges, with implications for enhancing the logistics, efficiency, and sustainability. A diverse array of delivery modalities is desired, with the preferred options including home-based delivery [45], parcel locker delivery [46], and collection-and-delivery points [47]—all of which are at the disposal of consumers. The availability, viability, and practicability of each of these delivery modalities are related to the economic considerations associated with the labour, investment, and infrastructural costs entailed in their operational realisation. Along these lines, the current research further deepens this discussion by determining which delivery modes are important for the perception of LMD quality and satisfaction with the LMD service.
Incorporating recent studies from developing countries adds valuable perspectives on online shopping behaviours. For instance, the authors of [48] discussed the trade-offs between physical store visits and online deliveries in the post-COVID scenario in New Delhi, highlighting the different consumer preferences and behaviours in an emerging market context. Incorporating a focused discussion on emerging markets, the authors of [49] provided a comprehensive analysis of urban last-mile distribution strategies in these regions, highlighting the unique challenges faced by e-retailers and other participants in the e-commerce supply chain,
In the context of Saudi Arabia, a few consumer behaviour studies have identified a host of potential influences on consumer practices. The author of [50] reported that six key elements can directly contribute to enhancing e-customer loyalty, namely the quality of the website, the level of trust, perceived value, customer satisfaction, customer service quality, and the quality of the product itself. The authors of [51] examined crowd logistics delivery as a solution to the last-mile delivery challenges in Saudi Arabia, revealing economic and social benefits, and cultural challenges in the emerging market context. The authors of [52] suggested that it is crucial for online retail platforms to continuously work on improving the user experience and appropriately address customer concerns. Similarly, the author of [53] discovered that customers’ intention to adopt online shopping is contingent upon the user-friendliness and efficacy of the e-commerce platform. Other significant factors shaping online consumer attitudes in Saudi Arabia, as identified by numerous studies, encompass security, privacy, trust, regulatory clarity, utility, and governmental backing [16,53]. This study extends these findings by focusing on LMD and explicitly identifying which factors are associated with the propensity for online shopping, the quality of LMD services, and customer satisfaction with LMD services.
3. Methods
This section describes the theoretical background, the model specification, and the validation of the selected modelling approach of the responses collected in the online survey. The online survey covered three main lines of inquiry: (1) the purchasing behaviours and practices of online shoppers, (2) the preferences and expectations regarding home delivery services of the different online shoppers in the survey, and (3) the quality of the LMD services and issues found during the LMD. It was developed based on a comprehensive analysis of the relevant literature on customer experience in online shopping and last-mile delivery.
3.1. Survey Design and Sampling Strategy
The online survey targeted online customers in Saudi Arabia’s main cities, employing a stratified random sampling strategy to ensure representation across key demographics (age, gender, household size, and occupational status). This method, based on census data and social media profiles, aimed for a representative adult population sample and prevented overrepresentation [54]. To maximise participation, researchers used methods like emails and personal references, and the survey was offered in both Arabic and English, maintaining participant confidentiality. A total of 1073 responses were collected from the 12 largest cities, achieving a 36% response rate with a 95% confidence interval and a 3% margin of error. The breakdown of participants is presented in Table 1.

Table 1.
Cities of the survey participants.
Figure 1 displays a detailed breakdown of the demographic attributes of the survey participants, highlighting the largest age group, predominant occupational statuses, and common household sizes. The most represented age group is 25–34 years, which mirrors the demographic trend in the study area, where this age group comprises a significant portion of the population. This age group is of particular relevance as they are the most active online shoppers, influencing trends in digital commerce and delivery services.
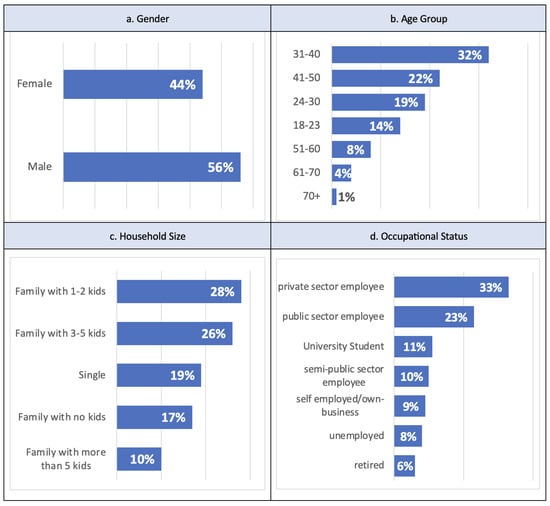
Figure 1.
Demographic attributes of the survey participants.
The data also indicate that a majority are employed in the private sector, offering insights into the consumer base for last-mile delivery services. The survey reveals a common household size of 3–4 members, consistent with regional census figures, which is valuable for customising delivery services to household needs. By aligning the participant profile with the main demographic characteristics of the study’s population, conclusions regarding LMD preferences and challenges are grounded in and reflective of the community’s actual conditions and needs. This approach not only enriches the value of the data but also bolsters the survey’s generalisability.
3.2. Model Description and Specifications
Using the collected survey responses, a confirmatory factor analysis (CFA) with Structural Equation Modelling (SEM) was applied in order to estimate three continuous latent factors: (i) the propensity for online shopping, (ii) the quality of the delivery services, and (iii) the satisfaction with the delivery services related to delivery preferences. Accordingly, the latent factors estimated with SEM were dichotomised to apply classification machine learning (ML) to predict/assign customer profiles. The reason for the dichotomisation is that it allows for a comparison of how the different variables affect two customer groups based on shopping tendencies, perception of service quality, and satisfaction levels. As a robustness check, the ML regression model for continuous dependent variables was also applied.
Our analysis utilises a combination of regression and classification models to best address the research objectives. The Least Absolute Shrinkage and Selection Operator (LASSO) method was chosen for its efficacy in both variable selection and regularisation, which helps prevent overfitting while maintaining model interpretability, a crucial aspect in the context of our study’s objectives. Specifically, a machine learning model based on L1-regularisation (LASSO) was used to identify the most important variables and customer characteristics related to online shopping and quality/satisfaction with delivery services, controlling for demographic variables. Previous studies applied machine learning to analyse LMD [55] and the prediction of online purchases [56]. Detailed specifications of the model setup include the selection of hyperparameters, which were optimised using cross-validation techniques to ensure the model’s accuracy and generalisability. For example, the regularisation strength parameter in LASSO was determined through a grid 311 search, balancing the bias–variance tradeoff to optimise the model’s performance on unseen data.
The LASSO model was selected for the machine learning specification due to its feature selection, regularisation, interpretability, robustness to collinearity, and accurate prediction [57]. LASSO was chosen due to its ability to enhance model interpretability and accuracy by performing both variable selection and regularization. This method is particularly effective in reducing overfitting, a common challenge in statistical modelling, by penalizing the absolute size of the regression coefficients and thereby shrinking some of them to zero. This feature-selection capability of LASSO is invaluable as it helps in identifying the most significant predictors while excluding irrelevant ones, leading to a more interpretable and parsimonious model compared to models that include all predictors. In terms of regularisation, LASSO applies a regularisation term to the model’s objective function, which prevents overfitting. By imposing a penalty regarding the size of the regression coefficients, shrinking them towards zero, LASSO reduces the impact of irrelevant or noisy predictors and improves the model’s generalisability.
The selection of the analytical approach was guided by the specific requirements for model interpretability and the ability to effectively handle the dataset characteristics. While the gradient boosting machine approach is excellent for handling complex datasets with intricate patterns, it tends to be less interpretable due to its complexity. This can be a significant drawback in studies where understanding the influence of individual variables is crucial. Neural networks provide powerful modelling capabilities, particularly for non-linear data structures. However, they require large datasets to train effectively and are computationally intensive. Also, many machine learning models are “black boxes” in the sense that they predict well but, in these models, it is not possible to identify which variables are important in the models, which could hinder the clear presentation and understanding of how results are derived. Ridge Regression is effective for reducing multicollinearity among predictors by imposing a penalty on the size of coefficients. However, unlike LASSO, Ridge Regression does not reduce coefficients to zero; therefore, it does not provide the feature selection capability required for our analysis, where the elimination of non-significant predictors was necessary.
Compared to these models, LASSO is interpretable, as it helps to identify which predictors have a meaningful impact on the latent constructs calculated with CFA-SEM. LASSO is also robust to multicollinearity; other machine learning models can produce unstable or unreliable coefficient estimates when predictors are highly correlated. In contrast, LASSO’s regularisation approach handles collinearity by selecting one or a subset of correlated predictors and setting the others to zero. Finally, the improved prediction obtained by LASSO is the result of regularisation, reducing the impact of noise and irrelevant predictors.
3.3. Robustness Checks and Visualisation Techniques
The robustness of the ML model was further ensured by employing clustered standard errors, which account for potential heteroscedasticity and autocorrelation within clusters defined by the cities of the respondents. The primary variable used was the respondents’ city, chosen based on initial findings that suggested significant variations in responses across different regions. This method considers intra-city similarities in responses, thereby improving the reliability of our results. Using the cities of the respondents as a cluster implies that the ML models consider the differences in answers by city, considering that similar answers can be obtained from people living in the same city (the same cluster) compared to people living in other cities. For example, differences in the availability of LMD services, the presence of major e-commerce hubs, or the efficiency of local logistics networks can lead to distinct consumer experiences and satisfaction levels across different cities. These factors are less likely to vary significantly within the same city but can vary considerably between cities. Furthermore, cultural and regional shopping behaviours influenced by urban versus suburban settings could also impact the responses.
While the primary analysis was centred on city-based differences, other demographic variables, such as age, gender, education, and occupational status, were not used to form additional clusters but were briefly assessed to ensure they did not confound the primary results. This assessment involved simple cross-tabulations and correlation checks to identify any overt patterns or inconsistencies that might warrant a deeper investigation or adjustment in the primary analysis. It is crucial to clarify that this was not a multilayered clustering process but a precautionary measure to validate the robustness of focusing on city-based differences. These demographic variables were evaluated to ensure comprehensive coverage and understanding, confirming that the observed patterns were genuinely attributable to regional differences rather than other underlying demographic factors. The use of city as the clustering variable provided clear, actionable insights that were statistically significant and most relevant to understanding regional differences in last-mile delivery services. By focusing on city-based clusters, our analysis remains sensitive to the regional nuances that might otherwise be obscured in a broader demographic analysis, ensuring a more nuanced understanding of the factors influencing e-commerce satisfaction and behaviour.
To complement the analysis, a word cloud visualisation was used to highlight the most frequent products purchased online, key factors in choosing a delivery company, and common delivery issues. This technique, as outlined the authors of [58], displays words in varying sizes to represent their frequency in customer responses. The size of each word is proportional to its frequency of occurrence in the answers. More frequent words appear larger and bolder, while less frequent words are smaller and less prominent.
3.4. Model Validation
The Structural Equation Models (SEM) were validated using goodness-of-fit statistics. Specifically, chi-square likelihood tests, the root mean squared error of approximation (RMSEA), the information criteria, the comparative fit index (CFI), the Tucker–Lewis index (TLI), the standardised root mean squared residual (SRMR), and the coefficient of determination (CD) were used. The chi-squared likelihood tests compare the SEM model against a saturated model and a baseline model. The saturated model is the model that fits the covariances perfectly, while the baseline model includes the means and variances of all observed variables plus the covariances of all observed exogenous variables. The root mean squared error of approximation evaluates the model’s close fit and ideally should be lower than 0.05 (RMSEA < 0.05), while values above 0.10 (RMSEA > 0.1) indicate poor fit; see [59] for alternative ways of assessing model fit in Structural Equation Models. In terms of information criteria, the Akaike information criterion (AIC) and the Bayesian (or Schwarz) information criterion (BIC) are statistics that do not judge fit in absolute terms but in comparison to different models. Smaller values indicate a better fit. The CFI and TLI are two fit indexes for SEM, in which a value close to 1 indicates a good fit [60]. Finally, the SRMR should be small, and the CD should be close to 1 if there is a good model fit of the SEM [61].
Table 2 shows the results of validating the SEM-CFA models used to calculate the latent factors of the propensity for online shopping, delivery quality, and delivery satisfaction/preferences, respectively. For all three latent factors, the likelihood ratio tests based on chi-square statistics indicate that the SEM-CFA model is better compared to the baseline and the saturated model (p-value < 0.001). Furthermore, the RMSEA is lower than 0.05 (RMSEA < 0.01), the SRMR is lower than 0.01, and the CFI and TLI are equal to one, hence indicating a perfect fit of the latent construct to the questions used in the SEM-CFA model. The CD is above 0.8 for all the factors, indicating that at least 80% of the variance in answers is explained by the latent factor.
Table 2.
Goodness-of-fit statistics of the structural equation models.
In the case of the LASSO specifications, the statistical tests applied to evaluate the predictive ability of the machine learning models to differentiate between customers who prefer online shopping, as well as customers who are satisfied or not satisfied with the quality of delivery services, are based on a cross-validation applied to the Receiver Operating Characteristic (ROC) curves and the results of bootstrap estimations of the Area Under the Curve (AUC). ROC curves evaluate the performance of a classification model in terms of the trade-off between the model’s true positive rate (sensitivity or recall) and its false positive rate (1-specificity). For the binary classification models applied to classify customers who prefer online shopping, as well as customers who are satisfied or not satisfied with the quality of delivery services, each instance in the test set is given a probability score (or a prediction) representing the likelihood of it belonging to the positive class, in this case, online shopping in the first latent factor, good quality of the delivery service in the second latent factor, and satisfaction with the delivery service in the third latent factor. The True Positive Rate (TPR) is the ratio of true positive predictions (correctly classified positive instances) to the total number of positive instances in the test set: TPR = True Positives/(True Positives + False Negatives). The False Positive Rate (FPR) is the ratio of false positive predictions (negative instances incorrectly classified as positive) to the total number of negative instances in the test set: FPR = False Positives/(False Positives + True Negatives).
For each threshold value, the corresponding TPR and FPR are calculated, and these values are plotted on the ROC curve. The ROC curve starts at the point (0, 0) and ends at (1, 1). If a machine learning model is a good classifier, its ROC curve will pass through the point (0, 1) and then (1, 1), representing good sensitivity (TPR = 1) and specificity (FPR = 0). On the other hand, a random guessing classifier would have a diagonal ROC curve, indicating that there is an equal chance of a true positive or false positive prediction [62]. The AUC measures the overall performance of the machine learning classification models applied to the survey data. It ranges from 0 to 1, with a higher value indicating a better performance. An AUC of 0.5 corresponds to a random guessing classifier, while an AUC closer to 1 indicates a good classifier. Figure 2a–c show the results of testing and validating the predictive ability of the machine learning models with cross-validation, ROC curves, and the AUC.
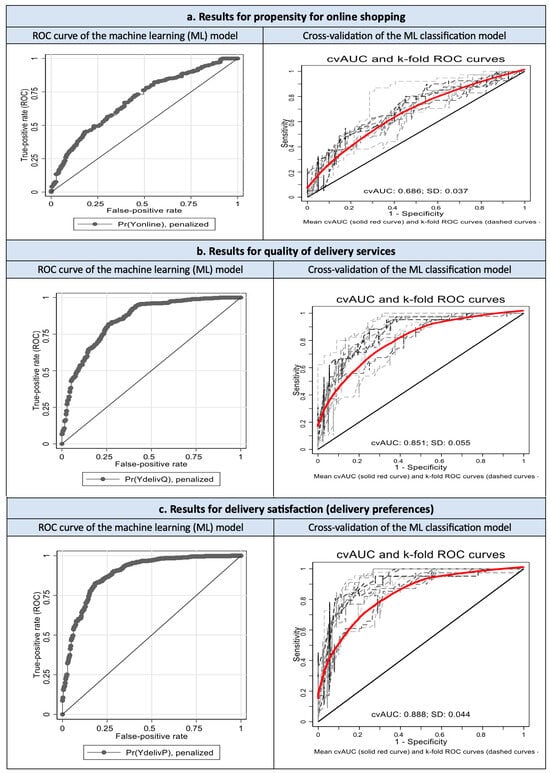
Figure 2.
Results of Statistical Testing of the Predictive Ability of The Machine Learning Models with Cross-validation, ROC Curves, and the AUC. In relation to the predictive and classification validity of ML models, the ROC and AUC results indicate that these models have a good predictive/classification ability and properly identify the variables that affect decision-making regarding online purchases, as well as the variables that affect the perceived quality of, and customer satisfaction with, delivery services. The ROC curve of the ML model for online shopping is above the diagonal curve (Figure 2a, left). In the cross-validation of the ML model based on splitting, the machine learning model in training and test samples is above the diagonal curve 10 times recursively (Figure 2a, right). The AUC of the classification ML model for online shopping is equal to 0.686, suggesting good precision in the predictions of customers who make online purchases and those who do not. The 95% confidence interval of the AUC is between 64% and 73% for the machine learning model, estimated for the latent factor of online purchases. The AUC is even greater for the other two variables, as shown in Figure 2b,c, which indicates that the machine learning model estimated for the latent factor of satisfaction/preference regarding a delivery service is, again, a powerful machine learning model with good classification power.
4. Results and Analysis
In this section, the results of the validated LASSO machine learning models, applied to the latent constructs calculated with CFA-SEM, are presented in the following order: (i) the propensity for online shopping (Table 3 for classification and Table 4 for regression), (ii) the quality of delivery services (Table 5 for classification and Table 6 for regression), and (iii) the satisfaction and preferences regarding delivery services (Table 7 for classification and Table 8 for regression). These tables only show the results for the variables that are statistically significant.
Table 3.
Machine learning classification results: online purchasing (only significant results).
Table 4.
Machine learning regression results: online purchasing (only significant results).
Table 5.
Machine learning classification results: delivery quality (only significant results).
Table 6.
Machine learning regression results: delivery quality (only significant results).
Table 7.
Machine learning classification results: delivery satisfaction (only significant results).
Table 8.
Machine learning regression results: delivery satisfaction (only significant results).
In terms of which variables affect decision-making in online shopping (Table 3 and Table 4), the most important ones are the option to pay with mobile payments and the option of returning the product. The results of the validated machine learning model for classification estimated with LASSO regularisation (Table 3) indicate that cash-on-delivery does not have a statistically significant relationship with online payments (the coefficient estimate is equal to 0.8329, with a p-value of 0.751), and instead mobile payments (, p-value < 0.05) and online card payments (, p-value < 0.10) are the preferred option for online shopping. Customers who are retired and those who are working in the semi-public sector, self-employed persons, private sector employees, and public sector employees have a higher propensity to make online purchases. Additionally, households with families that have no kids also have a higher propensity to make online purchases.
Compared to those customers who often return their online purchases, customers who rarely or never return their purchases have a lower propensity for online shopping. No differences in online purchasing between age groups were found, but students do not have a higher propensity to make online purchases since the results are not statistically significant at conventional significant levels (, p-value = 0.436).
Each result is accompanied by key statistical metrics, including odds ratios, confidence intervals, and p-values, providing a comprehensive view of the data. This ensures that readers can assess the reliability and significance of the findings. p-values less than 0.001 are considered highly significant and are reported as p < 0.001 in Table 3, Table 4, Table 5, Table 6, Table 7 and Table 8. This practice acknowledges the limitation of extremely small p-values in terms of the precision of the measurements and computational accuracy. Representing these values as p < 0.001 avoids the misleading implication of infinite precision and reflects the high level of statistical significance. p-values greater than 0.05 are reported exactly to demonstrate non-significant trends or results.
Table 4 shows the ML regression results for the latent factor of online shopping. Compared to the classification results, the regression results indicate that online card payments are also statistically significant for online shopping, at the 0.01 level (, p-value < 0.01), and the other results from the classification model continue to hold. The convergence of similar outcomes from both classification and regression models not only strengthens the validity of our findings but also affords us greater confidence in the generalisability of our conclusions.
The results regarding factors affecting customer perceptions of the quality of delivery services are displayed in terms of the classification of customers (Table 5) and regression results (Table 6). The most important findings highlight the importance of receiving the delivery as early as possible, but not during the early morning, and receiving updates to track the delivery. The classification results with machine learning (Table 5) show that, with a significance level of less than 0.05, a good-quality delivery service is perceived by customers who received their delivery the day after their purchase when customers choose to collect their delivery or prefer to have the delivery sent to their national home address. However, customers who receive their delivery very early in the morning (6 AM to 9 AM) and those who receive their delivery during late afternoon (3 PM to 5 PM) perceive the delivery service as a low-quality service, with a significance level of less than 1% in the case of delivery in early morning and with a significance level of less than 5% in the case of delivery in late afternoon.
The ML classification model also indicates that, for good-quality service, it is very important to receive notifications, but there is no particular preference about how updates on the delivery status are received, since the variables that capture the preferences regarding delivery updates are not statistically significant, at conventional significance levels, for updates through mobile apps (, p-value = 0.793), updates through phone calls (, p-value = 0.116), updates through social media accounts (, p-value = 0.804), or updates via text messages through SMS or WhatsApp (, p-value = 0.282).
No statistically significant differences in perception of the quality of delivery service were found among different age groups and different types of jobs, but the results of the ML classification model show that customers who received a bad-quality service are unlikely to switch to another retailer (, p-value = 0.756), but will instead complain to the retailer (, p-value < 0.05).
Customers who strongly agree that scheduling a redelivery is a nuisance perceive that this indicates low-quality delivery service. It is highly important that the driver arrives within the provided timeframe, since this variable is highly statistically significant in all the categories of the Likert scale. Additionally, customers who collect their deliveries from nearby stores are more likely to consider this a high-quality delivery service.
Compared to the ML classification, in the machine learning results based on regression (Table 6), only delivery to the national home address is significant at the 0.05 level, while the option of collecting the items is only significant at the 0.10 level. As in the ML classification results, it is important for customers to receive their delivery the day after the purchase.
Only delivery in the early morning reduces the perception of the delivery quality. As in the classification ML results, the regression ML results confirm the importance of the delivery arriving within the provided time. The regression ML results also confirm that customers who receive a bad delivery service are very unlikely to buy again.
In relation to the latent factor of delivery satisfaction/delivery preferences (Table 7 and Table 8), the results of the classification ML model based on LASSO regularisation (Table 7) indicate that having the option of collecting the delivery parcel increases delivery satisfaction, and again it is extremely important to receive the delivery the day after purchase. Receiving the delivery in the early morning or late afternoon reduces delivery satisfaction, hence suggesting that customers prefer to not receive their delivery during these times.
The ML classification model reveals that delivery update preferences do not significantly impact customer satisfaction (since no variable regarding update preferences is statistically significant). However, satisfaction increases when deliveries arrive within the provided timeframe or when customers can collect their parcels from smart parcel lockers. The model also suggests that dissatisfied customers are prone to complain directly to the retailer and are hesitant to repurchase from them. Young adults (24–30 years) are notably less satisfied with delivery services than other age groups.
The regression ML model corroborates these findings, showing that next-day delivery and convenient collection options enhance satisfaction, while early morning deliveries decrease it (Table 8). The importance of delivery notifications and receiving deliveries within agreed timeframes emerged as significant factors for increasing satisfaction, although these findings were not mirrored in the classification model and warrant further investigation. The regression model also indicates that poor delivery services significantly deter repeat purchases, underlining the impact of delivery quality on customer loyalty.
Finally, Figure 3, Figure 4 and Figure 5 use word clouds to display the most frequent customer responses in terms of the most frequent products purchased online (Figure 3), the most important factors the customers consider when choosing a delivery company (Figure 4), and the main problems commonly encountered with deliveries (Figure 5). The word clouds were generated using data collected from the online survey. The results indicate that clothes and footwear, along with accessories and electronics, are the dominant products purchased online (Figure 3).

Figure 3.
Word cloud: most purchased products online.
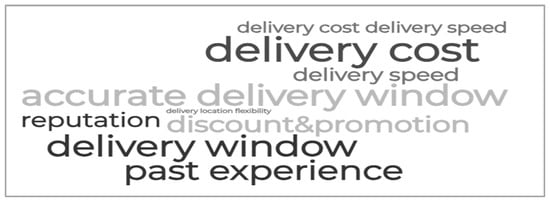
Figure 4.
Word cloud: most important factors when considering a delivery company.

Figure 5.
Word cloud: main problems commonly encountered with deliveries.
The delivery cost and speed, an accurate delivery window, and updates and tracking are among the main aspects that customers consider when choosing a delivery company (Figure 4). In terms of delivery problems, the word cloud reveals that the most frequent issues are related to not being informed about the delivery time, late or failed deliveries, the driver asking for the delivery address, and problems with there being no tracking or updates (Figure 5).
The actions taken by customers when they encounter problems with the delivery service are avoiding the retailer in future, contacting the retailer to complain, posting their experiences, and providing negative reviews online (Figure 6a). Furthermore, among those customers who choose to avoid the retailer, 44% do not take any further action, such as posting a review, complaining to the retailer, or similar actions. Such behaviour may result in a significant number of unsatisfactory delivery incidents going completely unnoticed by the retailer.
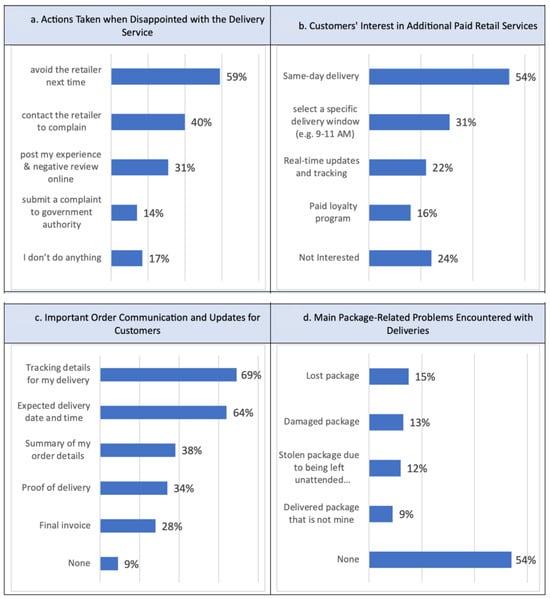
Figure 6.
Results of the word count analysis (multiple answers allowed).
If customers were offered an additional service for an small additional fee, most of the customers would choose same-day delivery (Figure 6b), a result that aligns with the findings from the machine learning models. The second most preferred option is the ability to select a specific delivery window, which also corroborates the results for LMD quality and satisfaction models. Similarly, in line with the results of the machine learning models, customers emphasise the importance of having tracking details for their deliveries and a clear expected delivery date (Figure 6c). Interestingly, while 69% of customers find tracking delivery details important, only 22% are willing to pay for this service, as shown in Figure 6b.
Most of the problems encountered with deliveries are related to tracking problems, specifically, a package being lost (Figure 6d). To a lesser extent, in some cases, customers received damaged packages or their package was stolen because it was left unattended outside their address, which again highlights the findings of the machine learning models regarding the importance of alternative locations for delivery and accurate delivery timeframes that are not in the early morning.
5. Discussion
This study, within the emerging economy context, introduces a useful perspective on customer behaviour in online shopping, as well as their predilections and anticipations regarding delivery service quality and satisfaction, focusing on last-mile delivery (LMD) services. As in the study by the authors of [12], the study findings indicate that a good delivery service is a key part of the online shopping experience if a retailer wants to increase customer satisfaction. The findings further highlight that customer satisfaction goes beyond a cognitive evaluation of the products purchased online, and instead includes the delivery service as part of the value creation in the customer journey.
The study findings suggest that consumers engaging in online shopping demonstrated a preference for using mobile payment methods and debit/credit cards for their transactions, while the option of cash-on-delivery was the least favoured method. This finding largely aligns with the existing literature, as validated by a study conducted by the authors of [63], who noted a substantial augmentation in household online spending as a direct result of the adoption of mobile payment. Mobile payment systems not only provide convenience for family online shopping but also offer financial benefits, such as lower transaction and accessibility costs, as highlighted by the authors of [64]. At the same time, the result appears to contradict the academic work of the authors of [65], who indicated a preference for cash-on-delivery among the Saudi demographic engaging in online shopping. It should, however, be noted that the study was conducted in 2019, before the onset of the COVID-19 pandemic. This could suggest a potential shift in the acceptance of digital payment methods among Saudi online shoppers during the pandemic. The authors of [52] suggested that although Saudi consumers typically prefer traditional retail experiences, such as shopping in physical stores and making in-store transactions, there was a noticeable shift towards digital payment methods in the context of online shopping during the pandemic.
Additional findings indicate that households without children exhibited a more pronounced propensity for engaging in e-commerce activities. This socio-demographic finding contradicts previous research suggesting that families with children, and especially those in high-income groups, tend to engage more in online shopping habits to save time [66]. This discrepancy may be specific to emerging economies, where online shopping may be perceived as a riskier activity, and households with children may generally lean towards a more risk-averse approach. However, further research is necessary to understand the factors that mediate the relationship between having children in a household and the inclination for online shopping.
Furthermore, customers who always return their online purchases have a low propensity towards online shopping. This tendency corroborates the existing literature and can be attributed to their behavioural inclination towards the traditional culture of in-store shopping. This low propensity towards online was described by customers who perceived any risk in returning or wish to avoid the inconvenience of returning the products purchased online [67]. In the context of Saudi Arabia, convenience is a key determinant of customer loyalty in the realm of online shopping [50]. Extensive research demonstrates that customers are unable to fully experience the advantage of convenience when faced with delivery delays or other issues resulting in unsuccessful deliveries [68].
Evaluations of both ML classification and regression models indicate a marked preference among Saudi consumers engaging in online shopping for a prompt delivery service, ideally within a day following the purchase. However, customers showed discontentment with deliveries scheduled exceedingly early in the morning (between 6.00 and 9.00 am), categorising such delivery windows as an unpreferred service. This finding aligns with the existing body of literature suggesting that online consumers prefer to be able to request convenient delivery time slots. This finding means that LMD providers need to improve their scheduling capabilities. Finally, the results obtained with the machine learning models are informative for the calibration of computer simulations of last-mile delivery for consumer-satisfaction maximisation, such as the ones applied by the authors of [69].
The findings reveal a strong tendency for participants to switch retailers after unsatisfactory deliveries, while also expressing intentions to file complaints urging an improvement in service. This aligns with findings in Malaysia, where poor last-mile delivery led customers to switch to a retailer’s competitors or revert to in-store shopping [70]. Many dissatisfied customers avoid the retailer without further action, leaving retailers and LMD providers unaware of this dissatisfaction, risking revenue loss. The implication stresses the joint responsibility of e-retailers and delivery services in last-mile logistics. Retailers, in particular, need to consider the effect of delivery services as an element of their retail strategy for a well-designed online shopping experience. Potential solutions may involve investments in data analytics tools that are capable of identifying deliveries that led to potential negative experiences based on tracking data, as well as incentivising customers to participate in post-delivery surveys.
There were occasions when the study participants encountered packages that were stolen or damaged as a result of an unattended delivery. This issue of porch pirates was discussed by the authors of [71], who warned against it as it adversely affects the acceptance of unattended home delivery services. Nevertheless, there are enduring obstacles concerning the financial concerns of stakeholders, along with customers’ trust levels, their readiness to embrace the digital shopping platforms, and operational effectiveness.
Delivery preference models show variations in customers’ choice of a home delivery and collection from lockers or stores. The findings indicate that some customers prefer to collect their delivery from lockers or nearby stores, while others prefer to receive the delivery at their home address, similar to the findings reported by the authors of [8]. This evidence suggests that customer experience and preferences are not static but rather evolve and change over time due to situational factors, unexpected circumstances, and experience with other retail channels. The implication of this finding is that retailers need to be flexible, offer new options, and consider how situational factors can influence consumers’ LMD choices, for example, through consumer participation in the co-creation of logistics service values [32].
6. Conclusions
The results of the study indicate that customers are increasingly reliant on an online retailer’s stated delivery times for their orders. Any delays can lessen the perceived advantages of online shopping. Customers have a growing expectation for quicker product delivery, aiming for same-day or next-day services. Moreover, customers prefer to use mobile payment solutions or credit/debit cards, as opposed to cash-on-delivery payment. Those who frequently return products tend to shop online less. Regarding the quality of LMD services, it is particularly important to provide personalised delivery options, such as specific time slots, to meet the unique requirements of customers. Furthermore, it is essential that LMD providers offer a variety of delivery to ensure customer satisfaction.
From a practical perspective, it can be inferred that a poor delivery service significantly reduces customer loyalty and repurchase intentions. This outcome underscores the shared responsibility of e-retail managers and delivery service providers in last-mile logistics. Retailers, in particular, should take into account the influence of delivery services as a crucial component of their overall retail strategy, ensuring a seamless online shopping experience. Given the high rate of unreported delivery issues, transparency in LMD services is essential.
The research results provide valuable insights for e-commerce professionals and regulatory authorities, offering opportunities to address the existing challenges of unattended delivery faced by retailers in the Saudi Arabia. Such enhancements may include improving existing courier reception boxes, shared reception boxes, and collection and delivery points to reduce the incidence of unattended deliveries. Another implication is that advanced tracking and communication technologies, such as real-time tracking and delivery notifications, are deemed essential by customers. These features not only have the potential to enhance customer satisfaction but also generate valuable data for optimising LMD services.
In terms of marketing and brand building, the online retail sector’s operators could explore the deployment of chatbot applications to serve as an effective tool for collecting and organising customer feedback, thereby elevating customer satisfaction. This feedback could also reveal instances of unreported poor deliveries, helping retailers and LMD providers to retain customers and improve logistics services. Additionally, LMD providers should implement comprehensive courier training and standardised procedures. These solutions can mitigate several problems flagged by customers, including lost, damaged, or stolen products.
The role of cultural factors in shaping LMD experiences is profoundly evident, especially in a diverse and rapidly transforming market like Saudi Arabia. Cultural preferences can significantly influence consumer expectations regarding the timeliness, communication, and methods of delivery. This research indicates a preference for contactless transactions and specific delivery times, likely underpinned by cultural norms around privacy and convenience. Further studies are warranted to explore cultural impacts on LMD satisfaction, enabling retailers to adapt their services to a diverse clientele.
Alternate delivery models, such as locker pickups, drone deliveries, and autonomous vehicles, offer promising solutions to address the growing demand for efficient and sustainable LMD. The study underscores the importance of timely and adaptable delivery methods, which these innovations could improve. Investigating the effectiveness of these models within the Saudi market and beyond could provide valuable insights into their practical application, acceptance, and economic viability.
Our research utilised machine learning to analyse customer preferences and delivery service quality, showcasing the potential of AI and ML to enhance logistical operations. However, the application of these technologies in optimising delivery routes, predictive analytics for demand and delivery times, and the personalisation of customer interactions remains underexplored. Future studies should explore the broader capabilities of AI and ML in streamlining last-mile operations, particularly in forecasting and managing the complexities of delivery logistics in urban and rural settings in Saudi Arabia. This would not only improve operational efficiencies but also enhance customer experiences by providing more reliable and predictive delivery services.
The economic implications of implementing sustainable delivery practices are pivotal for their widespread adoption. This study emphasises the need for diverse and efficient delivery options, aligning with the exploration of sustainable practices such as the use of electric vehicles and optimisation of delivery routes to reduce carbon footprints. Future research should focus on an economic assessment of these sustainable practices, exploring their long-term financial benefits compared to traditional delivery methods. Additionally, understanding consumer willingness to pay for greener delivery options could guide companies in pricing strategies and help justify the initial investment in sustainable technologies.
Future research should also explore the potential of interdisciplinary collaborations and industry partnerships in enhancing the translation of academic findings into practical solutions and robust policy recommendations. Engaging with stakeholders from both the public and private sectors could foster a more holistic approach to addressing the challenges and opportunities within LMD services. Collaborations across disciplines such as logistics, environmental science, technology management, and marketing could lead to innovative strategies that combine operational efficiency with sustainability goals. For instance, partnerships with technology firms could facilitate the integration of advanced AI and ML algorithms into delivery systems, while collaboration with urban planners and environmental scientists could help in designing delivery networks that minimise the ecological impacts. Furthermore, working closely with policymakers could ensure that the research findings inform regulations and standards that support sustainable practices while fostering economic growth. Such interdisciplinary efforts can bridge the gap between research and practice, ensuring that solutions are both scientifically sound and aligned with industry needs.
It is necessary to acknowledge some limitations of the current study. The first limitation is due to the disproportionate distribution of responses. A considerable number of respondents were from major cities like Jeddah and Riyadh. While this reflects the actual distribution of the population, future research could focus specifically on LMD experiences in small urban or rural settings. The second key limitation relates to the socio-economic context of the study. As this study was conducted in Saudi Arabia, the study results are likely to be more relevant to other emerging economies undergoing digital transformation. As with any other observational study based on survey answers, the results are limited by the accuracy of the answers provided by the customers and by the constructs that can be extracted from these answers. Future studies can explore other constructs and how these constructs mediate or moderate online purchasing by holistically considering delivery services as part of the value chain of customer satisfaction, exploring, for example, the co-creation of innovative logistic services jointly with customers, retailers, and delivery companies.
Funding
This research received no external funding.
Institutional Review Board Statement
The study was conducted in accordance with the Declaration of Helsinki, and the protocol was approved by the Ethics Committee in the Deanship of Scientific Research at the University of Jeddah in March 2023. All subjects gave their informed consent for inclusion before they participated in the study, the details of which were fully explained to them. No participant’s identifying information was collected in the study to preserve the privacy and confidentiality of the participants. Stringent measures have been taken by the researchers to ensure the privacy and security of the collected data.
Informed Consent Statement
Informed consent was obtained from all subjects involved in the study.
Data Availability Statement
The original contributions presented in the study are included in the article, further inquiries can be directed to the corresponding author.
Conflicts of Interest
The author declares no conflicts of interest.
References
- Hänninen, M.; Mitronen, L.; Kwan, S.K. Multi-sided marketplaces and the transformation of retail: A service systems perspective. J. Retail. Consum. Serv. 2019, 49, 380–388. [Google Scholar] [CrossRef]
- Eger, L.; Komárková, L.; Egerová, D.; Mičík, M. The effect of COVID-19 on consumer shopping behaviour: Generational cohort perspective. J. Retail. Consum. Serv. 2021, 61, 102542. [Google Scholar] [CrossRef]
- Masyhuri, M. Key Drivers of Customer Satisfaction on the E-Commerce Business. East Asian J. Multidiscip. Res. 2022, 1, 657–670. [Google Scholar] [CrossRef]
- Ageron, B.; Bentahar, O.; Gunasekaran, A. July. Digital supply chain: Challenges and future directions. Supply Chain. Forum Int. J. 2020, 21, 133–138. [Google Scholar] [CrossRef]
- Yang, H.; Luo, Y.; Qiu, Y.; Zou, J.; Masukujjaman, M.; Ibrahim, A.M. Modeling the enablers of consumers’ E-shopping behavior: A multi-analytic approach. Sustainability 2023, 15, 6564. [Google Scholar] [CrossRef]
- Dias, E.G.; Oliveira, L.K.D.; Isler, C.A. Assessing the effects of delivery attributes on e-shopping consumer behaviour. Sustainability 2021, 14, 13. [Google Scholar] [CrossRef]
- Risher, J.J.; Harrison, D.E.; LeMay, S.A. Last mile non-delivery: Consumer investment in last mile infrastructure. J. Mark. Theory Pract. 2020, 28, 484–496. [Google Scholar] [CrossRef]
- Buldeo Rai, H.; Verlinde, S.; Macharis, C. The “next day, free delivery” myth unravelled: Possibilities for sustainable last mile transport in an omnichannel environment. Int. J. Retail. Distrib. Manag. 2019, 47, 39–54. [Google Scholar] [CrossRef]
- Tzeng, S.Y.; Ertz, M.; Jo, M.S.; Sarigöllü, E. Factors affecting customer satisfaction on online shopping holiday. Mark. Intell. Plan. 2021, 39, 516–532. [Google Scholar] [CrossRef]
- Rita, P.; Ramos, R.F. Global research trends in consumer behavior and sustainability in E-Commerce: A bibliometric analysis of the knowledge structure. Sustainability 2022, 14, 9455. [Google Scholar] [CrossRef]
- Tyrväinen, O.; Karjaluoto, H. Online grocery shopping before and during the COVID-19 pandemic: A meta-analytical review. Telemat. Inform. 2022, 71, 101839. [Google Scholar] [CrossRef] [PubMed]
- Vakulenko, Y.; Shams, P.; Hellström, D.; Hjort, K. Online retail experience and customer satisfaction: The mediating role of last mile delivery. Int. Rev. Retail. Distrib. Consum. Res. 2019, 29, 306–320. [Google Scholar] [CrossRef]
- Mangiaracina, R.; Perego, A.; Seghezzi, A.; Tumino, A. Innovative solutions to increase last-mile delivery efficiency in B2C e-commerce: A literature review. Int. J. Phys. Distrib. Logist. Manag. 2019, 49, 901–920. [Google Scholar] [CrossRef]
- Grewal, D.; Roggeveen, A.L. Understanding retail experiences and customer journey management. J. Retail. 2020, 96, 3–8. [Google Scholar] [CrossRef]
- Alzahrani, J. The impact of e-commerce adoption on business strategy in Saudi Arabian small and medium enterprises (SMEs). Rev. Econ. Political Sci. 2019, 4, 73–88. [Google Scholar] [CrossRef]
- Salem, M.A.; Nor, K.M. The effect of COVID-19 on consumer behaviour in Saudi Arabia: Switching from brick and mortar stores to E-Commerce. Int. J. Sci. Technol. Res. 2020, 9, 15–28. [Google Scholar]
- Saudi Internet Report. CST Issued the Saudi Internet Report, Which Includes Data and Statistics on Internet Penetration and Use. Communication, Space and Technology Commission. 2022. Available online: https://www.cst.gov.sa/en/mediacenter/pressreleases/Pages/2023030802.aspx (accessed on 10 July 2023).
- Kingdom of Saudi Arabia. Financial Sector Development Program. Kingdom of Saudi Arabia. 2022. Available online: https://www.vision2030.gov.sa/v2030/vrps/fsdp/ (accessed on 20 July 2023).
- Albliwi, S.; Alsolami, L.A. Willingness to use e-commerce during coronavirus pandemic in Saudi Arabia. Mark. Manag. Innov. 2021, 4, 68–78. [Google Scholar] [CrossRef]
- Silva, M.E.; Fritz, M.M.; Seuring, S.; Matos, S. Guest editorial: The social sustainability of global supply chains–a critical perspective on current practices and its transformative potential. Int. J. Phys. Distrib. Logist. Manag. 2023, 53, 1–12. [Google Scholar] [CrossRef]
- Warganegara, D.L.; Babolian Hendijani, R. Factors that drive actual purchasing of groceries through e-commerce platforms during COVID-19 in Indonesia. Sustainability 2022, 14, 3235. [Google Scholar] [CrossRef]
- Gruntkowski, L.M.; Martinez, L.F. Online grocery shopping in germany: Assessing the impact of COVID-19. J. Theor. Appl. Electron. Commer. Res. 2022, 17, 984–1002. [Google Scholar] [CrossRef]
- Klein, P.; Popp, B. Last-mile delivery methods in E-commerce: Does perceived sustainability matter for consumer acceptance and usage? Sustainability 2022, 14, 16437. [Google Scholar] [CrossRef]
- Taha, V.A.; Pencarelli, T.; Škerháková, V.; Fedorko, R.; Košíková, M. The use of social media and its impact on shopping behavior of Slovak and Italian consumers during COVID-19 pandemic. Sustainability 2021, 13, 1710. [Google Scholar] [CrossRef]
- Hao, Y.; Liu, S.; Jiesisibieke, Z.L.; Xu, Y.J. What determines university students’ online consumer credit? Evidence from China. SAGE Open 2019, 9, 2158244019833594. [Google Scholar] [CrossRef]
- Daroch, B.; Nagrath, G.; Gupta, A. A study on factors limiting online shopping behaviour of consumers. Rajagiri Manag. J. 2021, 15, 39–52. [Google Scholar] [CrossRef]
- Karthikeyan, G. Problems faced by online consumers. Int. J. Curr. Res. Mod. Educ. 2016, 1, 166–169. [Google Scholar]
- Kawa, A.; Światowiec-Szczepańska, J. Logistics as a value in e-commerce and its influence on satisfaction in industries: A multilevel analysis. J. Bus. Ind. Mark. 2021, 36, 220–235. [Google Scholar] [CrossRef]
- Awwad, M.; Shekhar, A.; Iyer, A. Sustainable Last-Mile logistics operation in the Era of E-commerce. In Proceedings of the International Conference on Industrial Engineering and Operations Management, Washington, DC, USA, 27–29 September 2018; pp. 584–591. [Google Scholar]
- Alves de Araújo, F.; Mendes dos Reis, J.G.; Terra da Silva, M.; Aktas, E. A fuzzy analytic hierarchy process model to evaluate logistics service expectations and delivery methods in last-mile delivery in Brazil. Sustainability 2022, 14, 5753. [Google Scholar] [CrossRef]
- Olsson, J.; Hellström, D.; Vakulenko, Y. Customer experience dimensions in last-mile delivery: An empirical study on unattended home delivery. Int. J. Phys. Distrib. Logist. Manag. 2023, 53, 184–205. [Google Scholar] [CrossRef]
- Wang, X.; Yuen, K.F.; Wong, Y.D.; Teo, C.C. Consumer participation in last-mile logistics service: An investigation on cognitions and affects. Int. J. Phys. Distrib. Logist. Manag. 2018, 49, 217–238. [Google Scholar] [CrossRef]
- Kedia, A.; Kusumastuti, D.; Nicholson, A. Establishing collectionand delivery points to encourage the use of active transport:a case study in New Zealand using a consumer-centric approach. Sustainability 2019, 11, 6255. [Google Scholar] [CrossRef]
- Akturk, M.S.; Mallipeddi, R.R.; Jia, X. Estimating impacts of logistics processes on online customer ratings: Consequences of providing technology-enabled order tracking data to customers. J. Oper. Manag. 2022, 68, 775–811. [Google Scholar] [CrossRef]
- Ravula, P. Impact of delivery performance on online review ratings: The role of temporal distance of ratings. J. Mark. Anal. 2023, 11, 149–159. [Google Scholar] [CrossRef]
- Lin, Y.; Chen, A.; Zhong, S.; Giannikas, V.; Lomas, C.; Worth, T. Service supply chain resilience: A social-ecological perspective on last-mile delivery operations. Int. J. Oper. Prod. Manag. 2023, 43, 140–165. [Google Scholar] [CrossRef]
- Muñoz-Villamizar, A.; Solano-Charris, E.L.; Reyes-Rubiano, L.; Faulin, J. Measuring Disruptions in Last-Mile Delivery Operations. Logistics 2021, 5, 17. [Google Scholar] [CrossRef]
- Kader, M.S.; Rashaduzzaman, M.; Huang, X.; Kim, S. Influencing factors toward e-shoppers′ adoption of green last-mile delivery. Int. J. Retail. Distrib. Manag. 2023, 51, 220–237. [Google Scholar] [CrossRef]
- Nogueira, G.P.M.; de Assis Rangel, J.J.; Shimoda, E. Sustainable last-mile distribution in B2C e-commerce: Do consumers really care? Clean. Responsible Consum. 2021, 3, 100021. [Google Scholar] [CrossRef]
- Seghezzi, A.; Siragusa, C.; Mangiaracina, R. Parcel lockers vs. home delivery: A model to compare last-mile delivery cost in urban and rural areas. Int. J. Phys. Distrib. Logist. Manag. 2022, 52, 213–237. [Google Scholar] [CrossRef]
- Liu, S.; He, L.; Max Shen, Z.J. On-time last-mile delivery: Order assignment with travel-time predictors. Manag. Sci. 2021, 67, 4095–4119. [Google Scholar] [CrossRef]
- Gutierrez-Franco, E.; Mejia-Argueta, C.; Rabelo, L. Data-driven methodology to support long-lasting logistics and decision making for urban last-mile operations. Sustainability 2021, 13, 6230. [Google Scholar] [CrossRef]
- Garver, M.S.; Williams, Z.; Stephen Taylor, G.; Wynne, W.R. Modelling choice in logistics: A managerial guide and application. Int. J. Phys. Distrib. Logist. Manag. 2012, 42, 128–151. [Google Scholar] [CrossRef]
- Sultan, M.A.; Kramberger, T.; Barakat, M.; Ali, A.H. Barriers to Applying Last-Mile Logistics in the Egyptian Market: An Extension of the Technology Acceptance Model. Sustainability 2023, 15, 12748. [Google Scholar] [CrossRef]
- Dey, B.K.; Sarkar, M.; Chaudhuri, K.; Sarkar, B. Do you think that the home delivery is good for retailing? J. Retail. Consum. Serv. 2023, 72, 103237. [Google Scholar] [CrossRef]
- Dong, B.; Hovi, I.B.; Pinchasik, D.R. Analysis of Service Efficiency of Parcel Locker in Last-mile Delivery: A Case Study in Norway. Transp. Res. Procedia 2023, 69, 918–925. [Google Scholar] [CrossRef]
- Wang, X.; Wong, Y.D.; Li, K.X.; Yuen, K.F. A critical assessment of co-creating self-collection services in last-mile logistics. Int. J. Logist. Manag. 2021, 32, 846–871. [Google Scholar] [CrossRef]
- Pani, A.; Unnikrishnan, A.; Sinha, S.; Varghese, V. Shopping Travel Behaviour Trade-Offs Between Physical Stores and Online Deliveries: Post-COVID Scenario in New Delhi, India. Transp. Dev. Econ. 2024, 10, 17. [Google Scholar] [CrossRef]
- Janjevic, M.; Winkenbach, M. Characterizing urban last-mile distribution strategies in mature and emerging e-commerce markets. Transp. Res. Part A Policy Pract. 2020, 133, 164–196. [Google Scholar] [CrossRef]
- Al-Ayed, S. The impact of e-commerce drivers on e-customer loyalty: Evidence from KSA. Int. J. Data Netw. Sci. 2022, 6, 73–80. [Google Scholar] [CrossRef]
- Alharbi, A.; Cantarelli, C.; Brint, A. Crowd models for last mile delivery in an emerging economy. Sustainability 2022, 14, 1401. [Google Scholar] [CrossRef]
- Al Hamli, S.S.; Sobaih, A.E.E. Factors influencing consumer behavior towards online shopping in Saudi Arabia amid COVID-19: Implications for E-businesses post pandemic. J. Risk Financ. Manag. 2023, 16, 36. [Google Scholar] [CrossRef]
- Nachar, M. Factors that Predict the Adoption of Online Shopping in Saudi Arabia. Ph.D. Thesis, Walden University, Minneapolis, MN, USA, 2019. [Google Scholar]
- Saunders, M.; Lewis, P.; Thornhill, A. Research Methods for Business Students, 5th ed.; Pearson Education, Edinburg Gate: Harlow, UK, 2009. [Google Scholar]
- Laynes-Fiascunari, V.; Gutierrez-Franco, E.; Rabelo, L.; Sarmiento, A.T.; Lee, G. A Framework for Urban Last-Mile Delivery Traffic Forecasting: An In-Depth Review of Social Media Analytics and Deep Learning Techniques. Appl. Sci. 2023, 13, 5888. [Google Scholar] [CrossRef]
- Lee, J.; Jung, O.; Lee, Y.; Kim, O.; Park, C. A comparison and interpretation of machine learning algorithm for the prediction of online purchase conversion. J. Theor. Appl. Electron. Commer. Res. 2021, 16, 1472–1491. [Google Scholar] [CrossRef]
- Gopal, R.; Philps, D.; Weyde, T. Foundations of Programming, Statistics, and Machine Learning for Business Analytics; SAGE Publications: London, UK, 2023. [Google Scholar]
- Ignatow, G.; Mihalcea, R. Text Mining: A Guidebook for the Social Sciences; Sage Publications: New York, NY, USA, 2016. [Google Scholar]
- Browne, M.W.; Cudeck, R. Alternative Ways of Assessing Model Fit; Reprinted in Testing Structural Equation Models; Bollen, K.A., Long, J.S., Eds.; Sage: Newbury Park, CA, USA, 1993; pp. 136–162. [Google Scholar]
- Bentler, P.M. Comparative fit indexes in structural models. Psychol. Bull. 1990, 107, 238. [Google Scholar] [CrossRef]
- Hoyle, R.H. (Ed.) Handbook of Structural Equation Modeling; Guilford Press: New York, NY, USA, 2012. [Google Scholar]
- Mangrulkar, R.S.; Michalas, A.; Shekokar, N.; Narvekar, M.; Chavan, P.V. (Eds.) Design of Intelligent Applications Using Machine Learning and Deep Learning Techniques; CRC Press: Boca Raton, FL, USA, 2021. [Google Scholar]
- Yang, W.; Vatsa, P.; Ma, W.; Zheng, H. Does mobile payment adoption really increase online shopping expenditure in China: A gender-differential analysis. Econ. Anal. Policy 2023, 77, 99–110. [Google Scholar] [CrossRef]
- Boden, J.; Maier, E.; Wilken, R. The effect of credit card versus mobile payment on convenience and consumers’ willingness to pay. J. Retail. Consum. Serv. 2020, 52, 101910. [Google Scholar] [CrossRef]
- Alotaibi, A.R.; Faleel, J. Investigating the preferred methods of payment for online shopping by Saudi Customers. PalArch′s J. Archaeol. Egypt/Egyptol. 2021, 18, 1041–1051. [Google Scholar]
- Zatz, L.Y.; Moran, A.J.; Franckle, R.L.; Block, J.P.; Hou, T.; Blue, D.; Greene, J.C.; Gortmaker, S.; Bleich, S.N.; Polacsek, M.; et al. Comparing shopper characteristics by online grocery ordering use among households in low-income communities in Maine. Public Health Nutr. 2021, 24, 5127–5132. [Google Scholar] [CrossRef]
- Klepek, M.; Bauerová, R. Why do retail customers hesitate for shopping grocery online? Technol. Econ. Dev. Econ. 2020, 26, 1444–1462. [Google Scholar] [CrossRef]
- Duarte, P.; e Silva, S.C.; Ferreira, M.B. How convenient is it? Delivering online shopping convenience to enhance customer satisfaction and encourage e-WOM. J. Retail. Consum. Serv. 2018, 44, 161–169. [Google Scholar] [CrossRef]
- Freitag, M.; Kotzab, H. A concept for a consumer-centered sustainable last mile logistics. In Dynamics in Logistics, Proceedings of the 7th International Conference LDIC 2020, Bremen, Germany; Springer International Publishing: Berlin/Heidelberg, Germany, 2020; pp. 196–203. [Google Scholar]
- Rajendran, S.D.; Wahab, S.N. Investigating last-mile delivery options on online shoppers experience and repurchase intention. Int. J. Electron. Mark. Retail. 2022, 13, 224–241. [Google Scholar] [CrossRef]
- Stickle, B.; Hicks, M.; Stickle, A.; Hutchinson, Z. Porch pirates: Examining unattended package theft through crime script analysis. In Field Studies in Environmental Criminology; Routledge: Oxfordshire, UK, 2022; pp. 106–122. [Google Scholar]

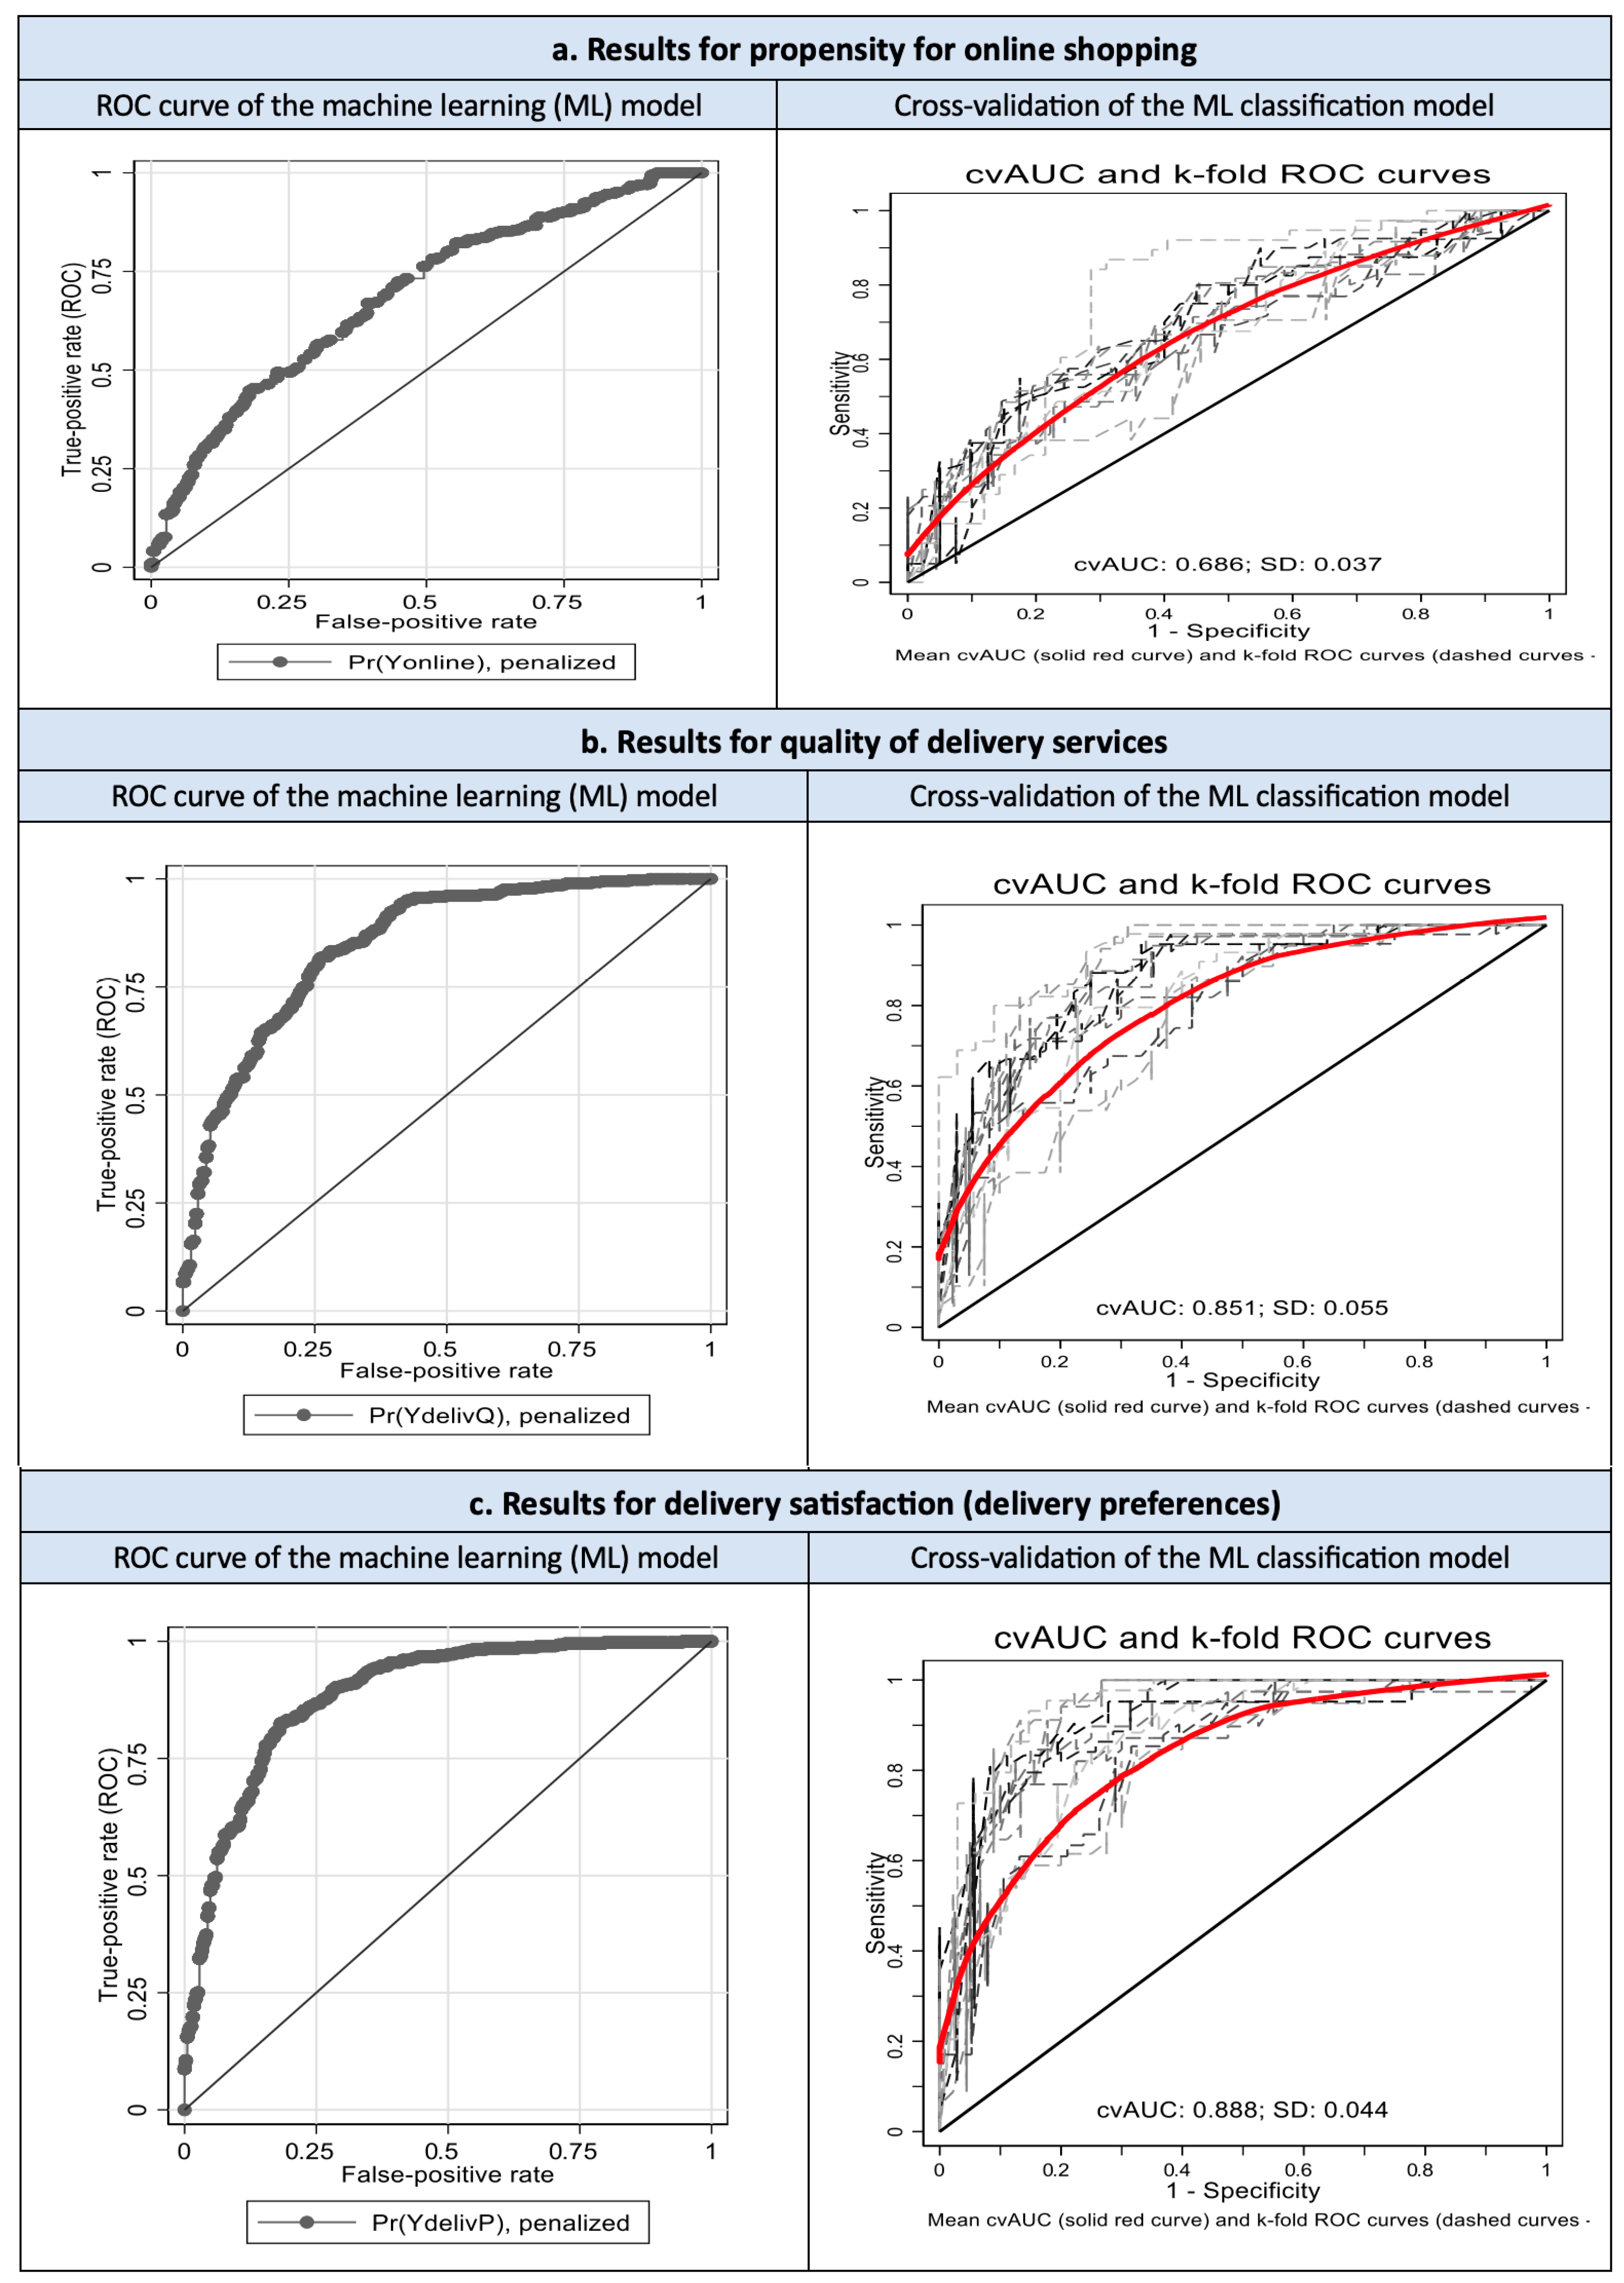


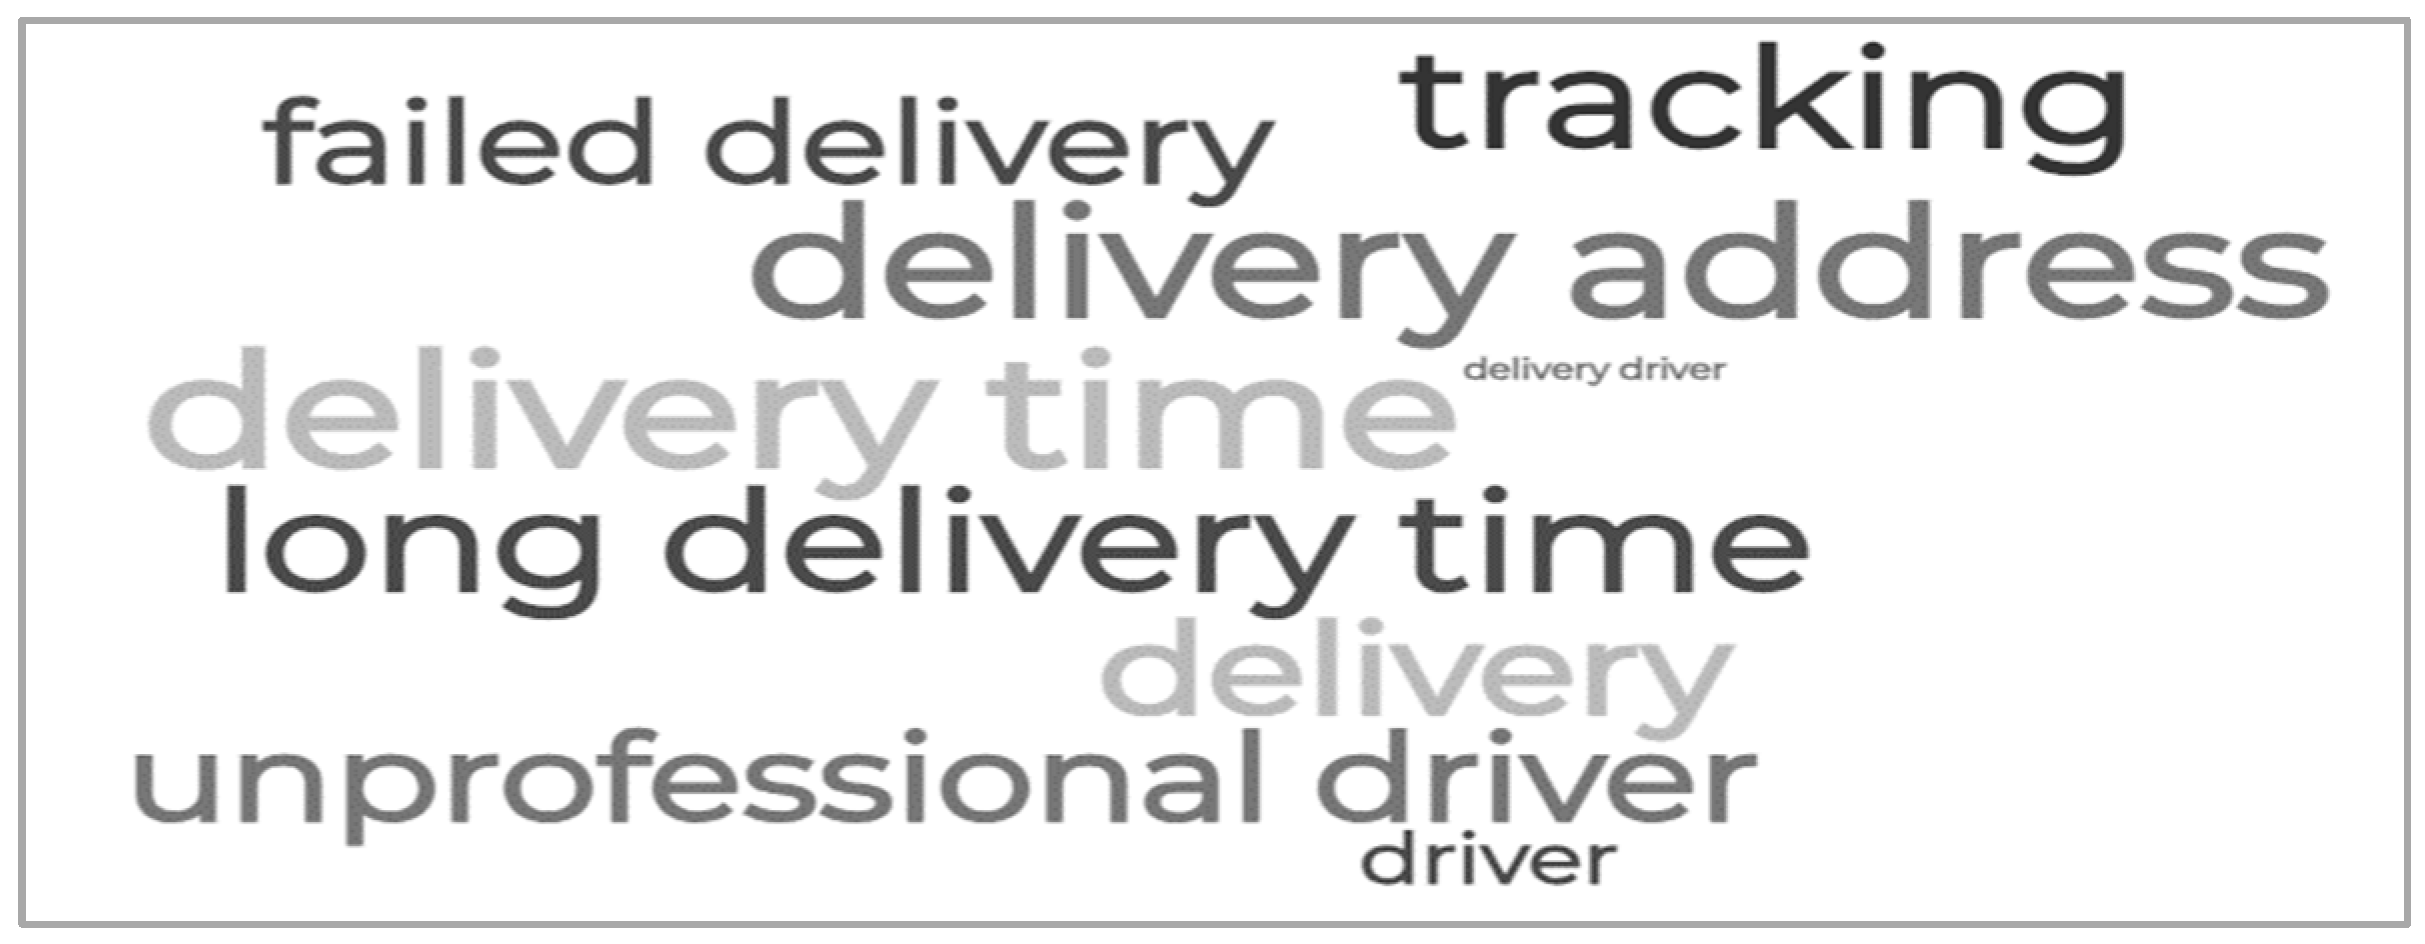

Disclaimer/Publisher’s Note: The statements, opinions and data contained in all publications are solely those of the individual author(s) and contributor(s) and not of MDPI and/or the editor(s). MDPI and/or the editor(s) disclaim responsibility for any injury to people or property resulting from any ideas, methods, instructions or products referred to in the content. |
© 2024 by the author. Licensee MDPI, Basel, Switzerland. This article is an open access article distributed under the terms and conditions of the Creative Commons Attribution (CC BY) license (https://creativecommons.org/licenses/by/4.0/).