Article

Performance Analysis and Optimization of Solar-Coupled Mine Water-Source Heat Pump Combined Heating and Cooling System

Energy School, Xi’an University of Science and Technology, Xi’an 710054, China
*
Author to whom correspondence should be addressed.
Sustainability 2024, 16(11), 4752; https://doi.org/10.3390/su16114752
Submission received: 27 April 2024 / Revised: 19 May 2024 / Accepted: 28 May 2024 / Published: 3 June 2024

Abstract

:
To address the energy consumption issue in mining area buildings, this paper proposed a solar-coupled mine water-source heat pump combined heating and cooling (SMWHP-CHC) system, taking the employee dormitory building group of a coal mining enterprise in Tongchuan City, China, as a case study. The system utilizes renewable solar energy and waste heat recovered from mine water as composite heat sources, and utilizes the cold energy in mine water as a cooling source to meet the demands for space heating, space cooling, and annual domestic hot water of the building in a sustainable manner. The simulation model of the system was established by TRNSYS to analyze the system’s annual operational performance. The results indicated that the system exhibited a positive energy efficiency and environmental performance under different operating conditions. The heating coefficients of the performance of the system (COPsys) during the space heating season and transition season were 3.54 and 18.6, and the cooling energy efficiency ratio of the system (EERsys) was 3.79. In addition, aiming to minimize the annual cost of the system, multiple crucial device parameters were synchronously optimized employing the PSO-HJ hybrid optimization algorithm through the GenOpt 2 software. The annual cost of the optimized system was reduced by 8.82%, and the investment cost was significantly reduced, while the performance was also improved. This study can provide theoretical support for the sustainable engineering application of the SMWHP-CHC system in mining area buildings.

1. Introduction

Climate change and the energy crisis have become global concerns [1]. The building sector accounts for approximately 36% of global energy consumption and 39% of carbon dioxide emissions, with the highest energy consumption for space heating, cooling, and domestic hot water [2,3]. The utilization of renewable energy is an important means to reduce building energy consumption for sustainable development. Among renewable energy sources, solar energy has attracted widespread attention due to its abundance and cleanliness [4]. Wastewaters produced from residential, industrial, and commercial developments, such as domestic sewage, pharmaceutical wastewater, and mine water, typically contain substantial waste heat that can be recovered and reused [5,6,7,8,9]. Consequently, the heat pump system that integrates solar energy and waste heat recovered from wastewater has become a research hotspot with increasingly widespread applications.
Liu et al. [10] proposed a solar-assisted heat pump hot water system to improve the high recovery cost of heat pumps caused by low-temperature urban wastewater. The system recovered waste heat from public bathrooms and supplied hot water, and the results showed that the system operated effectively. Bai [11] used a residential building near a wastewater treatment plant as a case study and used TRNSYS to show that a solar-coupled wastewater-source heat pump heating system had better performance and economic, energy-saving, and environmental benefits than a wastewater-source heat pump system. Starke et al. [12] improved the current energy consumption situation in Brazil’s extensive swimming pool market by proposing a solar–water-source heat pump heating system for swimming pools. Compared to traditional heat pump systems, it exhibited significantly lower energy consumption, with a coefficient of performance of the system of up to 6.7~8.2. Xie [13] utilized TRNSYS to design a building heating system that combined solar energy with urban wastewater as the heating source for a heat pump, designed according to five working conditions with a solar energy contribution rate of 10~30%, and determined the optimal energy-saving scheme under each working condition. Mi et al. [14] proposed a public bath hot water supply system that coupled a PVT system with a water-source heat pump to improve the shortcomings of several common multi-source heating water systems. The system was optimized using a public bath at a university as an example to improve the system’s overall energy efficiency and supply capacity. Wang et al. [15] optimized a solar-coupled sewage-source heat pump hot water system in a public bathroom using the Taguchi method. The average annual solar energy contribution rate of the optimized system increased by 3.6%, while the annual operational energy consumption decreased by 4.52%. Cheng et al. [16] proposed a heat pump heating and domestic hot water supply system that combined building envelope energy storage with integrated utilization of solar energy and domestic wastewater heat. The study analyzed the impact of different system parameters on system performance, and the system coefficient of performance in the winter in different climatic zones reached above 3.5. Zhang et al. [17] proposed a heat pump hot water supply system assisted by solar energy and utilizing hotel wastewater as a heat source. The study analyzed the impact of different parameter variations on system performance and determined the optimal system parameters. Under the optimal parameters, the system exhibited a more stable hot water supply temperature and significantly reduced energy consumption.
As is well known, mining areas are typically located in remote regions, leading to a heavy reliance on traditional energy sources. Considering that a large amount of mine water is produced during coal mining, with temperatures generally around 14~21 °C and exhibiting minimal fluctuations throughout the year, it can be used as an excellent source of both heat and cooling [18]. However, in general, mine water is discharged directly, with statistics showing that approximately 6.88 × 10⁹ m3 of mine water is produced annually in China currently, but the average utilization rate of mine water is less than 35%, resulting in a significant waste of the heat and cold energy inherent in it [19,20]. Previous scholars have conducted some research on the utilization of waste heat from various sources, such as domestic wastewater, bathing wastewater, and urban wastewater, but research on the utilization of waste heat and cold energy from mine water is scarce.
In summary, considering the energy conditions of mining areas, with the aim to fully utilize the solar energy and waste heat/cold from the mine water to address the energy consumption issues of buildings in mining areas, this paper proposed a clean and environmentally friendly solar-coupled mine water-source heat pump combined cooling and heating (SMWHP-CHC) system. In contrast to other single-purpose energy supply systems, the proposed system is capable of simultaneously providing space heating, space cooling, and annual domestic hot water supply for buildings. Moreover, the heat source for the heat pump system can be alternately supplied by solar energy and mine water, which can significantly improve the utilization rate of solar energy and the overall performance of the system. The simulation model of the system was established by TRNSYS (Transient System Simulation Program) to analyze the system’s annual operational performance combined with engineering cases. In addition, the synchronous matching optimization of the multiple crucial parameters of devices was performed with the objective of utilizing the minimum annual cost of the system.

2. Case Study

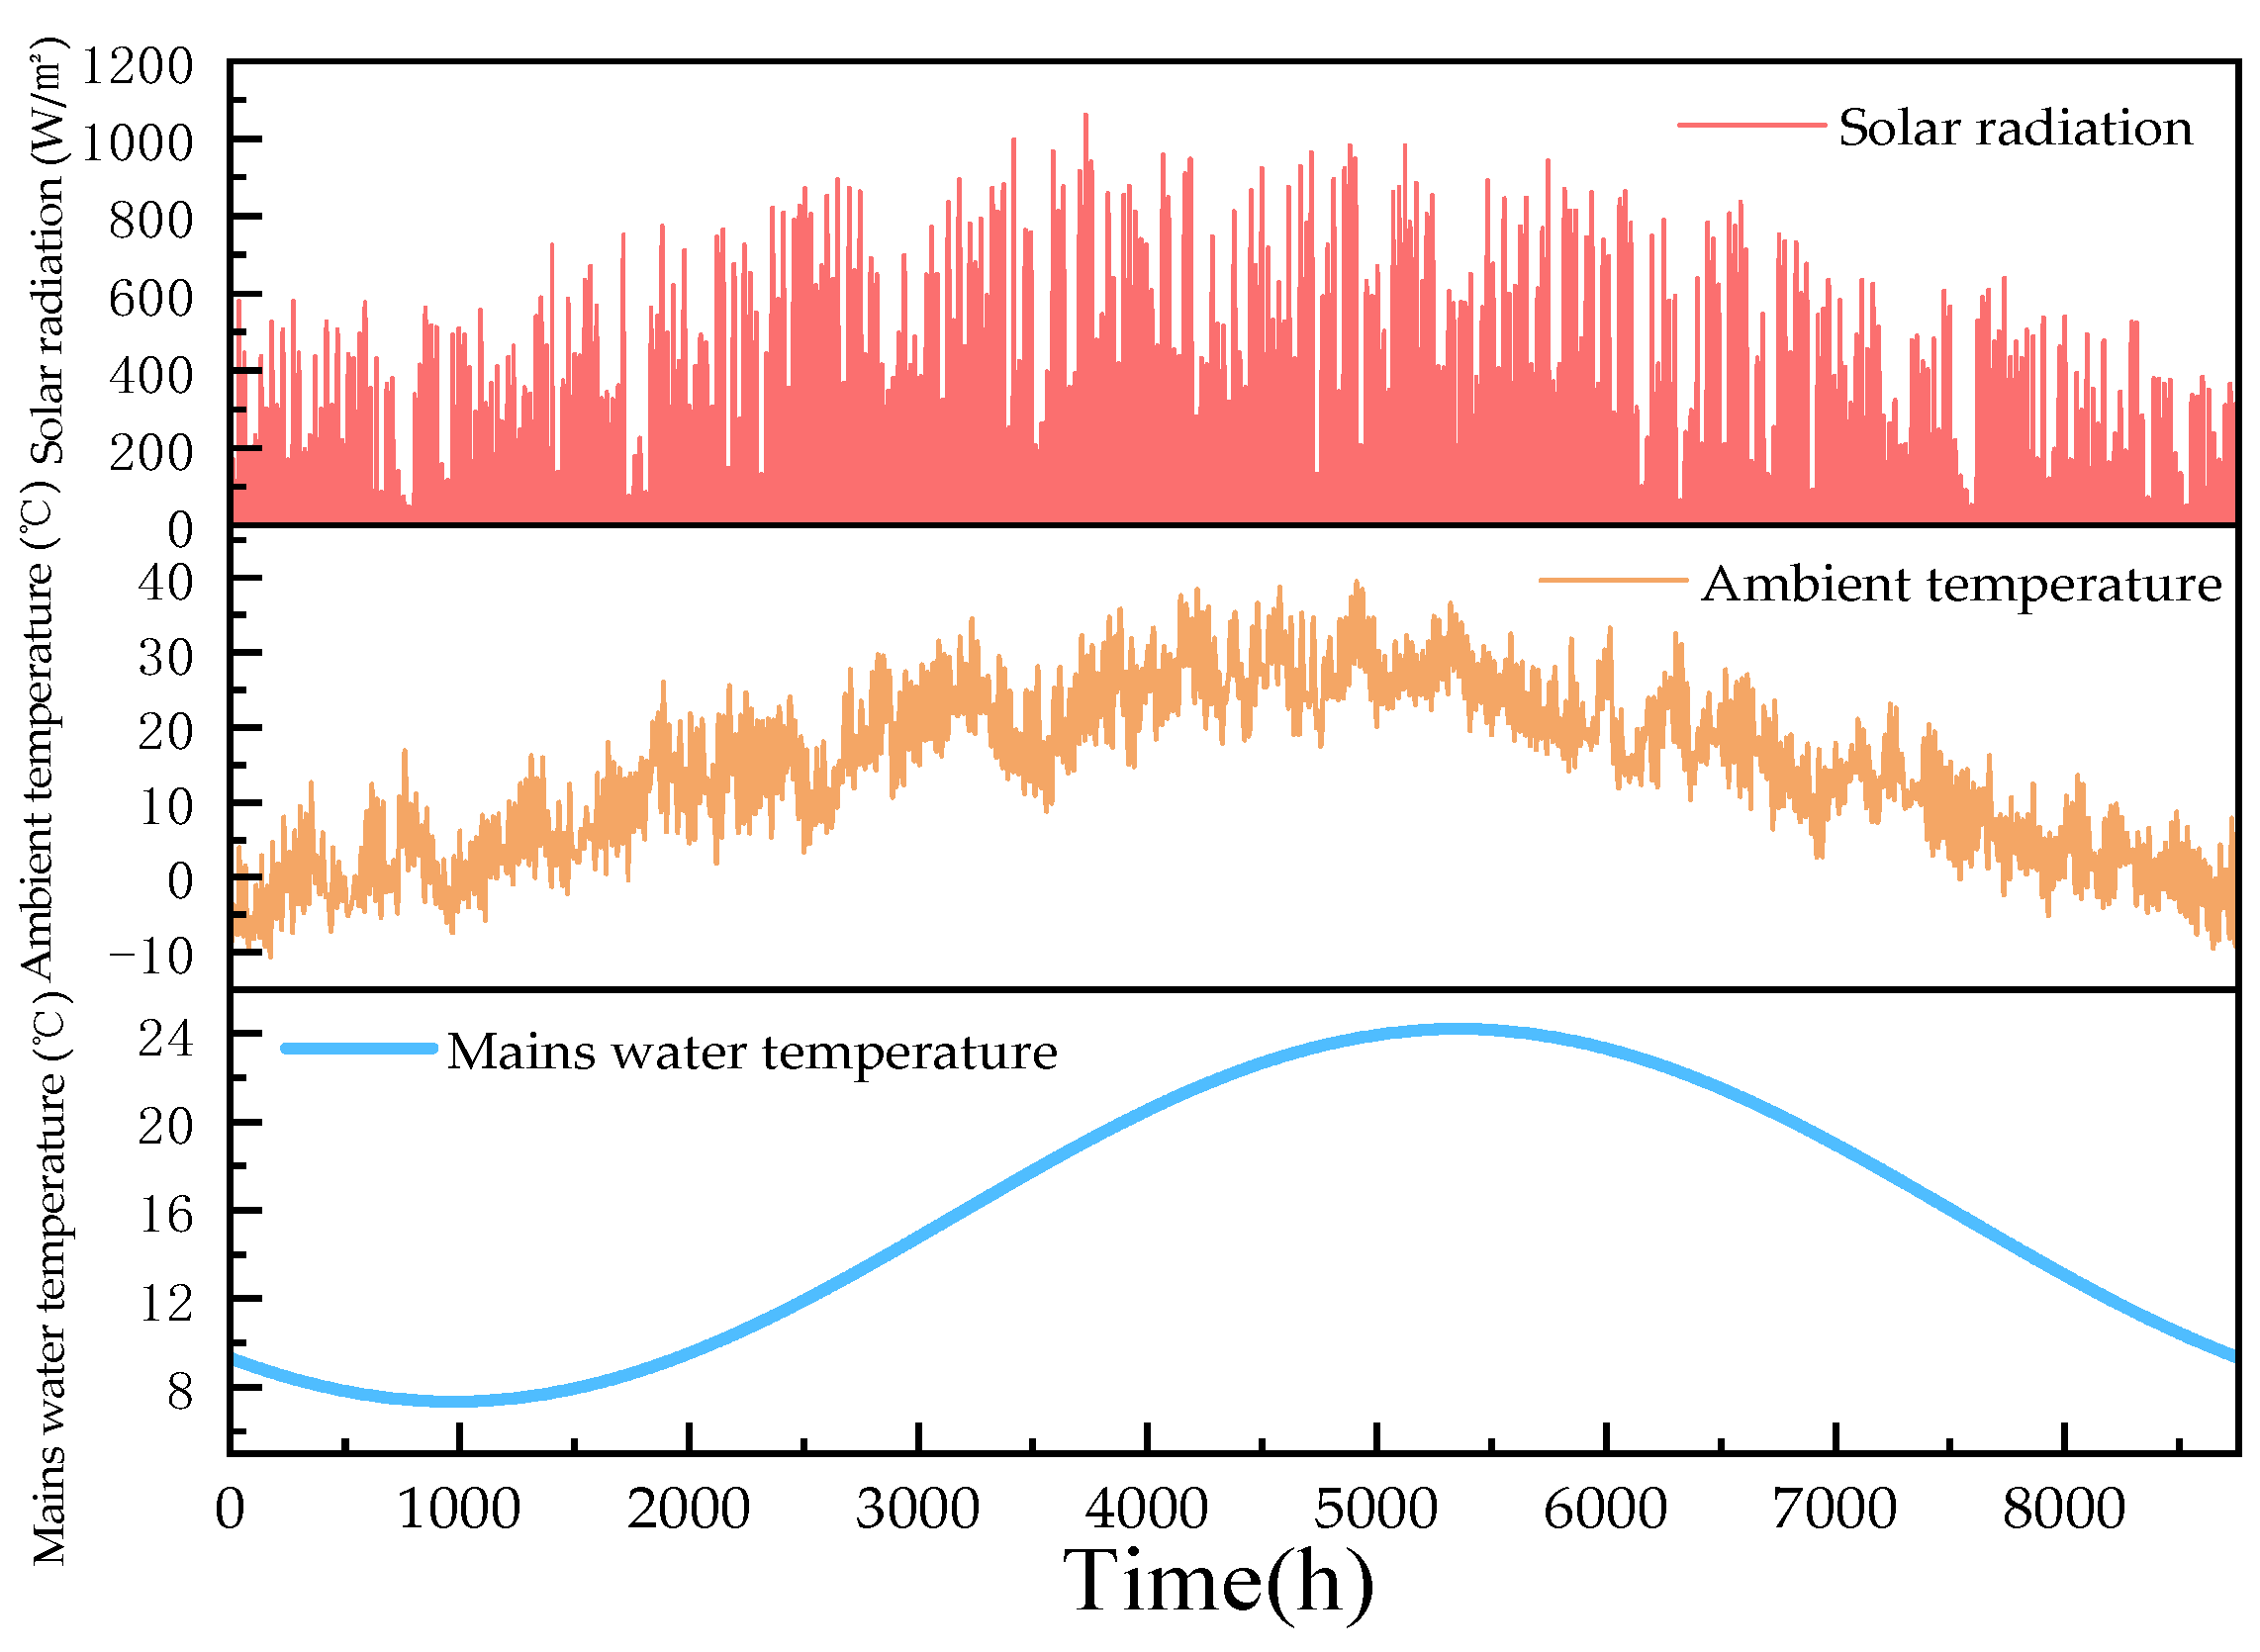
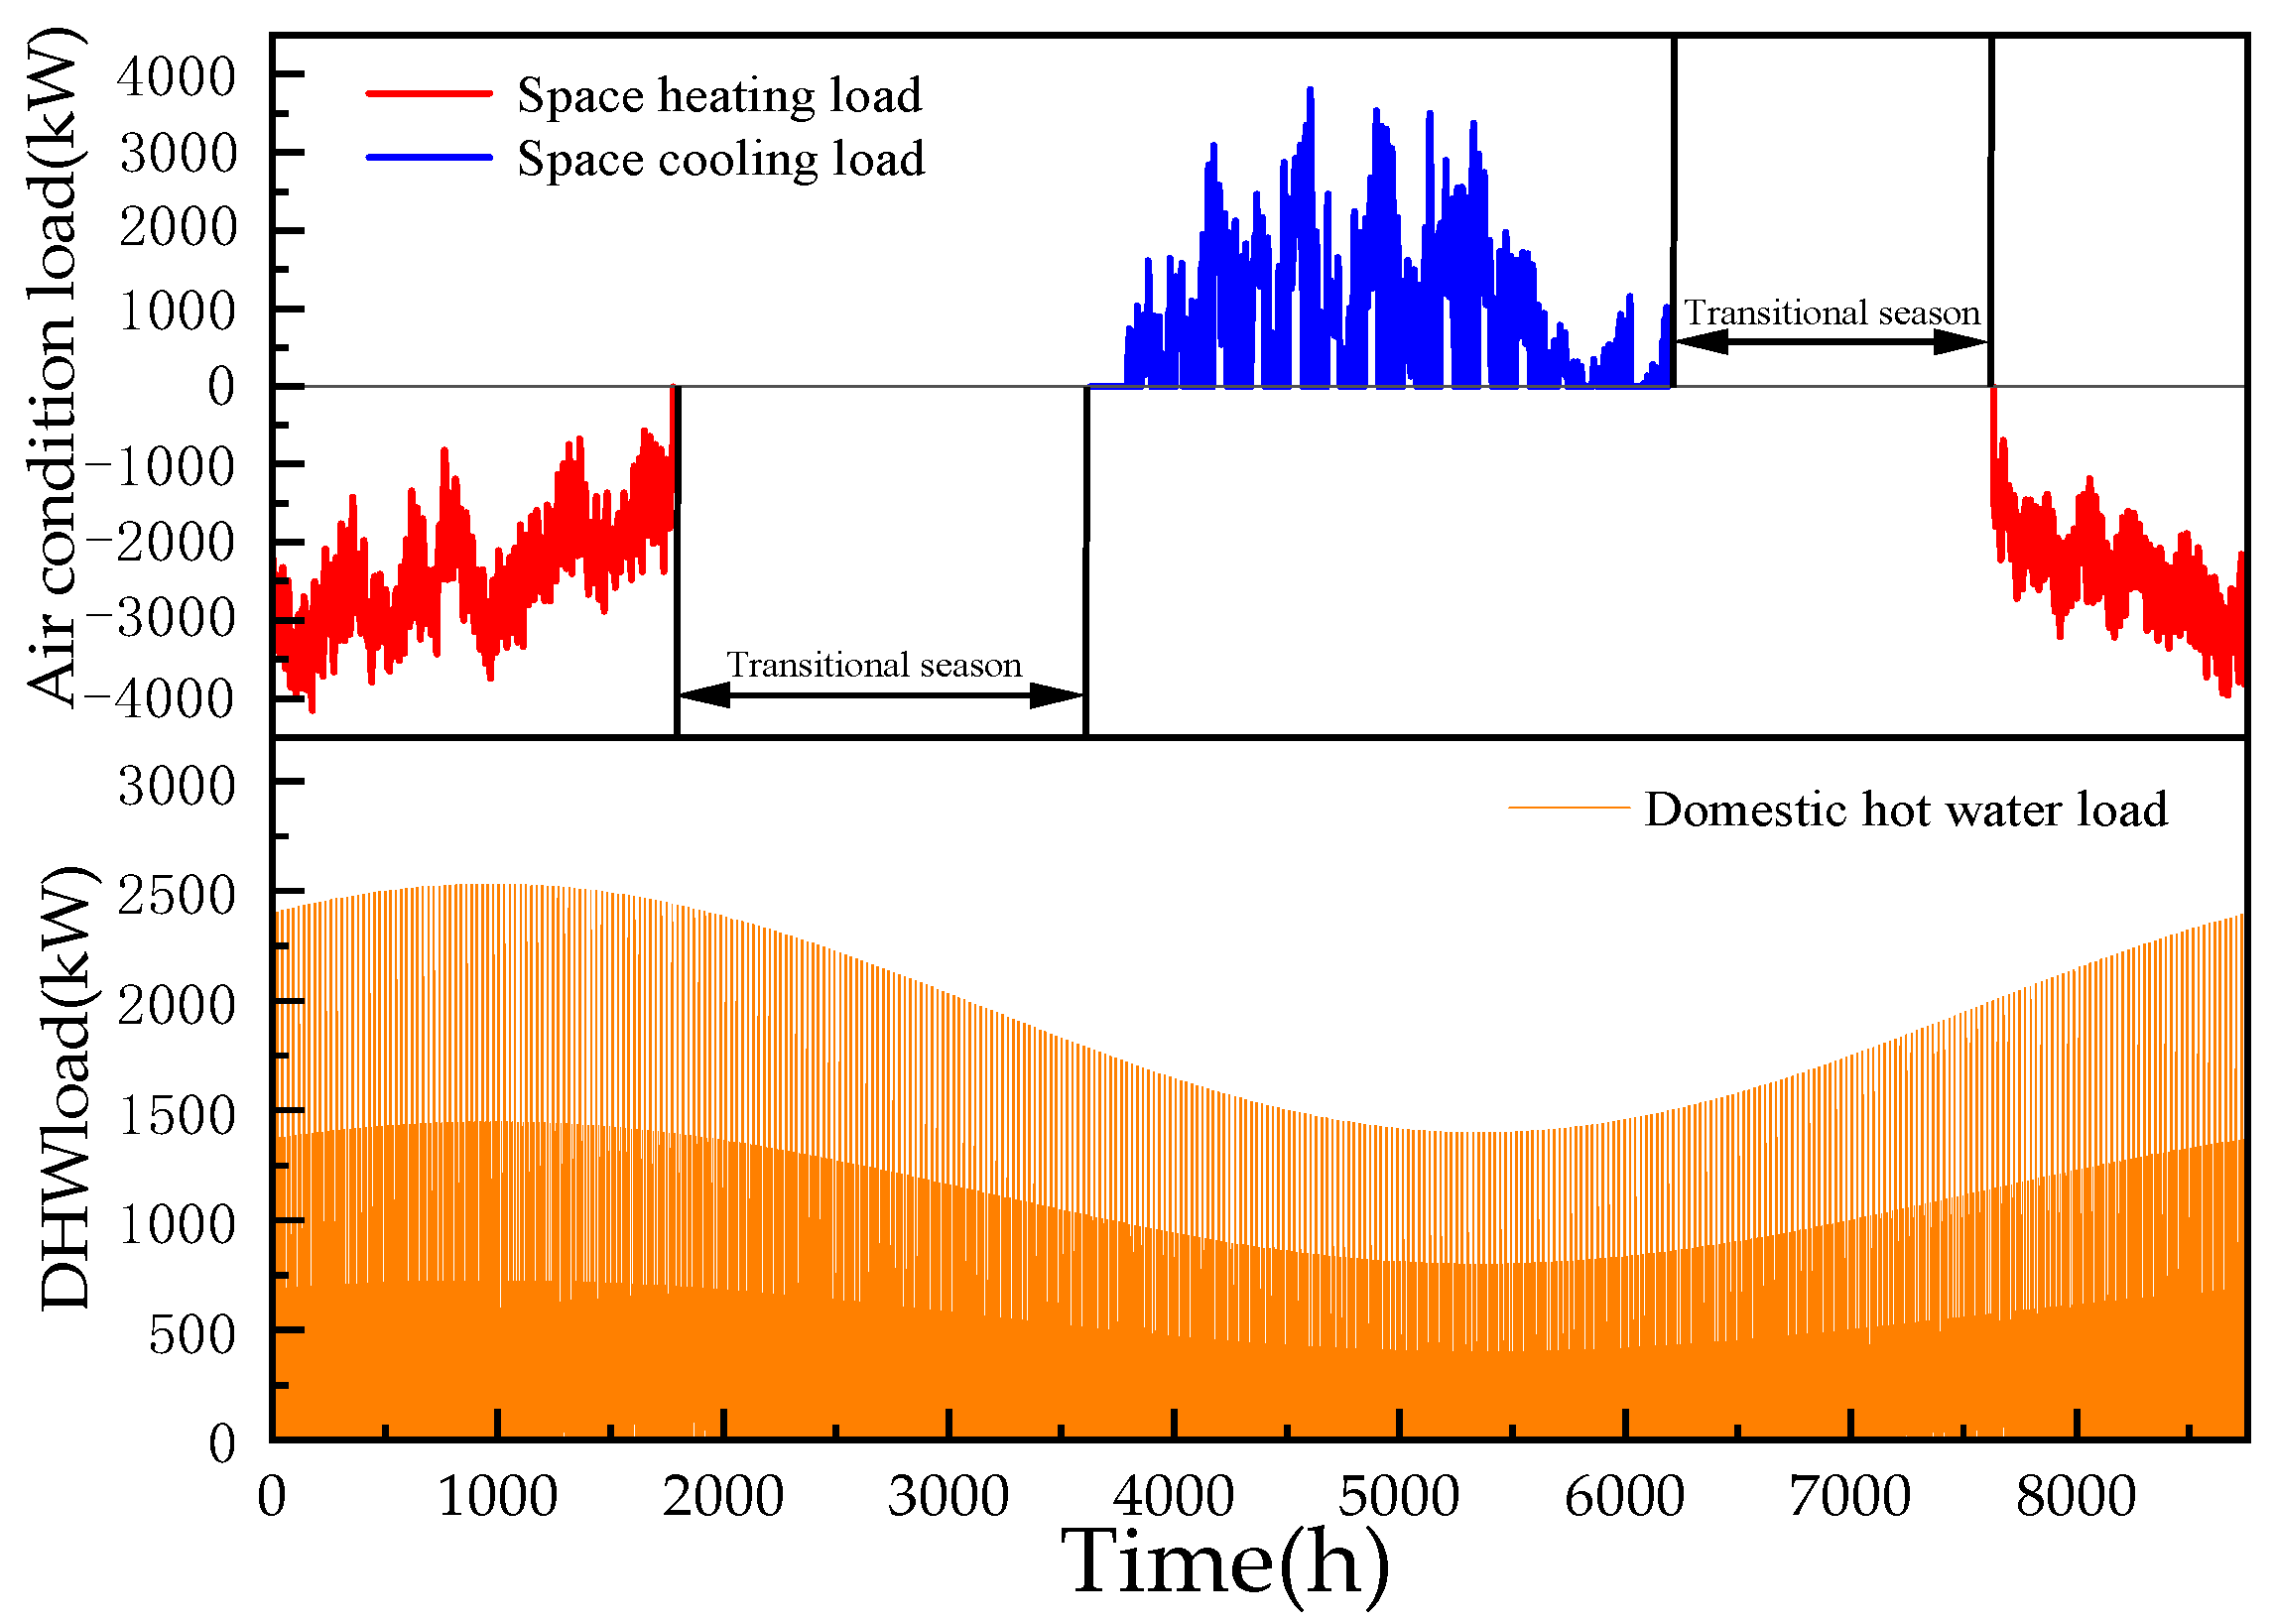
2.1. Building Space Heating, Space Cooling, and Domestic Hot Water Load

This study used the employee dormitory building group of a mining enterprise in Tongchuan City, China, as a case study. The mining enterprise has six dormitory buildings with a space heating and cooling area of 97,500 m2, accommodating a total of 6000 employees. The main design parameters of the dormitory buildings are shown in Table 1. The required temperature for domestic hot water was set at 45 °C. The fan coil unit was selected as the terminal for the space heating and cooling air conditioning device. Space heating operates continuously throughout the day, while cooling is only activated during the employees’ rest times (weekdays 12:00–14:00, 18:00–next day 8:00; weekends all day).
The hourly variations of the horizontal solar radiation intensity, outdoor ambient temperature, and mains water temperature during typical meteorological years in Tongchuan are shown in Figure 1. These parameters were obtained by the Meteonorm weather database. In general, solar energy resources are abundant, and the average of annual sun hours is 4551 h, the average solar irradiation per day is 3.34 kWh/m2/day, and the annual total radiation is 1219.89 kWh/m2. The local annual average ambient temperature is 14.11 °C, and the ambient temperature in winter is less than 0 °C for extensive periods, so space heating is required during the winter. The ambient temperature is more than 20 °C for most of the summer, so there is also demand for cooling during the summer. The mains water temperature is the crucial parameter for calculating the hot water load. The annual average temperature of mains water is 15.8 °C, with a minimum value of 7.35 °C and a maximum value of 24.21 °C.
The building load calculation based on the design parameters was completed using the TRNBuild platform in TRNSYS 18. The hourly space heating load, space cooling load, and hot water load calculated by the simulation are shown in Figure 2. The space heating load index is 42.6 W/m2, the average space heating load is 2427.2 kW, and the annual cumulative space heating load is 7.05 × 10⁶ kWh. The space cooling load index is 39 W/m2, the average cooling load is 735.6 kW, and the annual cumulative cooling load is 1.889 × 10⁶ kWh. The average hot water load is 467.63 kW, and the annual cumulative hot water load is 4.096 × 10⁶ kWh.

2.2. Analysis of Available Heat and Cold Energy of Mine Water

The average discharge of mine water from this mining enterprise is 210 m3/h, with the temperature remaining stable around 20 °C. The available heat and cold energy of mine water can be calculated by the following formula:
Q w = c w 0.8 m w Δ t w / 3600
where c w is the specific heat capacity, considered as 4.19 kJ/(kg·°C); m w is the mine water flow rate; the design available quantity considers a safety factor of 0.8 kg/h; and Δ t w is the heat exchange temperature differential, which is taken as 10 °C for heating and 13 °C for cooling.
As calculated, the available heat energy from mine water is 1955.3 kW, and the available cold energy is 2542 kW. Assuming the heating coefficient of performance of the heat pump (COPh) is 4.5 and the cooling coefficient of performance (COPc) is 4.8, the heating capacity Q w h and cooling capacity Q w c can be calculated by the following formulas:
Q w h = Q w / ( 1 1 / COP h ) Q w c = Q w / ( 1 + 1 / COP c )
As calculated, the daily average heating capacity is 60,335 kWh, while the combined daily average space heating load and hot water load in the space heating season with the largest heat demand is 71,879.78 kWh. Therefore, utilizing mine water can provide approximately 83.9% of the heat required by the building on an average daily basis in the space heating season. Renewable energy sources, such as solar energy, can be utilized to supplement the heat requirement gap. Additionally, the daily average cooling capacity of 50,489.38 kWh is sufficient to meet the daily average cooling requirement of 17,414.4 kWh in the space cooling season.

3. SMWHP-CHC System Introduction

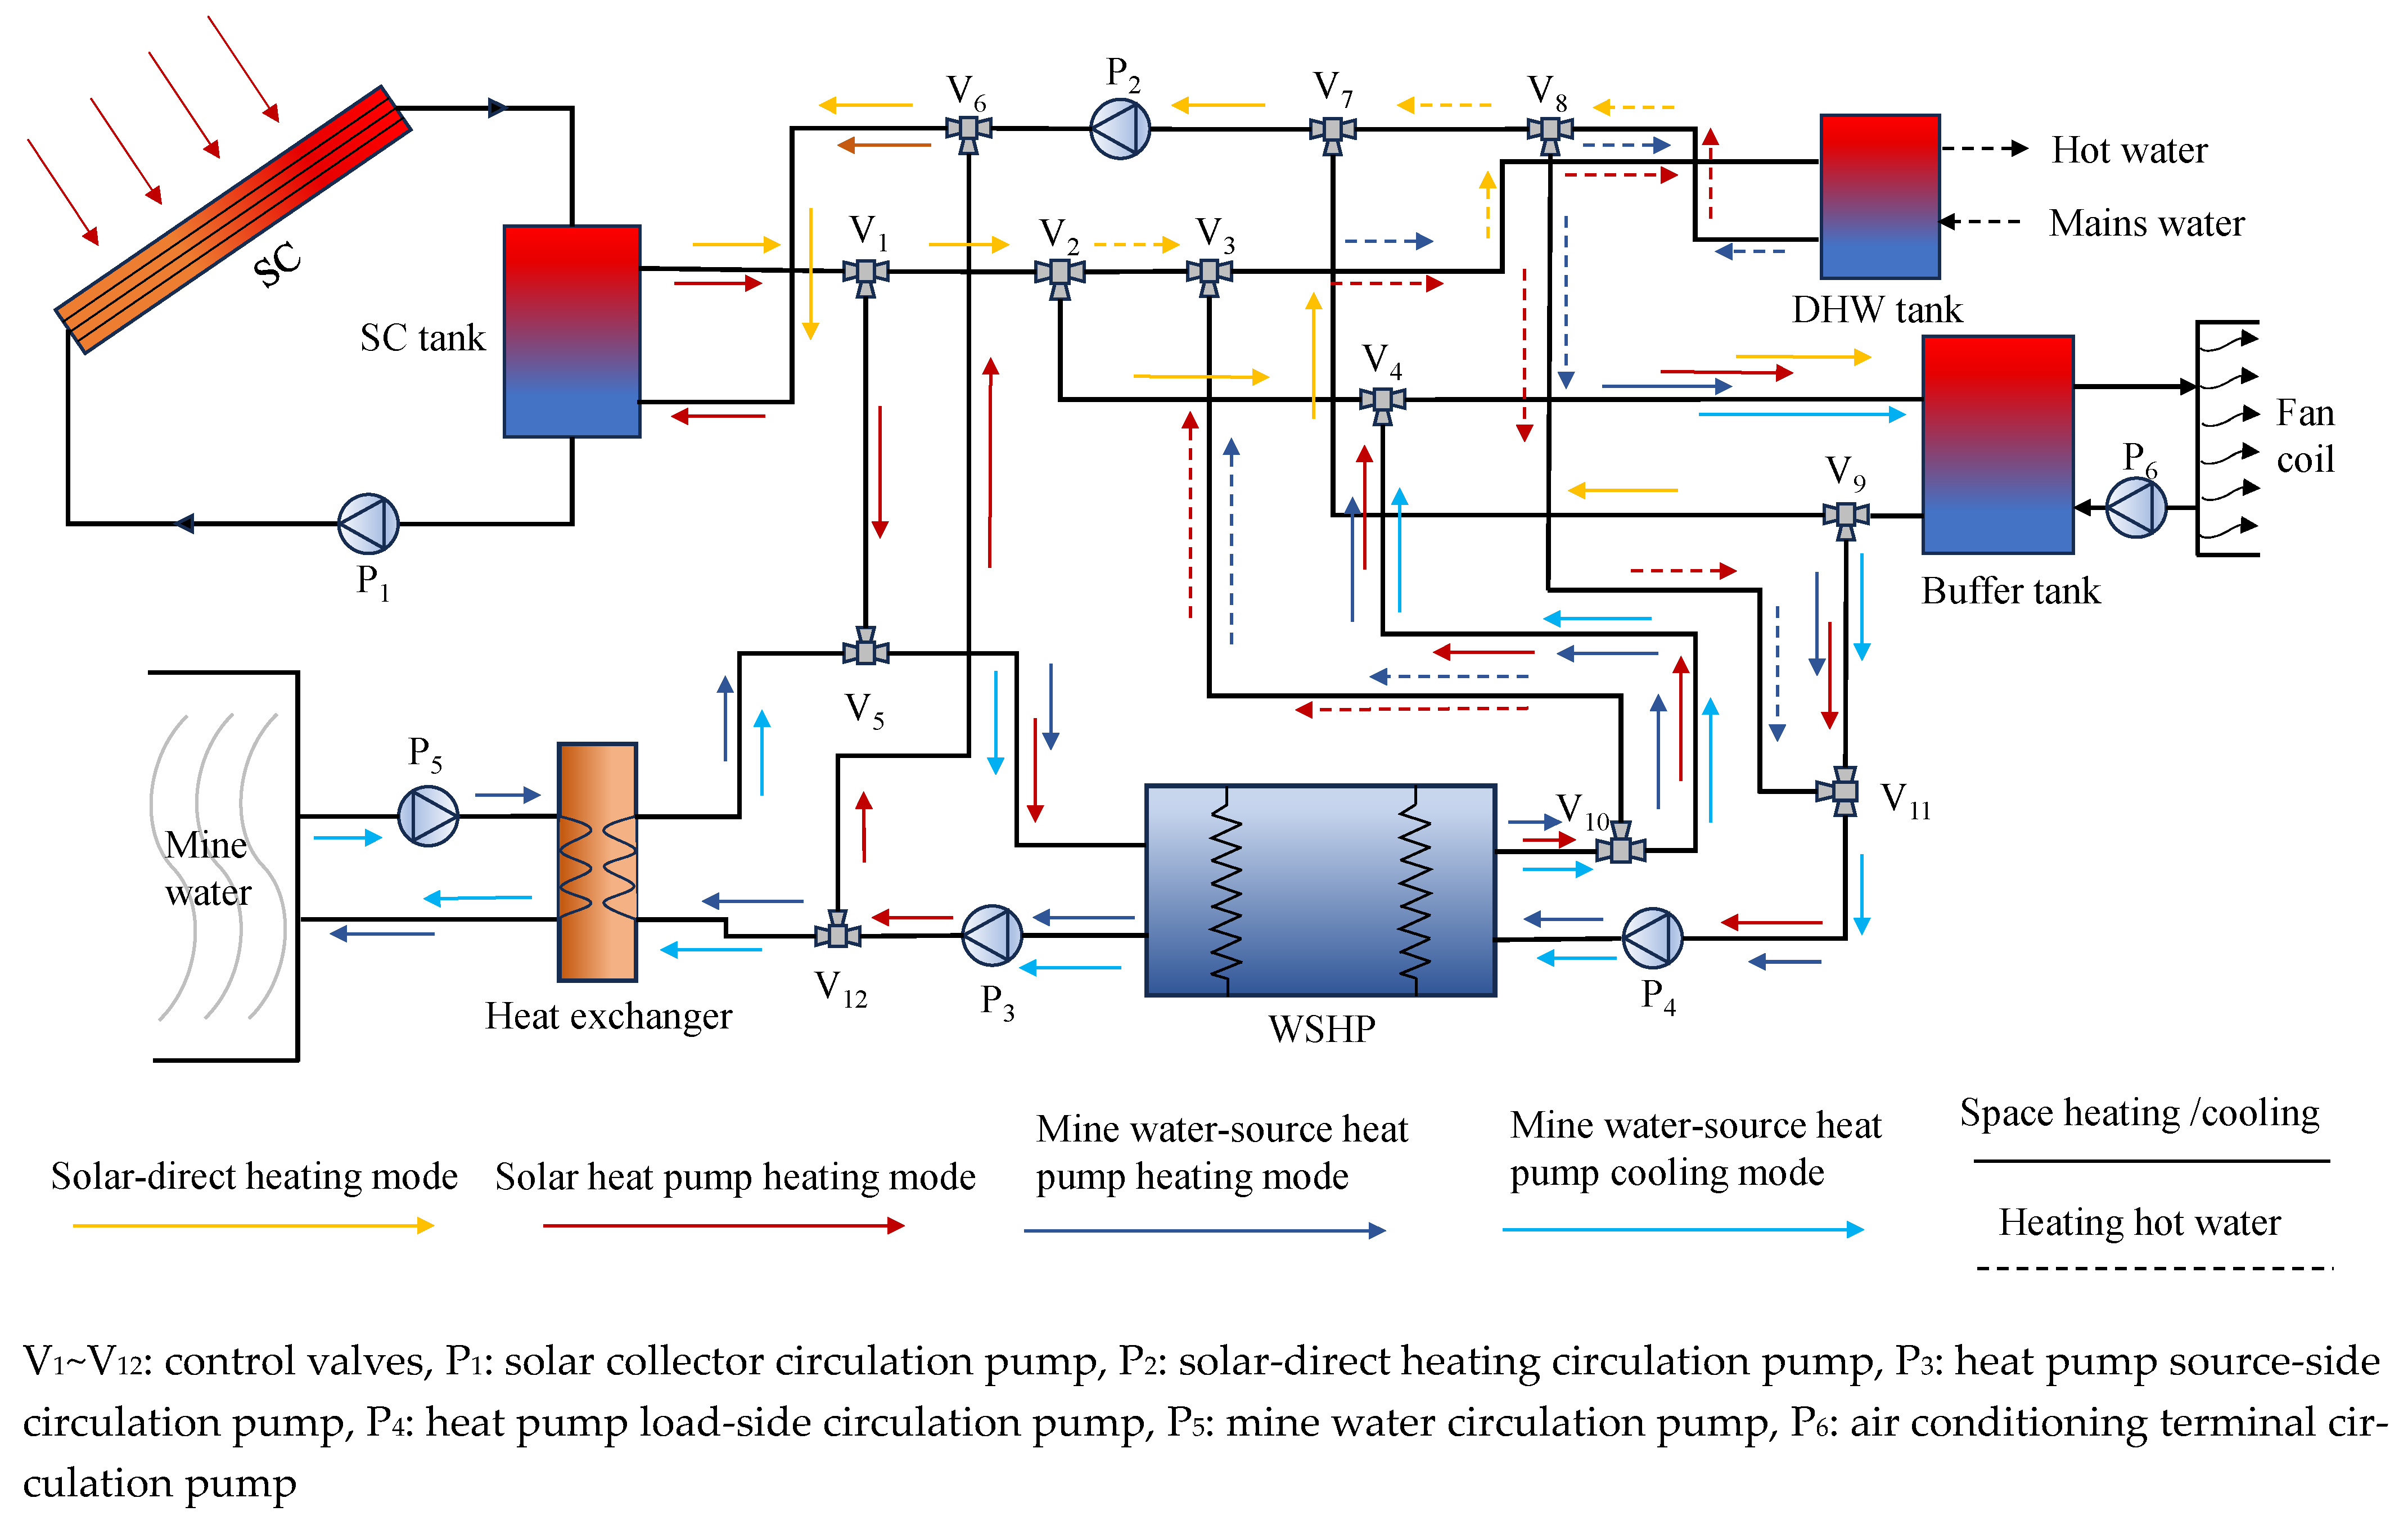
3.1. System Principle

To meet the demands for space heating, cooling, and annual domestic hot water of the buildings, this paper proposes a solar-coupled mine water-source heat pump combined heating and cooling (SMWHP-CHC) system. The system is mainly composed of a solar collector (SC), water-source heat pump (WSHP), solar collector tank (SC tank), terminal tanks (domestic hot water tank (DHW tank) and buffer tank), heat exchanger, circulation pump, control valve, and air conditioning terminal of the system. Based on the variations in climatic conditions and building heat and cooling demands, the operation modes of the system can be categorized into a solar-direct heating mode, solar heat pump heating mode, mine water-source heat pump heating mode, and mine water-source heat pump cooling mode. The system’s principle is shown in Figure 3.
Solar collectors absorb solar radiation heat and store the heat in an SC tank. There are several different heating or cooling modes that this model can use: (1) Solar-direct heating mode: When solar radiation is very sufficient, the heat stored in the SC tank can fully meet the building’s heat demand. Hot water from the SC tank is circulated directly to the terminal tanks. (2) Solar heat pump heating mode: When solar radiation is insufficient, the heat stored in the SC tank cannot fully meet the building’s heat demand. Hot water from the SC tank is used as the heat source for the heat pump to heat the terminal tanks. (3) Mine water-source heat pump heating mode: When extreme weather occurs or at night and there is little absorbed solar radiation heat, intermediate water absorbs the heat from the mine water in the heat exchanger and is then used as the heat source of the heat pump to heat the terminal tanks. (4) Mine water-source heat pump cooling mode: When there is a demand for cooling in the building during space cooling season, the heat pump provides cooling to the buffer tank, while the intermediate water transfers heat to the mine water in the heat exchanger.
The heat or cold energy of the buffer tank is transferred to the indoor space of the building through the fan coil unit of the system terminal, while domestic hot water is provided directly by the DHW tank. The system provides both space heating and hot water during the space heating season, while only providing hot water during the non-heating season. Hot water is mainly provided by the direct solar heating mode during the space cooling season; if special conditions such as extreme weather are encountered, the heat pump can be used for preheating when the cooling mode is not activated.

3.2. Operation Control Strategy

The switching of different operating modes of the system is achieved by controlling the opening and closing of control valves to change the flow direction of the fluid and by controlling the start–stop of the related devices based on monitoring the top water temperature of the SC tank TS1, the bottom water temperature of the SC tank TS2, the average water temperature of the DHW tank Tdhw, the bottom water temperature of the DHW tank Tdhw1, the indoor temperature Tn, and the top water temperature of the buffer tank TL. The specific operation control strategy of the system is shown in Table 2.

4. SMWHP-CHC System Simulation Model

4.1. Mathematical Model of Main Devices

As the system simulation involves coupled calculations between various devices, simple and accurate models are particularly important for improving the accuracy and efficiency of the simulation.
(1)
Solar collector model
A certain amount of heat is lost in the solar collector, and only a part of the solar radiation absorbed by the collector is converted into the heat of the working fluid. Therefore, the effective heat collection is expressed as follows [21]:
Q s c = m s c s ( T s c , o u t T s c , i n )
where m s is the flow rate of the collector system, kg/s; c s is the specific heat of the collector fluid, kJ/(kg∙K); T s c , o u t is the outlet temperature of the fluid to the collector, K; and T s c , i n is the inlet temperature of the fluid to the collector, K.
The collector efficiency is expressed as follows [21]:
η = Q s c A s c I T = F R ( τ α ) n F R U L ( T s c , i n T a ) I T
where I T is the total radiation on the inclined surface of the collector, kW/m2; A S C is the collector area, m2; F R is the overall collector heat removal efficiency factor; ( τ α ) n is the product of the cover transmittance and the absorber absorptance at normal incidence; U L is the loss coefficient of the collector, kW/(m2∙K); and T a is the ambient temperature, K.
(2)
Water-source heat pump model
Water-source heat pumps transfer low-grade thermal energy from water sources to high-grade thermal energy needed for heating and cooling by consuming a small amount of high-grade electrical energy. The outlet water temperature of the heat pump evaporator and condenser is expressed as follows [22]:
T e , out = T e , in Q h e c h m e , T c , out = T c , in + Q h c c h m c
where T e , out is the outlet water temperature of the evaporator side, K; T e , in is the inlet water temperature of the evaporator side, K; Q h e is the heat absorption of the evaporator side, W; m e is the flow rate of the evaporator side, kg/s; T c , out is the outlet water temperature of the condenser side, K; T c , in is the inlet water temperature of the condenser side, K; Q h c is the heat released from the condenser side, W; m c is the flow rate of the condenser side, kg/s; and c h is the specific heat of the fluid, kJ/(kg∙K).
The coefficient of performance (COP) of the heat pump is expressed as follows [22]:
COP = Q h c W h p = Q h c Q h c Q h e
where W h p is the power consumption of the heat pump, W. The heating coefficient of performance is expressed as COPh, and the cooling coefficient of performance is expressed as COPc.
(3)
Energy storage water tank model
After mixing the heated water on the heat source side and the return water on the heating side, the mixed water returns to the heat source end and the heating end, respectively, causing a change in the heat inside the tank. Therefore, the energy balance equation of the tank is expressed as follows [23]:
d T t a n k d t = Q i n , t a n k Q o u t , t a n k Q l o s s c t a n k
where Q i n , t a n k is the heat gain for the heat source side of the tank, kJ/h; Q o u t , t a n k is the heat consumption for the heating side of the tank, kJ/h; Q l o s s is the heat loss of the tank, kJ/h; and c tan k is the heat capacity of the tank fluid, kJ/K.
This study utilized the vertical stratified water tank model. Due to the different densities of water at different temperatures, the water temperature in the tank was stratified during the operation of the system. Assuming the water in the tank is stratified into j layers, the energy balance equation for node j is expressed as follows [23]:
Q c o n d , j = k j A j T j T j + 1 L c o n d , j + k j 1 A j 1 T j T j 1 L c o n d , j 1
where j is the current node; j + 1 is the node directly below the current node; j − 1 is the node directly above the current node; k is the thermal conductivity of fluid, kJ/(h · m · k); A is the heat transfer interface area, m2; T j is the temperature of node j, K; and L is the vertical distance of the center point, m.
(4)
Exchanger model
The calculation of heat transfer in the model adopts the effectiveness–number of transfer units method. Based on the heat capacity and inlet temperature of the fluids on both sides of the heat exchanger, the heat transfer effectiveness of the heat exchanger is expressed as follows [24]:
ε = 1 exp ( N T U ( 1 C m i n C max ) ) 1 ( C m i n C max ) exp ( N T U ( 1 C m i n C max ) )
where C min and C max are the higher and lower heat capacities of the fluid on both sides of the heat exchanger, respectively; and NTU is the number of transfer units.
The outlet temperature of the hot and cold fluid on both sides of the heat exchanger is expressed as follows [24]:
T h o = T h i ε ( C m i n C h ) ( T h i T c i ) , T c o = T c i + ε ( C m i n C c ) ( T h i T c i )
where T i and T o are the inlet and outlet temperatures of the heat transfer fluid, °C, respectively; and subscripts h and c are the hot fluid and cold fluid, respectively.

4.2. Establishment of SMWHP-CHC System’s TRNSYS Simulation Model

Combined with the operational principle and control strategy of the system, a transient simulation model of the SMWHP-CHC system was established in TRNSYS, as shown in Figure 4. The system model was composed of various modules in TRNSYS, and the main components used included meteorological data module Type15-2, solar collector module Type1b, water-source heat pump module Type927, energy storage tank module Type158, exchanger module Type5b, constant flow pump module Type114, variable flow pump module Type110, control valve module Type11, and ideal air conditioning terminal Type682.
The main parameters of the devices were designed and selected based on the characteristics of the building load of the case and relevant design specifications [25,26]. The selected solar collector was the flat plate solar collectors from Haier manufacturer (Qingdao, China), the water-source heat pump was selected from Gree manufacturer (Zhuhai, China), and the selected heat exchanger was the counter-flow plate heat exchanger from ARD manufacturer (Shanghai, China). The main parameters of each device are shown in Table 3.

4.3. Evaluation Index

This paper employed the system heat supply, cooling supply, operating power consumption, solar contribution rate, heat pump COP, and system coefficient of performance as evaluation indices to analyze the operational performance of the system. The equations for determining these metrics are given below.
(1)
System heat/cooling supply, operating power consumption:
Q h , sup = 0 t Q h , s + Q h , s h + Q h , m w h d t Q c , sup = 0 t Q c , m w h d t E h s = 0 t W 1 + W 2 + W 3 + W 4 + W 5 + W 6 + W 7 d t E c s = 0 t W 1 + W 4 + W 5 + W 6 + W 7 d t
where Q h , sup is the total heat supply of the system, kWh; Q h , s is the solar-direct heat supply, kWh; Q h , s h is the solar heat pump heat supply, kWh; Q h , m w h is the mine water-source heat pump heat supply, kWh; Q c , sup is the cooling supply of the system, kWh; Q c , m w h is the mine water-source heat pump cooling supply, kWh; E h s is the heating power consumption of the system, kWh; E c s is the cooling power consumption of the system, kWh; and W 1 , W 2 , W 3 , W 4 , W 5 , W 6 , W 7 are the operating power consumption of the heat pump, solar collector circulation pump, solar-direct heating circulation pump, heat pump source-side circulation pump, heat pump load-side circulation pump, mine water circulation pump, and terminal circulation pump, kWh, respectively.
(2)
Solar contribution rate:
SF = Q S , sup ( Q S , sup + Q h , m w )
where Q S , sup is the total solar heat supply of the system, which is the sum of the solar-direct heat supply Q h , s and the solar heat pump heat supply Q h , s h , kWh;
(3)
Heating coefficient of performance of the system (COPsys) and cooling energy efficiency ratio of the system (EERsys):
COP sys = Q h , sup E h s , EER sys = Q c , sup E c s

5. SMWHP-CHC System Optimization Scheme

5.1. Optimization Objective

The power consumption of the system and the investment in the device have an impact on the overall efficiency of the system operation. Generally, high efficiency and low investment are contradictory. Therefore, this study selected the minimum annual cost as the optimization objective, comprehensively considering the operating efficiency and economic cost to design the system with the least investment and relatively highest efficiency. The annual cost ( A W ) is determined as follows:
A W = C O + i ( 1 + i ) n ( 1 + i ) n 1 C I
where CI is the system investment cost, CNY; CO is the system operating cost, CNY; i is the standard rate of return, 4.2%; and n is the service life of the devices, 20 years in this study. The initial investment includes the solar collector investment, WSHP investment, tank investment, heat exchanger investment, circulation pump investment, and other ancillary devices investment. The specific devices’ prices are shown in Table 4. The initial investment (CI) is determined as follows:
C I = A s c E A + ( V 1 + V 2 + V 3 ) E V + C H P E H P + P f E P + E O
where E A is the unit area price; V 1 , V 2 , and V 3 are the volumes of the SC tank, buffer tank, and DHW tank, respectively; E V is the unit price of tank volume; C H P is the heat pump rated capacity; E H P is the price per unit of heat pump capacity; P f is the circulation pump rated flow; E P is the price per unit of pump flow rate; E O is the price of piping and fittings, considered as 15% of the cost of the solar collector and heat pump in this study.
The operating cost of the system is mainly the electricity generated by the use of devices. The operating cost (CO) is determined as follow:
C O = ( W 1 + W 2 + W 3 + W 4 + W 5 + W 6 + W 7 ) E
where E is the local electricity price, which at trough, flat peak, and peak hours are 0.3, 0.49, and 0.56 CNY/kWh, respectively.

5.2. Optimization Variable

Variables are crucial factors that need to be determined in optimization problems. There are many influencing variables that affect the investment cost and operating cost components of the annual cost of the SMWHP-CHC system, and the variables are coupled with each other and the relationship is complex. In this study, the SC area, SC slope, SC azimuth, SC tank volume per unit collector area (Var), solar collector circulation pump rated flow rate per unit collector area (Far), solar-direct heating circulation pump rated flow rate (Fsh), heat pump capacity, DHW tank volume, and buffer tank volume were selected as the optimization variables of the system.
When solving the optimization problem, constraints are usually required. The independent variable constraints limit the value range of each variable. The specific ranges and optimization step sizes of each variable are shown in Table 5. The dependent variable constraints are as follows: (1) To meet the space heating, space cooling, and hot water load requirements of the building, ensure that the indoor temperature is maintained within the set range, and that the DHW tank outlet temperature is not lower than 45 °C; (2) To guarantee the normal space heating and space cooling at the terminal system, the buffer tank outlet temperature should be no lower than 45 °C during the space heating season and no higher than 7 °C during the space cooling season; (3) To meet the design’s minimum solar energy requirement, the solar contribution rate must not be less than 16%. By converting the moments that fail to meet the requirements into a “penalty” of CNY 50,000 to increase cost constraints, the objective function can be minimized while meeting the requirements.

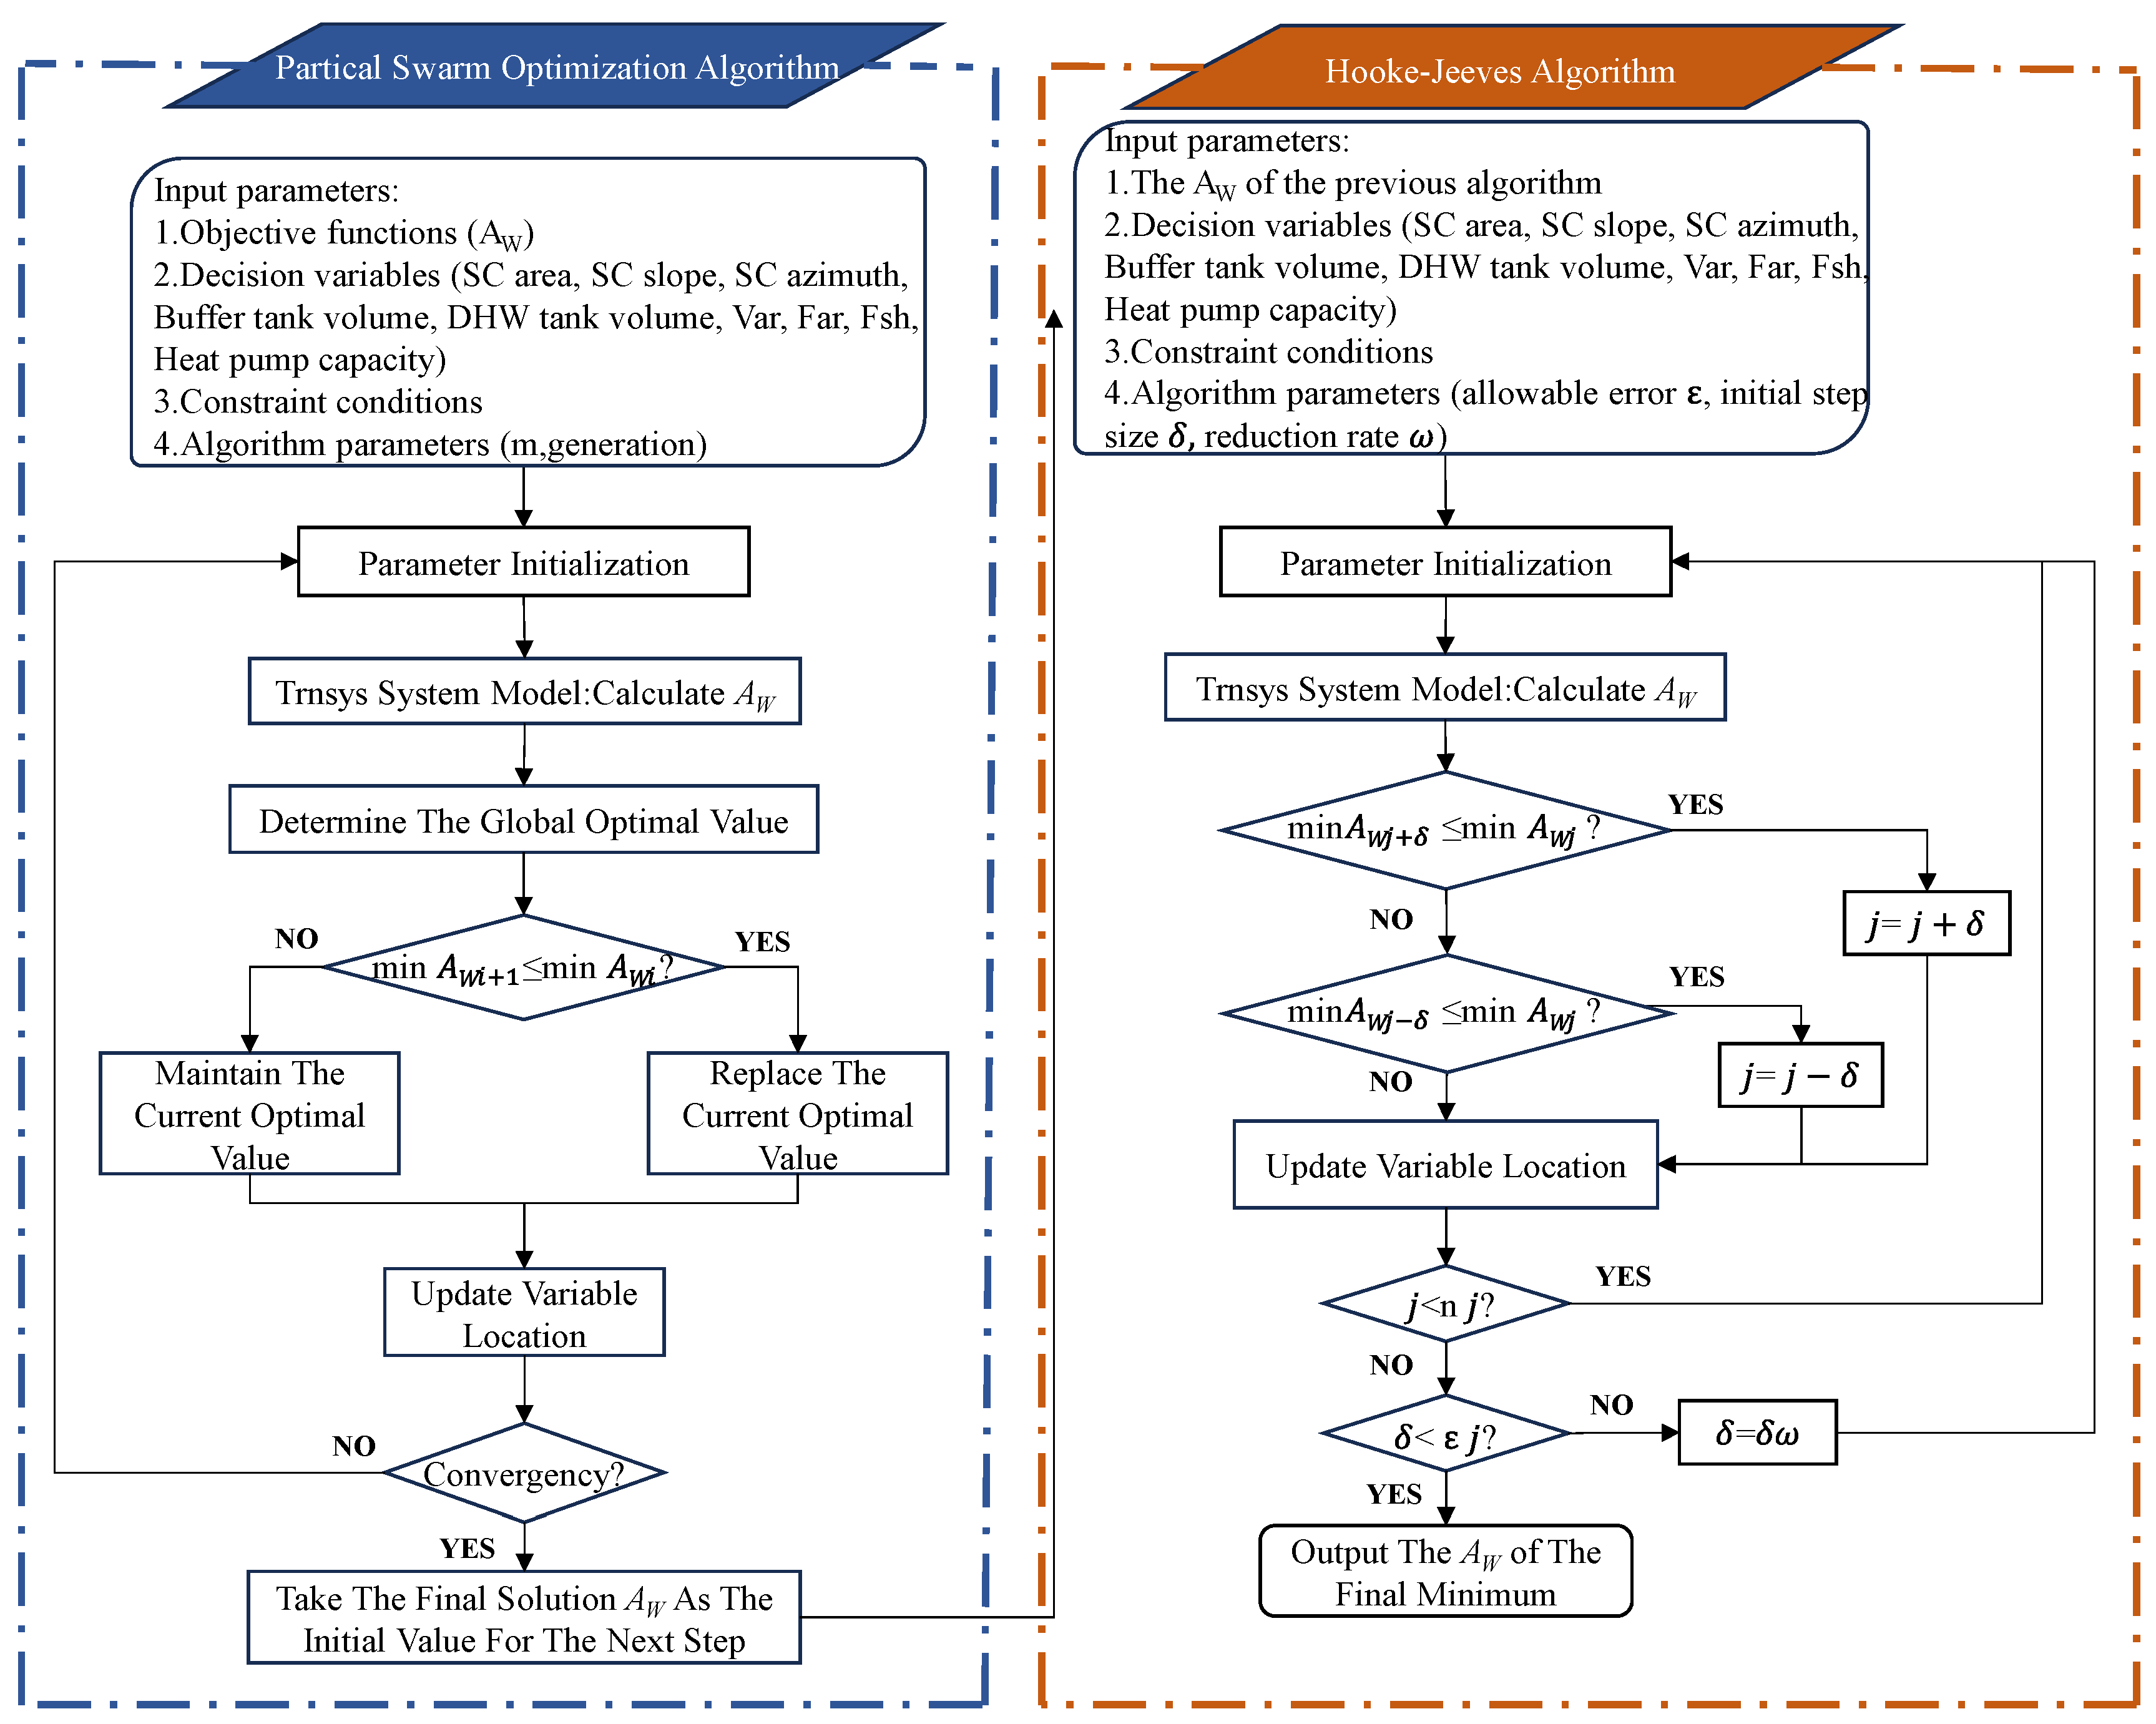
5.3. Optimization Algorithm

The parameter optimization matching problem of the SMWHP-CHC system involves many types of energy and devices and the control is complex. Consequently, it is difficult to achieve global optimization by using a traditional single optimization algorithm. The PSO-HJ hybrid optimization algorithm, which combines the particle swarm optimization algorithm (PSO) and the Hooke–Jeeves algorithm, firstly provides a set of better initial points through the global search ability of the PSO [27], and then further optimizes the system near the initial points found by the PSO through the local search ability of Hooke–Jeeves [28], thereby enhancing the global search and convergence ability and avoiding premature convergence of the optimization.
This paper employed a PSO-HJ hybrid optimization algorithm, and the system optimization was performed by combining TRNSYS and the optimization software GenOpt 2; these two software programs were linked through the TRNOPT module in TRNSYS. The system optimization process is shown in Figure 5.

6. Results and Discussion

6.1. SMWHP-CHC System Performance Analysis

The TRNSYS simulation model of the SMWHP-CHC system established above was used to simulate and calculate the system’s annual operation. Based on the simulation results, the system’s performance was analyzed as follows.

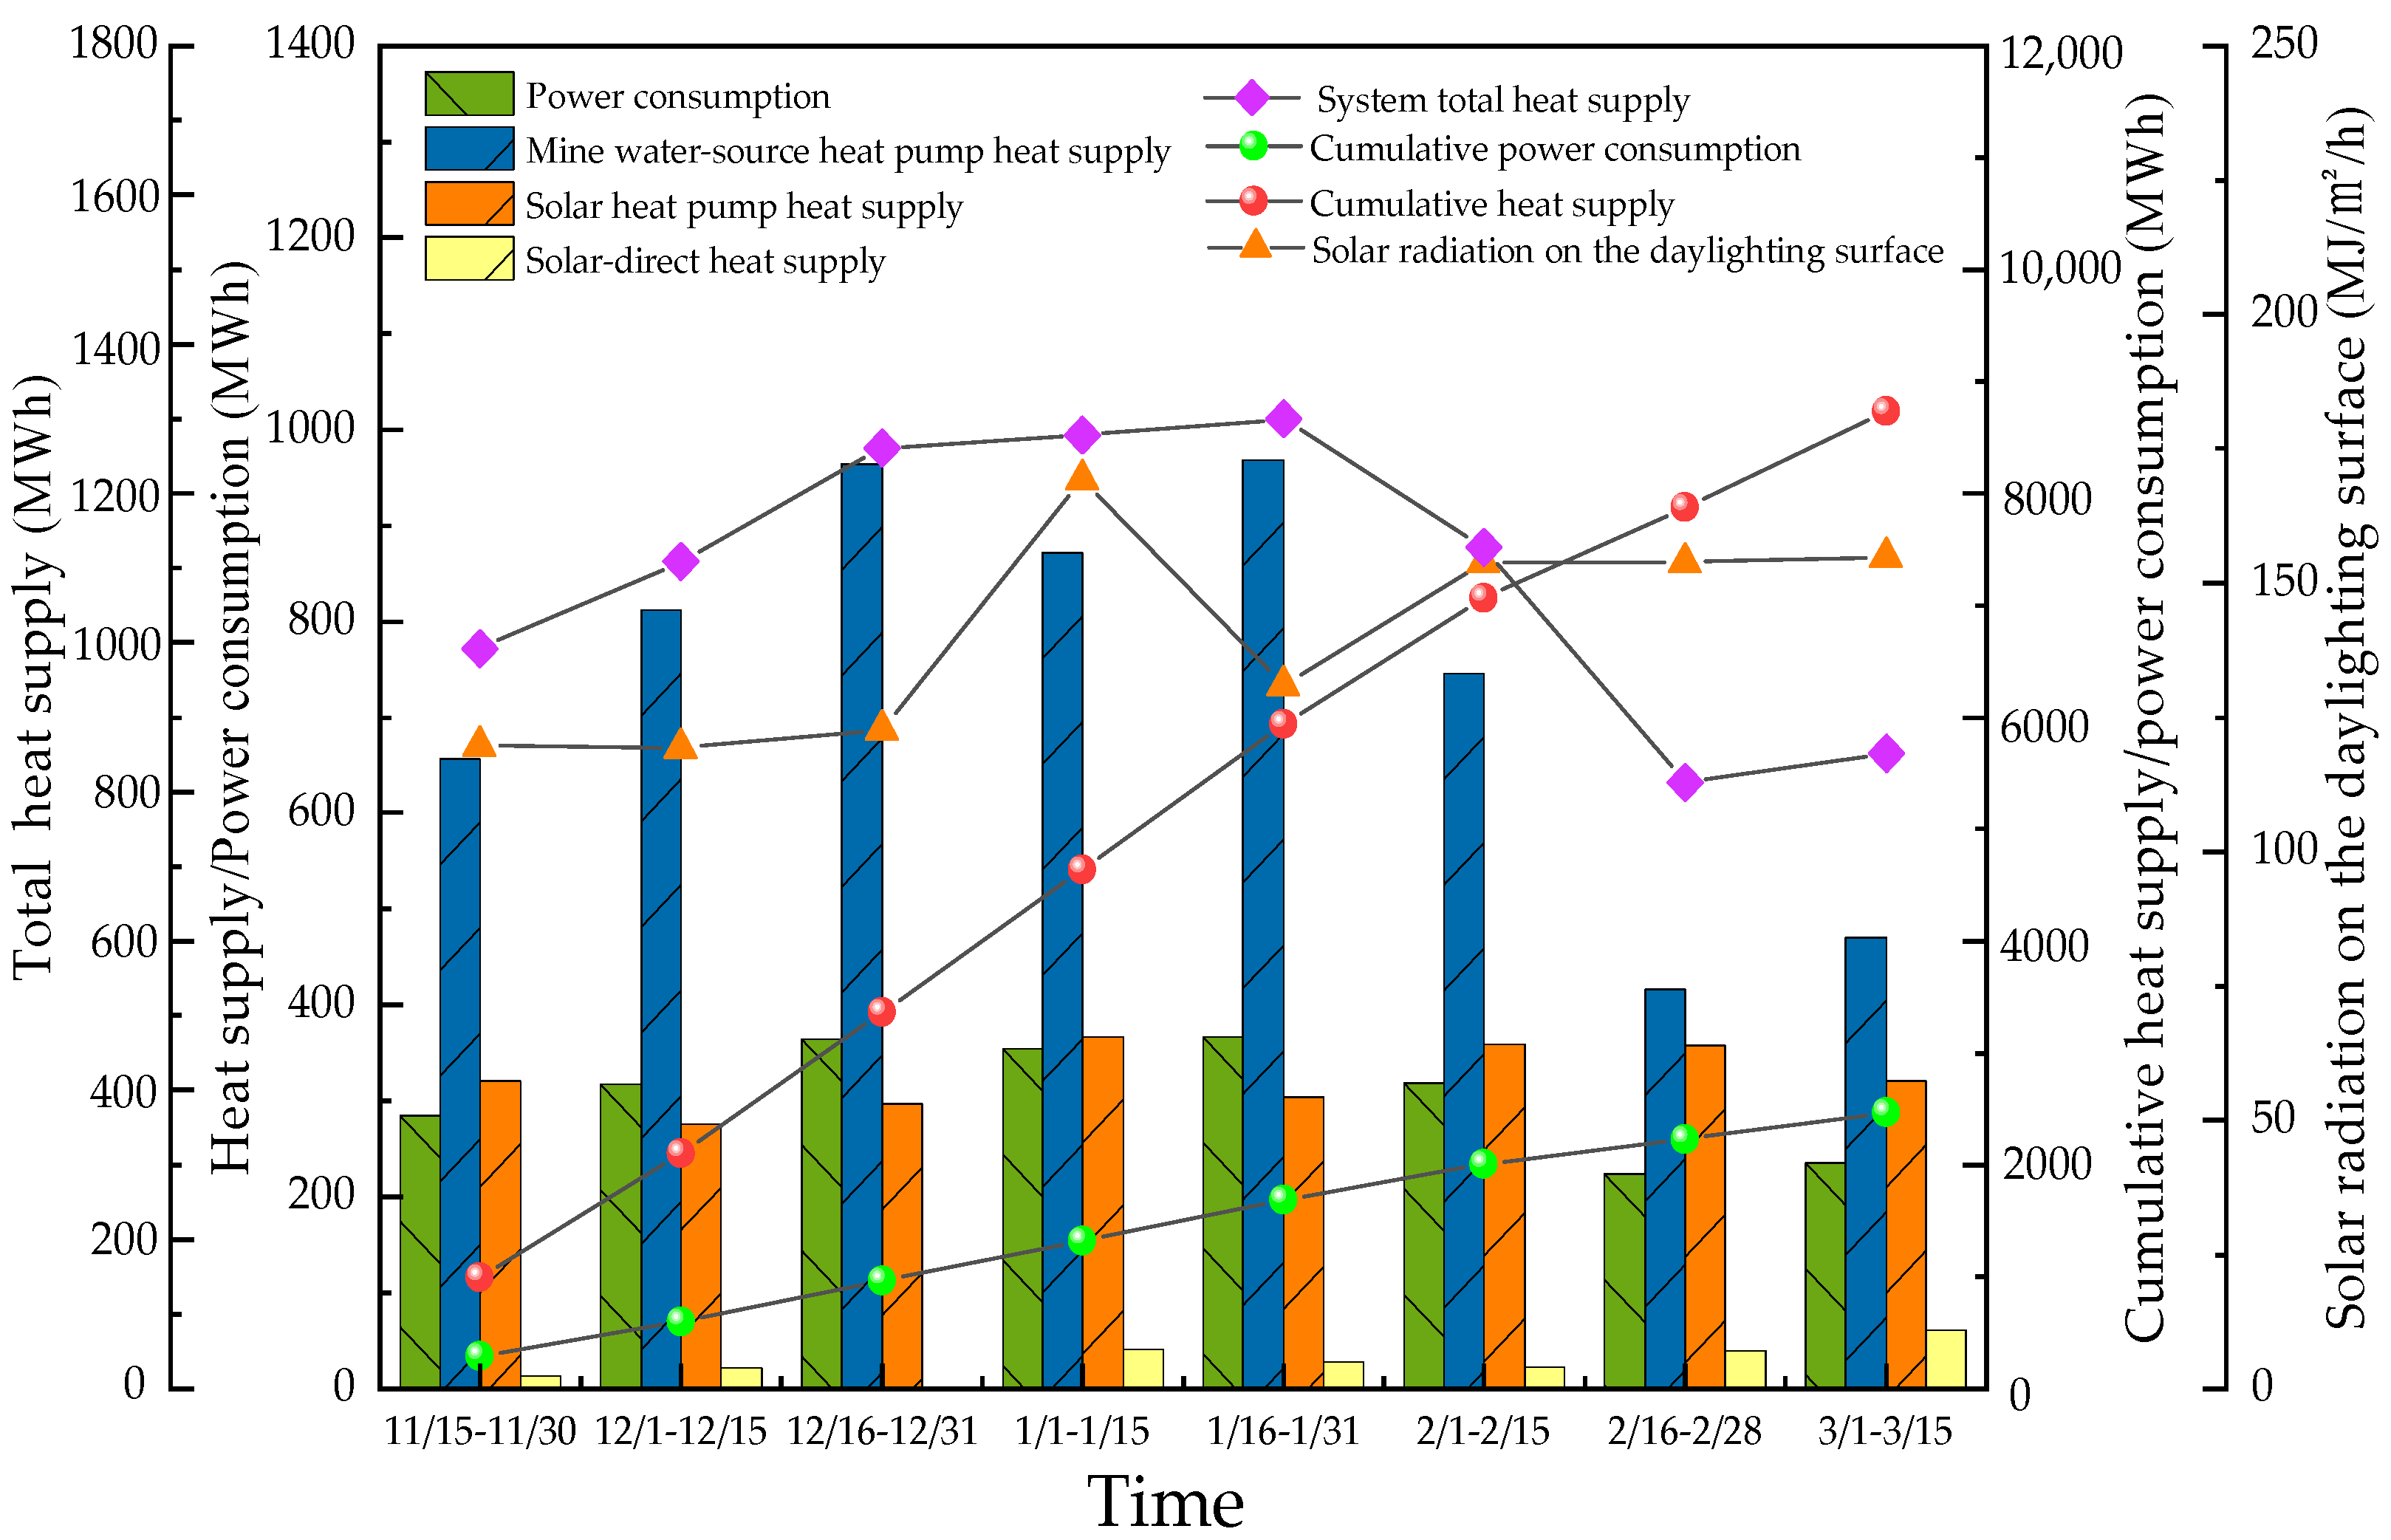
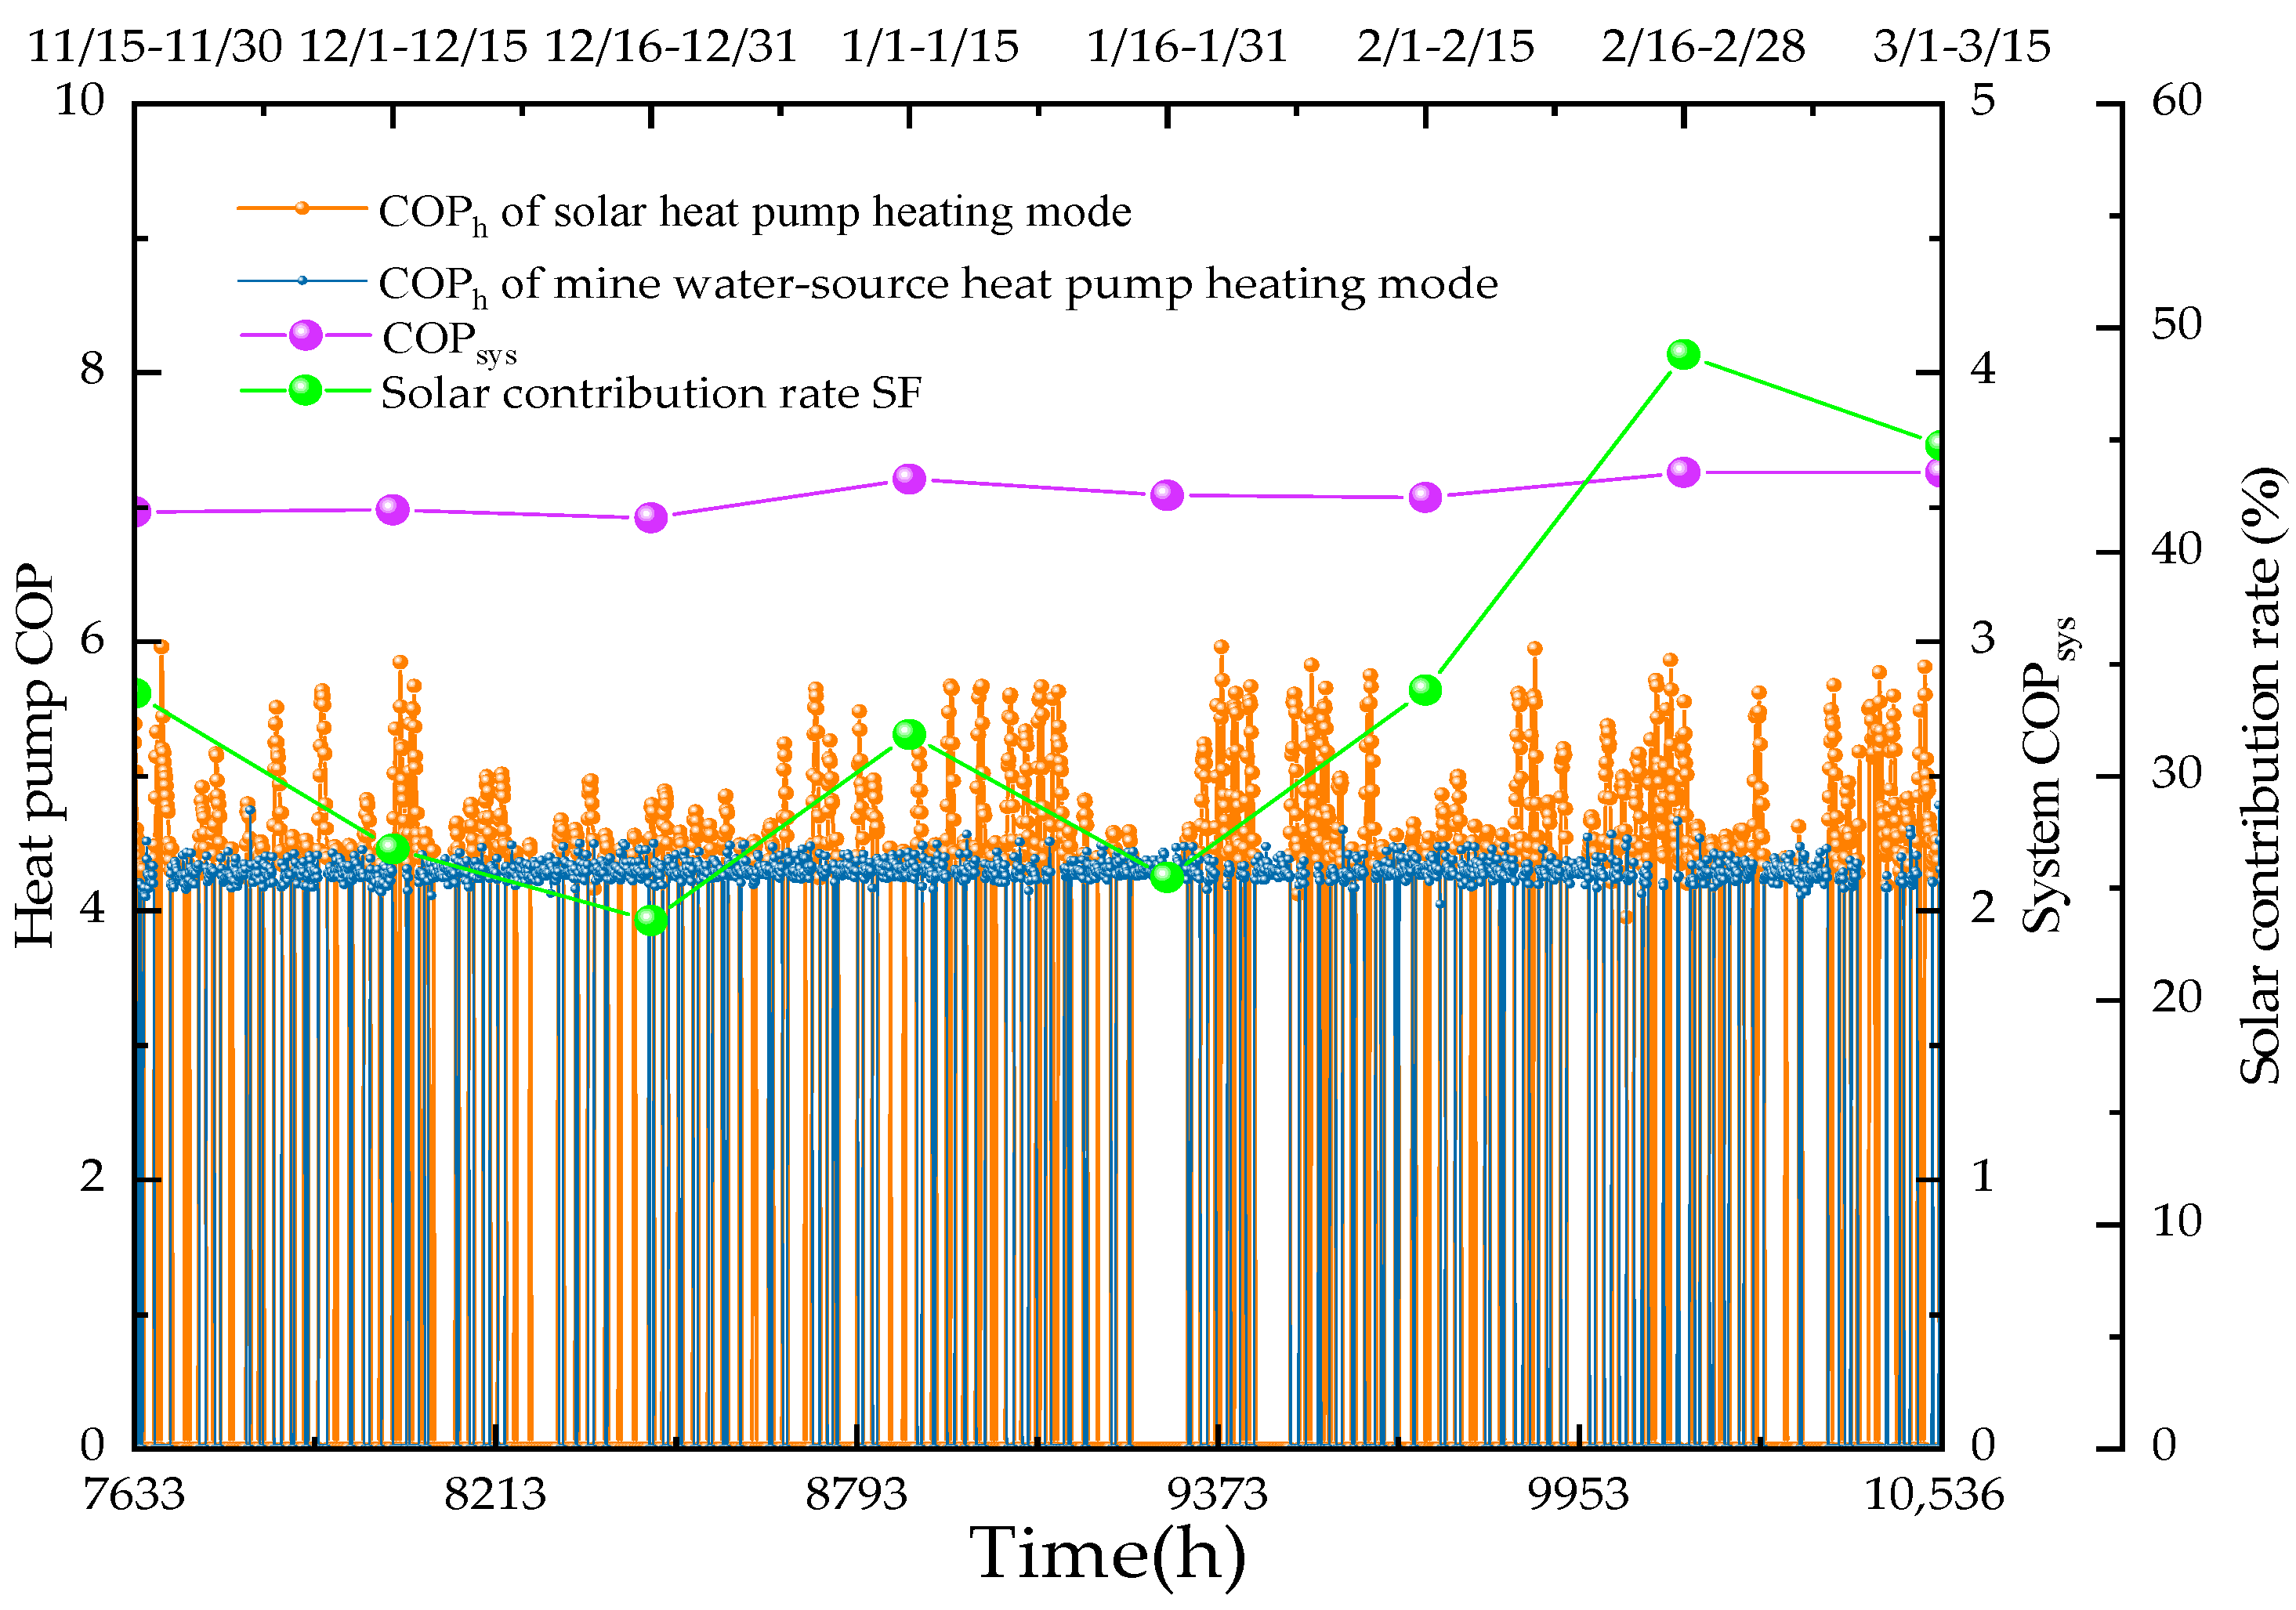
6.1.1. Analysis of System Performance during the Space Heating Season

Figure 6 shows the semi-monthly variations of heat supply and power consumption of the system during the space heating season. The total heat supply of the system exhibited a trend of increasing first and then decreasing, consistent with the building’s total heat load variation. The variation trend of the total solar heat supply was the same as that of the solar radiation intensity on the daylighting surface. Throughout the space heating season, the building’s heat load included not only the space heating load but also the domestic hot water load, with the hot water load being at the highest period of the year, while the solar radiation intensity was at the lowest period of the year, making it difficult to meet the building’s heat demand by solar-direct heating for most of the time. During the early to mid-season, the solar radiation intensity was relatively weak, while both the building’s space heating load and the hot water load were at high levels, and the building’s heat demand was mainly supplied by the mine water-source heat pump. During the late season, the solar radiation intensity gradually increased, leading to higher solar thermal collection, and the building’s heat load gradually decreased synchronously, resulting in a gradual increase in the proportion of solar energy to bear the heat load. The power consumption of the system increased with the increase in the heat pump heat supply.
In the whole space heating season, the cumulative solar-direct heat supply was 2.256 × 10⁵ kWh, the cumulative heat supply of the solar heat pump was 2.599 × 10⁶ kWh, the cumulative heat supply of the mine water-source heat pump was 5.904×10⁶ kWh, and the cumulative total heat supply of the system was 8.728 × 10⁶ kWh. The cumulative power consumption of the system was 2.465 × 10⁶ kWh.
Figure 7 shows the variations of the COPsys, heat pump COPh, and solar contribution rate SF during the space heating season. A COP of 0 indicates that the heat pump was not operational. The COPh of the solar heat pump heating mode was generally higher than that of the mine water-source heat pump heating mode due to the higher water temperature in the SC tank. The maximum COPh of the solar heat pump heating mode was 5.96, with an average of 4.75. The COPh of the mine water-source heat pump heating mode was relatively stable due to the stable temperature of the mine water, with an average of 4.29.
The SF exhibited a trend of first decreasing and then increasing. During the first half of the space heating season, due to the relatively weak solar radiation intensity, and with the increasing demand for building heat, the SF gradually decreased, and the SF was at least 23.55%. With a slight increase in the solar radiation intensity in the first half of January, the SF also slightly increased. During the second half of the space heating season, the solar radiation intensity rapidly increased, while the building’s heat demand gradually decreased. Consequently, the SF gradually increased, reaching a peak of 48.8% at the end of the space heating season, nearly half of the total heat demand. The SF during the entire space heating season was 32.4%.
The trend of the COPsys was consistent with the variation of the SF. The system power consumption was lower in the solar heating mode, especially as the proportion of the solar-direct supply increased at the end of the space heating season, resulting in a reduced heat pump operating time and significantly decreased power consumption. The highest COPsys reached 3.63, and the COPsys of the entire space heating season was 3.54.

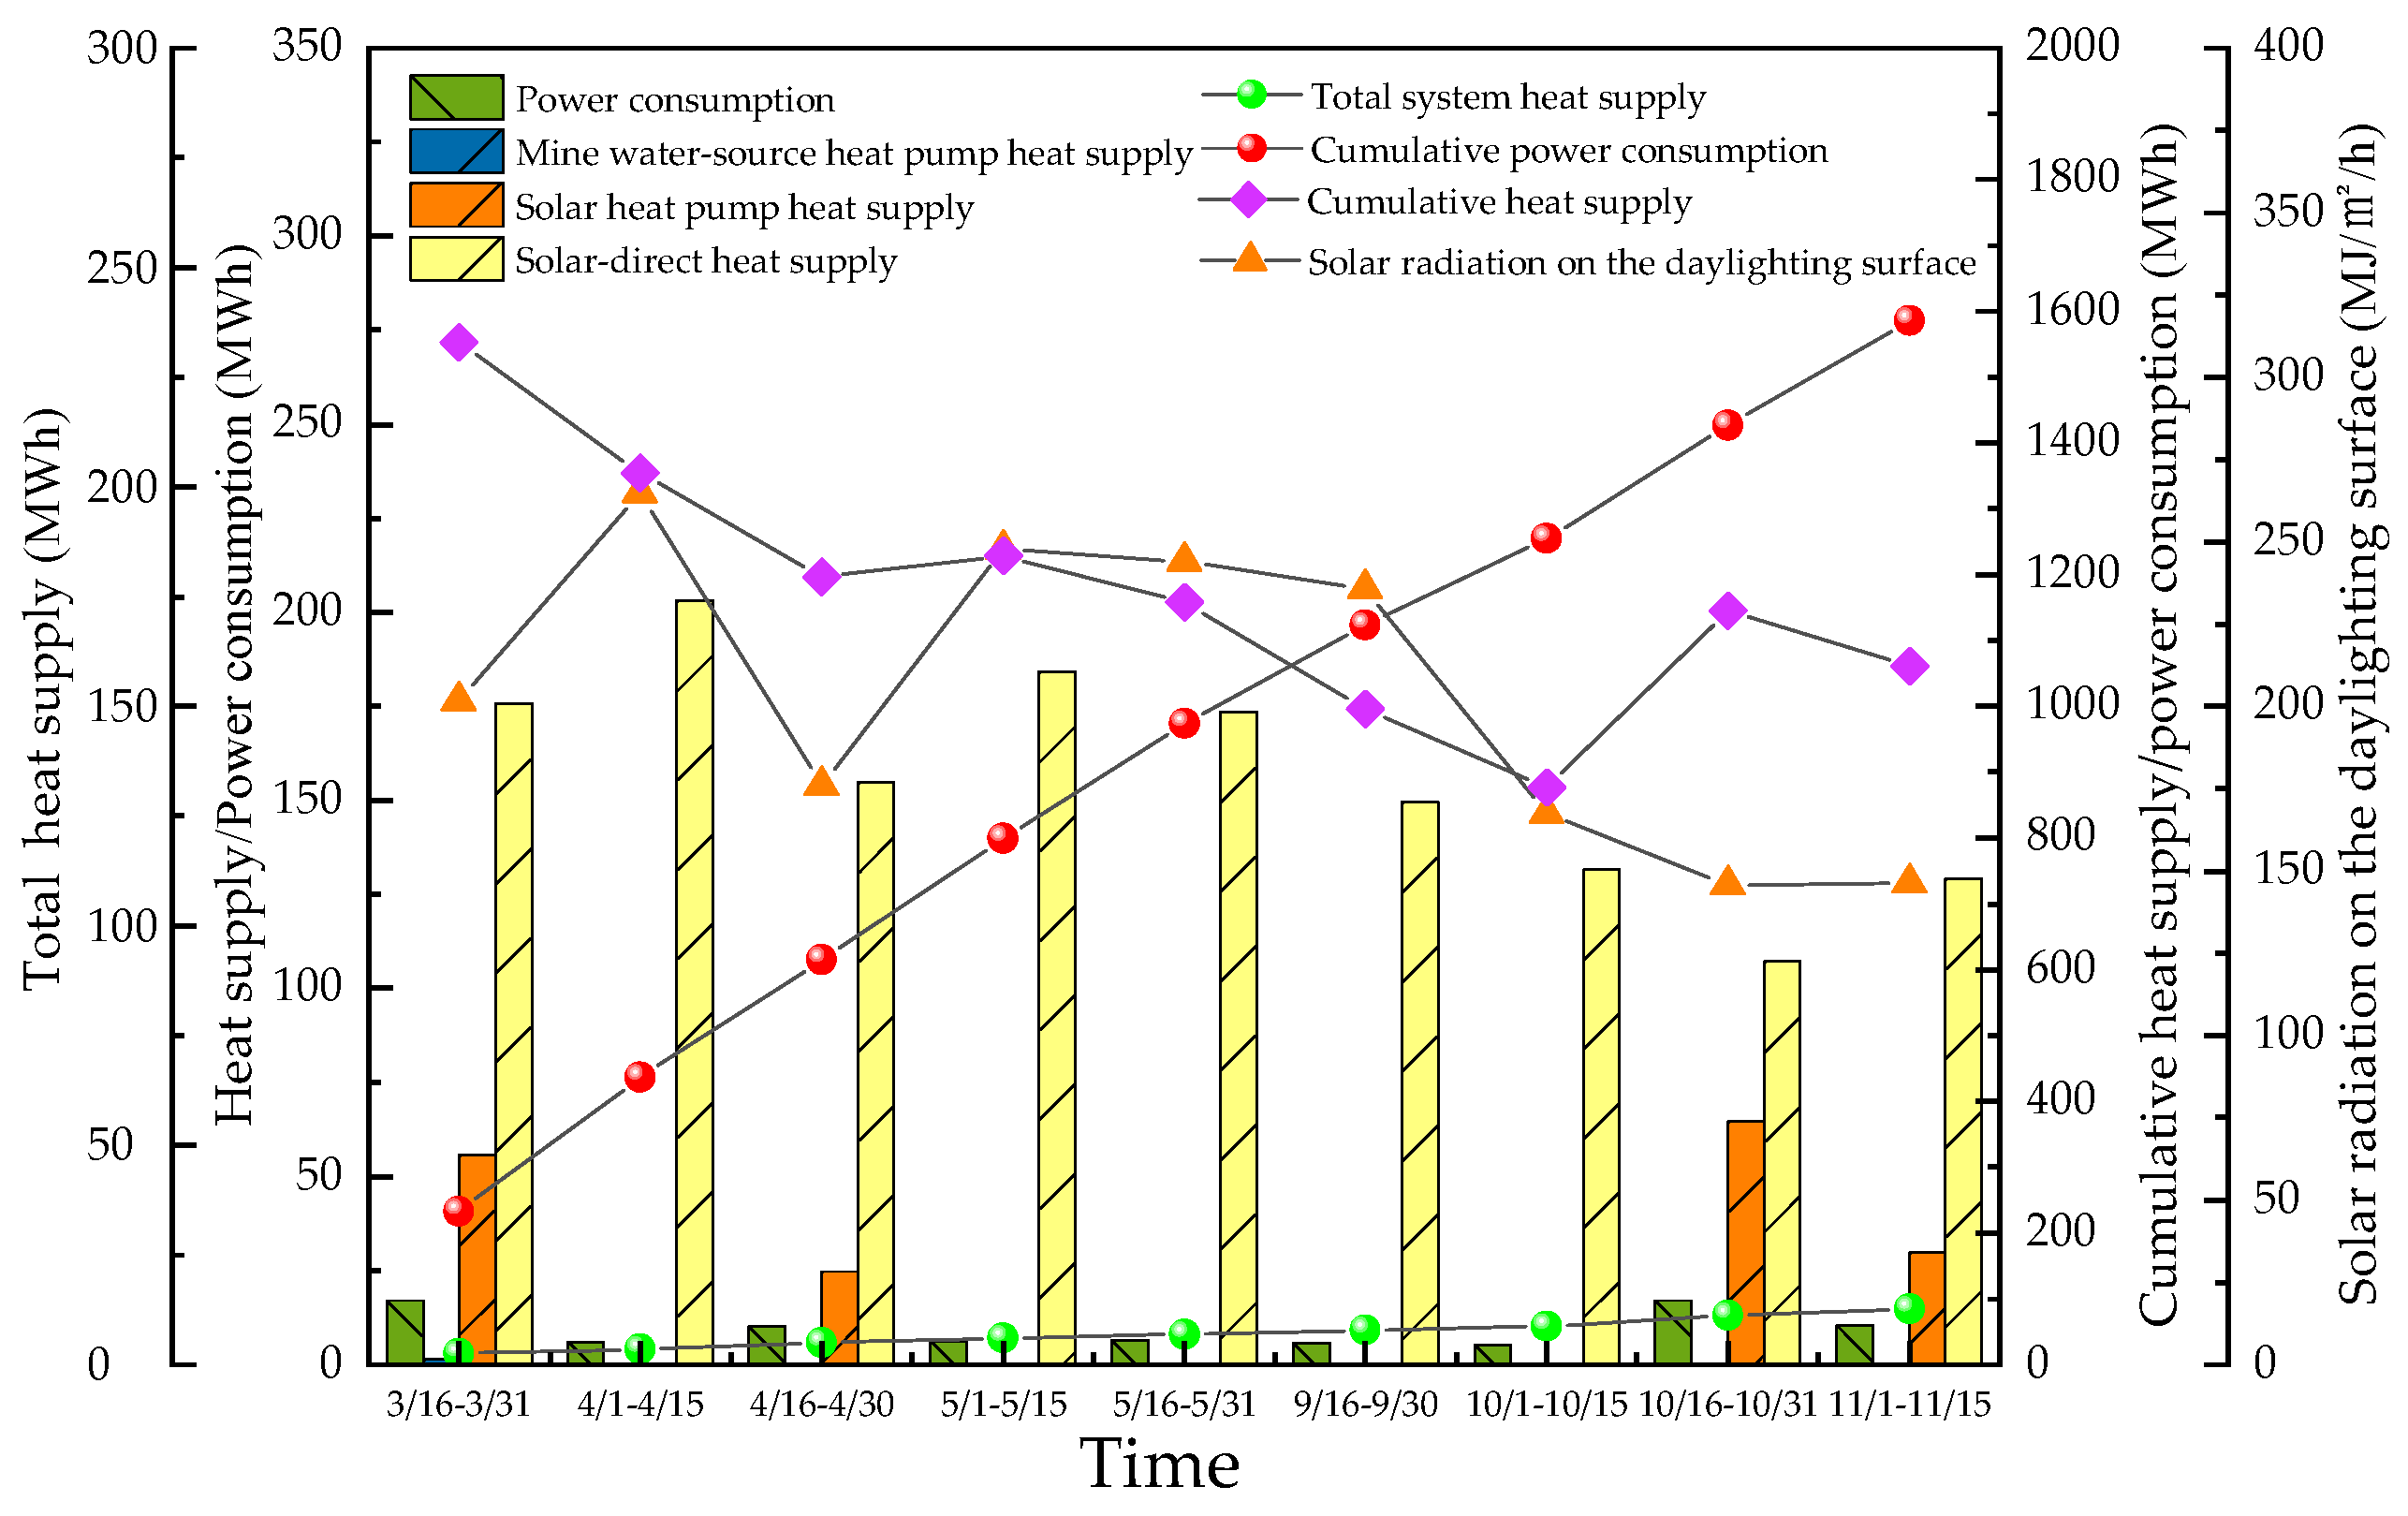
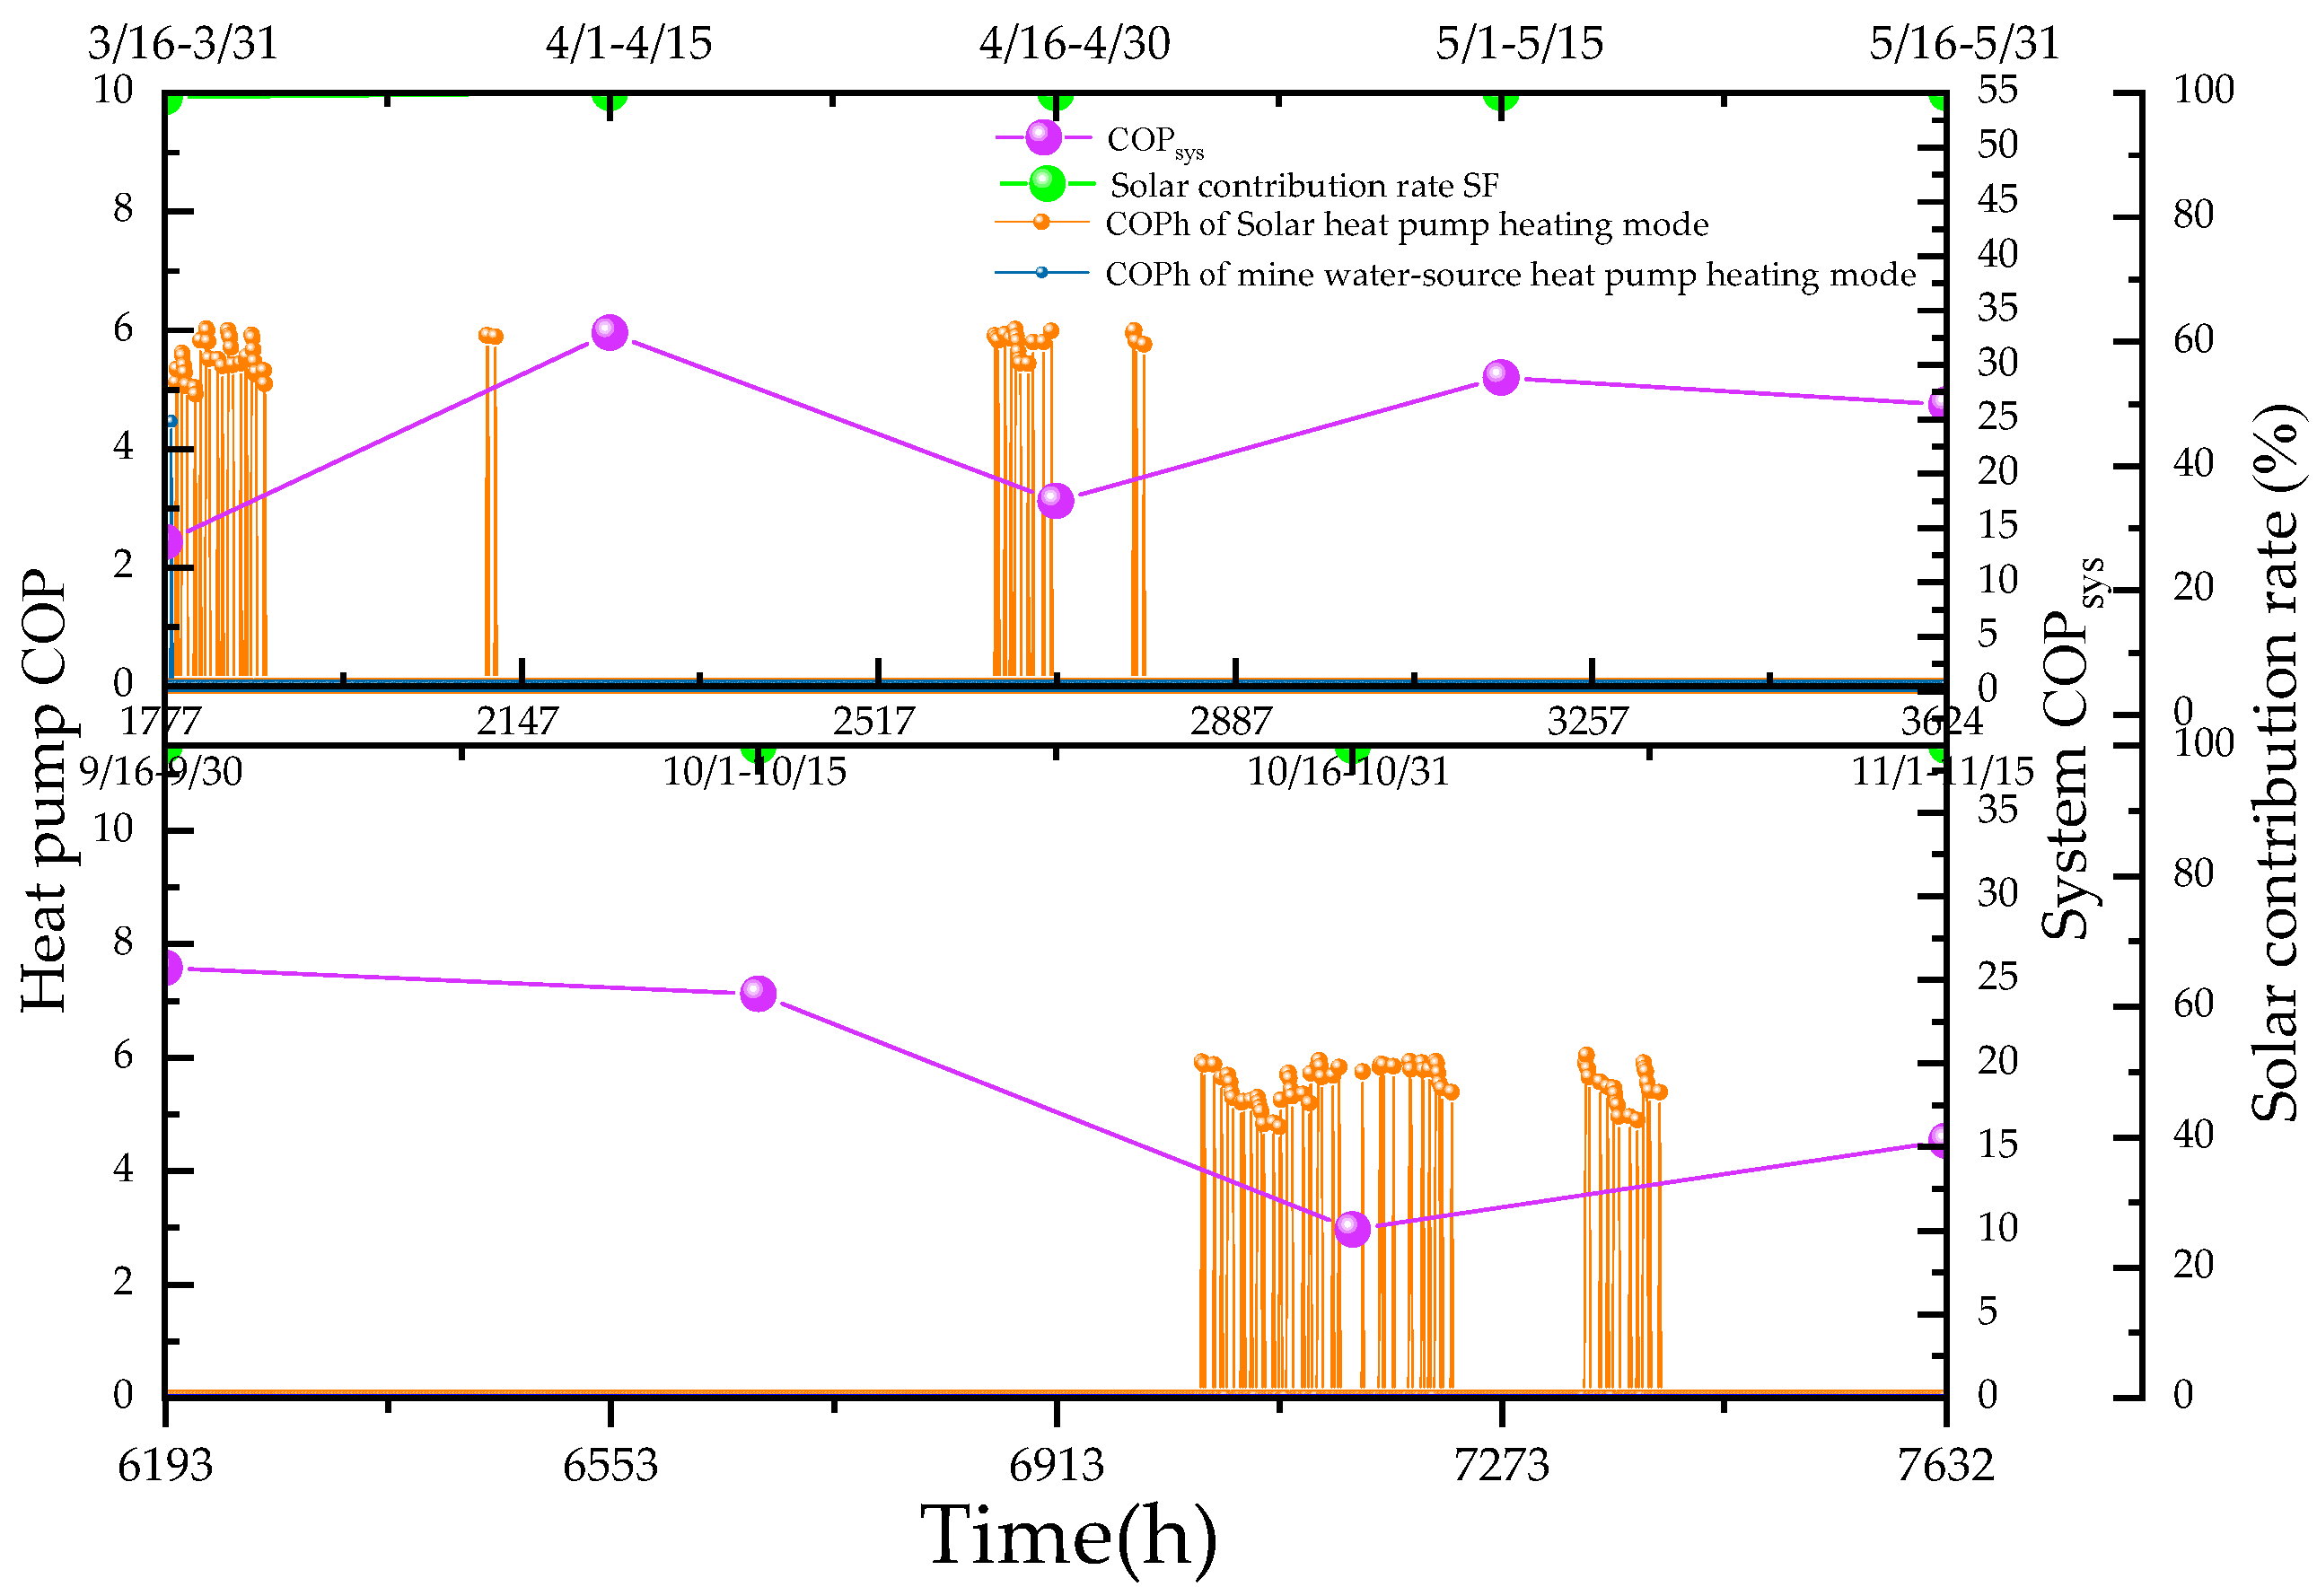
6.1.2. Analysis of System Performance during the Transition Season

Figure 8 shows the semi-monthly variations of the heat supply and power consumption of the system during the transition season. Throughout the transitional season, the buildings only have a demand for domestic hot water. Due to the mains water temperature generally being higher than that in the space heating season, the building’s heat demand was significantly lower and almost entirely met by solar energy. During the transitional season of the first half of the year, the total heat supply of the system gradually decreased due to the decrease in the hot water load. During the transitional season of the second half of the year, as the hot water load rose to a certain level before decreasing, the total heat supply of the system showed a trend of initially decreasing and then increasing. At the beginning and end of the transition season, the solar radiation intensity was relatively low and the hot water load was high, leading to solar-direct heating not being able to fully meet the demand for hot water. Consequently, the proportion of the solar heat pump heat supply increased, and the power consumption of the system also increased. During the late transitional season of the first half and the early transitional season of the second half of the year, the solar radiation intensity was high and the hot water load was relatively low, so solar-direct heating could fully meet the demands.
In the whole transition season, the cumulative solar-direct heat supply of the system was 1.409 × 10⁶ kWh, the cumulative heat supply of the solar heat pump was 1.749 × 10⁵ kWh, the cumulative heat supply of the mine water-source heat pump was 1.478 × 10³ kWh, and the cumulative total heat supply of the system was 1.585 × 10⁶ kWh. The cumulative power consumption of the system was 8.506 × 10⁴ kWh.
Figure 9 shows the variations of the COPsys, heat pump COPh, and solar contribution rate SF during the transition season. Due to the significantly lower building heat demand and the increase in solar radiation intensity compared to the space heating season, the heat stored in the SC tank could not be consumed in a timely manner, resulting in a higher average water temperature in the SC tank compared to the space heating season. Consequently, the COPh of the solar heat pump heating mode was generally higher during the transition season, with a maximum of 6.04 and an average of 5.58.
The COPsys was greatly affected by the solar radiation intensity at the beginning and end of the transition season. Once the solar radiation intensity decreased, the heating time of the heat pump increased, resulting in higher power consumption and a lower COPsys. During the late transitional season of the first half and the early transitional season of the second half of the year, the COPsys decreased with the decrease in heat demand due to the stable power consumption of the solar collector circulation. The highest COPsys reached 32.9, and the COPsys of the entire transition season was 18.6.

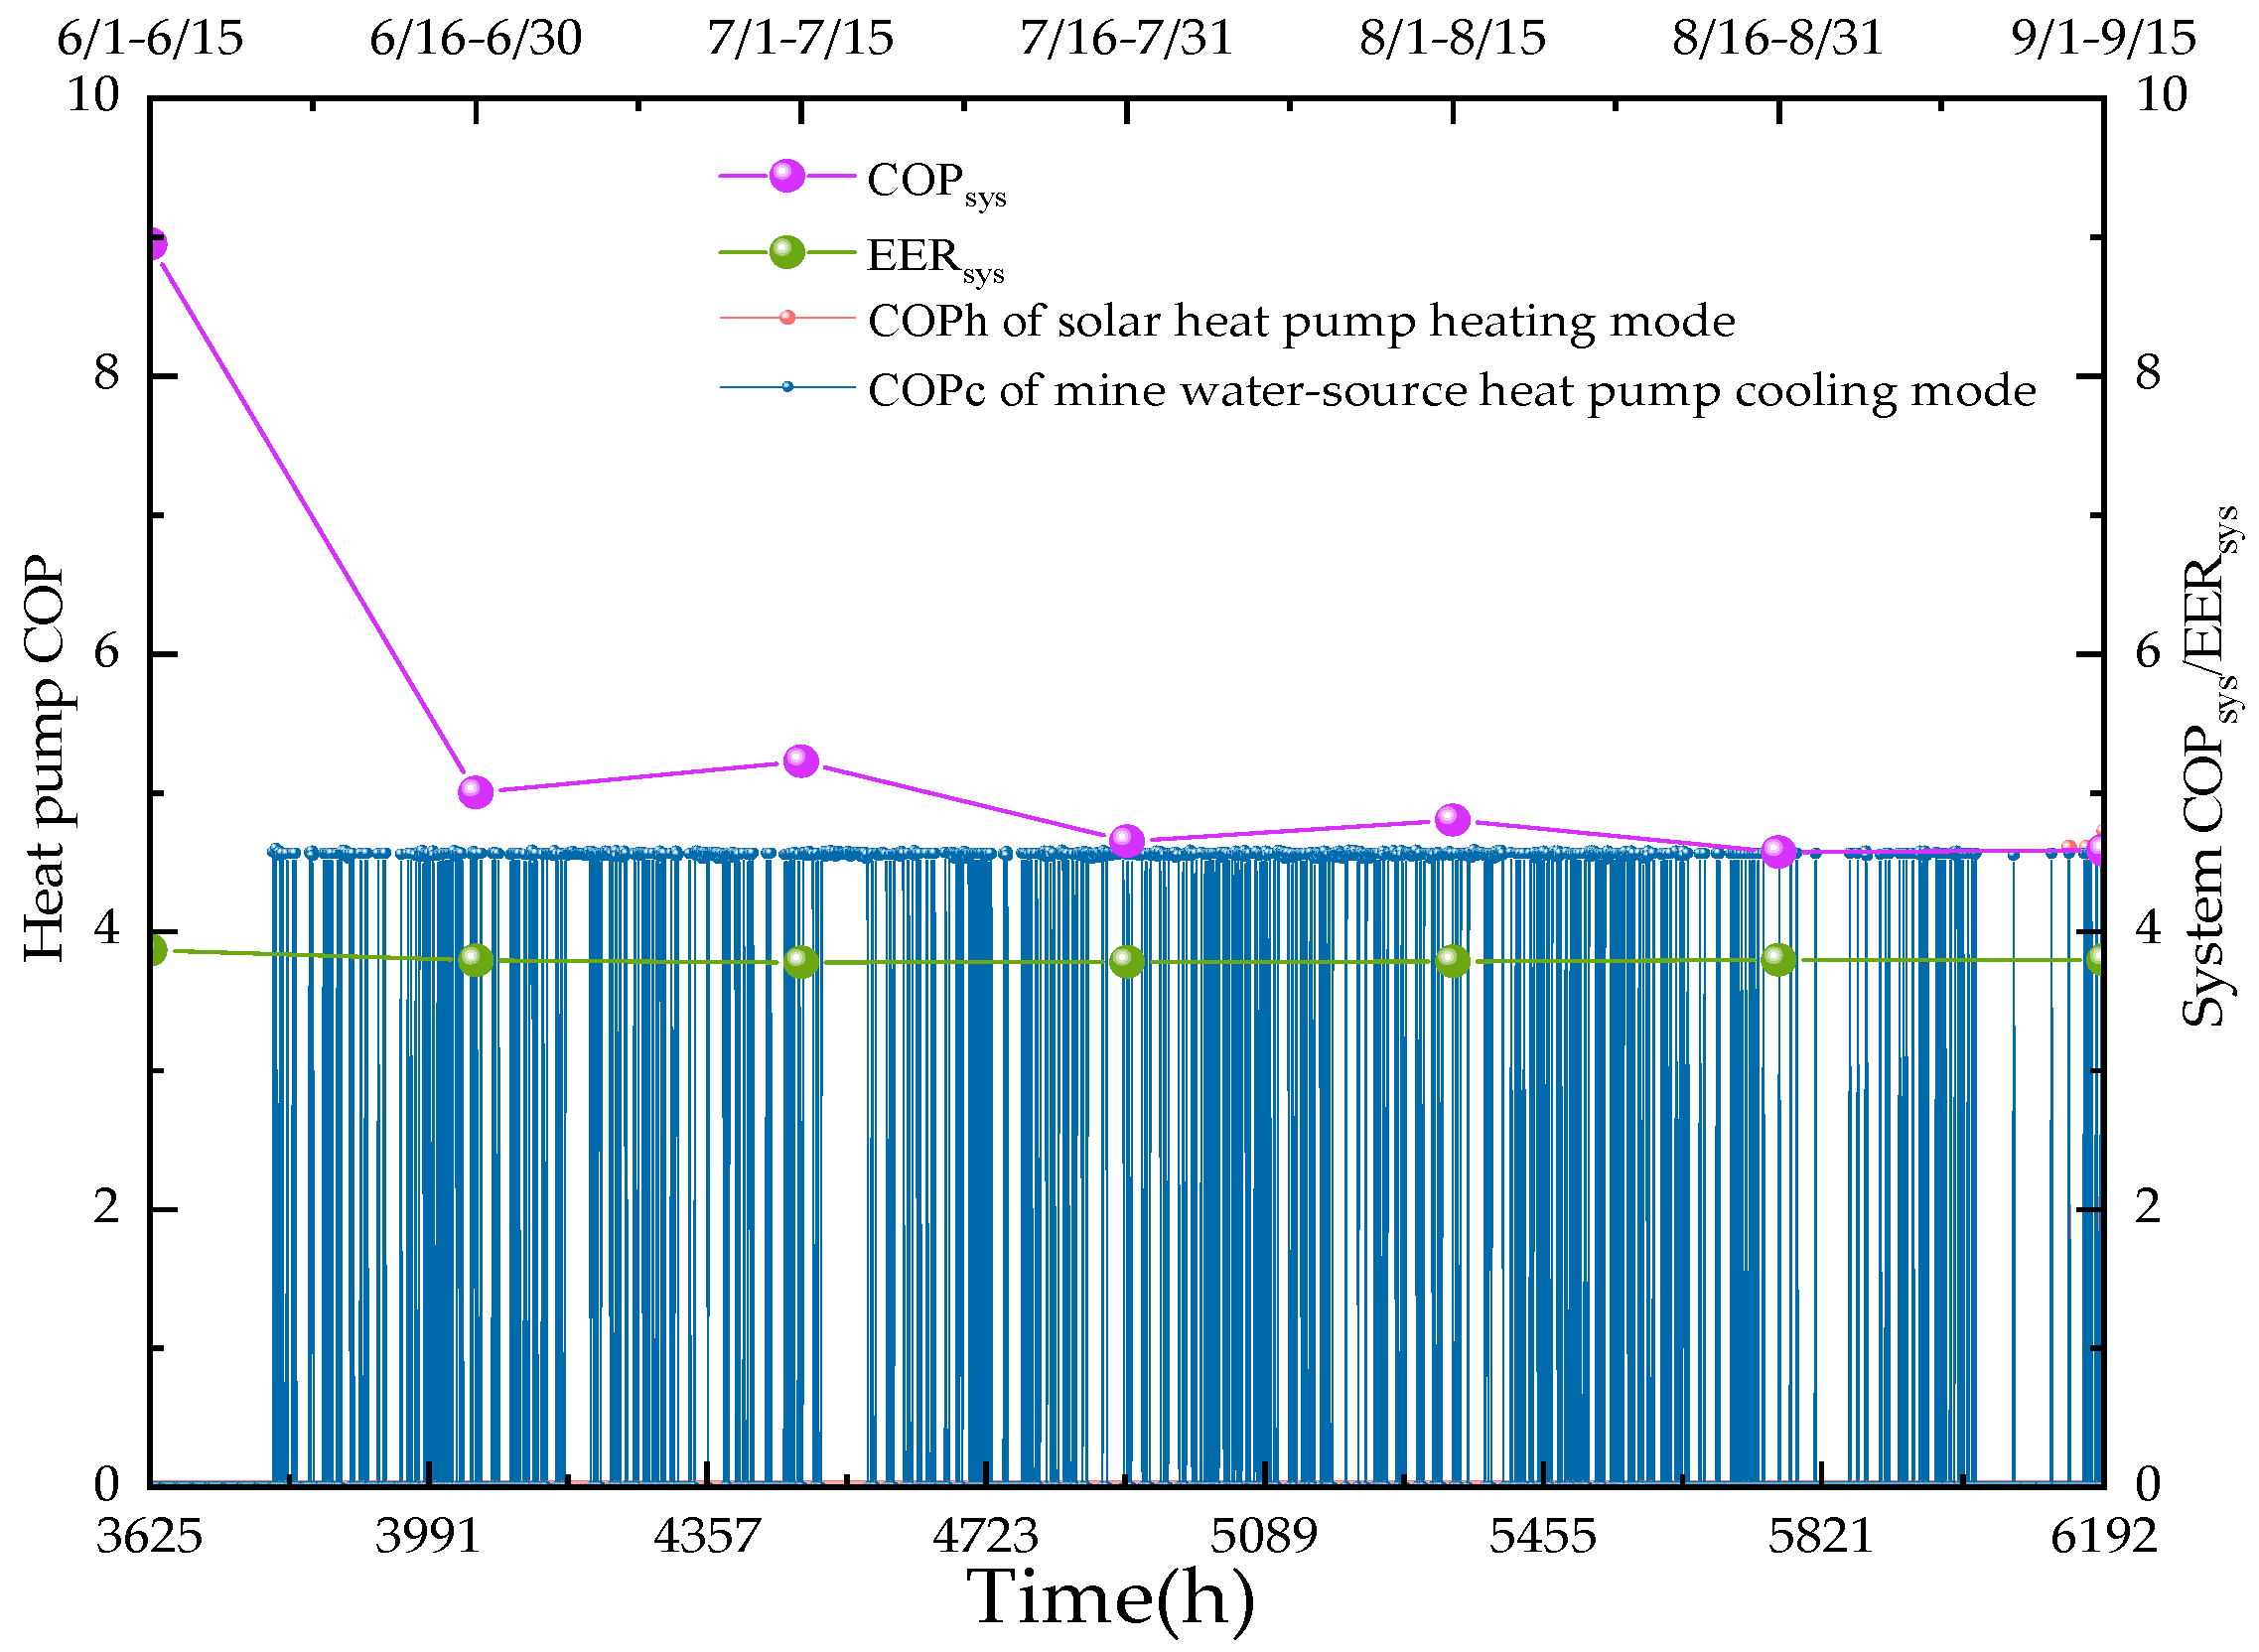
6.1.3. Analysis of System Performance during the Space Cooling Season

Figure 10 shows the semi-monthly variations of the heat and cooling supplies and the power consumption of the system during the cooling season. The solar radiation intensity in the cooling season was the highest and the domestic hot water load was the smallest in the whole year, so solar-direct heating could almost entirely meet the hot water demand. The system’s cooling supply exhibited a trend of initially increasing and then decreasing, matching with the building’s cooling demands. The heating power consumption of the system was higher than that of the transition season due to the increase in solar radiation intensity, which led to an increase in the operating time of the solar collector circulation. The trend of the cooling power consumption was the same as that of the cooling supply.
In the whole cooling season, the cumulative solar-direct heat supply of the system was 9.325 × 10⁵ kWh, the cumulative heat supply of the solar heat pump was 7.146 × 10³ kWh, and the cumulative total heat supply of the system was 9.397 × 10⁵ kWh. The cumulative cooling supply of the system was 1.878 × 10⁶ kWh. The cumulative heating power consumption of the system was 1.813 × 10⁵ kWh, and the cumulative cooling power consumption of the system was 4.955 × 10⁵ kWh.
Figure 11 shows the variations of the COPsys, EERsys, heat pump COPh, and COPc during the space cooling season. The average COPc of the mine water-source heat pump cooling mode was 4.56. Due to the small variation in power consumption of the solar collector circulation, the COPsys decreased with the decrease in system total heat supply, with the COPsys of the entire space cooling season being 5.14. As a result of the increase in the system cooling supply, the power consumption of the heat pump and associated circulation pumps both increased, leading to the opposite trend of the EERsys and system cooling supply. The highest EERsys was 3.87, and the EERsys of the entire cooling season was 3.79.

6.2. Analysis of SMWHP-CHC System Optimization Results

Based on the above optimization scheme, the optimization process was carried out by matching different parameters with different values until the optimized variables converged. The optimal parameter matching values of the optimized system and their variation rates compared to before optimization are shown in Table 6.
Table 6 indicates that the PSO-HJ hybrid optimization algorithm improved the convergence of the optimization process, prevented it from getting trapped in local optima, and ensured that the result was the global minimum of the objective function. The annual cost of the system before optimization was CNY 2.49 million, while after optimization it decreased to CNY 2.27 million, representing an 8.82% reduction. The investment cost of the system also decreased from CNY 13.5 million to CNY 10.5 million, resulting in a cost savings rate of 21.7%.
The optimized variable values were substituted into the simulation model of the SMWHP-CHC system for simulation calculation and compared with the calculation results of the system before optimization.
Figure 12a shows the comparison of the heat and cooling supply of the system before and after optimization. After optimization, the system’s total solar heat supply decreased, with an SF of 19.5% as calculated during the entire space heating season, still meeting the minimum solar energy requirement. The solar-direct heat supply significantly increased in the space heating season and slightly decreased in the non-space heating season, but the overall proportion of the solar-direct heat supply increased, enhancing the system’s direct utilization of solar energy and contributing to an improved system performance. The optimized system’s cumulative total heat supply in the space heating season was 8.742 × 10⁶ kWh, 1.582 × 10⁶ kWh in the transition season, and 9.421 × 10⁵ kWh in the space cooling season. The annual cumulative total heat supply of the system was 1.126 × 10⁷ kWh, representing an increase of 0.11% compared to before optimization. The optimized system’s cumulative cooling supply was 1.924×10⁶ kWh, indicating a 2.5% increase compared to before optimization.
Figure 12b shows the comparison of the power consumption of the system before and after optimization. After optimization, the system’s cooling power consumption slightly increased to 5.114 × 10⁵ kWh, while the heating power consumption significantly decreased to 2.688 × 10⁶ kWh, representing a decrease of 1.6% compared to before optimization. The annual cumulative power consumption of the system was 3.2 × 10⁶ kWh, indicating a decrease of 27,079 kWh compared to before optimization, resulting in an energy-saving rate of 0.84%. As calculated, the optimized system COPsys values of the entire space heating season, transition season, and cooling season were 3.58, 17.4, and 5.99, respectively, and the EERsys was 3.76.
In summary, the optimized system demonstrated a significant reduction in investment costs and a certain improvement in performance, confirming the effectiveness of the optimization results.

7. Conclusions

This paper proposed a solar-coupled mine water-source heat pump combined heating and cooling (SMWHP-CHC) system, which utilizes both solar energy and waste heat from mine water for building space heating and annual domestic hot water supply, while also utilizing the cold energy from mine water for building space cooling. Taking the dormitory building group of a coal mine enterprise in Tongchuan City, China, as a research case, the system simulation model was established by TRNSYS 18 software, and the annual operation performance of the system was analyzed. Furthermore, the PSO-HJ hybrid optimization algorithm was employed using GenOpt 2 software to optimize multiple key parameters of the system simultaneously, with the objective of minimizing the system’s annual cost while satisfying the constraints. The specific conclusions are as follows:
(1)
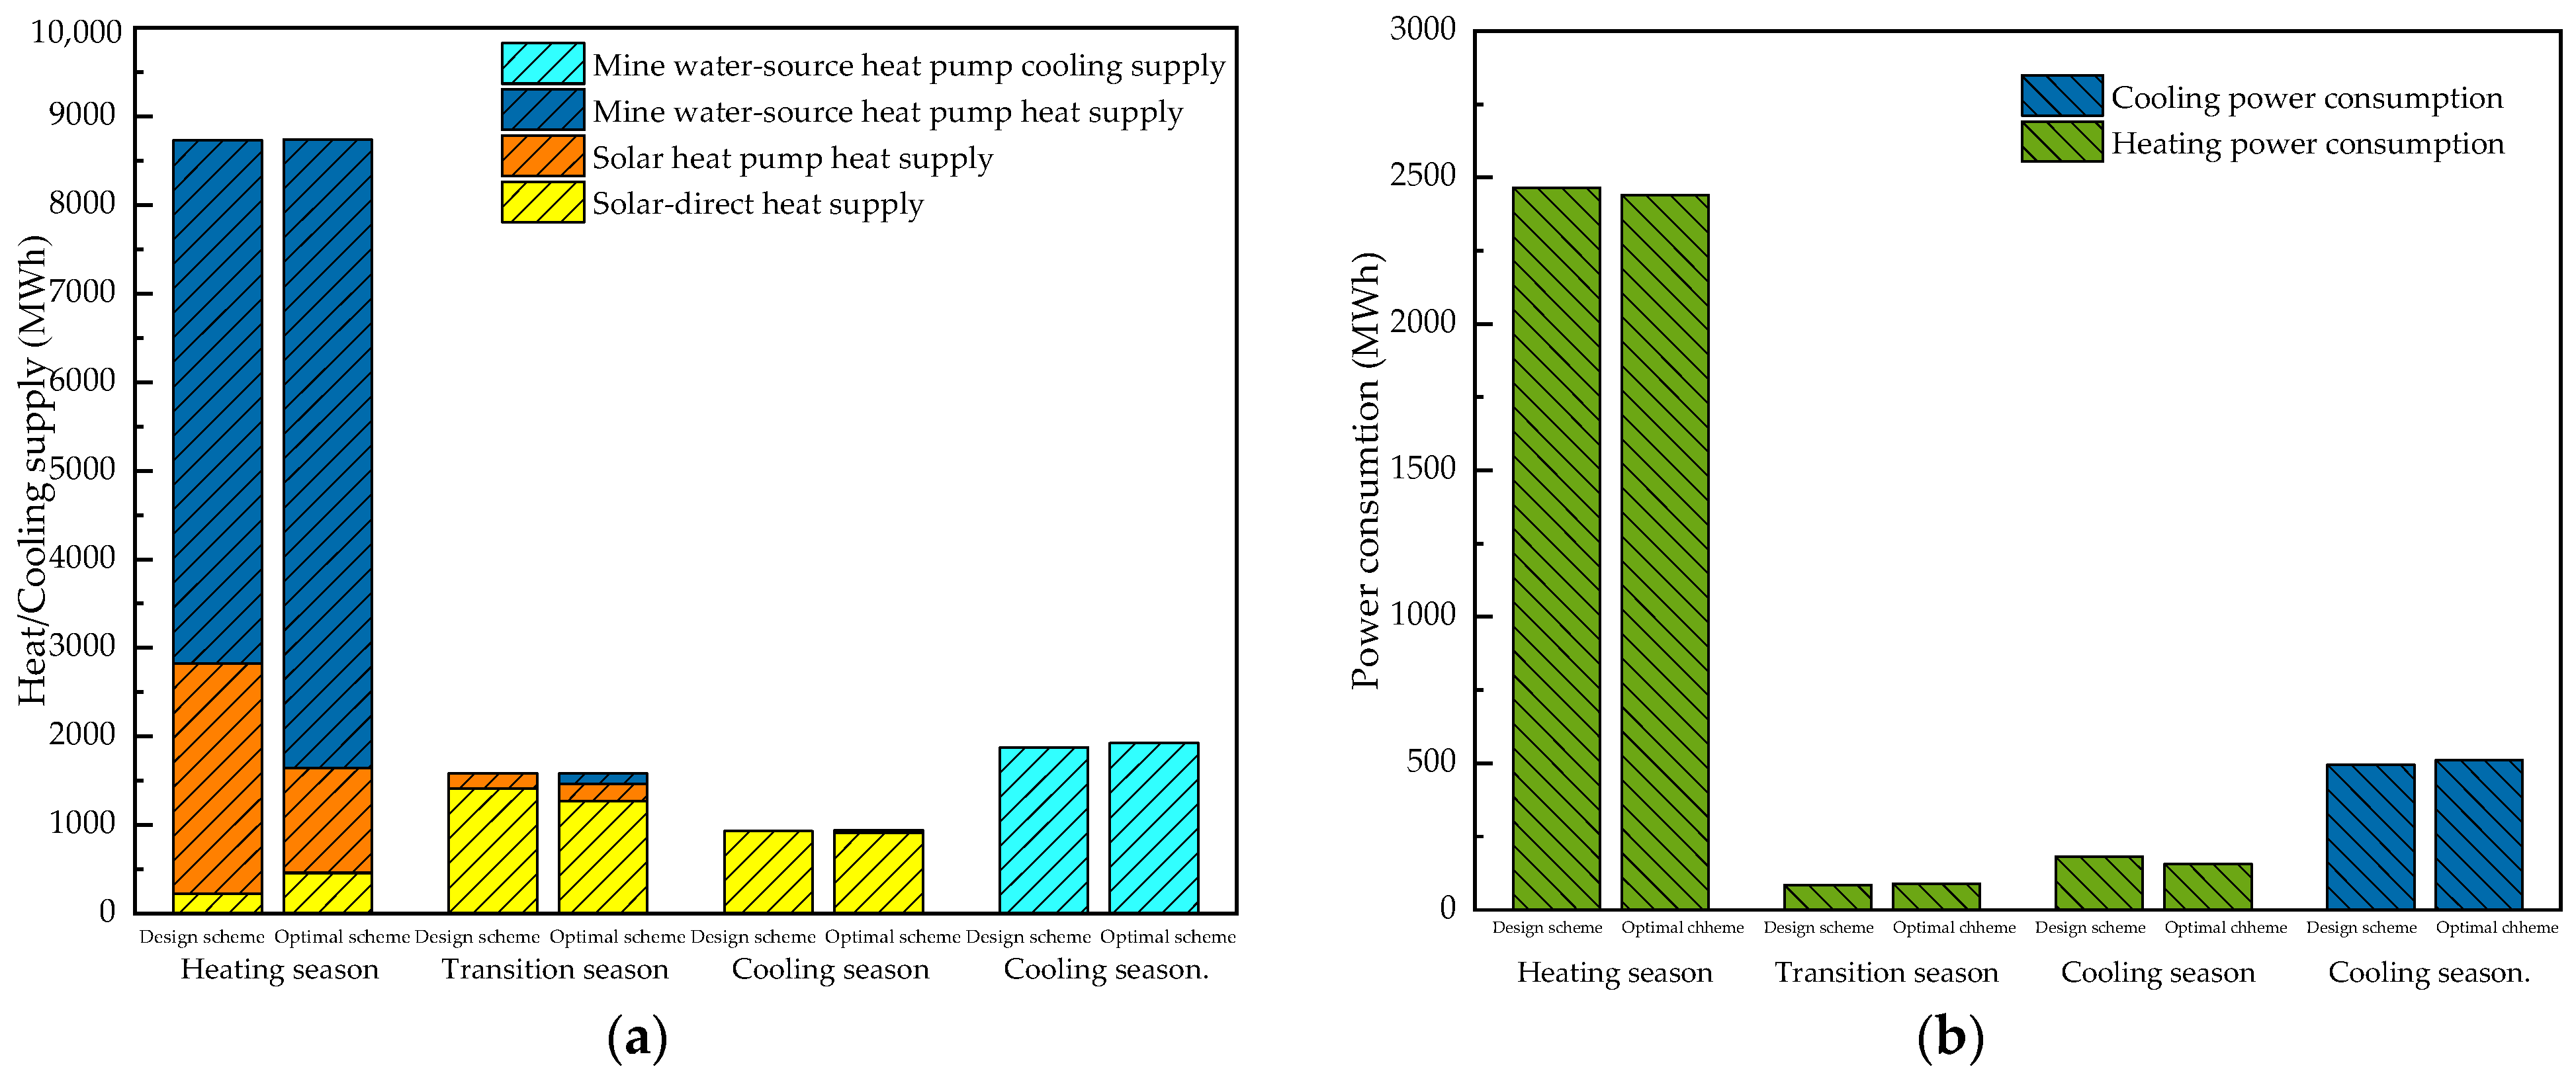
The system was capable of meeting the space heating, space cooling, and annual hot water load demands of the case buildings. The system’s cumulative total heat supply in the heating season was 8.728 × 10⁶ kWh, 1.585 × 10⁶ kWh in the transition season, and 9.397 × 10⁵ kWh in the cooling season. The system’s cumulative cooling supply was 1.878 × 10⁶ kWh. The system’s power consumption was 2.465 × 10⁶ kWh in the heating season, 8.506 × 10⁴ kWh in the transition season, 6.768 × 10⁵ kWh in the cooling season.
(2)
The utilization of solar energy could enhance the performance of the heat pump system. During the space heating season, the COPh of the solar heat pump heating mode was significantly higher than that of the mine water-source heat pump heating mode. The average COPh of the solar heat pump heating mode was 4.75, while that of the mine water-source heat pump heating mode was 4.29. During the transition season, the average COPh of the solar heat pump heating mode was 5.58. The average COPc of the mine water-source heat pump cooling mode was 4.56.
(3)
The solar contribution rate SF reached up to 32.4% in the entire space heating season. In the non-space heating season, nearly the entire domestic hot water demand was met by solar energy. The performance of the system improved with the increase in the SF. The COPsys values during the space heating season, transitional season, and cooling season were 3.54, 18.6, and 5.14, respectively, and the EERsys was 3.79, demonstrating excellent performance throughout the year.
(4)
According to the system optimization results, it is evident that the PSO-HJ hybrid optimization algorithm effectively enhanced the convergence of the optimization. The system’s annual cost reached a minimum when the SC area was 10,531m2, the SC slope was 41.1°, the SC azimuth was 35.4°, the Var was 0.011 m3/m2, the Far was 20.9 m3/h·m2, the Fsh was 156.4 m3/h, the heat pump capacity was 6017 kW, the buffer tank volume was 947 m3, and the DHW tank volume was 381 m3.
(5)
Compared with before optimization, the optimized system’s annual cost decreased by 8.82%, and the investment cost decreased by 21.7%. Additionally, the optimized system’s annual cumulative total heat supply was 0.11% higher than that before optimization, the cooling supply was 2.5% higher than that before optimization, and the annual cumulative power consumption was 0.84% lower than that before optimization. After optimization, the investment cost of the system was significantly reduced, and the performance of the system was also improved.
Based on the content already researched in this paper, the following aspects can be considered for further improvement:
(1)
The control the of system in this study was primarily constant frequency control; research can be conducted on variable frequency control and optimization of the system to further improve the system performance in the future.
(2)
This study only used the main parameters of devices as optimization variables, but the system operating parameters in the control strategy of the system also have an impact on the optimization objectives. Further research on this aspect can be conducted.

Author Contributions

Conceptualization, C.Z.; methodology, C.Z.; software, C.Z.; validation, J.Z. and M.W.; investigation, J.Z. and C.Z.; data curation, M.W. and C.Z.; writing—original draft preparation, C.Z.; writing—review and editing, J.Z. and M.W. All authors have read and agreed to the published version of the manuscript.

Funding

This research was funded by The National Science Fund for Young Scholars of China, Mei Wang, grant number 51904224.

Institutional Review Board Statement

Not applicable.

Informed Consent Statement

Not applicable.

Data Availability Statement

Data are contained within the article.

Conflicts of Interest

The authors declare no conflicts of interest.

References

  1. Hoang, A.T.; Foley, A.M.; Nizetic, S.; Huang, Z.; Ong, H.C.; Olcer, A.I.; Pham, V.V.; Nguyen, X.P. Energy-related approach for reduction of CO2 emissions: A critical strategy on the port-to-ship pathway. Clean. Prod. 2022, 355, 131772. [Google Scholar] [CrossRef]
  2. Liu, Z.J.; Zhang, Y.L.; Xu, W.; Yang, X.Y.; Liu, Y.W.; Jin, G.Y. Suitability and feasibility study on the application of groundwater source heat pump (GWSHP) system in residential buildings for different climate zones in China. Energy Rep. 2020, 6, 2587–2603. [Google Scholar] [CrossRef]
  3. Amasyali, K.; El-Gohary, N.M. A review of data-driven building energy consumption prediction studies. Renew. Sustain. Energy Rev. 2018, 81, 1192–1205. [Google Scholar] [CrossRef]
  4. Diao, Y.; Qi, N.; Wang, Z.; Zhao, Y.; Wang, Z. Thermal performance analysis of a solar air collection–cascade storage system integrated with micro-heat pipe arrays. Sol. Energy 2021, 224, 1271–1290. [Google Scholar] [CrossRef]
  5. Nagpal, H.; Spriet, J.; Murali, M.K.; McNabola, A. Heat Recovery from Wastewater-A Review of Available Resource. Water 2021, 13, 1274. [Google Scholar] [CrossRef]
  6. Hepbasli, A.; Biyik, E.; Ekren, O.; Gunerhan, H.; Araz, M. A key review of wastewater source heat pump (WWSHP) systems. Energy Conv. Manag. 2014, 88, 700–722. [Google Scholar] [CrossRef]
  7. Menéndez, J.; Ordónez, A.; Fernández-Oro, J.M.; Loredo, J.; Díaz-Aguado, M.B. Feasibility analysis of using mine water from abandoned coal mines in Spain for heating and cooling of buildings. Renew. Energy 2020, 146, 1166–1176. [Google Scholar] [CrossRef]
  8. Wang, W.; Jiang, P.; Ren, P.; Bao, L.; Liang, C. The Application of Sewage Source Heat Pump Technology in Oilfield Station. Energy Conserv. Pet. Petrochem. Ind. 2017, 7, 7–9. [Google Scholar]
  9. Kim, Y.; Lim, J.; Shim, J.Y.; Hong, S.; Lee, H.; Cho, H. Optimization of Heat Exchanger Network via Pinch Analysis in Heat Pump-Assisted Textile Industry Wastewater Heat Recovery System. Energies 2022, 15, 3090. [Google Scholar] [CrossRef]
  10. Liu, L.; Fu, L.; Jiang, Y. Application of an exhaust heat recovery system for domestic hot water. Energy 2009, 35, 1476–1481. [Google Scholar] [CrossRef]
  11. Bai, B. Simulation and Analysis of Solar-Assist Sewage Source Heat Pump Coupling System Operating Characteristics. Master’s Thesis, Shenyang Architectural University, Shenyang, China, 2016. [Google Scholar]
  12. Starke, A.R.; Cardemil, J.M.; Escobar, R.; Colle, S. Thermal analysis of solar-assisted heat pumps for swimming pool heating. J. Braz. Soc. Mech. Sci. Eng. 2017, 39, 2289–2306. [Google Scholar] [CrossRef]
  13. Xie, X. Optimization and Operation Analysis of Sewage Source Heat Pump Combined with Solar Heating System. Master’s Thesis, Harbin Engineering University, Harbin, China, 2018. [Google Scholar]
  14. Mi, P.Y.; Ma, L.D.; Zhang, J.L. Integrated optimization study of hot water supply system with multi-heat-source for the public bath based on PVT heat pump and water source heat pump. Appl. Therm. Eng. 2020, 176, 11. [Google Scholar] [CrossRef]
  15. Wang, K.; Zhao, D.; Luo, J.; Liu, H.; Yang, T. Research on optimization of solar-assist sewage source heat pump coupling hot water system based on taguchi method. Renew. Energy Resour. 2021, 39, 1463–1469. [Google Scholar]
  16. Cheng, C.; Jiang, Y.; Wang, F. Continuous Operation Analysis of New Solar Sewage Dual-source Heat Pump for Nearly Zero-energy Buildings. J. Refrig. 2022, 43, 142–149. [Google Scholar]
  17. Zhang, D.W.; Gao, Z.; Fang, C.L.; Shen, C.; Li, H.; Qin, X. Simulation and analysis of hot water system with comprehensive utilization of solar energy and wastewater heat. Energy 2022, 253, 11. [Google Scholar] [CrossRef]
  18. Ren, Q.; Jia, J.; Tian, Q. Status and development direction of heat pump technology in mine waste heat recovery. Dist. Heat. 2023, 102–108. [Google Scholar] [CrossRef]
  19. Gu, D.; Li, J.; Cao, Z.; Wu, B.; Jiang, B.; Yang, Y.; Yang, J.; Chen, Y. Technology and engineering development strategy of water protection and utilization of coal mine in China. J. China Coal Soc. 2021, 46, 3079–3089. [Google Scholar]
  20. Xiang, Y.; Yang, Y. Advances on waste heat utilization technologies of low-temperature water resources in coal mines. Coal Qual. Technol. 2023, 38, 27–32. [Google Scholar]
  21. Liu, Y.F.; Zhao, Y.T.; Chen, Y.W.; Wang, D.J.; Li, Y.; Yuan, X.P. Design optimization of the solar heating system for office buildings based on life cycle cost in Qinghai-Tibet plateau of China. Energy 2022, 246, 16. [Google Scholar] [CrossRef]
  22. Yue, H.; Xu, Z.; Wang, N.; Zhang, H.; Chen, H. Performance Analysis and Optimization of Photovoltaic/thermal Tri-generation System. J. North China Electr. Power Univ. 2024, 1–8. [Google Scholar] [CrossRef]
  23. Liu, Y.F.; Zhou, W.H.; Luo, X.; Wang, D.J.; Hu, X.X.; Hu, L. Design and operation optimization of multi-source complementary heating system based on air source heat pump in Tibetan area of Western Sichuan, China. Energy Build. 2021, 242, 17. [Google Scholar] [CrossRef]
  24. Gök, O.; Atmaca, A.U.; Erek, A.; Altay, H.M. TRNSYS Model of the combi boiler domestic hot water circuit with a focus on the parameter definition of the plat heat exchanger. ISI Bilim. Tek. Derg. 2023, 43, 191–205. [Google Scholar] [CrossRef]
  25. Zheng, R.; He, T. Technical Code for Solar Heating System, 2nd ed.; China Academy of Building Sciences: Beijing, China, 2019. [Google Scholar]
  26. Xu, W.; Zou, Y. Design Code for Heating Ventilation and Air Conditioning of Civil Buildings, 2nd ed.; China Academy of Building Sciences: Beijing, China, 2012. [Google Scholar]
  27. Jiang, J.J.; Wei, W.X.; Shao, W.L.; Liang, Y.F.; Qu, Y.Y. Research on Large-Scale Bi-Level Particle Swarm Optimization Algorithm. IEEE Access 2021, 9, 56364–56375. [Google Scholar] [CrossRef]
  28. Litvinas, L. A hybrid of Bayesian-based global search with Hooke-Jeeves local refinement for multi-objective optimization problems. Nonlinear Anal.-Model Control 2022, 27, 534–555. [Google Scholar] [CrossRef]
Figure 1. Meteorological parameters in Tongchuan, China.
Sustainability 16 04752 g001
Figure 2. Space heating, space cooling, and hot water load of the dormitory buildings.
Sustainability 16 04752 g002
Figure 3. Principle of the SMWHP-CHC system.
Sustainability 16 04752 g003
Figure 4. TRNSYS model of the SMWHP-CHC system.
Sustainability 16 04752 g004
Figure 5. Optimization calculation of the SMWHP-CHC system.
Sustainability 16 04752 g005
Figure 6. System heat supply and power consumption during the space heating season.
Sustainability 16 04752 g006
Figure 7. COPsys, heat pump COPh, and solar contribution rate SF during the space heating season.
Sustainability 16 04752 g007
Figure 8. System heat supply and power consumption during the transition season.
Sustainability 16 04752 g008
Figure 9. COPsys, heat pump COPh, and solar contribution rate SF during the transition season.
Sustainability 16 04752 g009
Figure 10. System heat/cooling supply and power consumption during the space cooling season.
Sustainability 16 04752 g010
Figure 11. COPsys, EERsys, heat pump COPh, and heat pump COPc during the space cooling season.
Sustainability 16 04752 g011
Figure 12. (a) Comparison of the heat/cooling supply of the system before and after optimization; and (b) comparison of the power consumption of the system before and after optimization.
Sustainability 16 04752 g012
Table 1. Main design parameters of the dormitory buildings.
Heat transfer coefficient of the building envelope W(m2·K)Exterior wallInterior wallRoofExterior window
0.6210.9470.4022.04
Air conditioning design set parametersIndoorTerminal inlet waterPeriod
Space heating season20 °C45 °C11.15~next year 3.15
Space cooling season26 °C7 °C6.1~9.15
Table 2. System operation control strategy.
ModeJudging ConditionOperating Devices
Solar-direct heating mode.During the space heating season, when TS1 ≥ 45 °C, heat both the DHW tank and the buffer tank concurrently; when TS1 < 45 °C, turn off.P2, V1, V2, V3, V4, V6, V7, V8, and V9.
During the non-space heating season, when TS1 ≥ 45 °C, heat the DHW tank; when TS1 < 45 °C or Tdhw1 > TS1, turn off.P2, V1, V2, V3, V6, V7, and V8.
Solar heat pump heating modeWhen TS1 ≥ 15 °C and TS2 ≥ 10 °C and Tdhw < 43 °C, heat the DHW tank; when TS1 < 15 °C or TS2 < 10 °C or Tdhw ≥ 45 °C, turn off.WHSP, P3, P4, V1, V3, V5, V6, V8, V10, V11, and V12.
During the space heating season, when TS1 ≥ 15 °C and TS2 ≥ 10 °C and Tn < 20 °C and TL < 45 °C, heat the buffer tank; when TS1 < 15 °C or TS2 < 10 °C or TL ≥ 48 °C, turn off.WHSP, P3, P4, V1, V4, V5, V6, V9, V10, V11, and V12.
During the space heating season, when TS1 ≥ 15 °C and TS2 ≥ 10 °C and Tn < 20 °C and TL < 45 °C and Tdhw < 43 °C, heat both the DHW tank and buffer tank concurrently; when TS1 < 15 °C or TS2 < 10 °C or TL ≥ 48 °C or Tdhw ≥ 45 °C, turn off.WHSP, P3, P4, V1, V3, V4, V5, V6, V8, V9, V10, V11, and V12.
Mine water-source heat pump heating mode.When TS1 < 15 °C or TS2 < 10 °C, and Tdhw < 43 °C, heat the DHW tank; when TS1 ≥ 15 °C and TS2 ≥ 10 °C, or Tdhw ≥ 45 °C, turn off.WHSP, P3, P4, P5, V3, V5, V8, V10, V11, and V12.
During the space heating season, when TS1 < 15 °C or TS2 < 10 °C, and TL < 45 °C and Tdhw < 43 °C, heat the buffer tank; when TS1 ≥ 15 °C and TS2 ≥ 10 °C, or TL ≥ 48 °C, turn off.WHSP, P3, P4, P5, V4, V5, V9, V10, V11, and V12.
During the space heating season, when TS1 < 15 °C or TS2 < 10 °C, and Tn < 20 °C and TL < 45 °C and Tdhw < 43 °C, heat both the DHW tank and the buffer tank concurrently; when TS1 ≥ 15 °C and TS2 ≥ 10 °C, or Tdhw ≥ 45 °C or TL ≥ 4 °C, turn off.WHSP, P3, P4, P5, V3, V4, V5, V8, V9, V10, V11, and V12.
Mine water-source heat pump cooling mode.During air conditioning operation in the space cooling season, when Tn > 26 °C and TL > 7 °C, cool the buffer tank; when Tn ≤ 26 °C or TL ≤ 5 °C, turn off.WHSP, P3, P4, P5, V4, V5, V9, V10, V11, and V12.
Other related operation strategies: 1. The solar collector cycle is controlled by monitoring the temperature difference ΔTS between the inlet and outlet of the collector, so that when ΔTS ≤ 2 °C, P1 is off, and when ΔTS > 8 °C, P1 is open. 2. The terminal circulation of the system is controlled by monitoring the temperature Tn, so that when Tn < 20 °C during the space heating season or Tn > 26 °C during the space cooling season, P6 is open, otherwise it remains off.
Table 3. Parameters of main devices.
DeviceParameters/UnitValue
SCThermal efficiency/%80
Area/m214,656
Slope/°34.5
Azimuth/°0
WSHPRated heating capacity/kW6688
Rated heating power/kW1486
Rated cooling capacity/kW6431
Rated cooling power/kW1340
SC tankVolume/m3586
Buffer tankVolume/m3700
DHW tankVolume/m3330
ExchangerArea/m2526
Heat transfer coefficient/kW·m−2·K−13
Solar collector circulation pumpRated flow/kg·h−1439.68
Rated power/kW25.67
Solar-direct heating circulation pumpRated flow/kg·h−1439.68
Rated power/kW25.67
Heat pump source-side circulation pumpRated flow/kg·h−1977.92
Rated power/kW57.1
Heat pump load-side circulation pumpRated flow/kg·h−11105.04
Rated power/kW64.5
Mine water circulation pumpRated flow/kg·h−1488.96
Rated power/kW38
Air conditioning terminal circulation pumpRated flow/kg·h−1714.25
Rated power/kW166.8
Table 4. Price of devices.
DeviceSCTankWSHPExchangerPump
Unit Price500 CNY/m2650 CNY/m3400 CNY/m2350 CNY/m20.18 CNY/kg·h−1
Table 5. Optimization variables’ value ranges and optimization step sizes.
Optimization VariableValue RangeOptimization Step Size
SC area/m2(9771, 19,541)50
SC slope/°(0, 60)1
SC azimuth/°(−20, 60)1
Var/m3·m−2(0.005, 0.1)0.001
Far/m3·h−1·m−2(5, 50)1
Fsh/m3·h−1(100, 600)20
Heat pump capacity/kW(4000, 9000)50
Buffer tank volume/m3(500, 1200)10
DHW tank volume/m3(150, 600)10
Table 6. Optimal parameters’ matching values and their variation rates.
ParameterInitial ValuePSOPSO-HJVariation Rate
SC area/m214,65610,98110,531−28.1%
SC slope/°34.540.741.1−19.1%
SC azimuth/°042.335.4______
Var/m3·m−20.040.0110.011−72.5%
Far/m3·h−1·m−23017.920.9−30.3%
Fsh/m3·h−1439.7318.9156.4−64.4%
Heat pump capacity/kW668862736017−10%
Buffer tank volume/m3700984947+35.3%
DHW tank volume/m3300335381+15.5%
Disclaimer/Publisher’s Note: The statements, opinions and data contained in all publications are solely those of the individual author(s) and contributor(s) and not of MDPI and/or the editor(s). MDPI and/or the editor(s) disclaim responsibility for any injury to people or property resulting from any ideas, methods, instructions or products referred to in the content.

