Article

Estimating the Energy Demand and Carbon Emission Reduction Potential of Singapore’s Future Road Transport Sector

by
Shiddalingeshwar Channabasappa Devihosur
1,2,
Anurag Chidire
1,2,
Tobias Massier
2,* and
Thomas Hamacher
1
1
School of Engineering and Design, Technical University of Munich, 80333 Munich, Germany
2
TUM CREATE Ltd., 1 CREATE Way, #10-02 CREATE Tower, Singapore 138602, Singapore
*
Author to whom correspondence should be addressed.
Sustainability 2024, 16(11), 4754; https://doi.org/10.3390/su16114754
Submission received: 23 April 2024 / Revised: 27 May 2024 / Accepted: 29 May 2024 / Published: 3 June 2024

Abstract

:
About 20% of the world’s CO2 emissions originate from transport. Many countries are committed to decarbonizing their transport sector. Singapore pledged to electrify a whole host of its land transportation fleet, which includes private cars, public buses, ride-hail vehicles, and motorcycles. This paper proposes a simple empirical framework to estimate the future energy demand after 100% electrification has been realized for nine selected road transport vehicle sub-classes and to calculate the carbon emission reduction potential based on various scenarios. The present energy demand for each vehicle sub-class is first calculated based on parameters like petrol and diesel consumption, heat value and density of petrol and diesel, population of vehicle type, and average mileage per vehicle sub-class. Several scenarios are presented, and an analysis is carried out to derive a range of emission factors which are used to estimate the carbon emission reduction potential. Relative to the present day, the future energy demand estimates reveal an overall reduction of 73.60%. Full electrification and a “clean” power generation mix could lead to an emission reduction as high as 93.64% across all vehicles sub-classes, with private cars having the highest reduction potential.

1. Introduction

1.1. Background

About 20% of the world’s CO2 emissions originate from transport [1]. Global warming has long been on the agenda of global leaders. Numerous climate-action-related summits and conferences have taken place to discuss the reduction of carbon emissions.
Singapore is a thriving metropolis, and its land transportation accounts for about 15% of its carbon emissions [2]. The Land Transport Authority (LTA) of Singapore charted a roadmap (Figure 1) through which it aims to cut land transportation emissions by 80% by 2050 through various initiatives such as electrification of vehicles, walking, cycling, and public transport. LTA has set the following targets for its Land Transport Master Plan 2040 [3]:
-
Achieve 90% peak hour journeys on walk-cycle-ride modes by 2040;
-
Achieve 100% cleaner energy vehicles by 2040 [4];
-
Expand charging infrastructure for electric vehicles (EVs), especially in public car parks.
Figure 1. A visual roadmap of Singapore’s road transport decarbonization [4].
Sustainability 16 04754 g001
This paper aims to translate the policies implemented into measurable quantities that present a realistic potential for the future. To this end, a simplified framework has been developed by gathering empirical data to project the current and future energy demand and carbon emissions based on 100% electrification of all vehicle types by 2040. Various scenarios have been implemented to estimate the carbon emission reduction potential. The vehicles considered in this study are single-deck (SD) public buses, double-deck (DD) public buses, articulated public buses (ABs), ride-hail, private cars, motorcycles, and road freight vehicles, which make up 80% of all road transport vehicles [5].

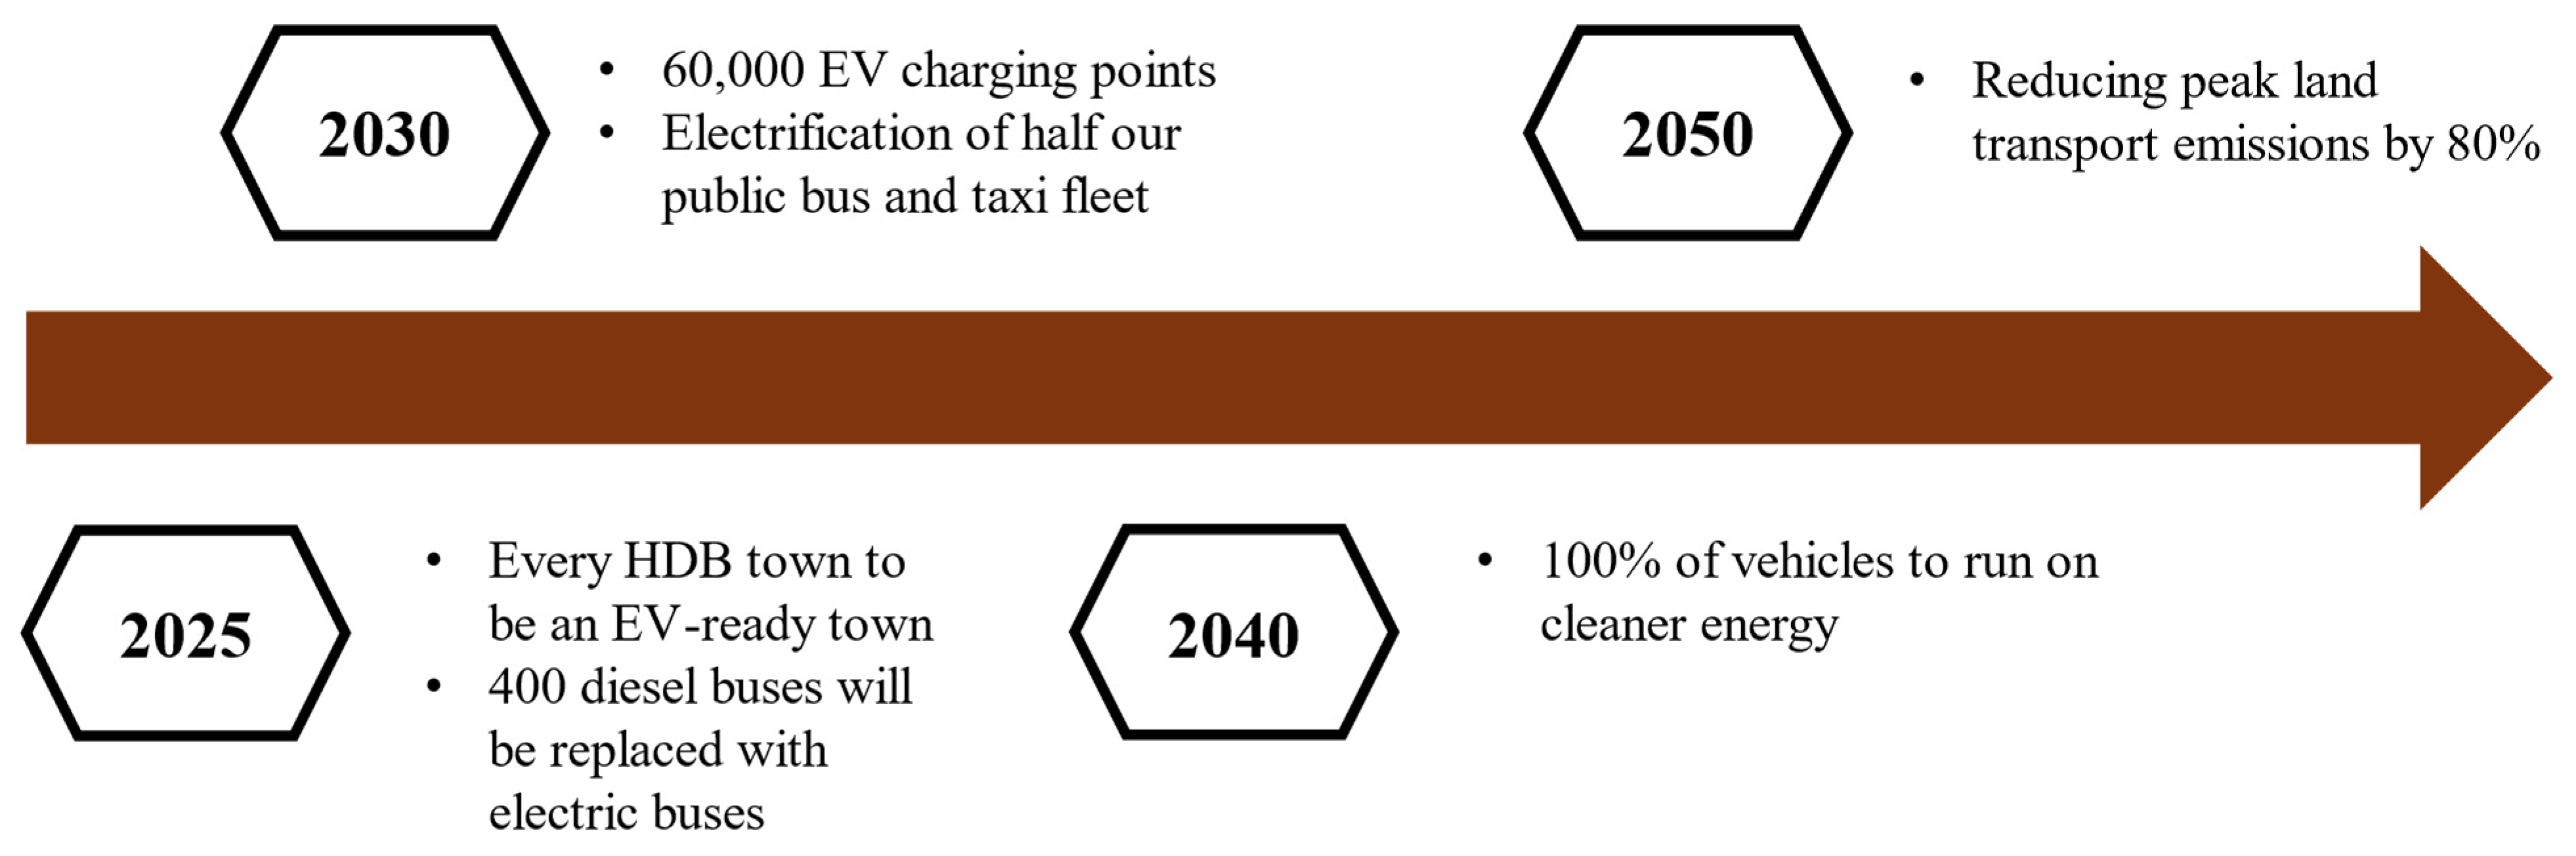
1.2. Singapore’s Transport Policies

Recognizing that the transformation has to be a collective stance, the Singapore government introduced the walk-cycle-ride scheme [6], the ambition of which is to achieve 9 in 10 trips during peak hours either through active mobility or public transport (PT). Active mobility essentially encourages “walking” and “cycling” as alternative transport modes where feasible. To encourage active mobility, the government has injected substantial amounts of capital to enhance the cycling network, which is set to reach 1300 km by the end of the decade, and to remodel road spaces to boost safety and connectivity. Currently, the data related to Singapore’s active mobility adoption are not available. However, parallels can be drawn from the success of the bicycling program in the Netherlands, often referred to as the bike capital of Europe. The data show that the availability of biking infrastructure, policies such as nationwide bike-sharing, and other socio-cultural factors have boosted bike usage among the Dutch population [7].
To spur the transition from private to public transport, the LTA has pledged to have a “100% cleaner” bus fleet by 2040, with half of it being electric by 2030 [8]. LTA’s Land Transport Master Plan 2040 states that by 2040, the whole taxi and bus fleet “will use cleaner energy”. LTA also aims to expand its train network by more than 50% over 15 years to improve connectivity and reduce travel time. For private transport, Singapore has been ramping up the deployment of EV charging stations across the island, with an eventual target installation of 60,000 by 2030. There are currently grants and incentives targeted at charging station suppliers as well as consumers who wish to purchase an EV, which encourages the switch to EVs as opposed to internal combustion engine (ICE) vehicles. The EV Common Charger Grant (ECCG) was launched to encourage installations of charging stations through co-funding of the installation costs. This grant encouraged 2000 early adopters to have the charging infrastructure installed in non-landed private residences (NLPRs). Concurrently, there are car-sharing initiatives set up by companies like BlueSG, which is the first of its kind offering a cleaner alternative form of road transportation [9]. Under the Singapore Green Plan, Singapore aims to phase out most ICE vehicles to pave the way for EVs by 2040 [10]. Vehicles that fall under this bracket are private and public buses, private cars, ride-hail, motorcycles, goods-cum-passenger vehicles (GPVs), and light goods vehicles (LGVs). GPVs are vehicles that transport freight and passengers. The aim is to decarbonize a significant population of road vehicles and consequently reduce carbon emissions. Heavy goods vehicles (HGVs) and very heavy goods vehicles (VHGVs) are excluded from this target.
The Singapore government restricts ownership of private cars and motorcycles. In 2018, the growth rate of the number of private cars permitted on Singapore’s roads was set to zero such that the number of private cars remains the same over time. Car owners must place a bid for a “Certificate of Entitlement” (COE) in order to have chance to be allowed to drive their car on Singapore’s roads for the next ten years, before it has to be taken out of the system. Moreover, it was recently decided that all ICE cars have to be phased out by 2040.

1.3. Contribution of Paper

This paper provides an empiricism-driven framework to calculate the present energy demand of the road transport sector, implement an electrification policy for this sector, and estimate the energy demand and emission outlook.
The main contributions of the paper are summarized as follows:
  • Establishment of an estimate of the present and future energy demand of Singapore’s road transport (80%) by 2040 after the 100% electrification policy is in full motion;
  • Derivations of the grid emission factors based on six defined power generation mix scenarios;
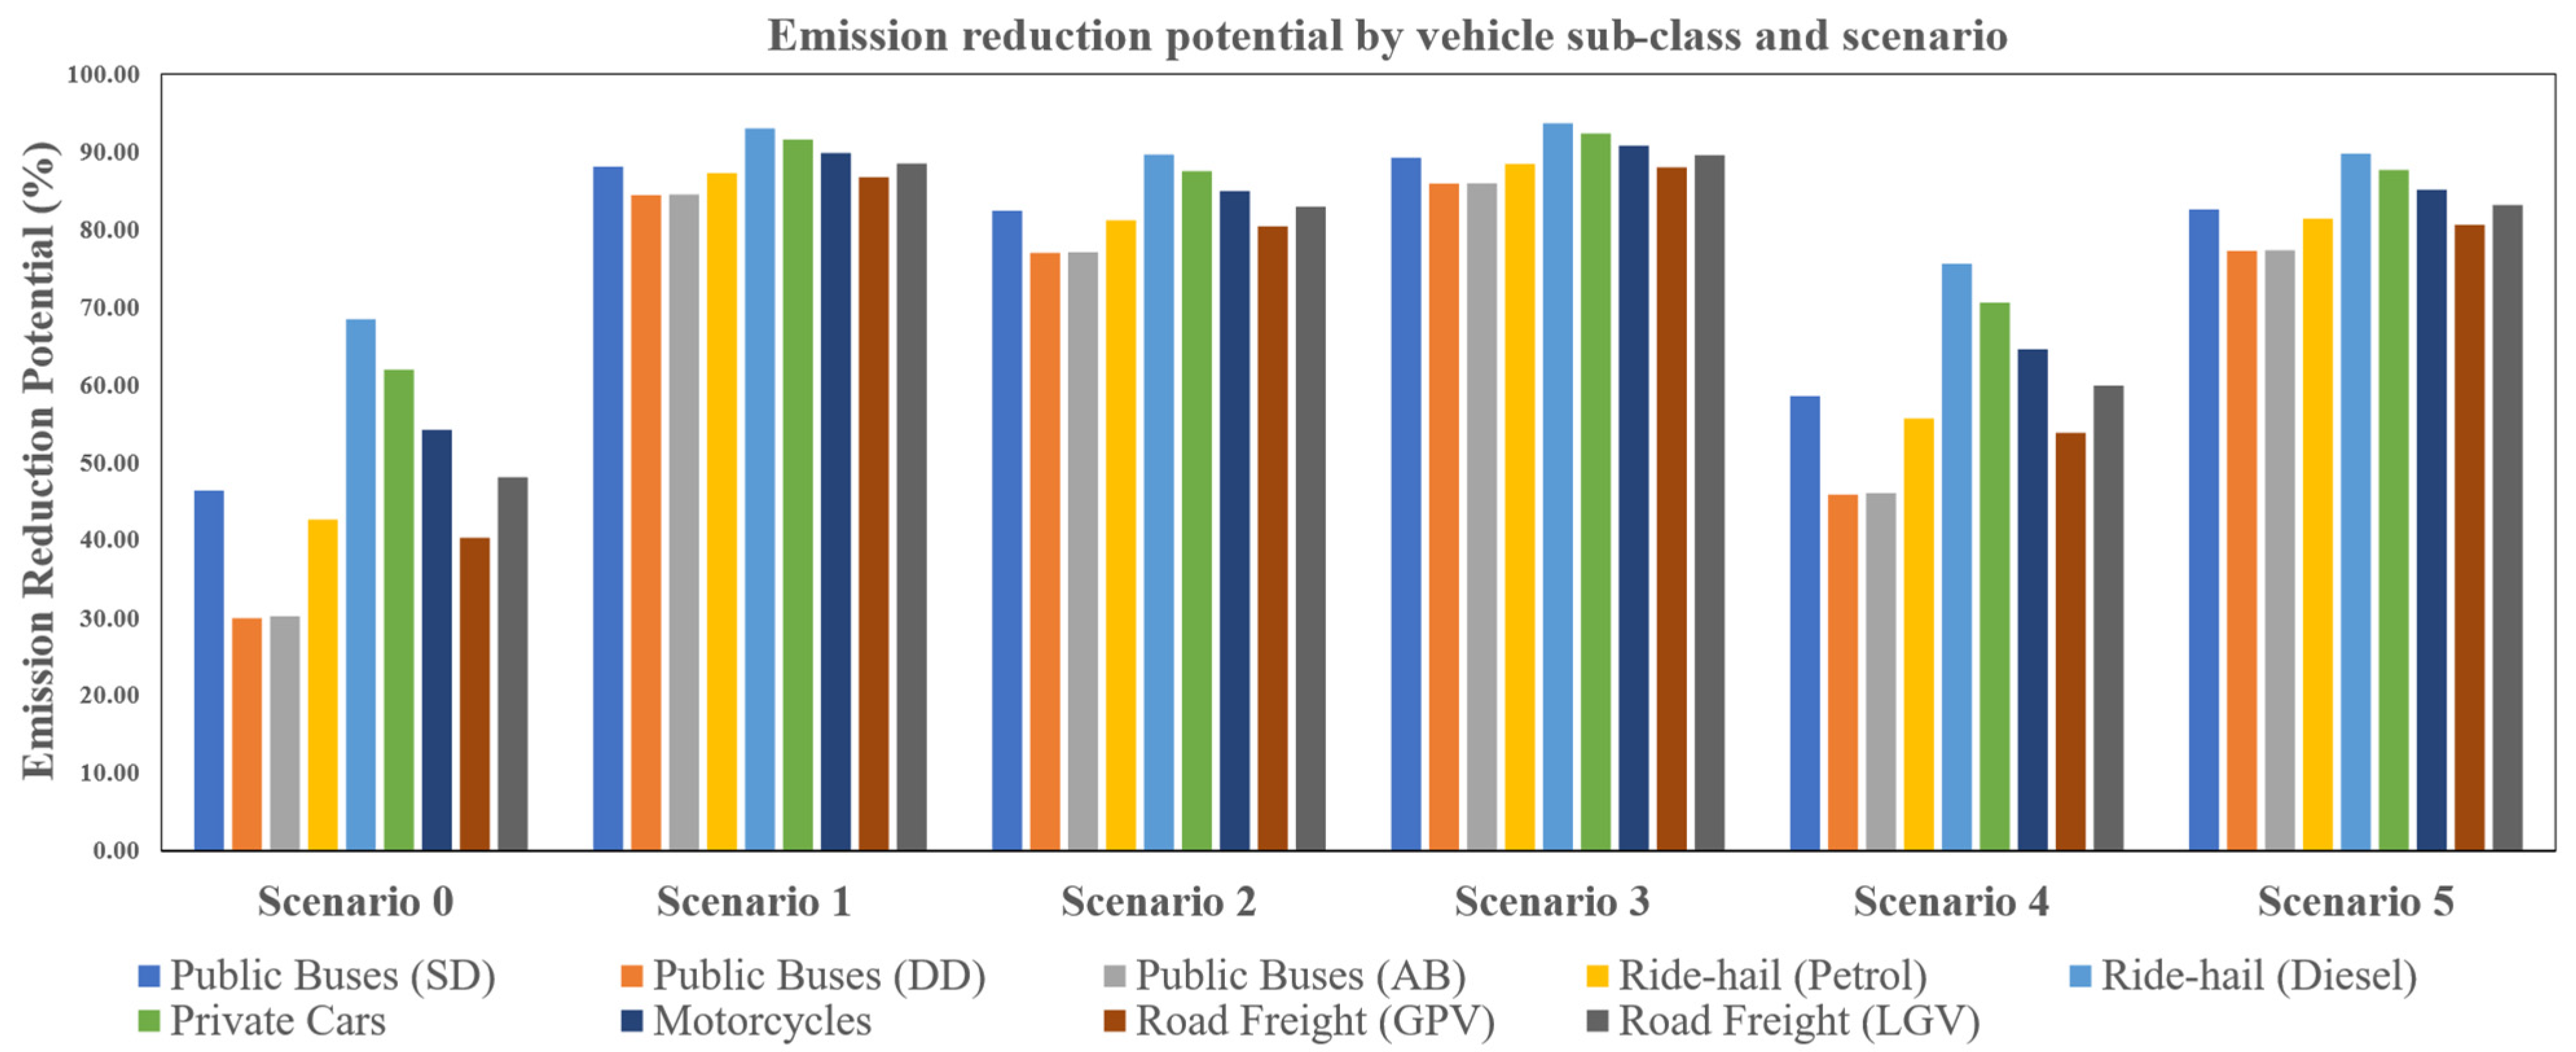
  • Presentation of potential emission reductions based on six power generation scenarios;
  • Provision on recommendations on the optimal pathway towards decarbonization of the transportation sector.

2. Literature Review

At present, there is published literature on energy demand and carbon emission prediction for the road transport sector around the world.
Massier et al. [11] presented research in the realm of Singapore’s road transportation and its integration into the power system. The authors demonstrated that the installed power capacity is large enough to cover additional demand from the electrification of road transport vehicles. They also showed that both PVs and EVs would help reduce country-wide emissions, including greenhouse gases. Based on drive cycles, they estimated the theoretical emission reduction potential. In the best-case scenario, EVs had a CO2 emission reduction potential of 75%. While the emission reduction potential was estimated, the methodology did not consider potentially cleaner energy sources as part of the power generation mix.
Agbulut [12] implemented three different forecasting techniques, deep learning (DL), support vector machine (SVM), and artificial neural network (ANN), to forecast energy demand and carbon emissions through 2050. Input parameters such as gross domestic product (GDP) per capita, population, vehicle kilometers and years were used to implement the forecasting techniques. The author reported an “excellent” forecast according to some commonly used statistical metrics. While this paper had a good forecasting model and recognized the urgency of reducing emissions, policy implementation was not considered in the model framework. Since policies are already being implemented in most countries, a simplistic model or calculation framework needs to be formulated to compute meaningful energy demand and carbon emissions.
Javanmard et al. [13] utilized a hybrid approach integrating a multi-objective mathematical model with machine learning algorithms to predict energy demand and carbon emissions in the transport sector of Canada. The authors predicted that energy demand and emissions would rise by 34.72% and 50.02%, respectively, from 2019 to 2048 [13]. Although the scope of the study was on the transportation sector, the focus was on an aggregated and broader scale, which did not take into consideration the forecast on a granular level. The paper did not break down the projections in terms of the associated sources of demand and emissions such as road transport. More importantly, electrification policies were not integrated into the model, which could potentially give a more realistic representation of the forecasts.
Ivanchev et al. [14] used a simulation-based approach to estimate heat and greenhouse gas emissions from road transport in Singapore. The authors examined three scenarios considering “no electric vehicles”, “all electric vehicles”, and “all autonomous electric vehicles”. Traffic demand was considered constant without estimating future changes due to policies or enhancement of the public transport network, which could lead to lower energy demand for private transport but higher demand for public transport. Possible future changes in the power generation mix, e.g., due to electricity imports or expansion of photovoltaics in Singapore, were not taken into account.
Kazancoglu et al. [15] published a study predicting and evaluating greenhouse gas emissions for sustainable road transport in four European countries. The authors proposed viable solutions to decarbonize the road transport in those countries. Grey prediction was adopted for the implementation of this study. The authors reported that generally there will be an increase observed in the greenhouse gases (GHG) emissions in 2025 across all the four nations with the highest average rise of 27% to 43% recorded in heavy-duty trucks followed by 16% to 32% in cars. A numerical analysis can be conducted to assess the potential impact of the policies that were suggested to reduce GHG emissions.
Alhindawi et al. [16] used a multivariate linear regression model and double exponential smoothing (DES) analysis to estimate the road transport sector’s GHG emissions in North America. The ratio of vehicle kilometers by mode (VKM) to number of transport vehicles (NTVs) had a significant effect on GHG emissions. Their DES model predicted that a conversion from gasoline vehicles to BEVs would come with an emission reduction potential of 62%. The regression and DES models were also validated with excellent error percentages of 1.48% and 1.94%, respectively. While the models showed promising results, the authors highlighted the unavailability of vehicle energy demand data for both ICE vehicles and EVs, which is why this was excluded from their model. Energy demand before and after scenario application, which forms the basis for carbon emission reduction potential calculations, were not established in this study. Sensitivity analyses were conducted based on electrification scenarios. However, government-driven scenario analyses would add more weightage to the results as they might serve as a policy efficacy review.
Rahman et al. [17] conducted a research study to predict the future energy demand of the road transport sector in Saudi Arabia using two machine learning models: ANN and Support Vector Regression (SVR). Additionally, the authors analyzed the causality of the energy demand in this sector with socio-economic parameters, GDP, population of vehicles, total population, and urban population. The study revealed a strong causal relationship of the energy demand in the road transport sector with GDP and urban population. The correlation coefficients of the ANN and SVR were found to be 0.8932 and 0.9925, respectively, basically indicating that the latter performed better with the test data. The training datasets were taken from 1976 to 2004, which means that recent demand trends were ignored. The demand was also found to be proportional to emissions since fossil fuels are the main sources of energy in Saudi Arabia. Nevertheless, the demand forecasted by the authors provided useful insights into the trajectory of demands and emissions, thus allowing policymakers to implement appropriate emission reduction strategies. Conducting modal-level demand and emission projections would be a suitable extension to this study post-policy implementation.
Jiang et al. [18] delved into an empirical-based quantification of CO2 emissions after a modal shift from road to waterway transportation in Zhejiang, China. They used a bottom-up approach using data like voyage density and distance travelled to calculate the emission reduction potential as a result of the modal transition. Three scenarios were defined: Scenario 1 (increasing cargo volume), Scenario 2 (increasing efficiency of ship crossing locks), and Scenario 3 (clean energy application). Scenario 1 demonstrated a high CO2 reduction potential with the increase in cargo volume, while Scenario 2 exhibited a carbon reduction potential with an increase in efficiency. Scenario 3 revealed that the introduction of clean energy into water transportation could increase demand and have a reduction in emissions. This research provided stakeholders with empirical data on the modal transition. An addition to this study could be the application of electrification policies to other modes of transport, wherein ICE vehicles are replaced by EVs, and a projection of the emissions and consumption could be carried out.
Alhindawi et al. [19] employed a multivariate linear regression (MVLR) model for the road transport sector to predict its GHG emissions for the United States (US). The model was devised using the ratio between vehicle-kilometers and vehicle population for six transport modes. The authors identified vehicles that caused GHG emissions to rise significantly. The model suggested that passenger cars, light trucks, buses, and single-unit trucks contributed to CO2 emissions. The coefficient of determination and adjusted R2 show that the MVLR model is suitable for predicting emissions based on transport vehicle parameters as inputs. Like some studies, the model proved useful in sieving out the vehicles that contribute heavily to GHGs. This is an important step towards carving out appropriate policies to reduce these emissions. A beneficial next step to this investigation could be to introduce electrification policies to the vehicles identified in this paper and determine how these policies would influence emissions after policy implementation.
Krause et al. [20] published a study that analyzed European road transport CO2 emission reduction options by 2050. Four emission reduction scenarios were formulated and quantified through a combination of expert opinion and numerical modeling: vehicle efficiency improvement, transport smoothening, transport volume reduction, and optimistic and pessimistic versions. Under an aggressive electrification policy, emissions were seen to reduce by as much as 90% in 2050 in comparison to 1990. With ambitious electrification scenarios, emissions would be reduced by more than 60% but at a cost of significant demand for low-carbon electricity. Electricity for battery and plug-in hybrid EVs would possibly increase tank-to-wheel carbon emissions by 40%. An amalgamation of policies was suggested by the authors in order to minimize emissions. The investigation was holistically conducted; however, the authors acknowledged a bias from experts towards technical measures, which could have skewed some of the results one way or the other.
In summary, the literature reviewed in this paper highlights some gaps pertaining to government-backed electrification policies and their quantification, the decarbonization of the power generation mix, and the estimation of energy demands and carbon emissions on a vehicle level. Furthermore, the interest of this study lies in the context of Singapore. This paper aims to address the above-mentioned gaps and provide energy demand estimates and carbon emission reduction potentials for road transport vehicles in Singapore after a 100% electrification policy is applied.

3. Methodology and Data Collection

In this section, first, the methodology to estimate the energy demand and emissions is presented. This is followed by the establishment of mathematical equations, collection of datasets, and scenario definitions.

3.1. Methodology

The methodology adopted in this paper takes a multi-step approach to determining the energy demand and carbon emission outlook potential for Singapore’s road transportation, given as follows:
  • Establish a set of vehicle parameter databases for each vehicle type for the present time (i.e., vehicle population, fuel consumption, etc.);
  • Derive the present energy demand of each of the nine vehicle sub-classes;
  • Establish the petrol/diesel emission factors;
  • Derive present carbon emissions using the values from steps 2 and 3;
  • Establish a set of vehicle parameter databases and assumptions for each vehicle sub-class for 2040;
  • Derive the 2040 energy demand of each of the nine vehicle sub-classes;
  • Establish the power generation mix scenario policies to derive the grid emission factors;
  • Derive the 2040 carbon emissions based on the various emission factors from 7;
  • Compute the energy demand reduction from steps 2 and 6;
  • Compute the potential carbon emission reduction from steps 4 and 8 across the scenarios.
Figure 2 presents a summarized overview of the methodology adopted in this paper.

3.2. Theory

In this sub-section, the equations to calculate the energy demand are presented and explained.

3.2.1. Present Energy Demand

Equation (1) calculates the present total energy demand over a full year (365 days). It considers factors like fuel consumption, fuel’s heat value and density, average trip length, number of trips per vehicle, and total vehicle population.
E p r e s e n t v = 365   ×   E c o n s u m p t i o n v   ×   H f × ρ f × m m e a n v × N v
where E p r e s e n t v is the energy demand for a given vehicle sub-class v in megajoules (MJ) across a year, E c o n s u m p t i o n v is the energy consumption of a given vehicle sub-class v in liters per 100 km, H f is the heat value of fuel type f in MJ/kg, ρ f is the density of the given fuel type f in kg/L, m m e a n v is the average daily mileage of a given vehicle sub-class v, and N v is the vehicle population. There are five vehicle classes (public buses, private cars, road freight, motorcycles, and ride-hail) and two fuel types (petrol and diesel). E p r e s e n t v is simply summed up together across the vehicle classes to compute the present energy demand in totality.

3.2.2. Energy Demand in 2040

In 2040, a 100% electrification policy will be applied to all vehicles. To compute the energy demand in 2040 after policy implementation, Equation (2) is used:
E 2040 v = E c o n s u m p t i o n v   × l × N v
where E 2040 v is the 2040 annual energy demand in kilowatt-hours (kWh) of a given type of vehicle sub-class, v. E c o n s u m p t i o n v is the energy consumption of a given vehicle sub-class, v in Wh/km, l is the mean annual mileage in km, and N v is the vehicle population for a given EV.

3.2.3. Present and 2040 Carbon Emissions

The present carbon emissions of a given vehicle are expressed as the product of the emission factor e f a c t o r f of a given fuel type f, petrol (p), diesel (d), or petrol/diesel (pd), and the present energy demand established in Equation (1), and is expressed as:
C p r e s e n t v =   e f a c t o r f ×   E p r e s e n t v
Similarly, the carbon emissions of a given EV in 2040 are expressed as the product of the emission factor in 2040, e f a c t o r s , where s denotes the scenario, and the energy demand in 2040 established in Equation (2), and is expressed as:
C 2040 v =   e f a c t o r s ×   E 2040 v

3.3. Data collection

3.3.1. Fuel Emission Factor

As seen in Equation (3), carbon emissions are a function of energy demand and fuel emission factors. A unit of energy, kilotons of oil equivalent (ktoe), is used in this paper as a reference for emission factors. The emission factors for petrol and diesel vehicle are 2732.329 kgCO2/ktoe and 2894.927 kgCO2/ktoe, respectively, based on the emission factors reported in [21].

3.3.2. Vehicle and Fuel Data

The energy demand equations were established in Section 3.2. in the. In this sub-section, each of the unknown parameters that form the precursor data to derive the energy demand and emissions for each of the vehicle sub-classes is assigned. The assumptions are presented in Table 1.
The data are grouped into their individual nine vehicle sub-classes, which can be further generally categorized into five vehicle classes. Each sub-class is assigned a fuel type, either petrol or diesel, depending on the fuel each vehicle type uses. The ride-hail population is a mixture of petrol and diesel vehicles with 70% being petrol and 30% diesel as an estimation based on [2].
The vehicle population growth is assumed to be saturated with no increase from the present to year 2040 [29,30], when 100% electrification is set to be complete. The daily average mileage of each vehicle sub-class and population are also presented in Table 1.

3.4. Scenario Definitions

3.4.1. Power Generation Mix Scenarios

The emission balance of EVs depends on the grid emission factor given as kgCO2 per kWh of electricity generated. It depends on the power generation mix of a country or region. Figure 3 shows how the grid emission factor has changed over a period of six years in Singapore.
In 2022, the grid emission factor for Singapore reported by the EMA (Energy Market Authority) was 0.4168 kgCO2/kWh, with natural gas accounting for 92.0% of the total power generation mix. According to the EMA’s Energy 2050 Committee Report, Singapore’s heavy reliance on natural gas in its current electricity mix does not eliminate the possibility of achieving carbon neutrality in its power sector by 2050 [31]. However, the report also acknowledges the uncertainties associated with this goal and outlines three scenarios to facilitate the transition to net-zero emissions by 2050. Since the potential for renewable energies is low in Singapore, the import of “clean” electricity or other energy carriers are the only options to lower the grid emission factor.
In this study, we create five scenarios based on the EMA’s [31] report. First, we establish a baseline scenario, Scenario 0, which accounts for the current power generation mix with a grid emission factor of 0.428 kgCO2/kWh (calculated). Then, we define further scenarios with the emission factors of each energy carrier being used to estimate the overall grid emission factor. The product of the power generation mix and emission factor for each energy carrier was taken and summed up to derive the overall grid emission factor for each scenario. A minute variance of 2.68% was observed in the reported value in the EMA’s publication against the calculated grid emission factor.
Scenarios 1, 2, and 3 are based on the EMA’s Energy 2050 Committee Report [31]. In Scenario 1, the focus is on diversification of the power generation mix with electricity imports and low-carbon hydrogen being the main carriers [31]. Singapore will be equipped with sophisticated grid capabilities, which include smart technologies such as artificial intelligence (AI), machine learning (ML) and vehicle-to-grid (V2G). Consumers in this scenario are envisioned to be self-sufficient in the way they consume energy. In Scenario 2, 60% of Singapore’s energy would come from imported electricity [31]. This increased adoption stems from the successful electricity import trials in the early 2020s. Singapore has also proven it can provide efficient backup power in cases of import electricity breakdown. Scenario 3 is dominated by low-carbon hydrogen (55%) replacing natural gas as the primary source. Electricity imports will contribute 25% to the final power generation mix. With the large demand for hydrogen in 2050, the cost of hydrogen will see a continued decline.
A Straits Times article suggested that by 2035 in Singapore, the reliance on natural gas would be about 50%; 30% on renewable imports; and the other 20% on solar, hydrogen, biofuels, nuclear, and geothermal power [32]. For Scenario 4, it is assumed that the power generation mix in 2035 will remain constant in 2040.
Figure 3. Grid emission factor of Singapore [33,34].
Sustainability 16 04754 g003
Scenario 5 is devised to modify Scenario 2 by incorporating 30% natural gas into the power generation mix and reallocating the weightage across the rest of the energy carriers. This could possibly serve as one of the more realistic scenarios since the dependence on natural gas at present is substantial.
Full road transport electrification was applied to all six scenarios. They are summarized in Table 2. Each energy source was assigned an emission factor referenced from multiple sources.

3.4.2. Vehicle Class-Based Electrification Scenarios

The vehicles at the sub-class level were reclassified into vehicle class levels as demonstrated in Figure 4. This was done as a first step to conduct an analysis by vehicle class. A full 100% electrification scenario was then applied to each vehicle class in isolation to assess its overall impact as a percentage of aggregated present road transport emissions.

4. Results

First, a comparison between present and 2040 energy demands of road transport is presented. Next, the results of the scenario-based analysis are presented and discussed, and the impact of the six scenarios on the carbon emission reduction potential is analyzed.

4.1. Present vs. 2040 Energy Demand

Table 3 and Figure 5 summarize and visualize the present and 2040 estimated energy demands of the different vehicle sub-classes after policy implementation.
The energy demand potential comparison between the present and year 2040 shows a significant reduction potential of 59.27% to 81.64% across all vehicles, with the highest percentage reduction seen in diesel-fueled ride-hail vehicles. The vast decline in energy demand for private cars results from the policy that every private car has to be taken off Singapore’s road after ten years, and that by 2040, all ICE cars must be phased out.

4.2. Scenario-Based Analysis

In this section, the results from the scenario-based analysis are presented and analyzed.
Table 4 and Figure 6 present the results from the first part of the scenario-based analysis. Across all the power generation mix scenarios, reduction potentials as high as 93.64% were seen. This was the case for the diesel-based ride-hail vehicles in Scenario 3. Scenario 3 revealed the highest reduction potential (90.79%) at an aggregated level. Generally, the reduction potential across the board were seen to rise in tandem with the grid emission factors. The emission reduction potential for Scenarios 1 to 5 was seen to be higher than that of the baseline scenario.
Vehicle sub-classes were classified into classes, and the results are presented in Table 5 and Figure 7. Private cars showed the greatest carbon reduction potential across all scenario cases, followed by road freight, ride-hail, public buses, and finally motorcycles, which showed the lowest potential.

5. Discussion

The results from the scenario analysis show that the energy demand in 2040 will experience a 59.27 to 81.64% reduction after full electrification of the nine vehicle sub-classes owing to improved drivetrain efficiencies.
The emission reduction from Scenario 0 statistically highlights that the transition from ICE to EVs alone is one of two key factors towards achieving significant GHG abatement. It shows a carbon reduction potential of 29.96 to 68.42% across all nine sub-classes. This points to notable improvements in vehicle drive train efficiency, hence justifying the need to transition to EVs. Additionally, the power generation mix of Scenario 0 reflects Singapore’s current power generation mix, meaning that any efforts to decarbonize the grid will further reduce carbon emissions. Lowering emissions could also have a positive outcome in terms of air quality. However, the transition to EVs poses some challenges. Some studies have already addressed infrastructure challenges such as charging station placement [38] and EVs’ impact on the grid [39]. Furthermore, the vehicles’ electrification should be approached holistically due to the environmental implications. To address this issue, the battery supply chain needs to be made as circular as possible by incorporating environmentally sound recycling processes [40].
This study incorporates these energy-mix scenarios to explore the connection between grid decarbonization and the electrification of vehicle fleets. Scenarios 1 through 5 explore integrating clean energy technologies such as hydrogen, nuclear power, and electricity imports into the power system, alongside full electrification of different vehicle classes.
Across nine vehicle sub-classes, the introduction of renewable sources of energy carriers into the grid would boost the reduction potential by 89.30% on average in the best-case power generation mix scenario (Scenario 3). The results show that there is a further reduction potential ranging from 45.84 to 93.64% across all the vehicle sub-classes. This underscores the importance of maximizing the utilization of low-carbon energy sources alongside the electrification of vehicles to optimize carbon abatement. Furthermore, this assumes a constant efficiency of each of the electricity generation technologies. With improvements in conversion efficiencies, the reduction will only be enhanced further.
The analysis reveals that private cars have the highest mean carbon reduction potential (36.22 ± 5.56%) across Scenarios 1 through 5, which is because they make up 62.94% of the overall vehicle class population. Conversely, due to their rather low energy demand, motorcycles have the lowest mean emission reduction potential across all scenarios (1.61 ± 0.31%) while having the second largest share (15.80%) among the vehicle class population.
Our research primarily focuses on empirical data concerning the operational phase of vehicles within Singapore’s road transport sector. While this provides valuable insights into emission reduction strategies, it is important to acknowledge some improvements that could enhance the depth of future investigations.
Firstly, incorporating data on manufacturing and end-of-life phase emissions would offer a more comprehensive overview of Singapore’s road transport carbon abatement efforts. This extension could illuminate the complete lifecycle impact of vehicle emissions, guiding policymakers towards more effective sustainability measures.
Secondly, our study bases energy demand estimations for electric vehicles (EVs) on a specific drivetrain efficiency. However, ongoing advancements in vehicle technologies and the integration of autonomous driving in transportation systems may lead to improved drivetrain efficiencies. Exploring these developments could provide a clearer picture of the potential emission reductions achievable through technological innovation.
Furthermore, a deeper analysis, including the impacts of active mobility and the car-lite initiative introduced in 2013 [41] within scenario-based frameworks, could yield refined insights. Specifically, investigating population redistribution between private cars and public transportation under varying scenarios would provide valuable insights into strategies aimed at reducing emissions.
Despite these limitations, the successful electrification of Singapore’s road transport sector and the ongoing diversification of the power generation mix towards cleaner energy sources signify healthy progress towards the nation’s decarbonization goals. These achievements underscore the importance of continued research and policy adaptations to ensure sustainable environmental outcomes.

6. Conclusions

This study conducted an empirical analysis of Singapore’s road transport sector, focusing on the energy demand forecast, carbon emission reduction potential, and impact of electrification policies. By projecting a 100% electrification scenario by 2040, the study forecasted significant reductions in energy demand across various vehicle types, with potential reductions ranging from 59.27% to 81.64%.
The methodology integrated detailed vehicle parameters, fuel consumption data, and emission factors to calculate present and future energy demands and carbon emissions. It also considered six power generation mix scenarios ranging from current energy sources to diversified mixes, including renewables and low-carbon technologies.
The results showed substantial emission reduction potential across scenarios, with up to 93.64% reductions observed in diesel-based ride-hail vehicles under specific power generation mixes. Private cars exhibited the highest carbon reduction potential, followed by road freight, ride-hail, public buses, and motorcycles. Application of the proposed empirical framework not only underscores the importance of transitioning from ICE vehicles to EVs but also emphasizes the role of cleaner energy sources in optimizing carbon abatement. The study’s findings provide valuable insights for policymakers and stakeholders, outlining an optimal pathway towards decarbonizing Singapore’s road transportation sector and contributing to global climate action efforts.
The key findings from this study can be summarized as follows:
(1)
Electrifying all nine road transport vehicle sub-classes is projected to reduce energy demand by 69.33 ± 7.57% on average. This substantial reduction can be primarily attributed to enhanced vehicle efficiencies associated with electrification.
(2)
Even with the current power generation mix, the complete electrification of all nine vehicle sub-classes could mitigate 46.90 ± 13.10% of carbon emissions, highlighting the immediate environmental benefits achievable through electrification.
(3)
In the optimal scenario where 100% electrification is coupled with low-carbon technologies integrated into the power system, the potential for emission reduction significantly increases to 89.30 ± 2.64%. This reflects the importance of synergistic approaches to achieving substantial reductions in carbon emissions.
(4)
The research identifies two primary pathways for decarbonizing road transport: complete electrification of vehicle fleets and adoption of low-carbon energy carriers within the power system. These pathways offer promising strategies for achieving sustainable and environmentally friendly transportation systems.

Author Contributions

S.C.D.: conceptualization, methodology, formal analysis, writing—original draft, visualization; A.C.: methodology, formal analysis; T.M.: conceptualization, methodology, writing—review and editing, validation, supervision; T.H.: validation, supervision. All authors have read and agreed to the published version of the manuscript.

Funding

This work was financially supported by the Singapore National Research Foundation under its Campus for Research Excellence and Technological Enterprise (CREATE) programme (Grant No.: NRF2022-ITC004-001).

Institutional Review Board Statement

Not applicable.

Informed Consent Statement

Not applicable.

Data Availability Statement

The data used in this study are publicly available.

Conflicts of Interest

The authors declare no conflict of interest.

References

  1. Ritchie, H. Cars, Planes, Trains: Where Do CO2 Emissions from Transport Come from? Available online: https://ourworldindata.org/co2-emissions-from-transport (accessed on 12 May 2024).
  2. Transport. Available online: https://www.nccs.gov.sg/singapores-climate-action/mitigation-efforts/transport/ (accessed on 1 February 2024).
  3. Land Transport Authority. Land Transport Master Plan 2040; Land Transport Authority: Singapore. Available online: https://www.lta.gov.sg/content/ltagov/en/who_we_are/our_work/land_transport_master_plan_2040.html (accessed on 17 May 2024).
  4. Land Transport Authority. Electric Vehicles. Available online: https://www.lta.gov.sg/content/ltagov/en/industry_innovations.html (accessed on 17 April 2024).
  5. Motor Vehicle Population by Vehicle Type. Available online: https://www.lta.gov.sg/content/ltagov/en/who_we_are/statistics_and_publications/statistics.html (accessed on 1 March 2024).
  6. Land Transport Authority. Getting Around. Available online: https://www.lta.gov.sg/content/ltagov/en/getting_around.html (accessed on 17 April 2024).
  7. O’Reilly, R.K.; Kollmann, A.; Cohen, J.J.; Reichl, J. Macro-factors driving bicycle adoption as a primary transport mode across Europe. Travel Behav. Soc. 2024, 34, 100669. [Google Scholar] [CrossRef]
  8. Land Transport Authority. Factsheet: Sustaining the Momentum of Vehicle Electrification. Available online: https://www.lta.gov.sg/content/ltagov/en/newsroom/2023/3/news-releases/sustaining_the_momentum_of_vehicle_electrification.html (accessed on 16 April 2024).
  9. Lim, A. Singapore’s First Electric-Vehicle Car-Sharing Programme to Roll Out from December. The Straits Times, Singapore, 27 September 2017. Available online: https://www.straitstimes.com/singapore/transport/electric-vehicle-car-sharing-programme-officially-rolls-out-with-80-cars (accessed on 17 April 2024).
  10. SG Green Plan. Speech by Minister Ong Ye Kung: A New Drive. Available online: https://www.greenplan.gov.sg/news/speeches/2021-03-04-mot/ (accessed on 17 April 2024).
  11. Massier, T.; Recalde, D.; Sellmair, R.; Gallet, M.; Hamacher, T. Electrification of Road Transport in Singapore and its Integration into the Power System. Energy Technol. 2018, 6, 21–32. [Google Scholar] [CrossRef]
  12. Ağbulut, Ü. Forecasting of transportation-related energy demand and CO2 emissions in Turkey with different machine learning algorithms. Sustain. Prod. Consum. 2022, 29, 141–157. [Google Scholar] [CrossRef]
  13. Javanmard, M.E.; Tang, Y.; Wang, Z.; Tontiwachwuthikul, P. Forecast energy demand, CO2 emissions and energy resource impacts for the transportation sector: Multi-objective optimization, sensitivity analysis and Canada Case Study. Appl. Energy 2023, 338, 120830. [Google Scholar] [CrossRef]
  14. Ivanchev, J.; Fonseca, J.; Knoll, A. Electrification and Automation of Road Transport: Impact Analysis of Heat and Carbon Emissions for Singapore. In Proceedings of the 2020 IEEE 23rd International Conference on Intelligent Transportation Systems (ITSC), Rhodes, Greece, 20–23 September 2020. [Google Scholar] [CrossRef]
  15. Kazancoglu, Y.; Ozbiltekin-Pala, M.; Ozkan-Ozen, Y.D. Prediction and evaluation of greenhouse gas emissions for sustainable road transport within Europe. Sustain. Cities Soc. 2021, 70, 102924. [Google Scholar] [CrossRef]
  16. Alhindawi, R.; Nahleh, Y.A.; Kumar, A.; Shiwakoti, N. Projection of greenhouse gas emissions for the road transport sector based on multivariate regression and the double exponential smoothing model. Sustainability 2020, 12, 9152. [Google Scholar] [CrossRef]
  17. Rahman, M.M.; Rahman, S.M.; Shafiullah, M.; Hasan, M.A.; Gazder, U.; Al Mamun, A.; Mansoor, U.; Kashifi, M.T.; Reshi, O.; Arifuzzaman, M.; et al. Energy Demand of the Road Transport Sector of Saudi Arabia—Application of a Causality-Based Machine Learning Model to Ensure Sustainable Environment. Sustainability 2022, 14, 16064. [Google Scholar] [CrossRef]
  18. Jiang, M.; Wang, B.; Hao, Y.; Chen, S.; Wen, Y.; Yang, Z. Quantification of CO2 emissions in transportation: An empirical analysis by modal shift from road to waterway transport in Zhejiang, China. Transp. Policy 2024, 145, 177–186. [Google Scholar] [CrossRef]
  19. Alhindawi, R.; Nahleh, Y.A.; Kumar, A.; Shiwakoti, N. A Multivariate Regression Model for Road Sector Greenhouse Gas Emission. 2016. Available online: https://trid.trb.org/view/1446676 (accessed on 20 May 2024).
  20. Krause, J.; Thiel, C.; Tsokolis, D.; Samaras, Z.; Rota, C.; Ward, A.; Prenninger, P.; Coosemans, T.; Neugebauer, S.; Verhoeve, W. EU road vehicle energy consumption and CO2 emissions by 2050—Expert-based scenarios. Energy Policy 2020, 138, 111224. [Google Scholar] [CrossRef]
  21. Greenhouse Gas Protocol. Calculation Tools and Guidance. Available online: https://ghgprotocol.org/calculation-tools-and-guidance (accessed on 1 March 2024).
  22. Gallet, M.; Massier, T.; Hamacher, T. Estimation of the energy demand of electric buses based on real-world data for large-scale public transport networks. Appl. Energy 2018, 230, 344–356. [Google Scholar] [CrossRef]
  23. Land Transport Authority. Fuel Cost Calculator. Available online: https://vrl.lta.gov.sg/lta/vrl/action/pubfunc?ID=FuelCostCalculator (accessed on 1 March 2024).
  24. Lim, V. IN FOCUS: Singapore’s Electric Vehicle Revolution Is Coming—Does This Spell the End for Petrol Stations? Available online: https://www.channelnewsasia.com/singapore/focus-singapores-electric-vehicle-revolution-coming-does-spell-end-petrol-stations-2768051 (accessed on 17 April 2024).
  25. Federation of European Motorcyclists’ Association. Yes, Motorcycles Use Less Fuel Than Cars, Here’s the Proof. Available online: https://www.femamotorcycling.eu/yes-motorcycles-use-less-fuel-than-cars-heres-the-proof/ (accessed on 17 May 2024).
  26. Oh, S.; Lentzakis, A.F.; Seshadri, R.; Ben-Akiva, M. Impacts of Automated Mobility-on-Demand on traffic dynamics, energy and emissions: A case study of Singapore. Simul. Model. Pr. Theory 2021, 110, 102327. [Google Scholar] [CrossRef]
  27. Budget Direct Insurance. Motorcyclists Statistics Singapore 2023. Available online: https://www.budgetdirect.com.sg/motorcycle-insurance/research/motorcyclists-statistics-in-singapore (accessed on 17 April 2024).
  28. Charoen-amornkitt, P.; Nantasaksiri, K.; Ruangjirakit, K.; Laoonual, Y. Energy consumption and carbon emission assessment of battery swapping systems for electric motorcycle. Heliyon 2023, 9, e22887. [Google Scholar] [CrossRef] [PubMed]
  29. Lee, N.T. Govt Open to Idea of One-Off Increase in Vehicle Population with Higher Usage-Based Charges: Chee Hong Tat. The Straits Times, Singapore, 6 March 2024. Available online: https://www.straitstimes.com/singapore/politics/govt-open-to-idea-of-one-off-increase-in-vehicle-population-with-higher-usage-based-charges-chee-hong-tat (accessed on 17 April 2024).
  30. Ramachandran, S.; Siala, K.; de La Rúa, C.; Massier, T.; Ahmed, A.; Hamacher, T. Life cycle climate change impact of a cost-optimal HVDC connection to import solar energy from Australia to Singapore. Energies 2021, 14, 7178. [Google Scholar] [CrossRef]
  31. Energy 2050 Committee Report Charting the Energy Transition to 2050. 2022. Available online: https://www.ema.gov.sg/resources/industry-reports (accessed on 17 April 2024).
  32. What Could Singapore’s Energy Mix Look Like in 2035?|The Straits Times|The Straits Times. Available online: https://www.straitstimes.com/multimedia/graphics/2023/11/energy-mix-2035/ (accessed on 1 February 2024).
  33. Energy Market Authority. EMA|SES Chapter 2: Energy Transformation. Available online: https://www.ema.gov.sg/resources/singapore-energy-statistics/chapter2 (accessed on 1 February 2024).
  34. Tsukui, A.; Louhisuo, M.; Azuma, M. IGES List of Grid Emission Factors. Available online: https://www.iges.or.jp/en/pub (accessed on 20 May 2024).
  35. U.S. Energy Information Administration. How Much Carbon Dioxide Is Produced per Kilowatthour of U.S. Electricity Generation? Available online: https://www.eia.gov/tools/faqs/ (accessed on 17 April 2024).
  36. World Nuclear Association. Carbon Dioxide Emissions from Electricity. Available online: https://world-nuclear.org/information-library/energy-and-the-environment/carbon-dioxide-emissions-from-electricity (accessed on 20 May 2024).
  37. National Renewable Energy Laboratory (NREL). Life Cycle Emissions Factors for Electricity Generation Technologies. Available online: https://data.nrel.gov/submissions/171 (accessed on 20 May 2024).
  38. IEEE ITSS and Institute of Electrical and Electronics Engineers. IEEE ITSC 2017: 20th International Conference on Intelligent Transportation Systems: Mielparque Yokohama in Yokohama, Kanagawa, Japan, 16–19 October 2017. Available online: https://ieeexplore.ieee.org/document/8317680 (accessed on 20 May 2024).
  39. Bartolini, A.; Hug, G. An open-data based framework to estimate EV demand and attainable flexibility and application to the case of Singapore. Sustain. Energy Grids Netw. 2023, 36, 101196. [Google Scholar] [CrossRef]
  40. Richter, J.L. A circular economy approach is needed for electric vehicles. Nat. Electron. 2022, 5, 5–7. Available online: https://www.nature.com/articles/s41928-021-00711-9 (accessed on 20 May 2024). [CrossRef]
  41. Centre for Liveable Cities Singapore. Car-Lite Urban Mobility. Available online: https://www.clc.gov.sg/docs/default-source/books/carlite-urban-mobility-finalreport.pdf (accessed on 18 May 2024).
Figure 2. Energy demand and carbon emission estimation framework overview.
Sustainability 16 04754 g002
Figure 4. Vehicle classification from sub-class to vehicle class level.
Sustainability 16 04754 g004
Figure 5. Present vs. 2040 energy demand (ktoe).
Sustainability 16 04754 g005
Figure 6. Emission reduction potential by vehicle sub-class and scenario.
Sustainability 16 04754 g006
Figure 7. Emission reduction potential (%) by vehicle class and scenario.
Sustainability 16 04754 g007
Table 1. Transport sub-classes and their associated data assumptions.
Transport Sub-ClassFuel
Used
Energy
Consumption
(L/100 km): ICE
Energy
Consumption
(Wh/km): EV
Average
Daily Mileage
(km)
Population
Public Buses (SD)Diesel50 [22]1600 [22]201.55 [22]3805 [22]
Public Buses (DD)Diesel55 [22]2300 [22]201.55 [22]1629 [22]
Public Buses (AB)Diesel60 [22]2500 [22]201.55 [22]430 [22]
Ride-hailPetrol (~70%)3.7 [23]115 [23]230 [24]60,701 [2]
Ride-hailDiesel (~30%)6.1 [23]115 [23]230 [24]26,015 [2]
Private CarsPetrol7.6 [25]166 [26]47.95 [27]567,457 [2]
MotorcyclesPetrol1.9 [28]50 [28]35.62 [27]142,453 [2]
Road Freight (GPV)Diesel7.77 [23]277 [23]109.59 [27]2603 [2]
Road Freight (LGV)Diesel8.94 [12]277 [23]109.59 [27]96,514 [2]
Table 2. Power generation mix scenarios summary.
Energy
Scenario
Energy
Source
Percentage of
Power Generation Mix
Emission Factor (kgCO2/kWh)Weighted
Emission Factor (kgCO2/kWh)
Scenario 0:
Constant energy
mix
Natural gas94.30.440 [35]0.415
Solar and municipal energy waste4.40.048 [36]0.002
Coal0.90.820 [36]0.007
Petroleum products0.31.080 [35]0.003
Overall100-0.428
Scenario 1:
Diversified
Mix
[31]
Electricity Imports40.00.110 [30]0.044
Low-carbon hydrogen40.00.094 *0.038
Solar6.00.020 [37]0.001
Geothermal12.00.038 [36]0.005
Others2.00.390 [35]0.008
Overall100-0.095
Scenario 2:
Electricity
Imports
Dominated
[31]
Electricity imports60.00.110 [30]0.060
Low-carbon hydrogen10.00.094 *0.009
Natural gas12.00.440 [35]0.053
Solar8.00.020 [37]0.002
Geothermal8.00.038 [36]0.003
Others2.00.390 [35]0.008
Overall100-0.141
Scenario 3:
Low-carbon
Hydrogen
[31]
Low-carbon hydrogen55.00.094 *0.052
Electricity imports25.00.110 [30]0.025
Solar8.00.020 [37]0.002
Geothermal1.00.038 [36]0.000
Nuclear10.00.012 [36]0.001
Others1.00.390 [35]0.004
Overall100-0.086
Scenario 4:
2035 => 2040
[32]
Natural gas50.00.440 [35]0.220
Renewable energy imports30.00.110 [30]0.033
Others20.00.390 [35]0.078
Overall100-0.331
Scenario 5:
30% Natural Gas
Electricity imports40.00.110 [30]0.044
Low-carbon hydrogen10.00.094 *0.038
Natural gas30.00.440 [35]0.044
Solar6.00.020 [37]0.001
Geothermal12.00.038 [36]0.005
Others2.00.390 [35]0.008
Overall100-0.139
* This emission factor was derived from internal datasets. The overall emission factor of each scenario is printed in bold.
Table 3. Present vs. 2040 energy demand potential.
Transport
Type
Present Energy
Demand (ktoe)
Energy
Demand in 2040 (ktoe)
Energy Demand
Reduction (%)
Public Buses (SD)123.5438.5068.83
Public Buses (DD)58.2023.7059.27
Public Buses (AB)16.756.8059.42
Ride-hail (Petrol)160.0950.3968.53
Ride-hail (Diesel)117.6021.6081.64
Private Cars640.89141.7677.88
Motorcycles29.887.9673.35
Road Freight (GPV)7.142.4865.28
Road Freight (LGV)304.6891.9569.82
Table 4. Carbon emission reduction percentage by vehicle sub-class and scenario.
Vehicle Sub-ClassScenario 0Scenario 1Scenario 2Scenario 3Scenario 4Scenario 5
Public Buses (SD)46.4088.0882.3989.2058.5582.58
Public Buses (DD)29.9584.4376.9985.8845.8477.23
Public Buses (AB)30.2084.4877.0785.9346.0377.31
Ride-hail (Petrol)42.6587.2581.1688.4455.6681.36
Ride-hail (Diesel)68.4292.9889.6393.6475.5889.73
Private Cars61.9691.5487.5092.3370.5987.63
Motorcycles54.1789.8184.9490.7664.5685.10
Road Freight (GPV)40.2886.7380.3887.9653.8380.59
Road Freight (LGV)48.1088.4682.9589.5459.8783.13
Aggregated Reduction54.3189.8484.9990.7964.6785.15
The aggregated emission reduction of each scenario is printed in bold.
Table 5. Carbon emission reduction potential (%) by vehicle class and scenario.
Vehicle ClassScenario 0Scenario 1Scenario 2Scenario 3Scenario 4Scenario 5
Public Buses5.5011.8711.0012.047.3611.03
Ride-hail10.0016.6415.7316.8111.9315.76
Private Cars 27.3940.4738.6840.8231.2038.74
Motorcycles1.121.851.751.871.331.75
Road Freight10.3119.0217.8319.2512.8517.87
Disclaimer/Publisher’s Note: The statements, opinions and data contained in all publications are solely those of the individual author(s) and contributor(s) and not of MDPI and/or the editor(s). MDPI and/or the editor(s) disclaim responsibility for any injury to people or property resulting from any ideas, methods, instructions or products referred to in the content.

