Abstract
Although manifold empirical studies have identified the mechanical properties of crumb rubber concrete (CRC), a comparative analysis of economic and environmental benefits between CRC and ordinary Portland cement concrete (OPCC) is not explored. In this paper, a quantitative meta-analysis between CRC and OPCC is conducted to explore optimized design strength, and a comparative analysis of the economic and environmental benefits of the two materials is undertaken. Considering cost price as the economic index and CO2 emissions per cubic meter of concrete as the environmental index in the materialization stage, CRC and OPCC were compared with different mix designs to achieve grades of similar strengths. Upon replacing less than 20% of natural fine aggregates in concrete with crumb rubber, while retaining the cement content, an increase of 6% in the cost price was achieved for CRC with 30–40 MPa strength grade. Apart from the aspect of mining and transportation of natural aggregates, the reduction of CO2 emissions by means of CRC adoption was verified in the treatment process of waste tire incineration. The results show that CO2 emissions from CRC decreased by 15–17% when compared with OPCC for 30~40 MPa grade concrete. The research conclusion can serve as a theoretical basis for the engineering application of CRC with the same strength, and make certain contributions to the industrial application of crumb rubber aggregates and the sustainable treatment of waste tires.
1. Introduction
With the rapid development of the automobile industry, the number of wasted tires had been soaring annually. A total of 17 million tons of global tire waste was reported in 2009 [1], and it is estimated that 13.5 million tons was produced in mainland China in 2017 [2,3]. As for trends during the same period in the EU, wastages were reported to increase by 250 million every year [4,5]. With an annual growth rate of 8–10% in 2010, it was estimated that 10 million scrapped tires would be generated globally by the automobile industry every year [6]. It is estimated that by 2030, the number of tires for motor vehicles in the world will reach 1.2 billion [7]. The consequent problem identified is the overwhelming number of used tires globally, especially in developed countries. Likewise, waste tires, called black pollutants, are conventionally disposed of in landfills, incinerated, or accumulated. Each of the traditional methods has been proved to be harmful to the environment, posing global challenges in dealing with automobile tire wastes.
Seeing an opportunity attributed to the inefficiencies and aspects of environmental pollution by conventional disposal methods, studies on the resource treatment of tire wastes can prove to be rewarding and sustainable. Although processed rubber tires from the automobile industry are currently being used in some aspects of civil engineering, such as elastic subgrade (0.24 million tons each year) [8] or rubber asphalt concrete pavement [9], the consumption is no more than 20%. On the contrary, the quantity of waste tires made into tire-derived fuel in the United States (2007) exceeded half of their annual tire yield [3]. Concrete is one of the most important building materials. Its worldwide annual usage is enormous, which requires significant amounts of natural sand and gravel, leading to ecological challenges like the exhaustion of natural aggregates. Significant opportunities can be explored by adopting crumb rubber concrete (CRC) for structures, such as elastic retaining walls, dams, conventional concrete structures, and special projects requiring high energy absorption and sound insulation [10]. This may also increase the proportion of recycled waste tires while reducing the degree of environmental pollution caused by stacking, landfill dumping, and incineration, as well as reducing the demand for natural sand and gravel. Simultaneously, the impact on the environment by natural aggregate mining and transportation shall also be significantly reduced. The industrial development and large-scale utilization of CRC have dual benefits in reducing the burden on the ecological environment and promoting the sustainable utilization of natural resources, which is in line with the requirements of sustainable development in the building materials industry.
It was noted that although the influence of rubber content on CRC’s mechanical properties has been studied extensively, very few studies have focused on the application of CRC in the engineering field. Hence, building on the available experimental data, the strength and mechanical properties of CRC and ordinary Portland cement concrete (OPCC) of similar grades need to be compared in terms of their cost price and carbon emissions. Therefore, the objective of this paper is to demonstrate that CRC possesses enough strength and provides significant economic and environmental benefits in engineering applications.
In order to materialize the findings, it is required to approach the relationship between variables through a quantitative meta-analysis method. As defined by Leviton and Cook (1981) [11], given a large repository of analytical data, meta-analysis is a statistical analysis approach to integrate the findings. The distinct individual relations between one explanatory and one response variable enhance the appropriateness of the method for the current scope of study through the shared subjectivity of reviews [12,13]. Facilitating a quantitative literature review, the approach describes the overall strength of the research findings and specifically the circumstances under which the findings are stronger or weaker. Since adequate quantifiable studies on the subject were sourced alongside the theoretical constructs of the considered variables, the meta-analysis of the findings could be ascertained. Upon appending the literature with experimental data, the properties under mechanical parameters were tabulated and compiled to categorically study the economic and environmental benefits and their relationship with the design mixes. Data analysis through such a robust quantitative method assures the credibility of the findings for a research topic with similar attributes, suggested through several studies by Leviton and Cook. Additionally, in order to explore the economic and environmental benefits, a comparative analysis between CRC and OPCC was adopted.
2. Literature Review
Many scholars have carried out much research on static mechanical properties, such as the strength and elastic modulus, of concrete with rubber as a partial substitute for natural aggregate. Several works in the literature have recorded experimental data and theoretical views on the mechanical properties of CRC, and the majority of these were published in the past decade. Haridharan et al. (2008) [14] verified that the mechanical parameters of CRC (e.g., compressive strength, tensile strength, bending performance, flexural strength, and deflection) decreased on increasing the dosage of rubber particles, substituting the coarse and fine aggregates. However, other experimental results from Isa et al. (2014) [15] illustrated that when the volumetric replacement rate of natural aggregates with rubber particles was no more than 4%, the compressive strength and flexural strength of CRC decreased only slightly when compared with ordinary concrete. Bisht and Ramana (2017) [16] considered that the strength of CRC was sufficient and could be used in non-bearing components of structures when fine aggregates were partly replaced by rubber particles in relatively lower volumes. On the contrary, Yilmaz and Degirmenci (2009) [17] presented different experimental results wherein the flexural strength of CRC was found to be higher than that of ordinary concrete when 20% of fine aggregates were replaced with crumb rubber. The results of Sof’s (2018) [18] experiment demonstrated that the compressive strength and flexural strength of CRC were reduced when the fine aggregates were replaced with rubber particles.
Through a number of experimental data, Eldin and Senouci (1993) and Li et al. (2014) [19,20] studied the effects of the volumetric replacement ratio and the size of crumb rubber on the mechanical parameters of CRC such as compressive strength and elastic modulus. Consequently, the mathematical model between the two was established. It was observed that the micro-mechanism of the mechanical properties and strength of CRC was significantly complex. Among the studies mentioned above, varying trends of dependency were observed between the volumetric replacement of crumb rubber and the strength of CRC. Moreover, it was observed that apart from the size and volumetric content of crumb rubber [21,22,23], the cement-to-water ratio [24] and the total quantity of aggregates largely influence the strength of CRC. As mentioned in the referred literature, considering that its strength grade ranges from 20 MPa to 45 MPa, CRC can meet the requirements of engineering design by achieving identical strengths as those of OPCC.
Unfortunately, considering the strength reduction in concrete upon incorporating rubber particles, CRC is only applicable for non-load bearing structural components, which was undoubtedly seen as an obstacle to increasing the usage of rubber particles in the engineering field. In the literature review above, it can be seen that by changing the water–cement ratio and adjusting the amount of cement or aggregate, crumb rubber concrete with a similar strength to OPCC can be obtained, and the difference of other mechanical characteristic parameters between the two types of concrete with similar strength is relatively small. Therefore, the concept of rubber concrete with the same strength can be proposed, which also provides a new idea and theoretical basis for the engineering utilization of rubber concrete. There are almost no published studies on the lateral comparison of mechanical performance parameters between OPCC and CRC within the same strength range, and, similarly, there are insufficient studies on the economic and environmental benefits of CRC in industrial applications. Cao et al. (2017) [25] and Hallmark-Haack et al. (2019) [26] applied crumb rubber from waste car tires in asphalt concrete pavements. The actual cost and the value addition of rubber-modified asphalt were calculated, and the life cycle cost of rubber-modified asphalt pavement materials was compared with common pavement materials. Reflecting on the results, it can be concluded that although the direct cost of rubber-modified asphalt pavements was found to be marginally higher, the inclusion of rubber particles delivered environmental, economic, and social benefits when the whole life cycle of the pavements was assessed. Similarly, Wijayasundara et al. (2015) [27] calculated the cost and environmental benefits of incorporating a type of industrial waste that could replace the cementitious material in concrete. Jayasekaran and Najafi (2017) [28] analyzed the environmental impact of reusing waste concrete as aggregate. Mannan and Ganapathy (2004) [29] used oil palm shell (OPS), which is agricultural waste, as coarse aggregate and discussed the applicability of OPS concrete in concrete floor slabs and its associated benefits in solving environmental problems. The application of solid waste materials in concrete and the economic and environmental benefits it brings have attracted the attention of many scholars. This article also looks forward to completing some basic research work in this area.
Based on the literature review, the authors note that rubber particles are an environmentally friendly alternative aggregate, and the engineering application of this material requires two prerequisites. Firstly, rubber concrete has the same strength as ordinary concrete and can be designed using similar design methods for structural components. Secondly, rubber concrete has certain advantages in economic and environmental sustainability. These are the two objectives of this study, and the relevant research work will be presented in Section 3 and Section 4.
3. The Concept and Comparison of Similar Strength Concrete
A.S.M (2017) [30] developed a number of similar-strength CRC mixes using different mix proportions and crumbed rubber content, aiming to demonstrate that concrete with similar strength exhibits similar mechanical properties regardless of rubber content, and that the existing standard guidelines for ordinary concrete can be used to predict its behavior. Mechanical properties such as compressive and tensile strength and their variation with time, the elastic modulus, and the stress–strain relationships of the developed mixes were experimentally measured and compared. The measured stress–strain behaviors were also compared with the constitutive models for ordinary concrete. The research results indicate that the effect of rubber content to the strength gain rate was not clearly evident. To further confirm that CRC with the same strength exhibits the same mechanical properties as OPCC, this article identifies 28 different mixes with a strength of around 30 MP and 16 different mixes with a strength of around 40 MP from the literature review for comparative analysis. The exploration process of the theoretical basis for similar mechanical properties between OPCC and CRC with the same strength was as follows.
3.1. Mix Proportions of CRC with Similar Strength
The authors noticed that the 28d compressive strength of CRC was about 20–45 MPa, as noted in several of the studies mentioned above. Making the mix proportions with a 28d compressive strength of 35~45 MPa falls under Group 40, which is illustrated in Table 1. This group had 16 mix proportions named 40R1~40R16. Considering the mix proportions, the W/C ratio was 0.31~0.50, the content of cement was 315~500 kg/m3, and the replacement coarse/fine aggregates with crumb rubber were 2~21.11%. Consequently, the mix proportions of OPCC with 28d compressive strength, used as the control mix, named 40C, had 0% replacement with crumb rubber (see Table 1).

Table 1.
Group 40 concrete mix proportions.
The mix proportions with a 28d compressive strength of 29~35 MPa fall under the category of Group 30 (see Table 2), which had 28 mix proportions named 30R1~30R28. The OPCC mix proportions were used as the control mix, named 30C, which had 0% replacement with crumb rubber. In this group, the W/C ratio varied from 0.31 to 0.56, the cement content varied from 300 kg/m3 to 500 kg/m3, and the crumb rubber replacement ratio ranged between 0.5% and 20%.
Table 2.
Group 30 concrete mix proportions.
3.2. Mechanical Character of CRC with Similar Strength
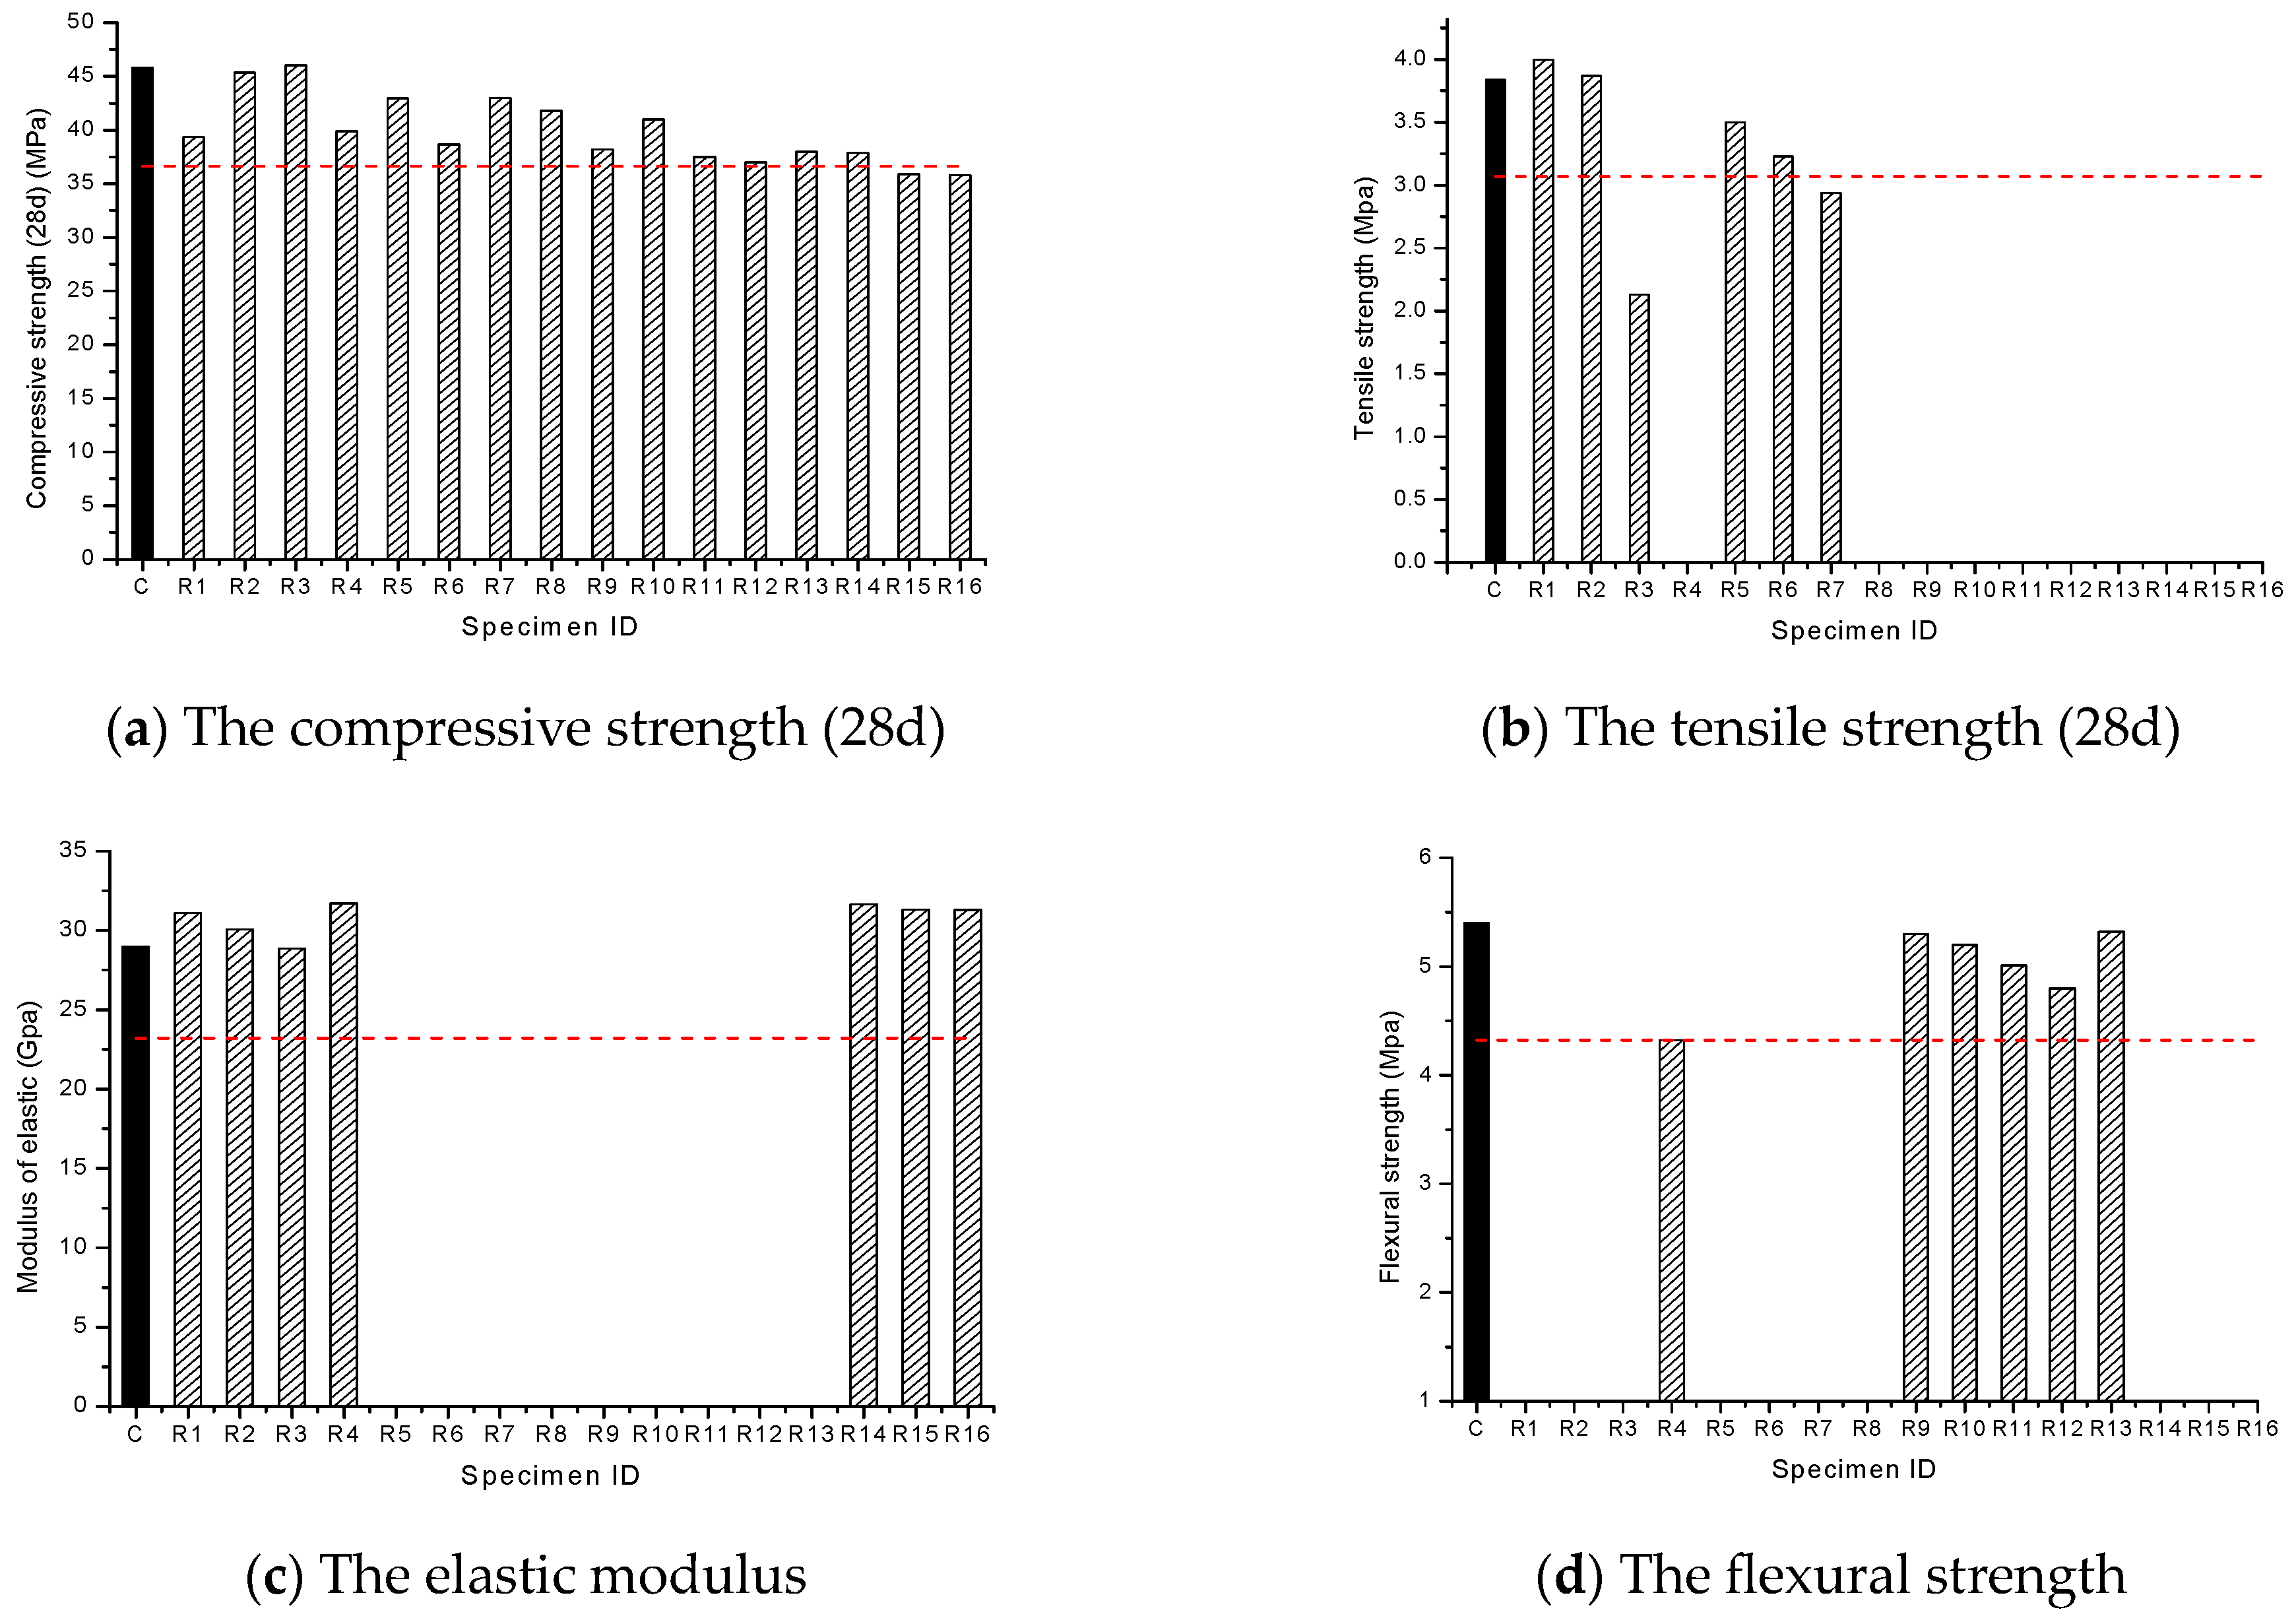
In Group 40, the mechanical strength of each mix-proportion mixture is shown in Table 3. Due to the different experimental content of mechanical parameters in each study, some CRC specimens may lack the tensile strength or elastic modulus or bending modulus. The missing mechanical parameters are represented by “--” in Table 1. The error rate of average values between CRC and OPCC with the same grade at compressive strength (28d), tensile strength (28d), elastic modulus, and flexural modulus is −12.12%, 10.46%, 5.64%, and 4.98%, respectively. Although the compressive strength of CRC decreases with the addition of rubber particles, it performs well in tensile and flexural properties, and the error rate of elastic modulus compared to OPCC is within the allowable range. Among the 16 randomly selected rubber concrete mixtures in Group 40, the standard deviation of the four mechanical performance parameters met the specification that and the deviation coefficient met the specification that . From a statistical perspective, it can be concluded that the mechanical properties of CRC with the same strength are consistent.
Table 3.
Comparison of mechanical parameters in Group 40 (28d).
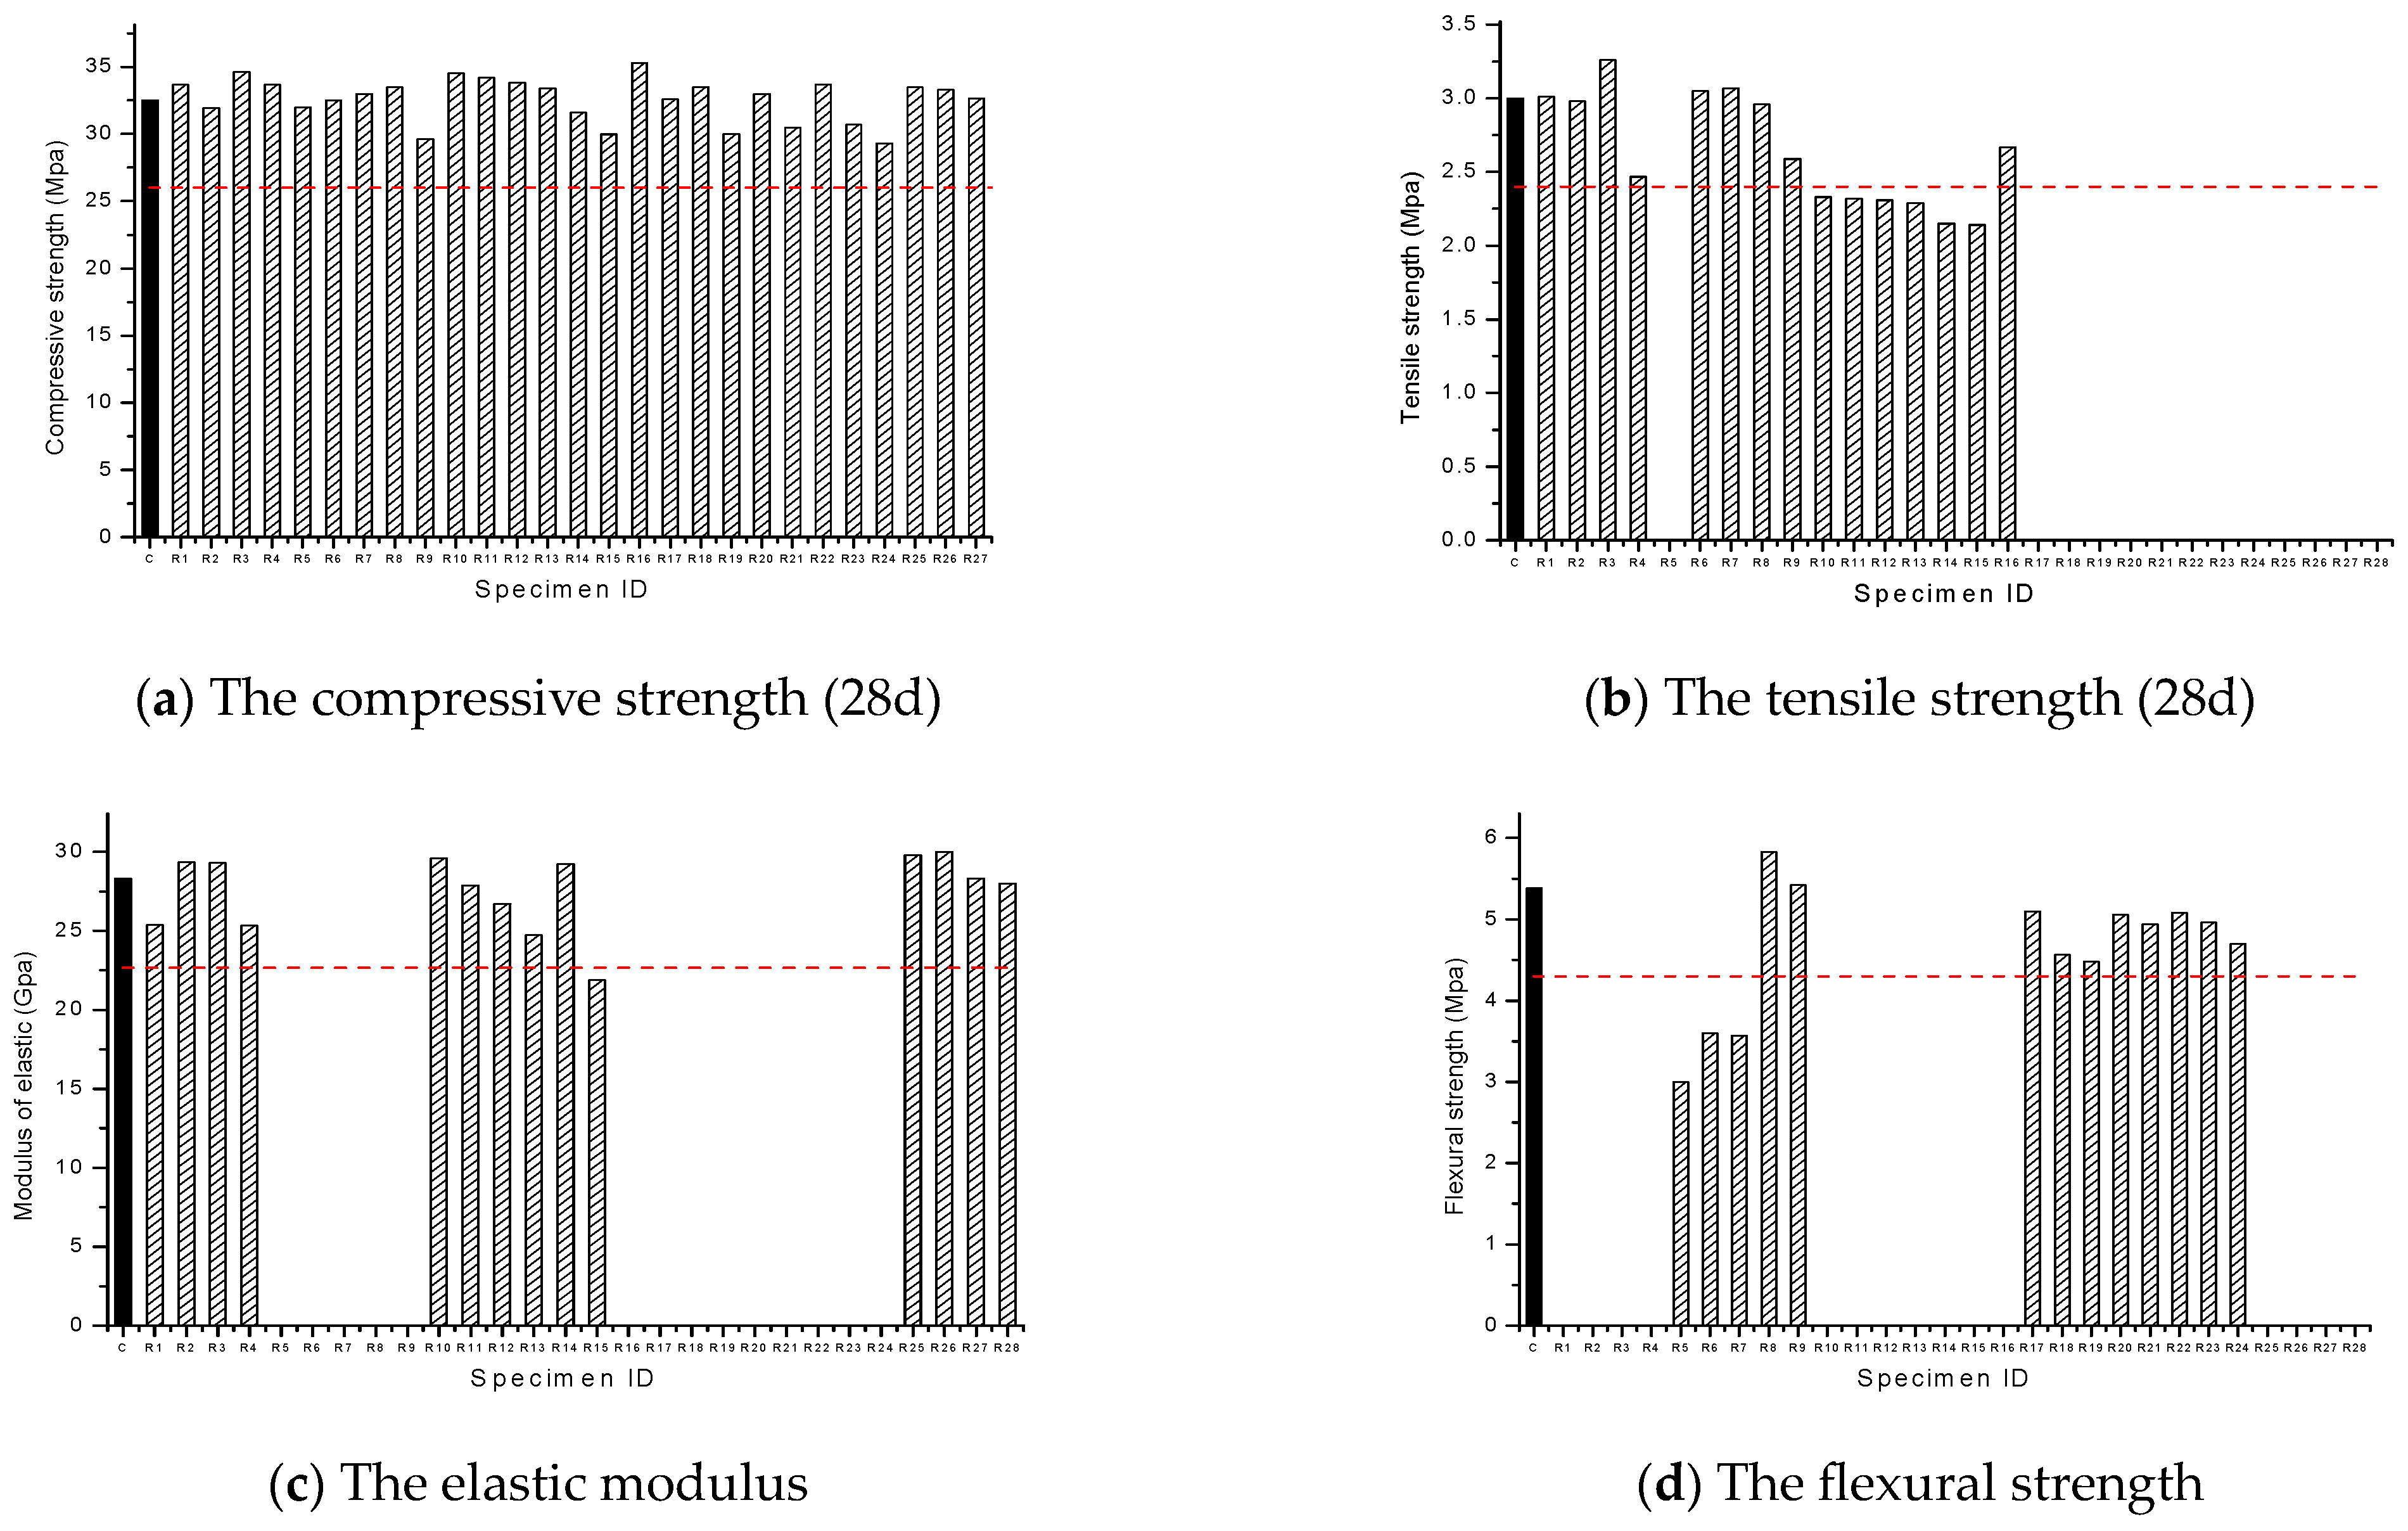
In Group 30, the mechanical strength of each mix-proportion mixture is shown in Table 4. The error rate of average values between CRC and OPCC with the same grade at compressive strength (28d), tensile strength (28d), elastic modulus, and flexural modulus is 0.12%, −11.6%, −2.71%, and −13.78%, respectively. The compressive strength of low-grade CRC decreases very little due to the replacement of fine aggregates with rubber particles. Although the average values of tensile strength, elastic modulus, and bending modulus decrease compared to the corresponding parameters of OPCC, the decrease is less than 20%, and so the CRC mixes in Group 30 have similar mechanical performance parameters to OPCC of the same grade. Among the 28 CRC mixtures in Group 30, the standard deviation of the four mechanical performance parameters met the specification that and the deviation coefficient met the specification that . CRC with similar strength has consistent mechanical properties.
Table 4.
Comparison of mechanical parameters in Group 30 (28d).
Figure 1 and Figure 2 show the mechanical parameters of two levels of concrete in cylindrical shapes; the mechanical parameters of the specimens not measured in the literature are not shown in the figures. The dashed bars represent the strength data of OPCC specimens multiplied by 80%. Most of the histogram falls below the dashed bars. Thereby, the mechanical parameters of CRC specimens were over 80% that of the OPCC specimens.
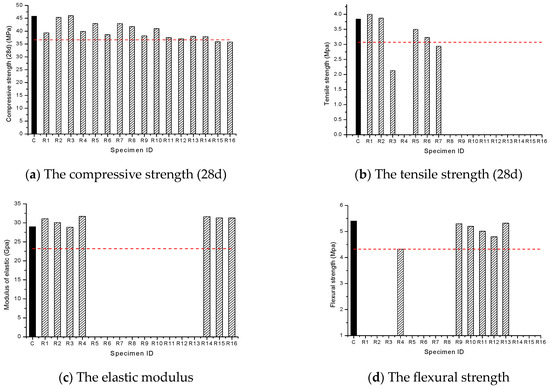
Figure 1.
Mechanical parameters compared between OPCC and CRC in Group 40. Note: 1. The red dashed line in the figure represents the strength data of OPCC specimens multiplied by 80%. 2. The black represent the strength of OPCC and the shadow represent the strength of each CRC specimen.
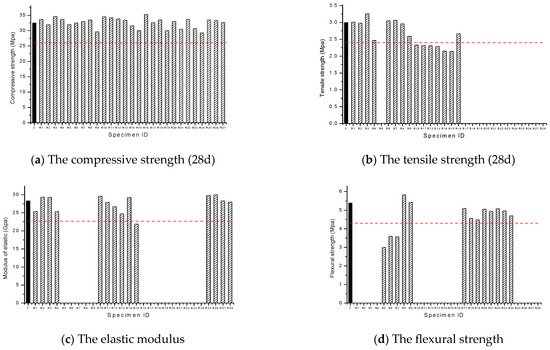
Figure 2.
Mechanical parameters compared between OPCC and CRC in Group 30. Note: 1. The red dashed line in the figure represents the strength data of OPCC specimens multiplied by 80%. 2. The black represent the strength of OPCC and the shadow represent the strength of each CRC specimen.
Through the statistical analysis of the mechanical parameters of the CRC mixes, it can be concluded that although the water–cement ratio and aggregate dosage in the mix proportion of CRC can affect its mechanical properties, the mix proportion designed according to standard specifications can meet the mechanical property requirements of the same level of OPCC, and have similar strength in compression, tension, and bending. It can be used as a substitute for OPCC of the same strength in structural components and even load-bearing components.
3.3. Comparison with Standard Code for CRC with the Same Strength
A.S.M [30] made very beneficial attempts in the study of CRC with the same strength. He measured the compressive strength, splitting tensile strength, and elastic modulus of some CRC mix proportions through experiments, calculated the theoretical splitting tensile strength based on Equations (1) and (2) recommended by fib 2010 [41] and AS3600 [42] which are used for OPCC, and compared them. At the same time, the experimentally measured CRC elastic modulus was compared with the theoretical values of the OPCC elastic modulus using different criteria. This article follows that approach and completes the same work.
where and are the mean compressive and splitting tensile strength, respectively. fib2010 recommends the value of as 1.0.
AS3600 [43] also suggests Equation (2) with .
Table 5 compares the results from the literature regarding the tensile strength of CRC with those obtained using the aforementioned codes proposed for ordinary concrete. The presented comparisons show that the strength values from the literature are less than 15% of the predicted strength values for AS3600 and fib2010, except that the values from the literature are slightly (5%) higher than the predicted values for AS3600 in Group 40.
Table 5.
Ratio between the literature and the calculated values () of the splitting tensile strength and elastic modulus of CRC using available guidelines for ordinary concrete.
The elastic modulus reported in the literature for CRC was compared with values calculated based on AS3600 and standard values in China concrete code GB50010-2010 [43]. The comparison results are also included in Table 5. The presented comparisons show that the strength values from the literature are less than 10% of the predicted strength values for AS3600 and GB50010-2010, but the results from the literature are slightly (1%) higher than the predicted values for AS3600 in Group 30. All these are well within the anticipated variations of the respective guidelines.
A.S.M [30] further compares and analyzes the stress–strain experimental curves with the constitutive model which was proposed by fib2010 for normal concrete based on its compressive strength. The results indicate that the peak strain of the CRC deviation between the experimental data is 5% to 10%, which is completely within an acceptable range. The OPCC constitutive model recommended by fib2010 can be used to analyze the strength development of CRC until failure. Li (2014) [20] considered the influence of parameters such as sand ratio reduction coefficient, rubber content, rubber particle size, and concrete strength on the constitutive model of rubber concrete through his experimental research, and rationalized the constitutive model of low-rubber-content concrete under uniaxial compression. The improved CRC constitutive model has good predictive ability and high accuracy.
The comparative analysis of the mechanical properties of CRC with the standard code further demonstrates that CRC with the same strength as OPCC has the mechanical properties specified in the standard code. It can be applied as an alternative to OPCC in engineering. CRC structural components can be designed according to current design specifications or slightly modified relevant parameters.
4. Analysis of Economic Benefit
4.1. Direct Cost Calculation and Comparison of Two Types of Concrete
The raw material acquisition and processing technology were similar between CRC and OPCC. In this section, the direct cost of two types of concrete is considered as an evaluation index of economic benefit. The calculation only involved the purchase price and quantities of all components; the processing and transportation costs were included in the purchase price.
In this section, the direct costs of Group 40 and Group 30 specimens, which are shown in Section 3.1 and which have different mixing proportions and identical strength, are calculated. The purchase price of the raw materials was collected from the Cordell Estimator Platinum EDU estimating tool [44]. This estimating tool uses data from multiple databases of various suppliers. Based on this tool, the cost of raw materials was inquired: cement: 0.363 AUD/kg; water: 0.0026 AUD/kg; coarse aggregate (crushed gravel): 0.06 AUD/kg; fine aggregate (nature river sand): 0.04 AUD/kg; crumb rubber (used waste car tires): 0.068 AUD/kg; and admixture: 1 AUD/kg. The total cost/m3 of concrete and its components was calculated and the cost price of CRC was compared with OPCC in the same group, as shown in Table 6 and Table 7.
Table 6.
The cost/m3 of concrete and main components in Group 40 (AUD).
Table 7.
The cost/m3 of concrete and main components in Group 30 (AUD).
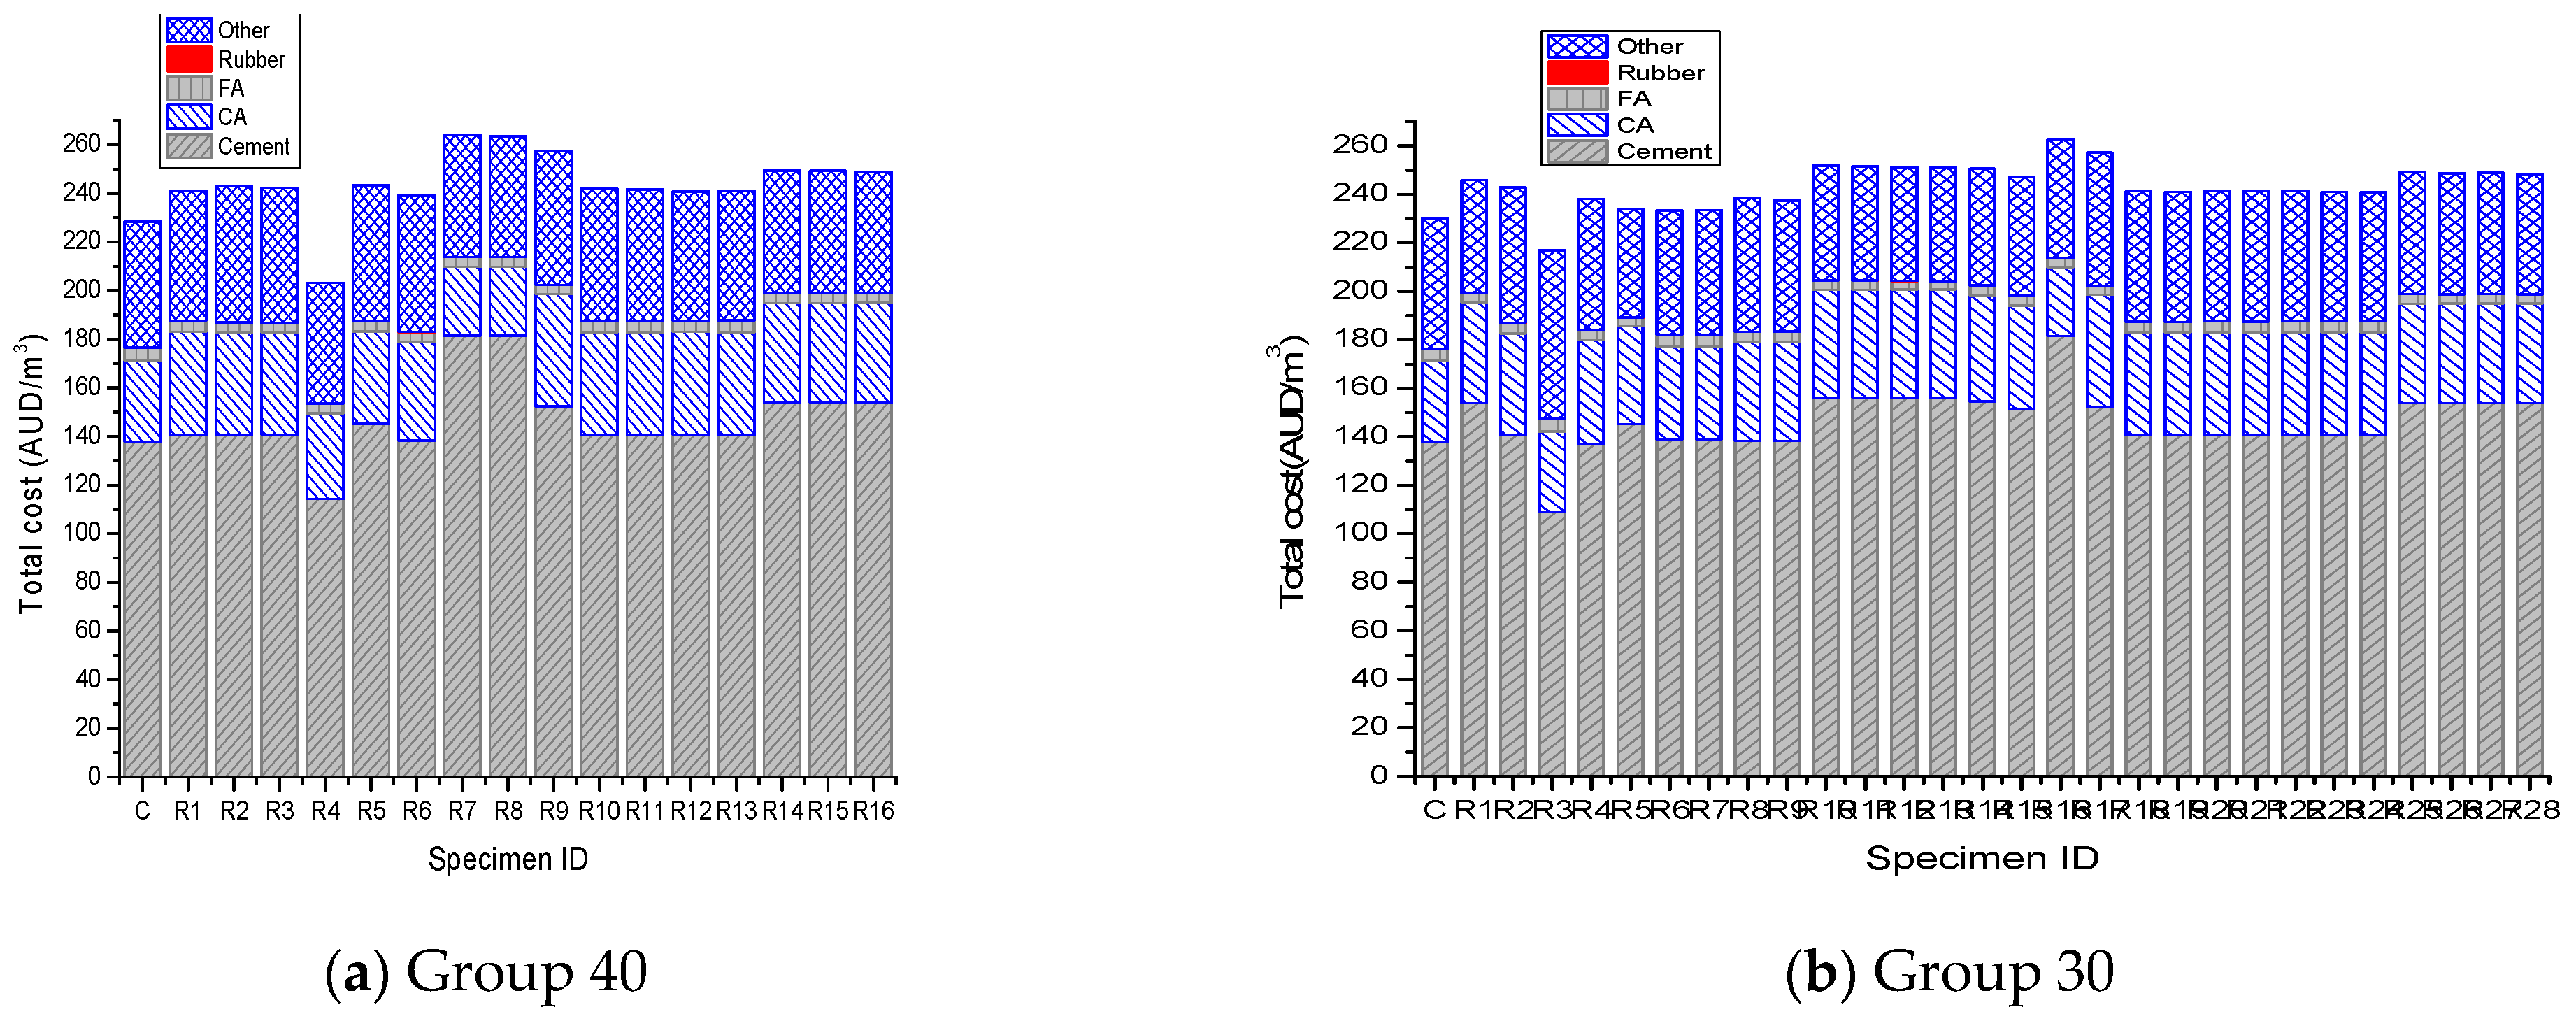
Figure 3 shows the cost/m3 of concrete with different mixing proportions incorporating crumb rubber in Group 40 and Group 30, with their price components. Although the purchase price of crumb rubber was slightly higher than that of fine aggregates, the average price of each group of CRC does not exceed 10% of the price of OPCC. The price composition in Figure 3 shows that the large amount of cement was the main reason for the higher unit price of CRC. When the cement content in the mixture is small, the price of CRC is lower than that of OPCC, e.g., in 40R4 and 30R3. It can be explicitly concluded that the reasonable selection of cement content is the main factor determining the price of concrete in mix design. On the other hand, when the content of crushed rubber replacing natural fine aggregates in concrete is less than 20%, the high price of crushed rubber has a relatively small impact on the overall cost increase of CRC, and CRC does not show a significant disadvantage in terms of cost.
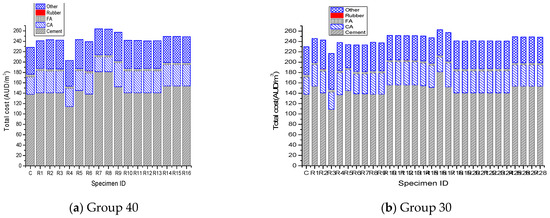
Figure 3.
Cost/m3 and price component.
4.2. Further Cost Analysis
The comparison of the cost/m3 between CRC and OPCC with the same strength is presented in Figure 4. The price/m3 of most CRC mix design specimens were found to be higher than that of OPCC while being slightly lower in only certain cases (40R4 and 30R3). In the G40 group, there were only three cases where the cost exceeded 10% of the OPCC price/m3 (40R7, 40R8, and 40R9), and only two cases in Group 30 (30R16 and 30R17). The average price of CRC in Group 30 was AUD 243.80/m3 (red dashed line), which was 6.08% higher than that of OPCC 30C. The average price of CRC in Group 40 was AUD 244.37/m3 (red dashed line), which was 6.99% higher than that of OPCC 40C. The comparison of the economic cost of OPCC and CRC in the two groups shows that regardless of the mix proportions of CRC and the content of crumb rubber procured from waste car tires, the increase in economic benefits of CRC compared to OPCC is within 10%.
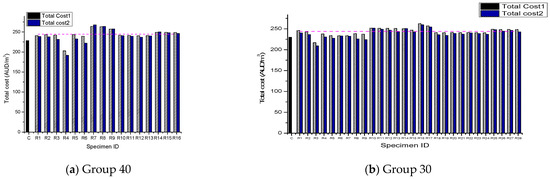
Figure 4.
Comparing the total cost/m3 of each mixing proportions. Note: 1. The pink dashed line in the figure represents the total cost average value of CRC specimens. 2. The black represent the total cost-1 of OPCC specimen, the shadow represent the total cost-1 of each CRC specimen, and the blue represent the total cost-2 of each CRC specimen which considering carbon trading profits.
4.3. Analysis of Environmental Benefit
The concrete industry was found to be the largest carbon emission industry in the world [45], and one of the largest contributors to global environmental pollution. The production of cement releases large numbers of greenhouse gases into the air. The exploitation and transportation of natural aggregates for concrete also inevitably release a certain amount of greenhouse gases. The usage of crumb rubber procured from waste automobile tires instead of natural aggregates in concrete would reduce carbon emissions caused by mining processes and the transportation of natural aggregates while reducing emissions associated with automobile tire disposal. The amount of CO2 emissions per cubic meter of different concrete specimens is calculated in this section and the environmental benefits of CRC are illustrated [46].
Calculation of CO2 Emissions
The carbon emission calculation boundary of building materials generally refers to the greenhouse gas emission calculation range related to the production, transportation, construction, operation, and demolition of materials [47]. Due to the fact that the engineering use of CRC is still in the research stage and there is a lack of greenhouse gas emission calculation standards for several stages after construction, this article only considers the calculation of the total CO2 emissions during the materialization stage of CRC, the processing and transportation of various raw materials, and uses these data as one of the evaluation indices of quantifying environmental benefits [48]. Table 7 shows the CO2 emissions of different components in concrete mixtures, which include the quantity of emissions from the entire process of raw material processing and transportation. The index of different mix proportions in Group 40 and Group 30 was calculated based on the data in Table 8. In this Table, the crumb rubber material not only includes the CO2 emissions generated by the energy consumption of crushing machinery during processing, but also includes the emissions generated by the most common treatment form of waste rubber tires, i.e., incineration, which are calculated as CO2 emission reductions.
Table 8.
CO2 emission quantity of concrete mixtures (kg/kg).
Table 9 and Table 10 shows the quantity of CO2 emissions of CRC/OPCC per m3 corresponding to each mix proportion of Group 40 and Group 30. The results include the positive aspects of CO2 emissions of crumb rubber particle processing and the negative facets of waste tire combustion.
Table 9.
CO2 emission quantity of specimens in Group 40.
Table 10.
CO2 emission quantity of specimens in Group 30.
The average value of the CO2 emissions of CRC was noted to be 331 kg/m3, which was 15.16% lower than that of OPCC (390.16 kg/m3) in Group 40. In Group 30, the average value of the CO2 emissions of CRC was noted to be 321.54 kg/m3, which was 17.55% lower than that of the OPCC specimens.
As can be seen in Figure 5, just because the main CO2 source of concrete materials comes from cement, which is a high-emission material, in the mix proportions of CRC, the higher cement usage of 40R7~40R9, 40R14, and 30R14 mixes results in higher CO2 emissions than the reference mix (40C or 30C). In the histogram, the columns corresponding to these mix proportions are slightly higher than those corresponding to OPCC. Considering the carbon reduction effect of treating waste tires as green building materials instead of directly burning them to produce a large amount of CO2, in other mixtures, replacing natural fine aggregates with crumb rubber can significantly reduce the CO2 emissions of CRC. The CO2 emissions in some mixtures, such as 40R3–40R5, 30R3, 30R4, 30R13, are reduced by 30% compared to the reference mix, and some even decrease by more than 50%, such as 40R6, 30R8, and 30R9. Therefore, it can be said that CRC with similar strength to OPCC greatly reduces CO2 emissions, and the engineering application of CRC has significant environmental benefits.
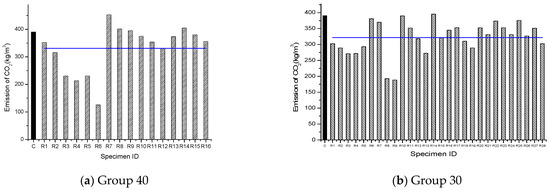
Figure 5.
Comparing the total CO2 emissions of each set of mixing proportions. Note: 1. The bule line in the figure represents the CO2 emission average value of CRC specimens. 2. The black represent the OPCC and the shadow represent each CRC specimen.
Through the calculation of the cost/m3 and CO2 emissions of the two groups of concrete with the same strength mentioned above, CRC has certain advantages in cost/m3 control and carbon dioxide reduction compared to OPCC. According to the carbon pricing mechanism described in the State and Trends of Carbon Pricing report, reducing the total amount of CO2 emissions during the disposal stage of CRC raw materials will further reduce the cost of greenhouse gas emissions, and the direct cost of CRC will be further reduced. According to the 2022 carbon pricing tool released by the WBG [51], although Australia’s carbon trading price was not included in the report, the profit from carbon trading was calculated and included in the cost/m3 of CRC based on neighboring New Zealand’s carbon trading price of 53 USD/t on 1 April 2022, as a reference. As shown in Figure 4, Total Cost 1 is the cost without considering carbon trading, and Total Cost 2 is the cost after considering carbon trading profits. After considering the profit from carbon trading, the cost of CRC was further reduced. The average cost/m3 of CRC in Group 40 and Group 30 was reduced by 1.62% and 1.83%, respectively, with more significant economic benefits.
4.4. Other Environmental Benefits
The environmental benefit calculation in the previous subsection only considers CO2 emissions released during the disposal, transportation, and processing of the constituent materials. However, the environmental impact of using waste automobile tires in concrete was identified to be far beyond the emission of greenhouse gases.
Reducing the amount of natural sand used and the risk of natural disasters. The natural aggregates of concrete, namely, sand and gravel, require significantly long geological timeframes to arrive at their usable forms, which additionally happen to be non-renewable resources. The unrestrained mining of natural sand and gravel at a large scale has been historically known to cause landslides, riverbed diversion, and the destruction of the ecological environment around the location of the aggregates. Replacing natural aggregates with crumb rubber procured from waste automobile tires could reduce the quantity of natural sand and gravel used in concrete, as well as lowering the risks of river geological disasters and floods, thereby delaying the shortage of natural sand and gravel resources.
Reducing the risk of air pollution caused by burning tires. Incineration is the cheapest and earliest method of disposing waste automobile rubber tires, while also being the most ecologically harmful method of disposal. During the burning process of rubber tires, large amounts of CO2 and SO2 are released into the air, significantly increasing the concentration of pm10 in the air. Consequently, these toxic and harmful gases are known to be carcinogenic or mutagenic [52], posing a major hazard to human health and contributing to air pollution.
Improving the natural environment and reducing the land resource consumption of waste tire dumping. Except for incineration, piling and landfill dumping are alternative methods of disposing of waste automobile tires. The piling of waste tires would result in the breeding of mosquitoes while increasing the risk of fires. Since rubber is extremely difficult to degrade even after 100 years, rubber tires cause pollution to the soil and groundwater around the landfill sites. Consequently, rubber tires in the piling and landfill dumping practices occupy significant areas, thereby depleting land resources.
Due to the lack of measurable objectives and reasonable quantitative data availability, the negative environmental impacts of waste automobile tire disposal methods mentioned above, as well as the positive environmental benefits, delivered by recycling tire rubber particles which partly replace the natural aggregates in concrete, were unavailable and insufficient for quantitative assessment. This aspect was not included in the calculations of the environmental benefits of CRC in the current article. However, the contribution of the environmental benefits of adopting this recycling method cannot be ignored. Therefore, CRC has huge environmental benefits, like saving natural aggregate resources and recycling waste aggregates. It can thereby be stated that this recycling process is significantly worth promoting and applying in civil engineering.
5. Discussion and Conclusions
The research on CRC materials achieved noteworthy conclusions; however, the application of CRC to the engineering industry was noted to still be in its primary stage. The mechanical characteristics of two groups of CRC mix proportions with similar strengths but different proportions of crumb rubber were analyzed in this work. The differences in compressive strength, tensile strength, bending strength, and elastic modulus between CRC and OPCC in the same strength groups were compared. Based on the findings, cost price and CO2 emissions per cube meter as economic benefit index and environmental benefit index, respectively, were considered and the indices were calculated and compared to those of OPCC. The following remarks and observations were identified upon analysis and calculations.
Regardless of the proportion of crumb rubber and mix ratio, the deflection was within ±20% between CRC and OPCC of the same strength in compressive strength, tensile strength, flexure strength, and elastic modulus. Concrete with similar strength had similar mechanical properties. The material parameters of CRC could be predicted using the standard code, and the constitutive model of the ordinary concrete code was modified to be applicable to CRC. The strength of CRC was noted to be adequate for engineering applications and could be used in structural components. The mix design of CRC material can be proportioned according to the current code or by modifying relevant parameters.
According to calculations, the price of CRC was slightly higher compared to OPCC of the same strength, with the average prices of CRC in Group 40 and Group 30 being 6.99% and 6.08% higher than OPCC, respectively. However, the calculations in this article only consider the purchase prices of the two mixture materials, without taking into account the secondary value of waste tire reuse or the indirect costs of the excessive exploitation of natural fine aggregates, which are difficult to quantify and calculate. Therefore, the slight disadvantage of CRC in terms of economic benefits gradually disappears with the maturity of technology and attention to environmental issues.
Since the processing of crumb rubber and fine aggregates both have similar CO2 emissions, a large amount of CO2 emission in the incineration of waste tires was eliminated. The CO2 emissions of CRC specimens with different mix proportions were lower than OPCC in most cases, with most of them being negative. Compared with that of OPCC, the environment index of CRC in different groups varied between 16.16~−67.73% and 1.4~−51.66%, respectively, with the average in the different groups being 15.16% and 17.55% lower than that of OPCC. Therefore, CRC displayed better environmental benefits.
In terms of the calculated results in this work, CRC was identified to be advantageous in terms of economic and environmental benefits, even though only the two indices of direct cost and CO2 emissions were considered. The indirect cost of disposing of waste automobile tires and other impacts on the environment were not considered in the calculations. If the economic and environmental impacts could be considered and calculated quantitatively, CRC would have more significant benefits than OPCC.
At present, the processing of rubber aggregates in CRC utilizes the simplest small-scale crushing processing methods, resulting in elevated costs for rubber aggregates and consequently impacting the price of CRC. If the research results can promote the engineering application of CRC and shape the industrial processing of waste tires, this can not only reduce the price of CRC, but also provide new ideas for the treatment of solid waste, which is environmentally friendly and an important measure for sustainable development.
Because of its similar application space to OPCC, the promotion of CRC applications in engineering not only has good economic and environmental benefits but also delivers other advantages over OPCC in terms of durability, ductility, deformation, energy absorption, and sound insulation.
Author Contributions
Conceptualization, X.G. and S.A.-D.; methodology, S.A.-D.; validation, X.G.; formal analysis, G.X.; investigation, Q.Q.; resources, S.A.-D.; data curation, C.Z.; writing—original draft preparation, X.G.; writing—review and editing, X.G. and S.A.-D.; project administration, X.G.; funding acquisition, Q.Q. All authors have read and agreed to the published version of the manuscript.
Funding
This research was funded by the National Natural Science Youth Science Foundation Project, grant number 51808443, and the Natural Science Basic Research Program of Shanxi, grant number 2019JQ-480.
Institutional Review Board Statement
Not applicable.
Informed Consent Statement
Not applicable.
Data Availability Statement
The data presented in this study are available on request from the corresponding author. The data are not publicly available due to privacy policies.
Acknowledgments
The financial support received from the funding organizations is gratefully acknowledged.
Conflicts of Interest
The authors declare no conflicts of interest.
References
- [WBCSD] World Business Council for Sustainable Development. End-of-Life Tyres: A Framework for Effective Management Systems; World Business Council for Sustainable Development: Geneva, Switzerland, 2010; Available online: http://docs.wbcsd.org/2010/10/AFrameworkForEffectiveManagementSystems.pdf (accessed on 1 July 2018).
- [BDRC] Bosi Data Research Center. 2017–2022 China Waste Tire Market Analysis and Investment Prospects Research Report; Bosi Data Research Center: Beijing, China, 2017; Available online: http://www.bosidata.com/report/E647759GG4.html (accessed on 14 April 2024).
- Wang, Q.; Chen, Z.; Lin, K.; Wang, C. Estimation and Analysis of Energy Conservation and Emissions Reduction Effects of Warm-Mix Crumb Rubber-Modified Asphalts during Construction Period. Sustainability 2018, 10, 4521. [Google Scholar] [CrossRef]
- Presti, D.L. Recycled tyre rubber modified bitumens for road asphalt mixtures: A literature review. Constr. Build. Mater. 2013, 49, 863–881. [Google Scholar] [CrossRef]
- Shen, W.; Shan, L.; Zhang, T.; Ma, H.; Cai, Z.; Shi, H. Investigation on polymer–rubber aggregate modified porous concrete. Constr. Build. Mater. 2013, 38, 667–674. [Google Scholar] [CrossRef]
- Martınez, J.D.; Neus, P.; Ramon, M.; Tomas, G.; Victoria, N.M.; Mastral, A. Waste tyre pyrolysis—A review. Renew. Sustain. Energy Rev. 2013, 23, 179–213. [Google Scholar] [CrossRef]
- Pacheco-Torgal, F.; Ding, Y.; Jalali, S. Properties and durability of concrete containing polymeric wastes (tyre rubber and polyethylene terephthalate bottles): An overview. Constr. Build. Mater. 2012, 30, 714–724. [Google Scholar] [CrossRef]
- [ETRMA] European Tyre and Rubber Manufacturers Association. End of Life Tyres: A Valuable Resource with Growing Potential; European Tyre and Rubber Manufacturers Association: Brussels, Belgium, 2011. [Google Scholar]
- Widyatmoko, I.; Elliot, R. A Review of the Use of Crumb Rubber Modified Asphalt Worldwide; Waste & Resources Action Programme (WRAP): Banbury, UK, 2007. [Google Scholar]
- Batayneh, M.K.; Marie, I.; Asi, I. Promoting the use of crumb rubber concrete in developing countries. Waste Manag. 2008, 28, 2171–2176. [Google Scholar] [CrossRef]
- Leviton, L.C.; Cook, T.D. What differentiates meta-analysis from other forms of review 1. J. Personal. 1981, 49, 231–235. [Google Scholar] [CrossRef]
- Lipsey, M.W.; Wilson, D.B. Practical Meta-Analysis; SAGE publications, Inc.: Thousand Oaks, CA, USA, 2001. [Google Scholar]
- Borenstein, M.; Hedges, L.V.; Higgins, J.P.; Rothstein, H.R. Introduction to Meta-Analysis; John Wiley & Sons: Hoboken, NJ, USA, 2021. [Google Scholar]
- Haridharan, M.K.; Murugan, R.B.; Natarajan, C.; Muthukannan, M. Influence of Waste Tyre Crumb Rubber on Compressive Strength. Static Modulus of Elasticity and Flexural Strength of Concrete. In IOP Conference Series: Earth and Environmental Science; IOP Publishing: Bristol, UK, 2017; Volume 80, p. 012014. [Google Scholar]
- Isa, N.F.; Zaki, M.F.; Sofri, L.; Rahim, M.; Ghazaly, Z.; Bidin, N. The use of rubber manufacturing waste as concrete additive. Adv. Res. Appl. Mech. 2014, 4, 12–18. [Google Scholar]
- Bisht, K.; Ramana, P.V. Evaluation of mechanical and durability properties of crumb rubber concrete. Constr. Build. Mater. 2017, 155, 811–817. [Google Scholar] [CrossRef]
- Yilmaz, A.; Degirmenci, N. Possibility of using waste tire rubber and fly ash with Portland cement as construction materials. Waste Manag. 2009, 29, 1541–1546. [Google Scholar] [CrossRef]
- Sofi, A. Effect of waste tyre rubber on mechanical and durability properties of concrete—A review. Ain Shams Eng. J. 2018, 9, 2691–2700. [Google Scholar] [CrossRef]
- Eldin, N.N.; Senouci, A.B. Rubber-tire particles as concrete aggregate. J. Mater. Civ. Eng. 1993, 5, 478–496. [Google Scholar] [CrossRef]
- Li, L.; Ruan, S.; Zeng, L. Mechanical properties and constitutive equations of concrete containing a low volume of tire rubber particles. Constr. Build. Mater. 2014, 70, 291–308. [Google Scholar] [CrossRef]
- Boudaoud, Z.; Beddar, M. Effects of recycled tires rubber aggregates on the characteristics of cement concrete. Civ. Eng. 2012, 2, 193–197. [Google Scholar] [CrossRef]
- Ganjian, E.; Khorami, M.; Maghsoudi, A.A. Scrap-tyre-rubber replacement for aggregate and filler in concrete. Constr. Build. Mater. 2009, 23, 1828–1836. [Google Scholar] [CrossRef]
- Panda, K.C.; Parhi, P.S.; Jena, T. Scrap-Tyre-Rubber replacement for aggregate in cement concrete: Experimental study. Int. J. Earth Sci. Eng. 2012, 5, 1692–1701. [Google Scholar]
- Elchalakani, M. High strength rubberized concrete containing silica fume for the construction of sustainable road side barriers. In Structures; Elsevier: Amsterdam, The Netherlands, 2015; Volume 1, pp. 20–38. [Google Scholar]
- Cao, R.; Leng, Z.; Hsu, M.S.C.; Yu, H.; Wang, Y. Integrated sustainability assessment of asphalt rubber pavement based on life cycle analysis. In Pavement Life-Cycle Assessment; CRC Press: Boca Raton, FL, USA, 2017; pp. 209–220. [Google Scholar]
- Hallmark-Haack, B.L.; Hernandez, N.B.; Williams, R.C.; Cochran, E.W. Ground Tire Rubber Modification for Improved Asphalt Storage Stability. Energy Fuels 2019, 33, 2659–2664. [Google Scholar] [CrossRef]
- Wijayasundara, M.; Mendis, P.; Crawford, R.H. A framework for the integrated cost-benefit analysis of the use of recycled aggregate concrete in structural applications. Living Learn. Res. A Better Built Environ. 2015, 12, 647–657. [Google Scholar]
- Jayasekaran, S.R.; Najafi, F.T. A Graduate Research on the Cost Effective Analysis and Environmental Impact of Using Industrial Byproducts as Supplementary Cementitious Materials in Building Construction. In Proceedings of the ASEE Annual Conference & Exposition, Columbus, OH, USA, 25–28 June 2017. [Google Scholar]
- Mannan, M.A.; Ganapathy, C. Concrete from an agricultural waste-oil palm shell (OPS). Build. Environ. 2004, 39, 441–448. [Google Scholar] [CrossRef]
- Mendis, A.S.; Al-Deen, S.; Ashraf, M. Behaviour of similar strength crumbed rubber concrete (CRC) mixes with different mix proportions. Constr. Build. Mater. 2017, 137, 354–366. [Google Scholar] [CrossRef]
- Thomas, B.S.; Gupta, R.C.; Panicker, V.J. Recycling of waste tire rubber as aggregate in concrete: Durability-related performance. J. Clean. Prod. 2016, 112, 504–513. [Google Scholar] [CrossRef]
- Selvakumar, S.; Venkatakrishnaiah, R. Strength properties of concrete using crumb rubber with partial replacement of fine aggregate. Int. J. Innov. Res. Sci. Eng. Technol. 2015, 4, 1171–1175. [Google Scholar]
- Ismail, M.K.; Hassan, A.A.A.; Abdelaleem, B.H. Flexural Behaviour of Reinforced SCC Beams Containing Recycled Crumb Rubber; Resilient Infrastructure: Landon, UK, 2016; p. 11. [Google Scholar]
- Liu, F.; Zheng, W.; Li, L.; Feng, W.; Ning, G. Mechanical and fatigue performance of rubber concrete. Constr. Build. Mater. 2013, 47, 711–719. [Google Scholar] [CrossRef]
- Chen, L. Study on the effect of rubber particles on self-compacting and cracking resistance of concrete. Fujian Constr. Technol. 2022, 70–73. [Google Scholar]
- Xue, G.; Sun, L.; Wan, Z. Study on Compressive Strength of Rubber Concrete Cube Based on Meso-level. Concrete 2022, 387, 84–87+96. [Google Scholar]
- Wakchaure, M.R.; Chavan, P.A. Waste tyre crumb rubber particle as a partial replacement to fine aggregate in concrete. Int. J. Eng. Res. Technol. 2014, 3, 1206–1209. [Google Scholar]
- Khaloo, A.R.; Dehestani, M.; Rahmatabadi, P. Mechanical properties of concrete containing a high volume of tire–rubber particles. Waste Manag. 2008, 28, 2472–2482. [Google Scholar] [CrossRef] [PubMed]
- Liu, H.; Wang, X.; Jiao, Y.; Sha, T. Experimental investigation of the mechanical and durability properties of crumb rubber concrete. Materials 2016, 9, 172. [Google Scholar] [CrossRef]
- Ding, Y.; He, M.; Qiu, J.; Yuan, K. Mechanical properties and constitutive model of rubber desert sand concrete. J. Shihezi Univ. (Nat. Sci.) 2023, 41, 199–206. [Google Scholar]
- International Federation for Structure Concrete. fib Model Code for Concrete Structures; International Fedaration for Structural Concrete: Lausanne, Switzerland, 2010. [Google Scholar]
- AS 360; Concrete Structures, Design Properties of Materials. SAI Global Limited under licience from Standards Australia Ltd.: Sydney, NSW, Australia, 2009.
- GB/T 50010-2010; Code for Design of Concrete Structure. Ministry of Housing and Urban Rural Development of the People’s Republic of China: Beijing, China, 2015.
- CoreLogic. Cordwell Estimator Platinum. 2021. Available online: https://www.corelogic.com.au/products/cordellplatinum (accessed on 14 April 2024).
- Mahasenan, N.; Smith, S.; Humphreys, K. The cement industry and global climate change: Current and potential future cement industry CO2 emissions. In Proceedings of the 6th International Conference on Greenhouse Gas Control Technologies, Kyoto, Japan, 1–4 October 2002; pp. 995–1000. [Google Scholar]
- [EFCAA] European Federation of Concrete Admixture Associations. Environmental Declaration Superplasticizing Admixtures; European Federation of Concrete Admixture Associations: Ulft, The Netherlands, 2002. [Google Scholar]
- GB/T 51366-2019; Standard for Building Carbon Emissions Calculation. Ministry of Housing and Urban Rural Development of the People’s Republic of China: Beijing, China, 2019.
- Cho, S.; Na, S. The Reduction of CO2 Emissions by Application of High-Strength Reinforcing Bars to Three Different Structural Systems in South Korea. Sustainability 2017, 9, 1652. [Google Scholar] [CrossRef]
- Kajaste, R.; Hurme, M. Cement industry greenhouse gas emissions–management options and abatement cost. J. Clean. Prod. 2016, 112, 4041–4052. [Google Scholar] [CrossRef]
- Turner, L.K.; Collins, F.G. Carbon dioxide equivalent (CO2-e) emissions: A comparison between geopolymer and OPCC cement concrete. Constr. Build. Mater. 2013, 43, 125–130. [Google Scholar] [CrossRef]
- [WORLD BANK ORG] State and Trends of Carbon Pricing. 2022. Available online: http://creativecommons.org/licenses/by/3.0/igo (accessed on 14 April 2024).
- Downard, J.; Singh, A.; Bullard, R.; Jayarathne, T.; Rathnayake, C.M.; Simmons, D.L.; Wels, B.R.; Spak, S.N.; Peters, T.; Beardsley, D.; et al. Uncontrolled combustion of shredded tires in a landfill—Part 1: Characterization of gaseous and particulate emissions. Atmos. Environ. 2015, 104, 195–204. [Google Scholar] [CrossRef] [PubMed]


Disclaimer/Publisher’s Note: The statements, opinions and data contained in all publications are solely those of the individual author(s) and contributor(s) and not of MDPI and/or the editor(s). MDPI and/or the editor(s) disclaim responsibility for any injury to people or property resulting from any ideas, methods, instructions or products referred to in the content. |
© 2024 by the authors. Licensee MDPI, Basel, Switzerland. This article is an open access article distributed under the terms and conditions of the Creative Commons Attribution (CC BY) license (https://creativecommons.org/licenses/by/4.0/).