Article

Analysis of the Location Factors Affecting the Price of Tourist Houses: The Role of Accessibility to Public Transport Stations in Madrid

1
Departamento de Ingeniería del Transporte, Territorio y Urbanismo ETSI Caminos, Canales y Puertos, Universidad Politécnica de Madrid, Profesor Aranguren s/n, 28040 Madrid, Spain
2
Department of Civil Engineering, University of Alicante, San Vicente del Raspeig, 03690 Alicante, Spain
*
Author to whom correspondence should be addressed.
Sustainability 2024, 16(11), 4768; https://doi.org/10.3390/su16114768
Submission received: 24 April 2024 / Revised: 25 May 2024 / Accepted: 28 May 2024 / Published: 3 June 2024
(This article belongs to the Section Tourism, Culture, and Heritage)

Abstract

:
The location of tourist properties is a fundamental aspect in the determination of price, but in cities with dense and efficient public transport systems, the location being in the periphery can offer alternative advantages to central locations (such as better accessibility by private vehicles). This study analyses how the price of tourist housing is influenced by the characteristics of the accommodation itself and its location, using a hedonic pricing regression model estimated by ordinary least squares (OLS) in two periods of time: the high season (October 2022) and the low season (February 2023). The obtained results suggest that the characteristics of the properties, the local environment and the elements in the area influence the price of tourist accommodation. Similarly, the proximity to public transport stations and stops has a relevant influence on the choice of tourist properties. This latter factor is highly important for designing public policies that favour a denser public transport network in peripheral areas of the city. This would increase the number of tourist properties in these areas further away from the centre and, therefore, the number of reservations. In turn, the income of these more vulnerable areas would improve together with the social cohesion of the municipality.

1. Introduction

The implementation of the collaborative economy [1], also called the “platform economy” [2], in the tourist sector has led to a relocation of traditional accommodation establishments (hotels and resorts), which were previously concentrated in specific areas of the city, thus facilitating the organisation of the public space and the provision of urban transport. Some aspects of this new phenomenon have already been analysed, such as the competitive advantages offered by this new type of accommodation over pre-existing hotels for certain types of tourists [3], its impact on hotel occupation [4] and sustainability [5]. In relation to the price of housing, there are still unexplored lines of research on these new tourist models that examine the nature of the relationships between the urban transit system and the price of housing.
The location of the tourist properties is a key issue in price determination, but in cities with a dense and efficient public transport system, the periphery location can offer alternative advantages over central locations (such as better accessibility by private car and larger tourist properties).
Price is one of the most influential factors in the booking process whether in the traditional accommodation sector [6] or through peer-to-peer platforms [7]. Among the different strategies developed in recent years to determine the prices of hotels is that of price fixing in accordance with costs (the price is determined by the costs of the hotel), with the competition (the price is determined by the competition, assuming that the competitors know the price and value of the competing products) and with the client (prices are determined by the perceptions of the clients of the value of the goods and services). The latter is related to hedonic pricing theory. The hedonic pricing theory postulates that “...goods are valued for their utility-bearing attributes or characteristics” [8]. Consequently, it is assumed that the price of accommodation is determined by its specific facilities and location [9] and its surroundings, including the attractions, infrastructure and competitors [10].
Although some studies have analysed the effect of the location of tourist housing and its access to public transport on prices [10,11,12,13], there is still much to research in this respect. This study uses hedonic pricing theory as a conceptual framework for determining how the price of tourist housing is influenced by the characteristics of the accommodation itself, its location and access to local public transport. The article is structured into the following sections: Section 1 contains the introduction; Section 2 gives a detailed description of Madrid as a case study; Section 3 explains the structure of the model and its application to the database and analyses the most important results that affect the process. Finally, Section 4 presents the conclusions and the future lines of research that can be drawn from this study.

2. Materials and Methods

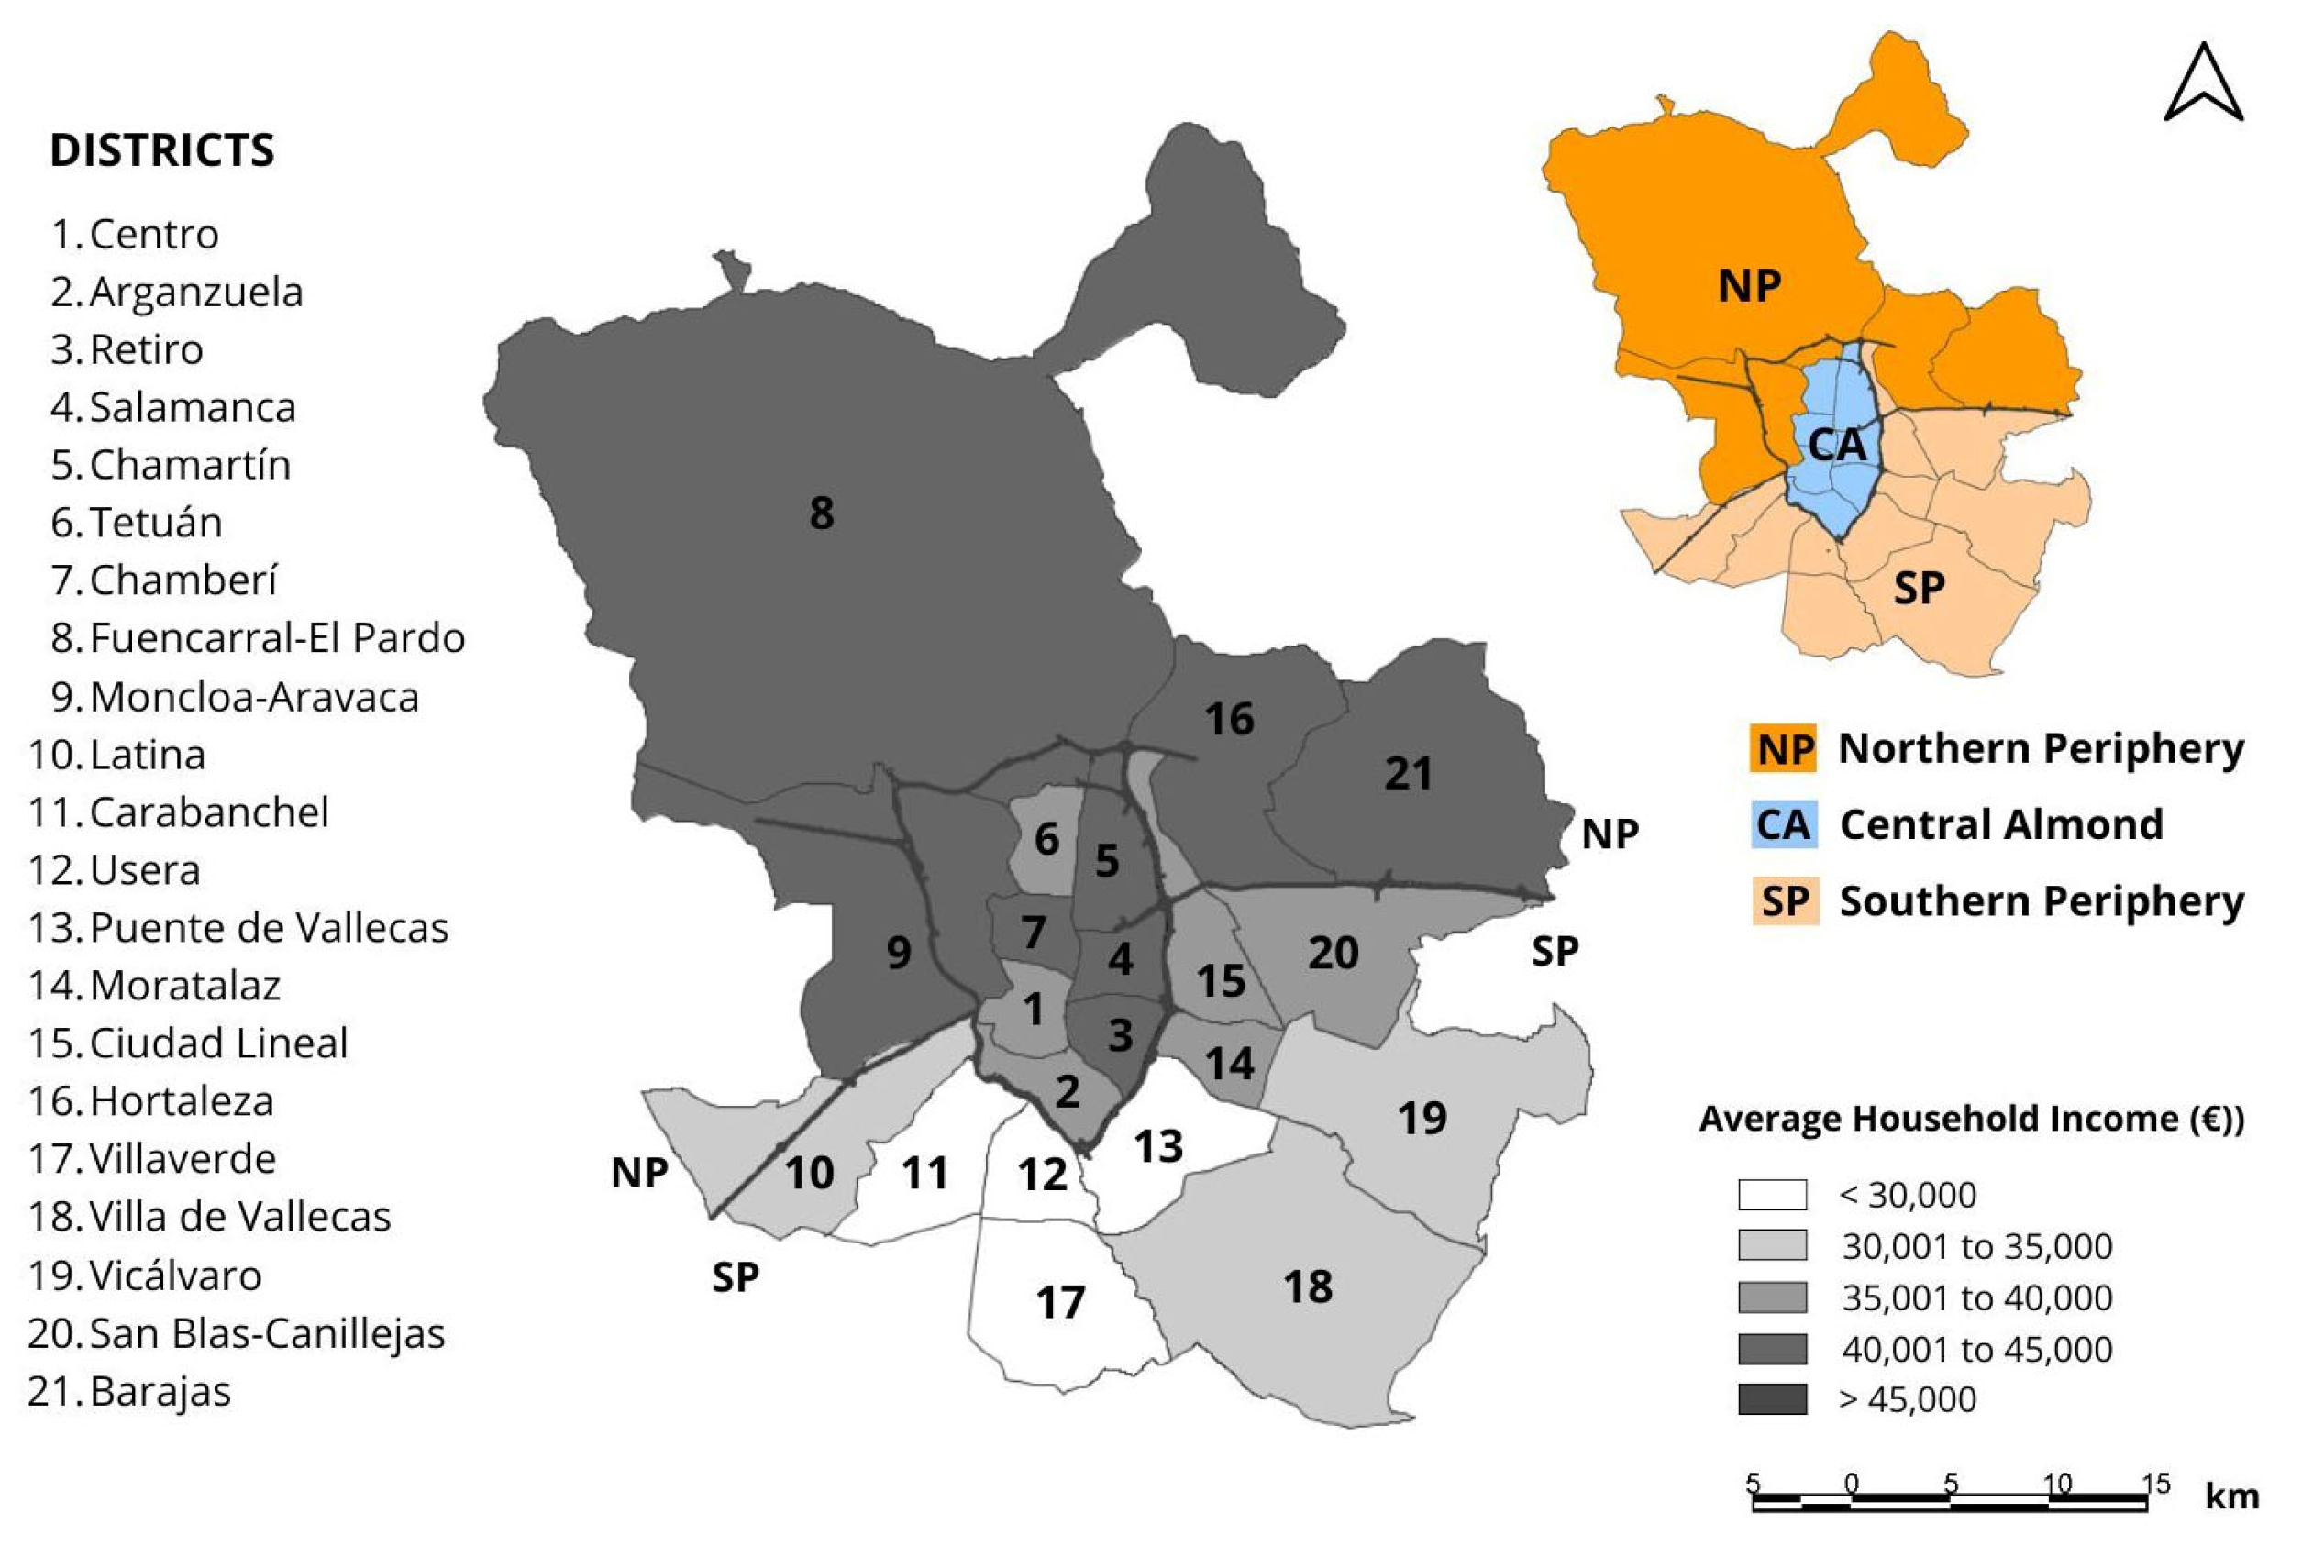
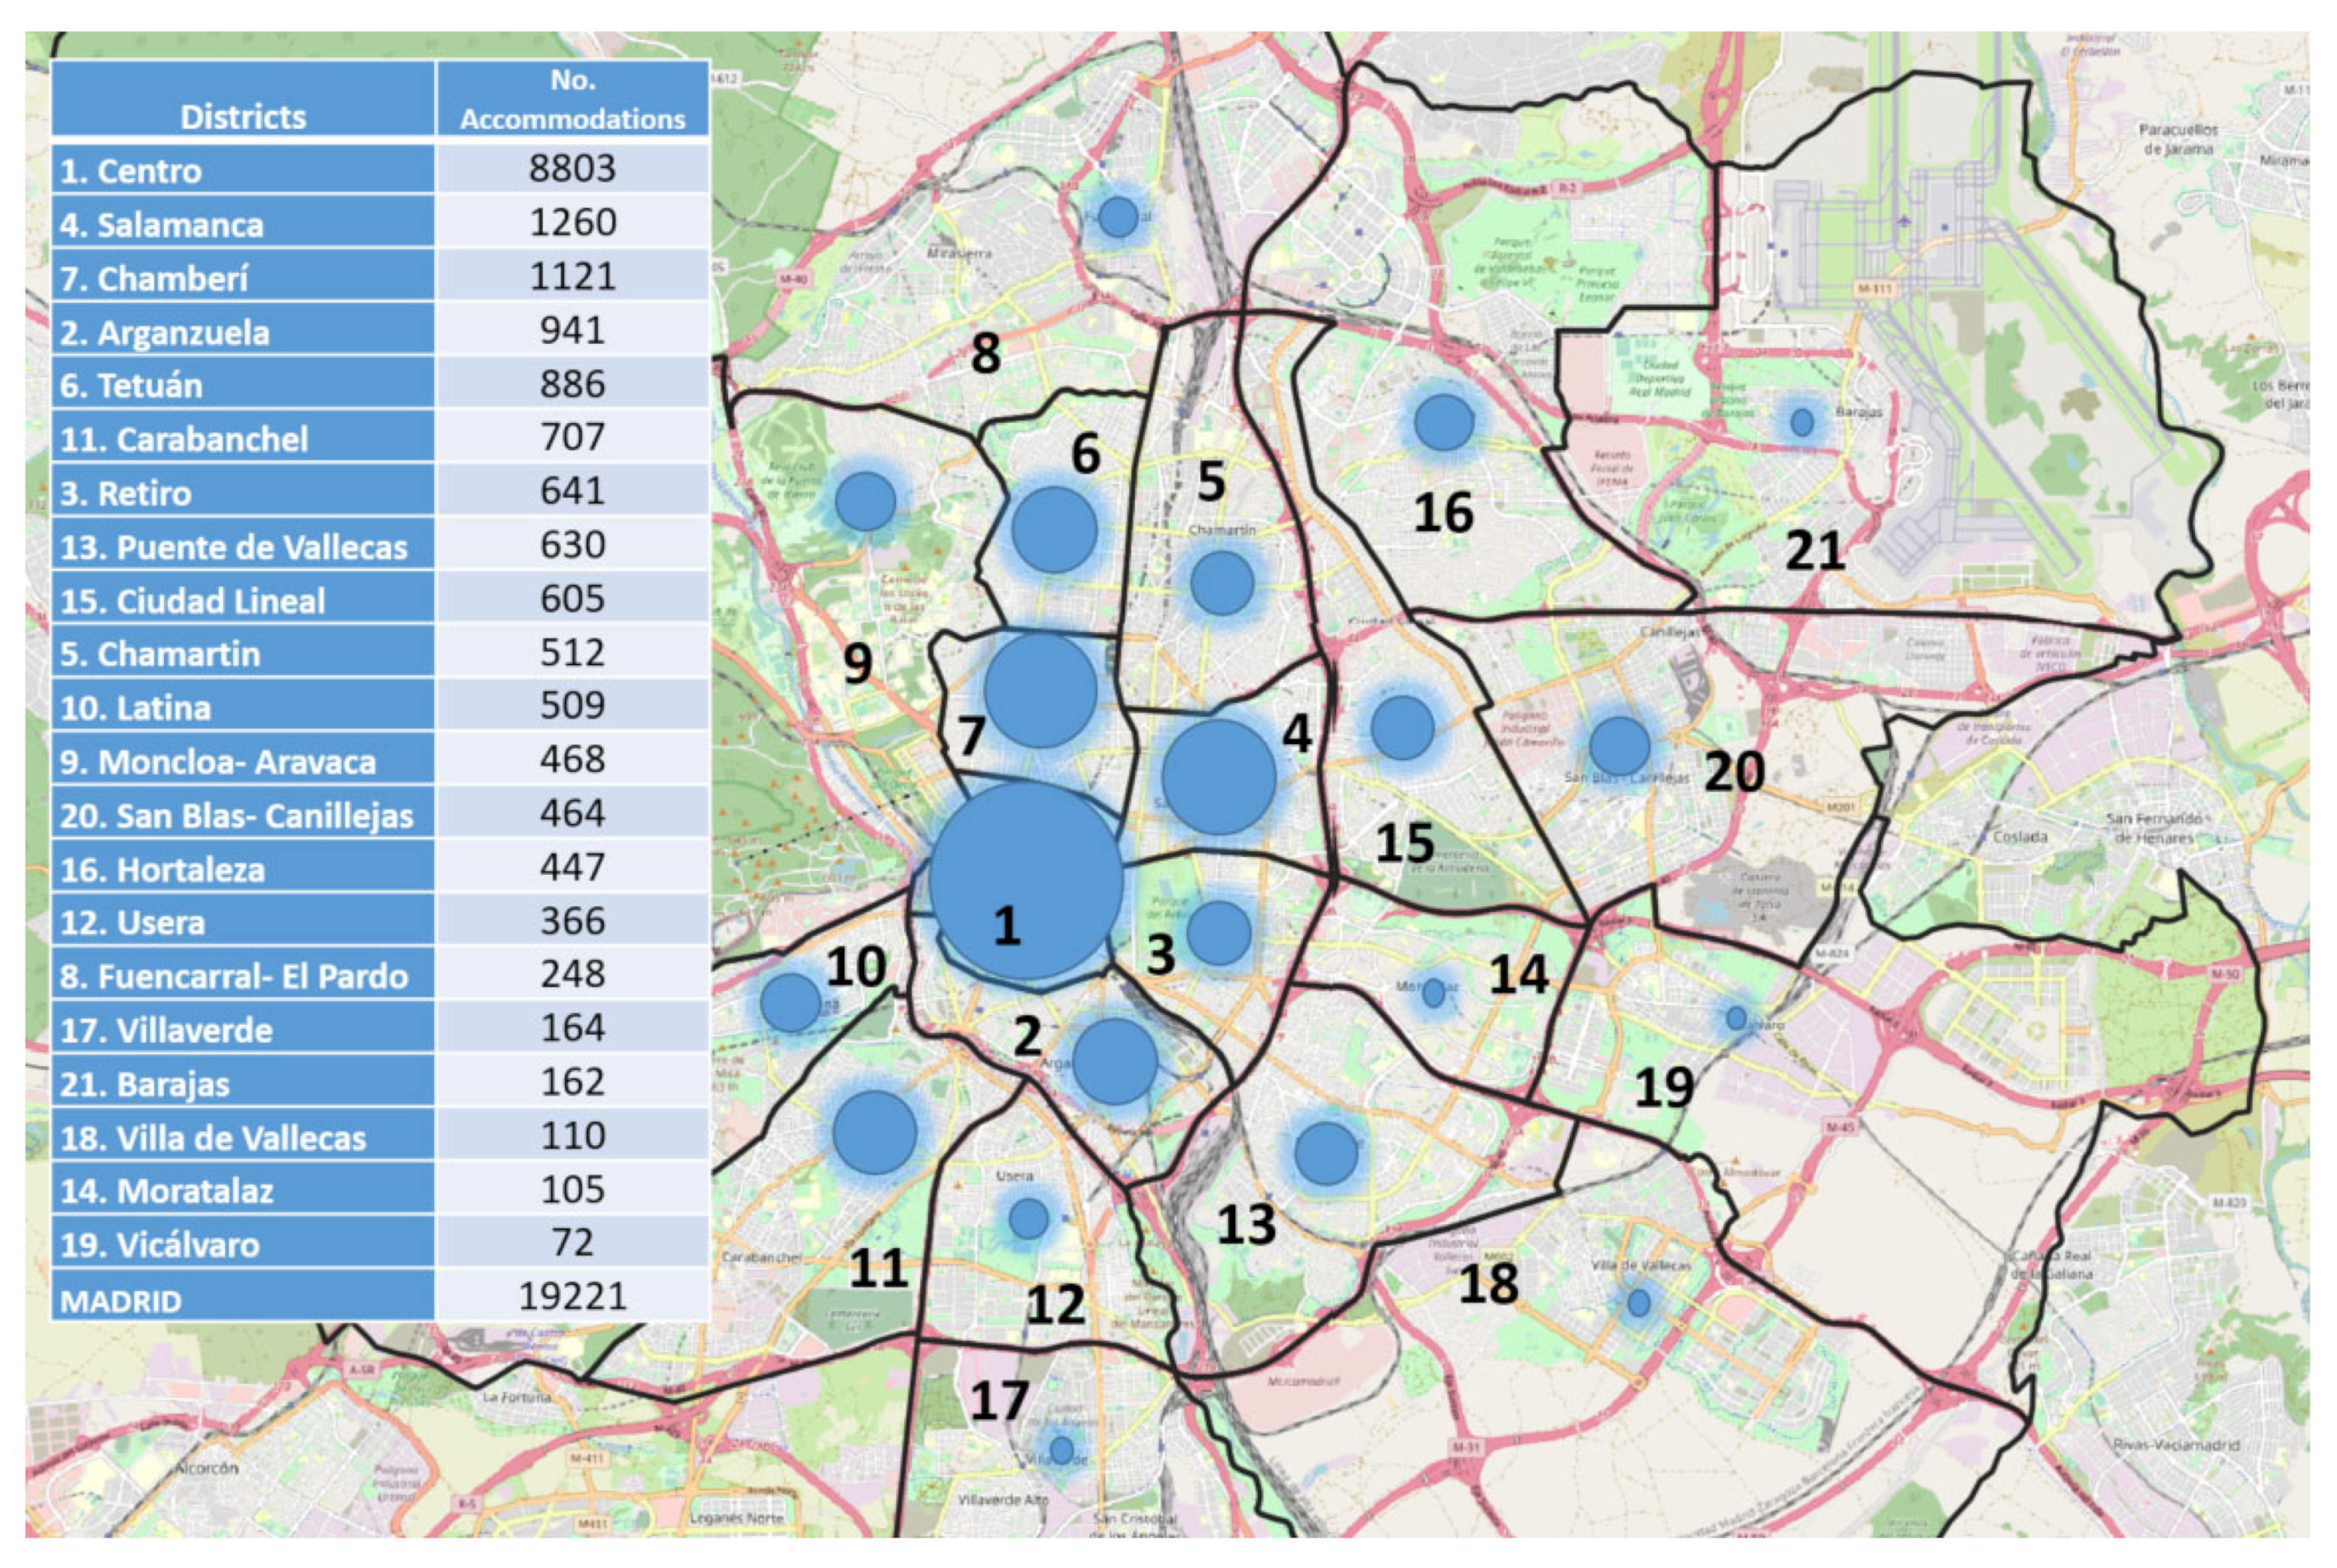
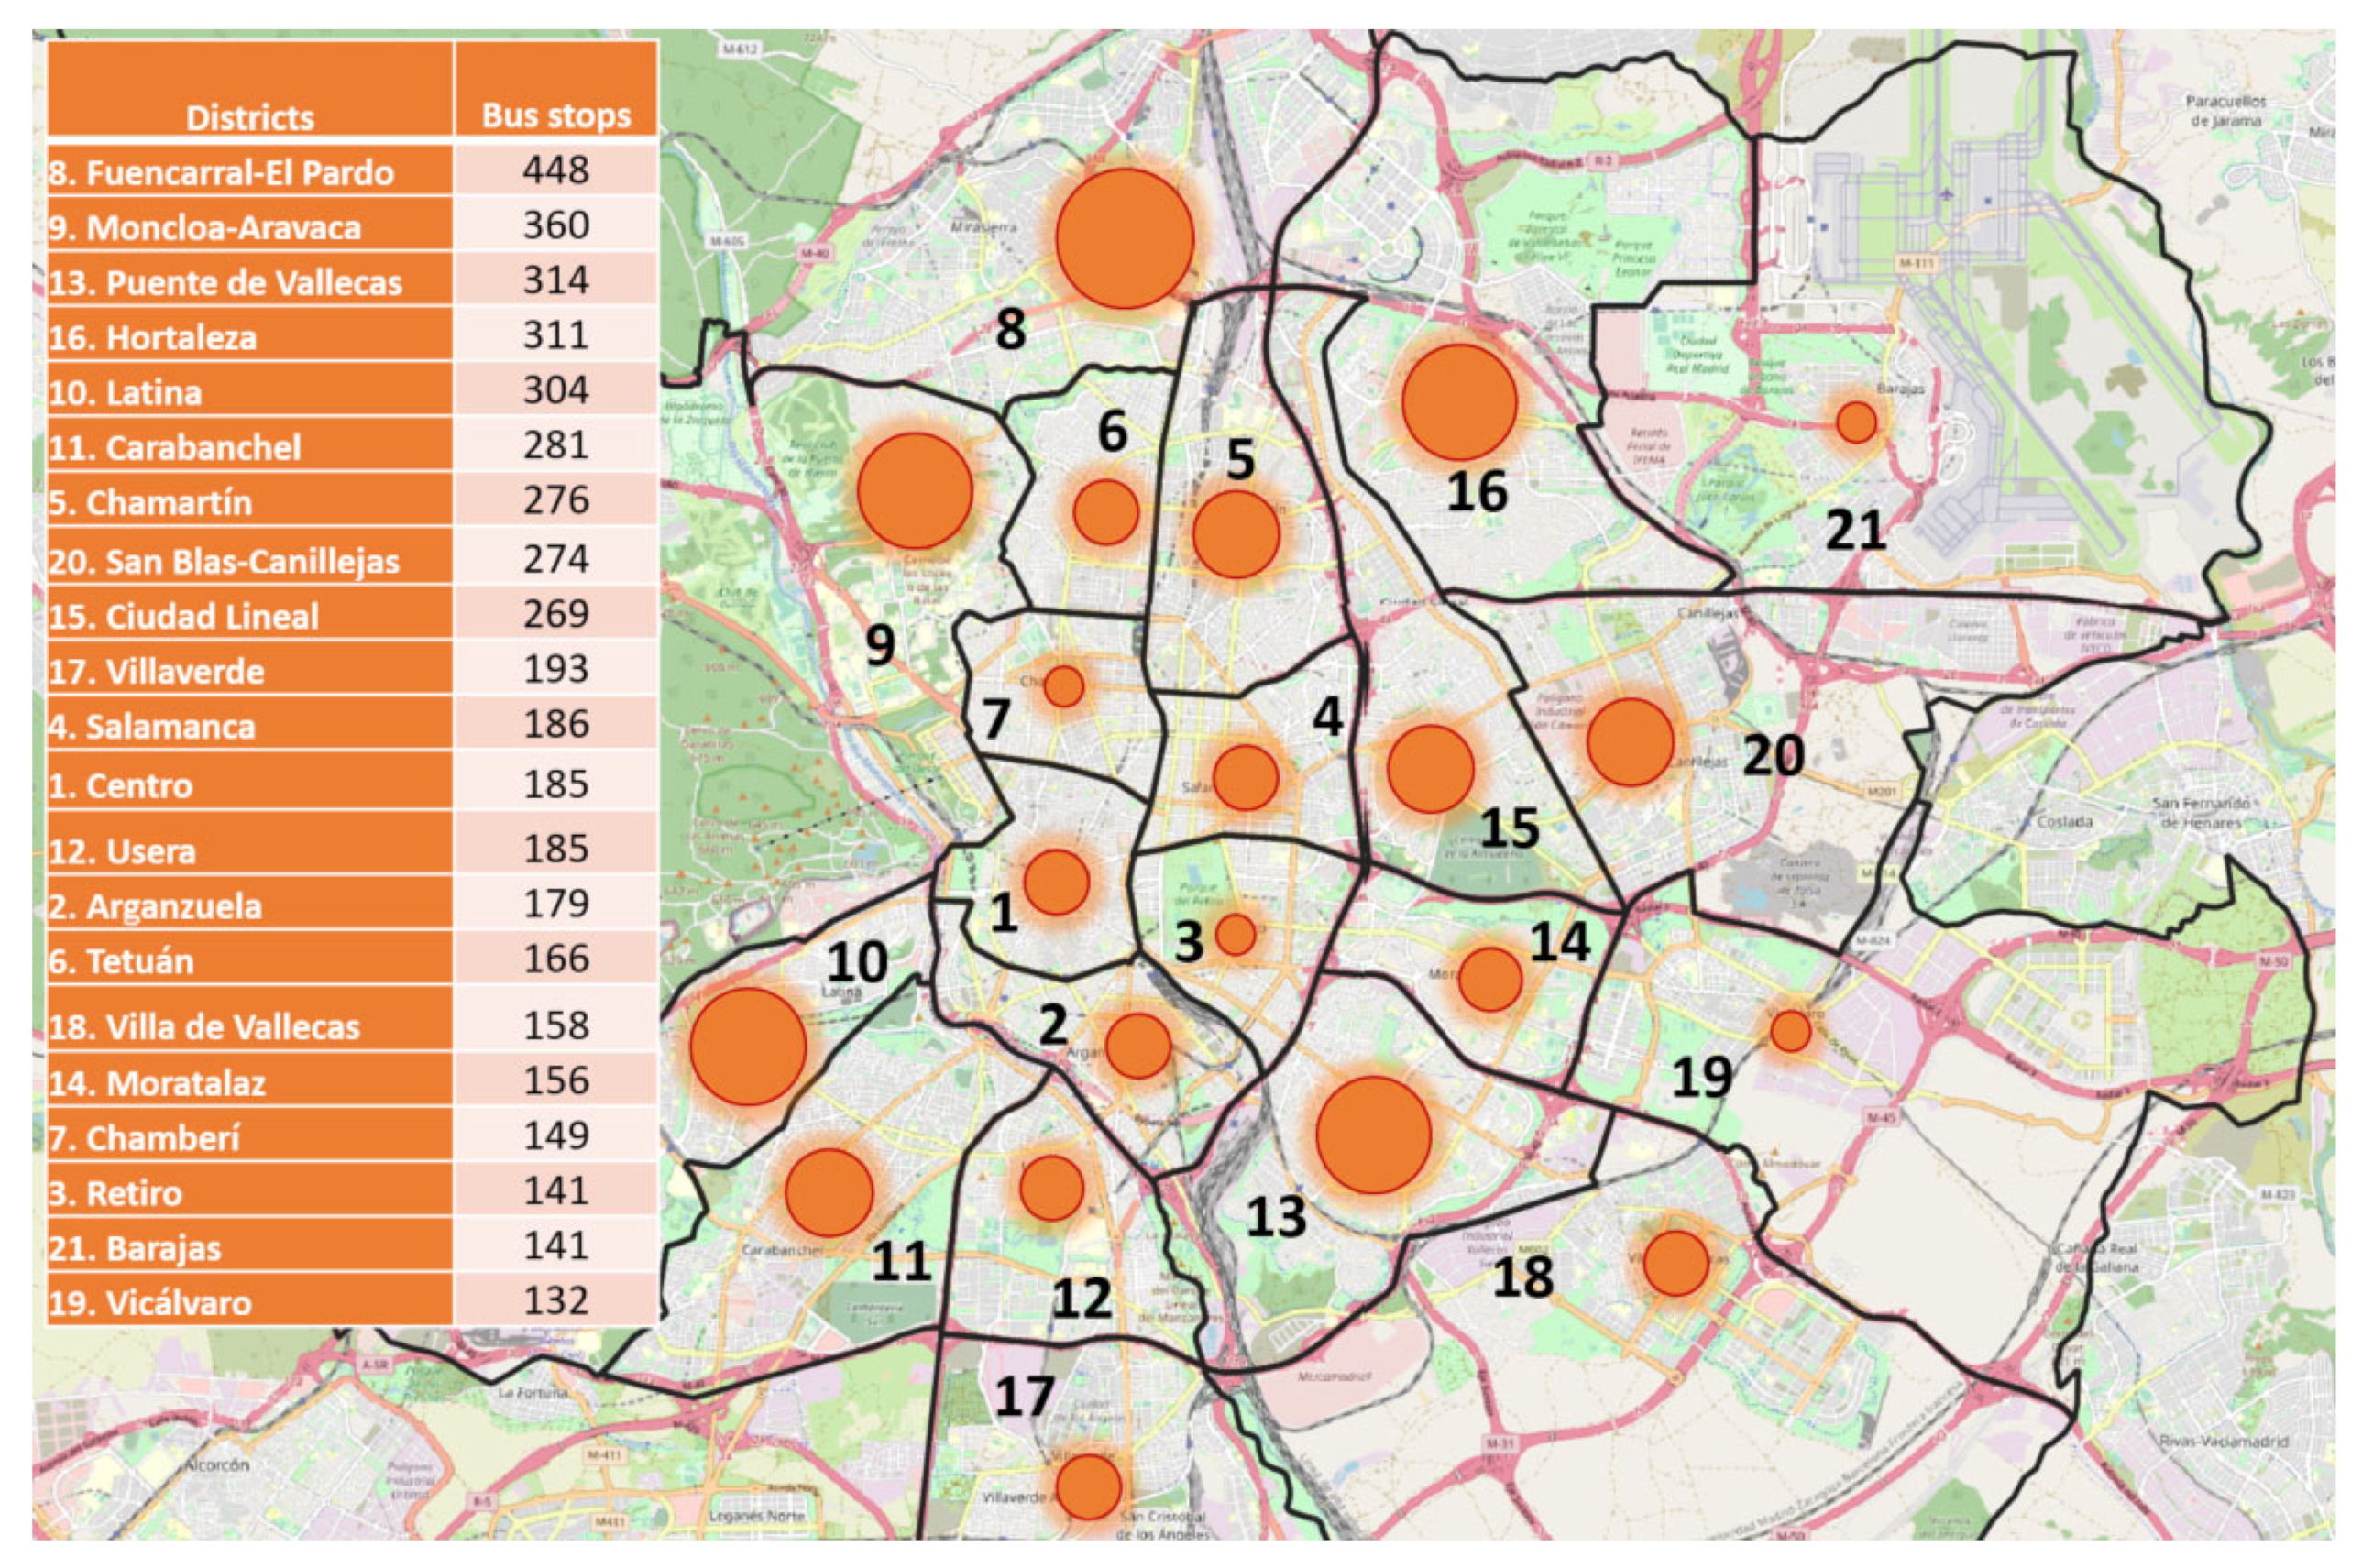
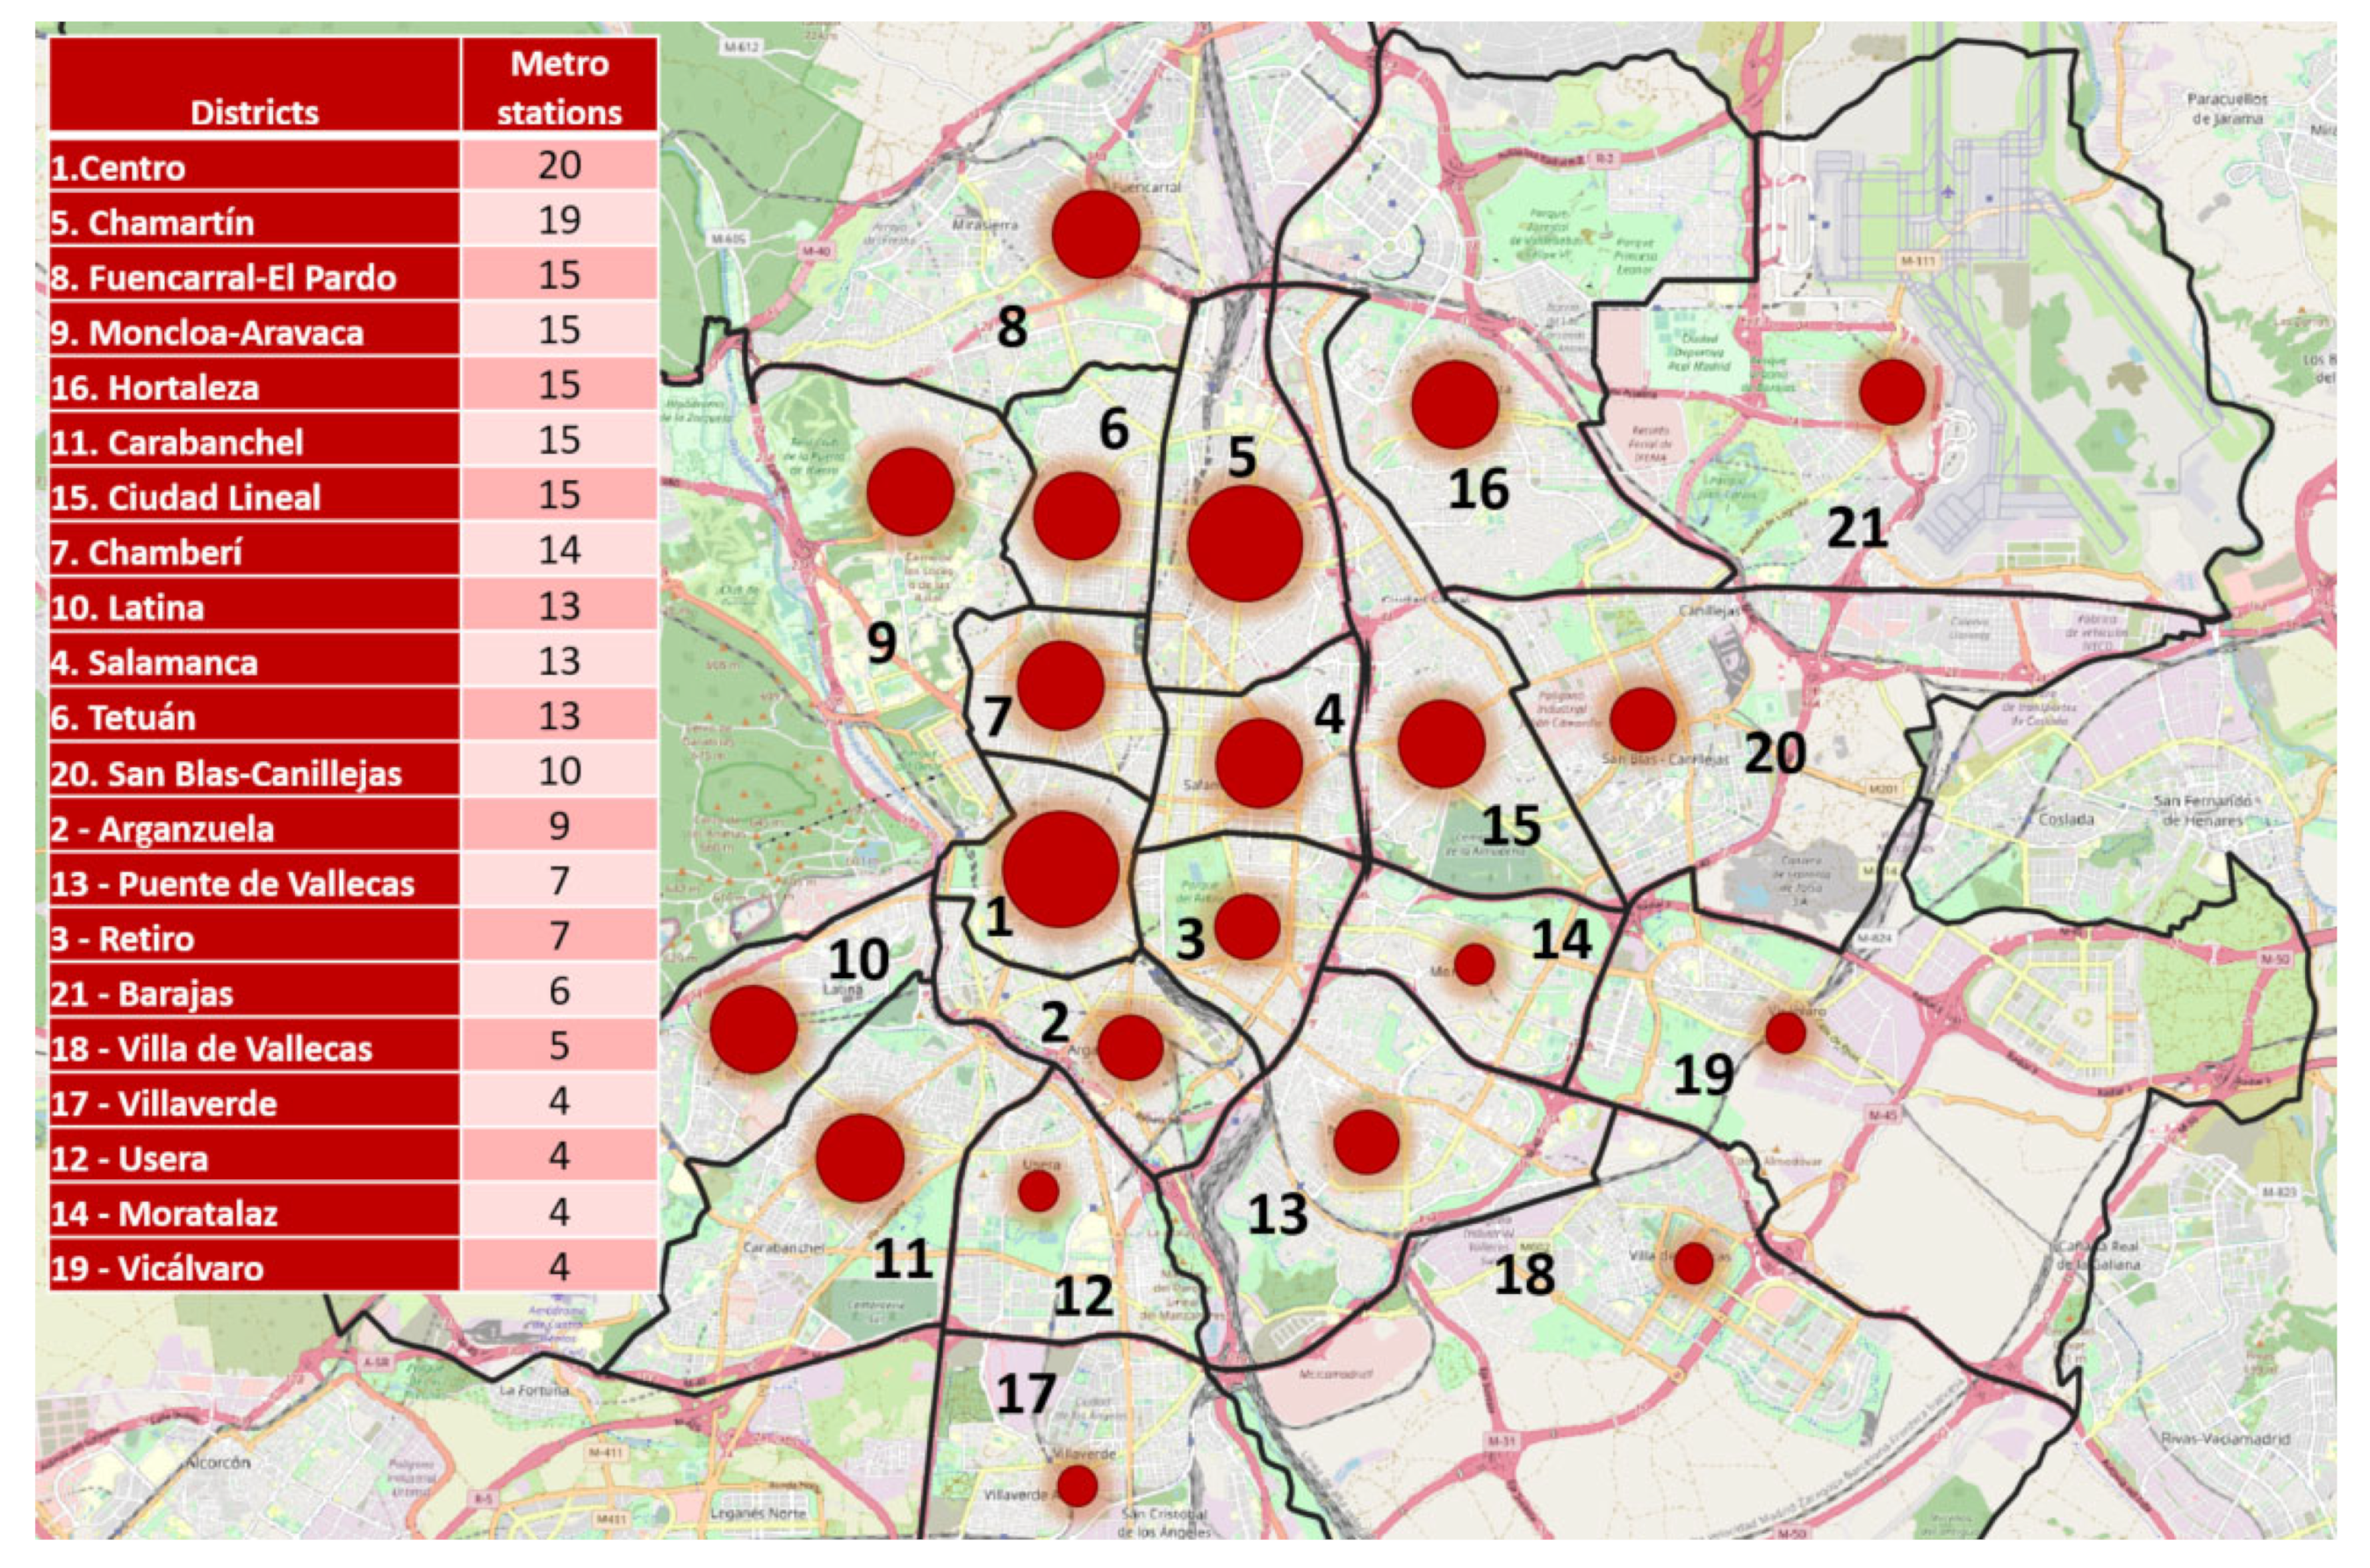
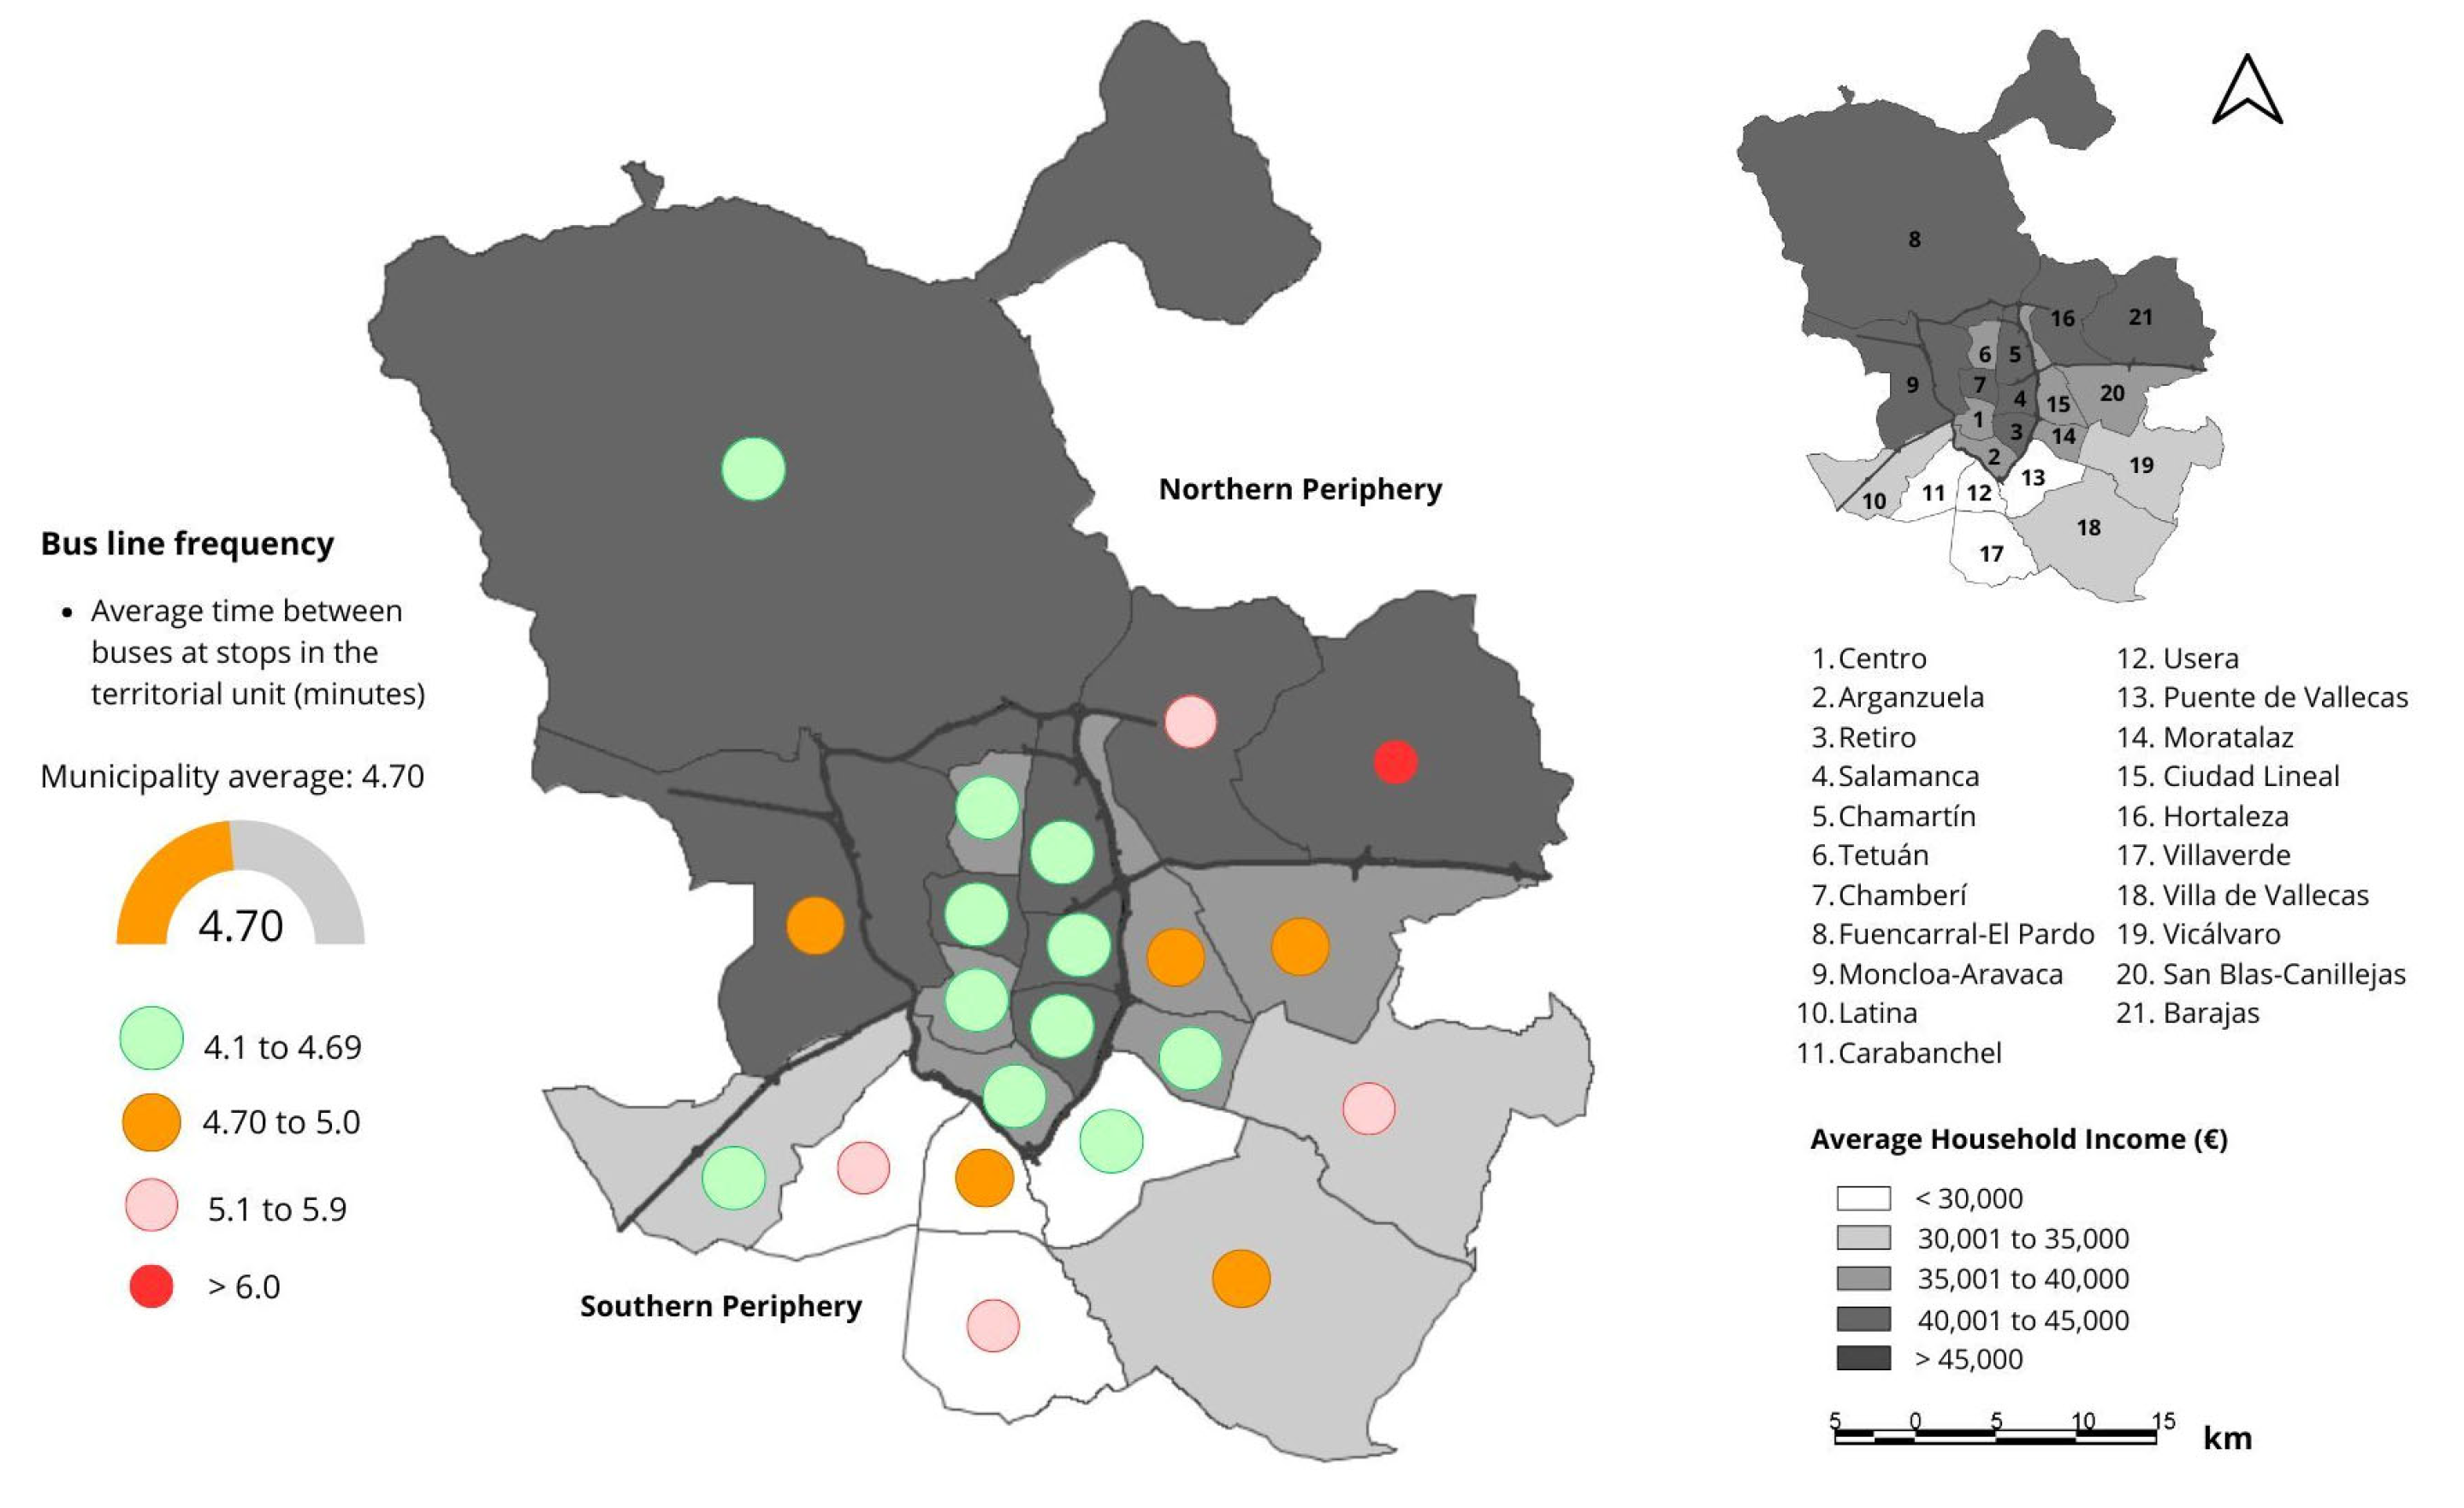
2.1. Madrid as a Case Study

With a population of more than three million inhabitants, the development of the city of Madrid has not been uniform, due to many factors ranging from the peculiar historical characteristics of the districts (the sites of former industrial estates or railway stations, the location of the districts with respect to the intra-municipal communication network and external connections, the implementation of different business models, different kinds of urbanisation, the modernity of the buildings and the layout of the roads, etc.) to its demographic composition or the impact of the general economic fluctuations that considerably affect the purchasing power of those districts that concentrate a larger segment of the population engaged in unskilled labour or jobs that are particularly affected in situations of crisis [14].
Therefore, we can say that Madrid is one of the most segregated metropolitan areas of Europe [15]. This segregation is clearly articulated in the metropolitan territory that organises the population into specific spatial locations in accordance with their income (Figure 1). The evolution of this process, based exclusively on income and market prices, has given rise to the homogenisation and simplification of the different districts of the city, organised by income, thereby increasing intraurban inequality. These dynamics have prevailed continuously over the last few decades, irrespective of the political and economic situations, in a double process of the spatial increase and concentration of the vulnerable population [16,17,18]. In this way, there are different realities within the city of Madrid that are spatially configured into three large areas: the Central Almond, the Northern Periphery and the Southern Periphery (Figure 1), with differentiated characteristics in the different variables that can be considered referring to the existing housing stock, the resident population, prices and the real estate market or the influence of new phenomena, such as the so-called “sharing economy” which translates into the increasing emergence of properties for tourist use [19].
The Central Almond is principally composed of the following districts: Centro, Arganzuela, Retiro, Salamanca, Chamartín, Tetuán and Chamberí, although the City Council of Madrid also sometimes includes part of an eighth district, that of Moncloa-Aravaca. The central almond is a privileged space where average and low incomes have an increasingly lower possibility of accessing housing. It has been subject to a series of real estate dynamics over the last few years including gentrification and touristification processes [20,21] and the channelling of international financial flows towards real estate investments. The Northern Periphery covers the northern arc of the city formed by the A2 and A5 access roads. It includes the districts of Moncloa-Aravaca, Fuencarral-El Pardo, Hortaleza, Ciudad Lineal and Barajas and concentrates average- and high-income residents. Finally, the Southern Periphery comprises the exterior arc of the city located to the south of the A2 and A5 access roads. It includes the districts of Latina, Carabanchel, Usera, Puente de Vallecas, Moratalaz, Villaverde, Villa de Vallecas, Vicálvaro and San Blas Canillejas. It is home to almost half of the city’s population (44.2%), households (42.5%) and housing (42.1%). It concentrates the majority of the working classes, with the lowest incomes and the cheapest housing stock and the lowest contrasts between the maximum and minimum incomes and prices [19].
In total, there are 19,221 tourist accommodations registered in Madrid. With respect to the location of tourist properties in Madrid (Figure 2), it has been observed that the majority are located in the Centro district (8803—46%) and areas adjacent to the city centre (the south of Chamberí (1121—6%) and the northern part of Arganzuela (941—5%)), but also along the Metro lines: in Tetuán (886—5%), along lines 1 and 5 (specifically in Calle Alcalá) and in certain points with good access in the lower-income southern districts, Puerta del Ángel in Latina (509—3%), Marqués de Vadillo in Carabanchel (707—4%) or Puente de Vallecas (630—3%). Therefore, in Madrid, a gradual decline in the presence of tourist properties due to distance or a “distance decay” is not observed [22]. Rather, we can observe a “pattern of centralisation and accessibility” similar to that identified by Wegmann and Jiao [23] but with a difference: these authors identified a scarcity of supply in low-income neighbourhoods but in Madrid, there are significant pockets of tourist properties in neighbourhoods of all purchasing powers [24]. In Madrid, we can distinguish between two very different locations: one where tourist housing is grouped into the districts close to the centre and another where the tourist properties are concentrated along the public transport routes. In view of the above and the justification that we shall see later, this study includes two variables related to accessibility and centrality: the distance of the accommodation from the Puerta del Sol, which is the most emblematic square of the city of Madrid, and the distance of the accommodation from the urban public transport stops/stations.
In terms of the transport possibilities of the city which also caters to occasional demand, such as tourists staying in tourist accommodation, Madrid is one of the cities in Spain with the greatest supply of public transport per inhabitant. Proof of this is that 73% of the trips with the origin and destination in the Central Almond are conducted by public transport. The rest of the trips are made on foot due to the compactness and plurality of uses in this part of the city and the continuous improvement of the pedestrianised space that is being carried out. The use of cars is very low. Public transport is mostly used for radial journeys between the Central Almond and the Periphery (two-thirds of motorised are radial) as a result of the excellent supply of all public modes of transport such as bus stops and metro stops in different districts of the city [25] (Figure 3 and Figure 4).
On the other hand, for journeys made wholly in the Periphery, the car is the most used of the motorised modes of transport (56%), mainly due to the fact that the transport network is mainly focused on Centre–Periphery movements and hardly contemplates movements between Peripheries [26].
Public transport guarantees the capacity of people to access goods, services and equal opportunities in general. However, we could say that, in the case of Madrid, access to certain modes of public transport is not equally distributed throughout the city, with areas where mobility is more difficult. For example, Figure 5 and Figure 6 show that some districts in the Southern Periphery with lower incomes, such as Carabanchel, Usera, Villaverde, Villa de Vallecas and Vicálvaro have a density of bus stops (number of stops/residential area) that is lower than the average of the municipality and a frequency (average time between buses at stops of the territorial unit—minutes) that is lower than the average of Madrid, which obstructs social equality in these peripheral areas.
This modal distribution observed in Madrid, together with the location of housing in the southern districts (with lower income), grouped around certain hubs with better accessibility, could indicate a direct relationship between the proximity of public transport stations, among other factors, and the prices of tourism housing.

2.2. Statistical Methods

In this section, a comprehensive literature review on the impact of short-term rental accommodations on the tourism supply, specifically focusing on their influence on nightly prices, will be conducted. Additionally, the appropriate statistical model for this research will be developed, enabling the correlation between the location of these accommodations and various transportation variables with the pricing of short-term rental stays.
As for the data used to determine the data corresponding to tourism supply and demand, those offered by the AirDNA platform were used. The AirDNA platform offers information on tourist housing offered by Airbnb and Vrbo. Although not all P2P platforms are present in the sample, given that owners usually offer their properties on more than one platform and in accordance with the data contrasted in other works that justify that the supply collected in AirDNA represents 90% of the total supply (Denia City Council-University of Alicante, 2023) [27], this approximation to the supply is taken as valid.
The Spanish Statistical Office (INE) has also been used as a statistical source for household income.

2.2.1. Literature Review

The emergence of digital peer-to-peer platforms in the tourism sector has generated a complete restructuring of the market, as they have enabled the entry of new operators (private individuals) who may have never thought about renting their extra bedroom or empty summer home if these platforms would not have existed [10].
This has generated exponential growth in the supply, which has translated into greater competition between hosts. As a result, their marketing practices require more systematic and informed approaches. Due to the unique characteristic of the perishable nature of the accommodation business (that is, a room cannot be stored for future sale but should be sold each night), the establishment of prices is an important and well-researched topic [28]. In fact, price setting and income management have been identified as two of the most researched themes in hotel marketing [29].
Hedonic price analysis (HPA) has been developed in recent decades to determine the prices implicit in heterogeneous products. This technique originated in Lancaster’s approach [30] to consumer theory, which was later formally established by Rosen [8]. Therefore, according to hedonic pricing theory, the price of a product can be considered to depend on the measurable attributes or characteristics of the product that affect its utility. In its most detailed manifestation, hedonic pricing analysis considers the market value of any heterogeneous good or service as a function of implicit prices (that is, the willingness of consumers to pay) of attributes of the specific product [31].
Hedonic regression models are often used in real estate analysis to separate the effects of the individual characteristics of the property on its price, under the assumption that the price of the property reflects the composition of all of the underlying attributes. From the point of view of real estate markets, these hedonic modelling techniques have enabled scholars to determine the impacts of the highly specific characteristics of the location on the prices of the properties [12,32,33]. They have also enabled the measurement of the impact of public transport [34,35,36,37], accessibility [38] and even some soft forms (walking and even bike-sharing parks) [39,40] on the price of the properties.
In recent years, hedonic pricing analysis has received considerable attention in the literature related to the tourism and travel industry [41], particularly to measure the impact of certain factors on the price of hotel rooms [42,43,44,45,46,47,48,49]. One of the key factors analysed is the location of the hotels in relation to certain services. Location can be conceptualised in relation to the city centre [45] or certain business or tourist services [47,49]. In general, the results have been disparate. For example, Zhang et al. [49] observed that the greater the distance of the hotels from the public transport stations, the lower the prices. However, they did not observe a significant effect if the hotels were close to tourist attractions.
Therefore, and taking into account that in recent years the Airbnb platform has become the leader of the accommodation market for private individuals followed closely by other platforms (Booking, Vrbo or TripAdvisor), as they enable property owners to offer their properties to possible guests in direct competition with the traditional suppliers of accommodation, it is not surprising that many studies have begun to analyse the factors determining the price of the properties advertised through these types of platform [28,48,50,51,52]. Thus, according to hedonic pricing theory, a listing on these platforms would comprise a series of elements that influence the quality of the overall product and provide value and satisfaction to the consumers. As a result, the price of the listing would be related to the presence or absence of specific elements and would reflect the assumptions of the host regarding the implicit marginal prices of certain characteristics of the listing.
Many studies, such as Hill’s [50], have analysed Airbnb’s hedonic pricing algorithm. It uses three principal elements to suggest the price of a listing: similarity, frequency and location. The similarity element predicts the successful price of a new listing, comparing it with existing listings that are similar with respect to a series of different characteristics, including the type of listing (private room, whole house or apartment and shared room), how many people can sleep there, the type of property and the number of comments. The element of frequency adjusts the predicted prices in accordance with the seasonality and non-cyclical price changes. Finally, the element of location predicts the impact of the location on prices, given that Airbnb listings are more widely distributed than hotels and given the importance of the services of the neighbourhood that cannot be determined simply by the distance from the city centre [12,50].
The fact that the hosts of Airbnb can establish the prices of their properties on the platform has given rise to many studies analysing the factors that determine Airbnb prices. These studies usually use econometric methods (such as ordinary least squares (OLS)) to estimate hedonic pricing equations, where the selection of explanatory variables is well justified in the econometric literature on hotel prices, which is much more abundant and includes the following (as previously mentioned) [13]:
(1)
Characteristics of the room and other services, such as the room size, Wi-Fi, TV or gym [46,53];
(2)
Signs of quality, such as the hotel brand, the number of stars or the clients with respect to seasonal fluctuations in the number of visitors to the city. Therefore, reviews are conducted [53,54,55,56];
(3)
Aspects referring to the location, such as the proximity to the city centre and other tourist attractions. Usually, the proximity to these places increases the prices of the hotels [57], although it is also possible that there are cheaper hotels in central locations due to greater spatial competition compared with suppliers in the outskirts [46].
Therefore, and as expected, the most analysed explanatory variables in studies on tourist properties include the characteristics of the room or property listed, including the number of beds, rooms and bathrooms as they normally directly affect prices [28,58,59,60]. With respect to the location, the majority of studies consider the distance from the city centre [59], public transport points [61], the coast [62] and/or other tourist attractions, restaurants, pubs and even leisure facilities [61,62]. There are many factors that influence the cost of accommodation, the price, the location, the characteristics of the property itself, and the additional services that can be offered such as amenities, pool, terrace, gym, parking, etc, in addition, of course, to the number of rooms in the property.
Building on the preceding discussion, this study not only employs the hedonic pricing theory as a conceptual framework to determine how the characteristics of accommodations and their locations influence the pricing of tourist housing but it also introduces variables associated with the accessibility of the property to the public transport system (such as the distance to metro and bus stations). The consideration of these accessibility variables can help to explain the cases in which the hosts can charge a rate that is higher than the average for the area although the property is located far from the city centre.

2.2.2. Statistical Methods

Based on the aforementioned information, in order to analyse the factors that determine the prices of tourist properties in the municipality of Madrid, a hedonic pricing regression model by ordinary least squares (OLS) has been used for two periods of time: the high season (October 2022) and the low season (February 2023).
In order to determine the months corresponding to the low and high seasons in the municipality of Madrid, the occupation in the period of one year was observed (from July 2022 to June 2023). In this respect, as shown in Figure 7, the months with the lowest occupancy in the municipality of Madrid were August, January and February. January is a peculiar month due to the Christmas holidays. In this regard, it has been observed that some accommodation opens until the Epiphany holiday (6th of January) and then closes, which prevents a clear analysis of the situation. August, for its part, is a very atypical month in Madrid as it coincides with the summer holiday period and a significant proportion of its residents leave the city to spend their holidays away. Finally, the month of February is fully academic in Madrid, i.e., residents and tourists coincide in this respect; it is, therefore, considered much more appropriate to select this month as the valley in accordance with the objectives of this article.
On the contrary, the month with the highest occupation was October 2022, which has been selected for the analysis of the high season.
In Table 1, we explain the variables dependent and independent analysed and the sources.

2.2.3. Variables Analysed—Source: Own Elaboration

A semilogarithmic model has been estimated [42] with the price recorded as a dependent variable. The basic specification of the ordinary least squares regression (OLS) is described in the following equation
ln p r i c e = β 0 + β 1 . R o o m s + β 2 · B a t h r o o m s + β 3 · M i n i m u m   s t a y + β 4 · G u e s t s + β 5 · O c c u p a t i o n + β 6 · C e n t r e + β 7 · P e r i p h e r y + β 8 · B u s + β 9 · M e t r o + β 10 · T r a i n + β 11 · S o l + β 12 · l n ( I n c o m e ) + u
The first group of variables describes the characteristics of the property: the number of rooms and bathrooms, the minimum stay established by the host, the maximum number of guests allowed and the occupation of the property in the months analysed. It is expected that all of these variables will have a positive impact, based on the conclusions of previous studies, with the exception of the minimum stay, as a longer minimum stay established for properties could reduce their price.
The second set of explanatory variables analyses the distance between the properties and certain points of interest. In this case, the distance to the Puerta del Sol has been considered as the distance to the city centre as the distance from the city centre is the most common explanatory variable included in hedonic pricing studies for tourist housing and also in the literature on hotel prices. It is well established that the proximity of any type of accommodation supply to the city centre, where the majority of the tourist attractions are located, enables its owner to increase the price [13]. The distance from bus, metro and suburban train stops or stations seeks to capture the degree of accessibility of the property to the city’s transport network, which, according to the hypothesis established in this study, can enable the host to charge a higher price, even if the property is not close to the city centre.
The model is completed with the average household income variable, as other studies have observed that properties located in higher-income neighbourhoods usually have higher prices [12] and the dummy variables of central and periphery locations indicate whether the property is located in the Centro district (where the majority of the accommodation is concentrated) or outside of the Central Almond.
In order to take into account the possible presence of heteroskedasticity, robust standard deviations have been used, and to mitigate the risk of multicollinearity in the specifications, variance inflation factors (VIFs) of all of the covariables after the estimation have been tested. The goodness of fit indicator (R-squared) and the overall F significance test of the model form the basis for analysing the performance of the model.

3. Results and Discussion

Table 2 shows the descriptive statistics of the variables analysed and Table 3 shows that the variance inflation factors (VIFs) of all of the independent variables were lower than 3.8, which is an acceptable range that allows us to rule out possible problems of multicollinearity.
Table 4 shows the results obtained after applying the hedonic pricing regression through ordinary least squares (OLS) in the months of October 2022 (high season) and February 2023 (low season).
The results show that a higher number of bathrooms increases the price of the property by between 19.8% (low season) and 22.7% (high season). This increase in price associated with the additional bathrooms could be an indirect indicator of a larger property with a certain number of rooms or even a more luxurious property [12]. The same is the case with the maximum number of guests; a greater capacity increases the price of the property by around 5.9% (low season) and 7.4% (high season). The number of rooms also directly influences the price of the accommodation, so the price of properties with a greater number of rooms increases by 8.7% (high season) and 12.4% (low season).
The higher occupation of the property also implies a lower price of the accommodation by between 14.4% (low season) and 42% (high season).
The result related to the variable of minimum stay is interesting, being significant with a negative sign, denoting that the more restrictive this parameter, in other words, the longer the minimum stay (greater number of days) established by the host, the lower the price.
With respect to the location of the properties, only the Centro variable is significant, indicating that properties located in the Centro district are more likely to have higher prices. It should be noted that this district concentrates the largest supply of tourist housing in Madrid and, therefore, it can be said that the greater the number of listings in the same census area, the higher the price of the property. This would show the presence of agglomeration effects in the market of tourist properties: the areas that are currently attractive to tourists could be promising areas of future growth for these tourist properties [12]. Furthermore, the location per se seems to be important. The properties charge lower prices per night (between 2% (low season) and 4% (high season) for every kilometre they are located further from the Puerta del Sol.
In relation to the proximity of the properties to the public transport stations, we can observe that the prices of properties further away from a bus stop are 11.4% cheaper in the case of February (low season), although this variable is not relevant in October (high season). This could be due to the climate of Madrid; in October, the temperature is still pleasant and inviting for taking walks around the city. Tourists could take longer walks and come to know the city better on foot.
With respect to the metro stations, a greater distance from the station decreases the price of the accommodation by 6.08% in the case of October (high season) but is not relevant in February. Again, these results could be related to the climate. In February, the temperatures are lower and, given the large number of bus stops in the municipality, there is a high probability that tourists prefer this mode of transport if there is a stop close to the property in which they are staying. Furthermore, the longer the distance to the suburban train station, the lower the rates for both periods (high and low seasons) although more so in February (around 3% as opposed to 1% in October).
Going beyond accessibility and consistent with the location of the properties, the average household income variable is significant with a positive sign, which would indicate that those located in high-income neighbourhoods and districts have higher prices (between 35% and 40%, depending on the season). This could reflect the fact that, in the majority of cases, high incomes constitute an indicator of high-quality urban services and urban design [12].

4. Conclusions

This study has used a hedonic pricing regression model through ordinary least squares (OLS) to analyse the impact of the proximity of public transport stations and the characterisation of tourist properties on the average price per night.
The obtained results indicate that the price of the property depends on the services that it includes, where it is located and the time of year it is booked. In relation to the characteristics of the property, the obtained results reveal that a greater capacity and a higher number of bathrooms and bedrooms increase the price. However, the longer the minimum stay required by the host, the lower the price.
With respect to the location, those properties in the Centro district have higher prices. On the contrary, those further away from the Puerta del Sol (city centre) have lower prices.
The proximity of the public transport stations also affects the price of the properties. In this respect, the further away from bus, metro and train stops/stations, the lower the price. However, it has been observed that the relevance of this situation depends on the season. The proximity of bus stops is not significant in the high season (October). However, the proximity to metro stations is not significant in the low season (February). This could be due to the climate of Madrid. In October, the average temperature is 19 °C (Celsius), which invites people to walk. Therefore, tourists could take advantage of the walk to the metro station and come to know the city. On the other hand, in February, the minimum temperature can be 4 °C and the average temperature is 6 °C. Taking into account that there is a high probability of having a bus stop close by (less than 200 m, given the large number of bus stops in the municipality) and that this temperature does not invite people to walk, it could be the case that tourists prefer this mode of transport to move around.
These results suggest that the characteristics of the properties, the local environment and the elements in the area influence the price of tourist accommodation. Similarly, the proximity to public transport stations and stops has a relevant influence on the choice of tourist accommodation. This latter factor is highly important for designing public policies that favour a denser public transport network in peripheral areas of the city. This would increase the number of tourist properties in these areas further away from the centre and, therefore, the number of reservations. This would improve the income of these more vulnerable areas together with the social cohesion of the municipality.
However, this study has certain limitations, such as the lack of segmentation when applying hedonic pricing [63]. Therefore, the model used assumes that the hosts of these properties cater to a uniform market; however, a greater percentage of hosts that cater to business travellers, for example, could explain the differences in the results with other markets.
Finally, the mobility patterns of tourists in a certain city can be extremely complex due to the wide heterogeneity in the reasons for the visits, the historical–cultural attractions, the spending capacity, age and gender characteristics, the trip preferences, socio-cultural interests [64,65] and the neighbourhood/district in which they are staying. Therefore, it would be interesting to determine the mode of transport that tourists use to reach the destination city (private vehicle, rented vehicle, train, bus, etc.) and to move around within it. This information would enable us to define the mobility patterns of these tourists and identify the public transport needs in specific areas or neighbourhoods of the city, which would foster the adoption of sustainable mobility habits derived from the tourism activity.

Author Contributions

Conceptualisation, P.V. and B.G.; methodology, A.O.; software, M.F.; validation, P.V., A.O. and B.G.; formal analysis, P.V.; investigation, P.V.; resources, M.F.; data curation, M.F.; writing—original draft preparation, P.V.; writing—review and editing, P.V.; visualisation, A.O.; supervision, A.O.; project administration, B.G.; funding acquisition, B.G. All authors have read and agreed to the published version of the manuscript.

Funding

The publication is part of the project PID2021-124428OB-I00, funded by “MCIN/AEI/10.13039/501100011033/ERDF, EU”, where PID2021-124428OB-I00 is the reference that appears in the award resolution; MCIN is the acronym of the Ministry of Science and Innovation; AEI is the acronym of the State Research Agency; 10.13039/501100011033 is the DOI (Digital Object Identifier) of the Agency; and ERDF is the acronym of the European Regional Development Fund.

Institutional Review Board Statement

Not applicable.

Informed Consent Statement

Not applicable.

Data Availability Statement

The data will be provided upon request.

Conflicts of Interest

The authors declare no conflicts of interest.

References

  1. European Commission. Communication from the Commission to the European Parliament, the Council, The European Economic and Social Committee and The Committee of the Regions; A European Agenda for the Collaborative Economy; 2.6.2016 COM(2016) 356 Final; European Commission: Brussels, Belgium, 2016. [Google Scholar]
  2. Dogru, T.; Mody, M.; Suess, C.; Line, N.; Bonn, M. Airbnb 2.0: Is it a sharing economy platform or a lodging corporation? Tour. Manag. 2020, 78, 104049. [Google Scholar] [CrossRef]
  3. Guttentag, D.; Smith, S.; Potwarka, L.; Havitz, M. Why tourists choose Airbnb: A motivation-based segmentation study. J. Travel Res. 2018, 57, 342–359. [Google Scholar] [CrossRef]
  4. Zervas, G.; Proserpio, D.; Byers, J.W. The Rise of the Sharing Economy: Estimating the Impact of Airbnb on the Hotel Industry. J. Mark. Res. 2017, 54, 687–705. [Google Scholar] [CrossRef]
  5. Bendickson, J.S.; Muldoon, J.; Liguori, E.W.; Midgett, C. High performance work systems: A necessity for startups. J. Small Bus. Strategy 2017, 27, 1–12. [Google Scholar]
  6. Lockyer, T. The perceived importance of price as one hotel selection dimension. Tour. Manag. 2005, 26, 529–537. [Google Scholar] [CrossRef]
  7. Chattopadhyay, M.; Mitra, S.K. Do airbnb host listing attributes influence room pricing homogenously? Int. J. Hosp. Manag. 2019, 81, 54–64. [Google Scholar] [CrossRef]
  8. Rosen, S. Hedonic prices and implicit markets: Product differentiation in pure competition. J. Political Econ. 1974, 82, 34–55. [Google Scholar] [CrossRef]
  9. Contu, G.; Frigau, L.; Conversano, C. Price indicators for Airbnb accommodations. Qual. Quant. 2023, 57, 4779–4802. [Google Scholar] [CrossRef]
  10. Önder, I.; Weismayer, C.; Gunter, U. Spatial price dependencies between the traditional accommodation sector and the sharing economy. Tour. Econ. 2019, 25, 1150–1166. [Google Scholar] [CrossRef]
  11. Türk, U.; Östh, J.; Kourtit, K.; Nijkamp, P. The path of least resistance explaining tourist mobility patterns in destination areas using Airbnb data. J. Transp. Geogr. 2021, 94, 103130. [Google Scholar] [CrossRef]
  12. Deboosere, R.; Kerrigan, D.J.; Wachsmuth, D.; El-Geneidy, A. Location, location and professionalization: A multilevel hedonic analysis of Airbnb listing prices and revenue. Reg. Stud. Reg. Sci. 2019, 6, 143–156. [Google Scholar] [CrossRef]
  13. Voltes-Dorta, A.; Sánchez-Medina, A. Drivers of Airbnb prices according to property/room type, season and location: A regression approach. J. Hosp. Tour. Manag. 2020, 45, 266–275. [Google Scholar] [CrossRef]
  14. Ayuntamiento de Madrid. Metodología para la Elaboración del Índice de Vulnerabilidad Territorial de Barrios y Distritos de Madrid y Ranking de Vulnerabilidad; Coordinación Territorial y Cooperación Político-Social de Madrid: Madrid, Spain, 2018. [Google Scholar]
  15. Tammaru, T.; van Ham, M.; Marcińczak, S.; Musterd, S. (Eds.) Socio-Economic Segregation in European Capital Cities: East Meets West; Routledge: London, UK, 2016. [Google Scholar]
  16. Rodríguez Suárez, I.; Álvarez del Valle, L.; Fernández Ramírez, C.; Hernández Aja, A. El imposible acceso a la vivienda en Madrid: Cuando los precios superan a las rentas. Ciudad. Y Territ. Estud. Territ. (CyTET) 2023, 55, 61–76. [Google Scholar] [CrossRef]
  17. Leal-Maldonado, J.; Martínez-del Olmo, A. El ocaso de un modelo de vivienda de difícil reemplazo. Ciudad. Y Territ. Estud. Territ. 2021, 53, 43–60. [Google Scholar] [CrossRef]
  18. Domínguez-Pérez, M.; Leal-Maldonado, J.; Barañano-Cid, M. Vivienda, transformaciones urbanas y desigualdad socioespacial en las grandes ciudades españolas. Ciudad. Y Territ. Estud. Territ. 2021, 53, 5–12. [Google Scholar] [CrossRef]
  19. Rodríguez-Suárez, I.; Hernández-Aja, A.; GómezGiménez, J.; Matesanz-Parellada, Á.; DíezBermejo, A. Los Catálogos de Barrios Vulnerables de España. Análisis de la vulnerabilidad en las ciudades españolas entre 1991 y 2011. Ciudad y Territorio. Estud. Territ. (CyTET) 2021, 53, 179–200. [Google Scholar] [CrossRef]
  20. Gil, J.; Sequera, J. Expansión de la ciudad turística y nuevas resistencias. El caso de Airbnb en Madrid. Empiria 2018, 41, 15–31. [Google Scholar] [CrossRef]
  21. Crespi-Vallbona, M.; Domínguez-Pérez, M. Las consecuencias de la turistificación en el centro de las grandes ciudades: El caso de Madrid y Barcelona. Ciudad. Y Territ. Estud. Territ. 2021, 53, 61–82. [Google Scholar] [CrossRef]
  22. Ioannides, D.; Röslmaier, M.; van der Zee, E. Airbnb as an instigator of ‘tourism bubble’ expansion in Utrecht’s Lombok neighbourhood. Tour. Geogr. 2018, 21, 1–19. [Google Scholar] [CrossRef]
  23. Wegmann, J.; Jiao, J. Taming Airbnb: Toward guiding principles for local regulation of urban vacation rentals based on empirical results from five US cities. Land Use Policy 2017, 69, 494–501. [Google Scholar] [CrossRef]
  24. Ardura Urquiaga, Á.; Lorente Riverola, I.; Mohíno Sanz, M.I.; Ruiz Sánchez, J. “No estamos tan mal como Barcelona”: Análisis de la proliferación y regulación de las viviendas de uso turístico en Madrid y Barcelona = “We are not as crowded as Barcelona”: The proliferation and regulation of vacational rentals in Madrid and Barcelona. BAGE Boletín Asoc. Geógrafos Españoles 2019, 83, 1–47. [Google Scholar]
  25. Ayuntamiento de Madrid. Portal de Transparencia. Estudio de la Movilidad de la Ciudad de Madrid. 2019. Available online: https://transparencia.madrid.es/portales/transparencia/es/Transparencia-porsectores/Movilidad/Trafico/Estudios-Informes-y-Evaluaciones-de-Movilidad (accessed on 1 January 2020).
  26. Flor, M.; Ortuño, A.; Guirao, B. Ride-hailing services: Competition or complement to public transport to reduce accident rates. The case of Madrid. Front. Psychol. 2022, 13, 951258. [Google Scholar] [CrossRef] [PubMed]
  27. Ayuntamiento de Denia-Alicante University. Diagnóstico Relativo a Las Viviendas de Uso Turístico Ofertadas por Plataformas on-Line en Denia. 2023. Available online: https://www.denia.es/adjuntos/directori/docs/452.pdf (accessed on 30 May 2024).
  28. Gibbs, C.; Guttentag, D.; Gretzel, U.; Morton, J.; Goodwill, A. Pricing in the sharing economy: A hedonic pricing model applied to Airbnb listings. J. Travel Tour. Mark. 2018, 35, 46–56. [Google Scholar] [CrossRef]
  29. Yoo, M.; Lee, S.; Bai, B. Hospitality marketing research from 2000 to 2009: Topics, methods, and trends. Int. J. Contemp. Hosp. Manag. 2011, 23, 517–532. [Google Scholar] [CrossRef]
  30. Lancaster, K.J. A new approach to consumer theory. J. Political Econ. 1966, 74, 132–157. [Google Scholar] [CrossRef]
  31. Mitsis, P. Hedonic Price Analysis of Hotel Rooms in Cyprus. J. Hosp. Financ. Manag. 2022, 30, 17. [Google Scholar]
  32. Glaesener, M.-L.; Caruso, G. Neighborhood green and services diversity effects on land prices: Evidence from a multilevel hedonic analysis in Luxembourg. Landsc. Urban Plan. 2015, 143, 100–111. [Google Scholar] [CrossRef]
  33. Li, M.M.; Brown, H.J. Micro-neighborhood externalities and hedonic housing prices. Land Econ. 1980, 56, 125–141. [Google Scholar] [CrossRef]
  34. Armstrong, R.J.; Rodriguez, D.A. An evaluation of the accessibility benefits of commuter rail in eastern Massachusetts using spatial hedonic price functions. Transportation 2006, 33, 21–43. [Google Scholar] [CrossRef]
  35. Benjamin, J.D.; Sirmans, G.S. Mass transportation, apartment rent and property values. J. Real Estate Res. 1996, 12, 1–8. [Google Scholar] [CrossRef]
  36. Chatman, D.G.; Tulach, N.K.; Kim, K. Evaluating the economic impacts of light rail by measuring home appreciation: A first look at New Jersey’s River line. Urban Stud. 2012, 49, 467–487. [Google Scholar] [CrossRef]
  37. Lewis-Workman, S.; Brod, D. Measuring the neighborhood benefits of rail transit accessibility. Transp. Res. Rec. J. Transp. Res. Board 1997, 1576, 147–153. [Google Scholar] [CrossRef]
  38. Franklin, J.P.; Waddell, P. A hedonic regression of home prices in King County, Washington, using activityspecific accessibility measures. In Proceedings of the Transportation Research Board 82nd Annual Meeting, Washington, DC, USA, 12–16 January 2003. [Google Scholar]
  39. Rauterkus, S.Y.; Miller, N. Residential land values and walkability. J. Sustain. Real Estate 2011, 3, 23–43. [Google Scholar] [CrossRef]
  40. El-Geneidy, A.; Lierop, D.V.; Wasfi, R. Do people value bicycle sharing? A multilevel longitudinal analysis capturing the impact of bicycle sharing on residential sales in Montreal, Canada. Transp. Policy 2016, 51, 174–181. [Google Scholar] [CrossRef]
  41. Papatheodorou, A.; Lei, Z.; Apostolakis, A. Hedonic price analysis. In Handbook of Research Methods in Tourism; Edward Elgar Publishing: Cheltenham, UK, 2012. [Google Scholar]
  42. Portolan, A. Impact of the attributes of private tourist accommodation facilities onto prices: A hedonic price approach. Eur. J. Tour. Res. 2013, 6, 74–82. [Google Scholar] [CrossRef]
  43. Pawlicz, A.; Napierala, T. The determinants of hotel room rates: Analysis of the hotel industry in Warsaw, Poland. Int. J. Contemp. Hosp. Manag. 2016, 29, 571–588. [Google Scholar] [CrossRef]
  44. Wang, X.; Suna, J.; Wen, H. Tourism seasonality, online user rating and hotel price: A quantitative approach based on the hedonic price model. Int. J. Hosp. Manag. 2019, 79, 140–147. [Google Scholar] [CrossRef]
  45. Bull, A.O. Pricing a motel’s location. Int. J. Contemp. Hosp. Manag. 1994, 6, 10–15. [Google Scholar] [CrossRef]
  46. Chen, C.-F.; Rothschild, R. An application of hedonic pricing analysis to the case of hotel rooms in Taipei. Tour. Econ. 2010, 16, 685–694. [Google Scholar] [CrossRef]
  47. Herrin, W.E.; Carvell, S.A. Pricing in the hospitality industry: An implicit markets approach. Hosp. Rev. 1990, 8, 27. [Google Scholar]
  48. Lee, D.; Hyun, W.; Ryu, J.; Lee, W.J.; Rhee, W.; Suh, B. An analysis of social features associated with room sales of Airbnb. In Proceedings of the ACM Conference Companion on Computer Supported Cooperative Work & Social Computing, Vancouver, BC, Canada, 14–18 March 2015. [Google Scholar]
  49. Zhang, Z.; Ye, Q.; Law, R. Determinants of hotel room price: An exploration of travelers’ hierarchy of accommodation needs. Int. J. Contemp. Hosp. Manag. 2011, 23, 972–981. [Google Scholar] [CrossRef]
  50. Hill, D. How much is your spare room worth? IEEE Spectrum 2015, 52, 32–58. [Google Scholar] [CrossRef]
  51. Teubner, T.; Hawlitschek, F.; Dann, D. Price determinants on Airbnb: How reputation pays off in the sharing economy. J. Self-Gov. Manag. Econ. 2017, 5, 53–80. [Google Scholar]
  52. Wang, D.; Nicolau, J.L. Price determinants of sharing economy based accommodation rental: A study of listings from 33 cities on Airbnb.com. Int. J. Hosp. Manag. 2017, 62, 120–131. [Google Scholar] [CrossRef]
  53. Schamel, G. Weekend vs. midweek stays: Modelling hotel room rates in a small market. Int. J. Hosp. Manag. 2012, 31, 1113–1118. [Google Scholar] [CrossRef]
  54. Becerra, M.; Santaló, J.; Silva, R. Being better vs. being different: Differentiation, competition, and pricing strategies in the Spanish hotel industry. Tour. Manag. 2013, 34, 71–79. [Google Scholar] [CrossRef]
  55. Masiero, L.; Nicolau, J.L.; Law, R. A demand-driven analysis of tourist accommodation price: A quantile regression of room bookings. Int. J. Hosp. Manag. 2015, 50, 1–8. [Google Scholar] [CrossRef]
  56. Yang, Y.; Mueller, N.J.; Croes, R.R. Market accessibility and hotel prices in the Caribbean: The moderating effect of quality-signaling factors. Tour. Manag. 2016, 56, 40–51. [Google Scholar] [CrossRef]
  57. Soler, I.P.; Gemar, G. Hedonic price models with geographically weighted regression: An application to hospitality. J. Destin. Mark. Manag. 2018, 9, 126–137. Available online: https://scholarworks.umass.edu/jhfm/vol30/iss1/17 (accessed on 1 January 2020). [CrossRef]
  58. Chen, Y.; Xie, K.L. Consumer valuation of airbnb listings: A hedonic pricing approach. Int. J. Contemp. Hosp. Manag. 2017, 29, 2405–2424. [Google Scholar] [CrossRef]
  59. Gunter, U.; Önder, I. Determinants of Airbnb demand in Vienna and their implications for the traditional accommodation industry. Tour. Econ. 2018, 24, 270–293. [Google Scholar] [CrossRef]
  60. Lorde, T.; Jacob, J.; Weekes, Q. Price-setting behavior in a tourism sharing economy accommodation market: A hedonic price analysis of AirBnB hosts in the caribbean. Tour. Manag. Perspect. 2019, 30, 251–261. [Google Scholar] [CrossRef]
  61. Magno, F.; Cassia, F.; Ugolini, M.M. Accommodation prices on airbnb: Effects of host experience and market demand. TQM J. 2018, 30, 608–620. [Google Scholar] [CrossRef]
  62. Perez-Sanchez, V.R.; Serrano-Estrada, L.; Marti, P.; Mora-Garcia, R.-T. The what, where, and why of airbnb price determinants. Sustainability 2018, 10, 4596. [Google Scholar] [CrossRef]
  63. Chau, K.W.; Chin, T.L. A critical review of literature on the hedonic price model. Int. J. Hous. Sci. Its Appl. 2003, 27, 145–165. [Google Scholar]
  64. Loo, B.P.Y. Transport geography: Towards a more people-oriented approach in the last 25 years. J. Transpor Geogr. 2019, 81. [Google Scholar] [CrossRef]
  65. Kozak, M. Comparative analysis of tourist motivations by nationality and destinations. Tour. Manag. 2002, 23, 221–232. [Google Scholar] [CrossRef]
Figure 1. Distribution of the annual average household income in each district of Madrid. Source: own elaboration based on the Urban Audit 2018.
Sustainability 16 04768 g001
Figure 2. Number of tourist properties by district of Madrid. Source: own elaboration based on AirDNA and OpenStreetMap.
Sustainability 16 04768 g002
Figure 3. Number of bus stops by district of Madrid. Source: own elaboration based on OpenStreetMap.
Sustainability 16 04768 g003
Figure 4. Number of metro stops by district of Madrid. Source: own elaboration based on OpenStreetMap.
Sustainability 16 04768 g004
Figure 5. Density of urban bus stops by district. Source: own elaboration based on https://iguala.madrid.es/pages/medio-ambiente-urbano-movilidad (accessed on 2 October 2023).
Sustainability 16 04768 g005
Figure 6. Frequency of urban bus routes by district. Source: own elaboration based on https://iguala.madrid.es/pages/medio-ambiente-urbano-movilidad (accessed on 2 October 2023).
Sustainability 16 04768 g006
Figure 7. Monthly evolution of the percentage of tourist properties between July 2022 and June 2023. Own elaboration based on the data of the AirDNA.
Sustainability 16 04768 g007
Table 1. Variables analysed: Source: own elaboration.
VariablesDefinitionSource
Dependent
PriceRate per night (USD)AirDNA Platform
Independent
General characteristics AirDNA Platform
RoomsNumber of rooms in the property
BathroomsNumber of bathrooms in the property
Minimum stayMinimum stay, measured as nights, established by the owner
GuestsMaximum number of guests allowed
OccupationNumber of nights reserved (number of nights reserved + number of nights available).
Location and neighbourhood variables
CentreDummy variable if the property is located in the Centro districtOwn elaboration based on geospatial analysis with ArcGIS
PeripheryDummy variable if the property is located outside of the “Central Almond”
BusDistance of the property from the nearest bus stop (km)
MetroDistance of the property from the nearest metro station (km)
TrainDistance of the property from the nearest train station (km)
Puerta del SolDistance of the property from the Puerta del Sol (km)
Income Average household income in the district where the property is located (In)Spanish Statistical Office (INE), 2018.
Table 2. Descriptive statistics of the variables analysed. Source: own elaboration.
VariableFebruary 2023October 2022
MeanStd. DevMeanStd. Dev
Price4.92660.49524.96930.5687
Rooms1.51620.98821.52231.0250
Bathrooms1.32650.61291.31270.6129
Stay4.812018.05064.797717.9501
Guests4.05271.97624.07302.1440
Occupation0.57830.33740.75830.3176
Centre0.54900.49760.55600.4969
Periphery0.17240.37780.16660.3727
Bus0.10250.69510.10170.6949
Metro0.24590.31800.23170.2083
Train0.93820.74640.93130.7326
Puerta del Sol2.10272.18572.07312.1571
Income10.61300.225010.60510.2309
Obs78959174
Table 3. Variance Inflation Factors (VIFs). Source: own elaboration.
VariableFebruary 2023October 2022
VIF1/VIFVIF1/VIF
Rooms2.980.3352122.870.348301
Bathrooms1.930.5188791.880.532084
Stay1.010.9898251.010.987231
Guests2.670.3740842.520.397182
Occupation1.030.9735201.020.976820
Centre3.460.2887003.300.302912
Periphery2.440.4102012.730.366181
Bus1.060.9464761.090.920264
Metro1.360.7328381.510.660152
Train1.810.5533701.780.561372
Puerta del Sol3.650.2739243.740.267452
Income2.240.4456902.250.443591
Average VIF2.142.14
Table 4. Results of the model estimated (z statistics in parentheses). Source: own elaboration.
Model 1
October 2022
Model 2
February 2023
Characteristics of the property
Bathrooms0.227 *** (14.67)0.198 *** (13.24)
Guests0.0741 *** (17.20)0.0592 *** (17.08)
Stay−0.00252 *** (−4.08)−0.00122 * (−2.39)
Rooms0.0874 *** (8.85)0.124 *** (15.92)
Occupation−0.420 *** (−17.16)−0.144 *** (−25.77)
Location and neighbourhood variables
Centre0.103 *** (6.18)0.144 *** (9.79)
Periphery−0.0188 (−0.95)−0.00764 (−0.44)
Bus−0.0639 (−1.09)−0.114 * (−2.27)
Metro−0.0608 * (−2.42)−0.0114 (−0.80)
Train−0.0149 + (−1.87)−0.0295 *** (−4.26)
Puerta del Sol−0.0425 *** (−10.81)−0.0271 *** (−7.91)
Income0.356 *** (11.82)0.395 *** (14.50)
Constant0.884 *** (2.71)0.349 (1.19)
F455.64534.56
Prob > F0.00000.0000
R-squared0.44670.5363
Observations91747895
+ p < 0.1 level; * p < 0.05 level; *** p < 0.001.
Disclaimer/Publisher’s Note: The statements, opinions and data contained in all publications are solely those of the individual author(s) and contributor(s) and not of MDPI and/or the editor(s). MDPI and/or the editor(s) disclaim responsibility for any injury to people or property resulting from any ideas, methods, instructions or products referred to in the content.

