Abstract
Because of the strong alkalinity of red mud, it is difficult to recycle, and the long-term accumulation of red mud causes environmental pollution. The study shows that the solidification characteristics of bayer red mud (RM) under the action of Ca(OH)2 (CH) are obvious. The mechanical properties of Bayer RM paste with different amounts of CH at different ages were tested. The strength of RMCH gradually increases with the increase in CH content and age, reaching a turning point in strength at 26.4% content of CH, with the highest strength at 28 days, reaching 2.73 MPa. The solidification products were characterized by XRD, FTIR, TG-DTG, and SEM-EDS. The results show that under the action of CH, the main solidification products of RM are C-(A)-S-H, hemicarboaluminate, and monocarboaluminate. In the solidification process, hydroxysodalite and faujasite-Na react with CH to generate C-S-H, Al(OH)4−, and Na+, then react to generate hemicarboaluminate, monocarboaluminate and C-(A)-S-H, among which hemicarboaluminate is transformed into monocarboaluminate in the presence of calcite, and further monocarboaluminate decomposes to generate calcite. It provides a basis for the study of the interaction mechanism between a single substance and RM and provides a research basis for the sustainable utilization of red mud.
1. Introduction
Red mud (RM) is a solid waste generated in the production of alumina. Due to different production processes and quality of bauxite, the amount and properties of RM also vary [1]. Approximately 0.8–1.5 tons of RM is generated for every ton of alumina produced by the Bayer process, and approximately 120 million tons of RM are generated worldwide each year [2]. The storage of RM not only occupies a large amount of land but also causes a large amount of alkali infiltration, resulting in land salinization and environmental damage [3,4,5,6]. Bayer process RM particles are fine, have high moisture content, poor permeability, low shear strength, long consolidation time, and are difficult to directly utilize, which affects the sustainable development of the alumina industry [7]. The addition of RM can reduce the porosity and increase the density of the matrix, leading to a finer microstructure of the mortar. When the content of RM reaches 5%, it can exhibit volcanic ash activity and improve the strength of hardened cementitious materials. However, higher RM content leads to a lower degree of cement hydration [8,9,10,11]. There have been studies on the application of RM as a road-based material. Compared to natural soil, using RM as a road base can reduce the thickness of the pavement, and the addition of lime-stabilized RM can increase the compressive strength [12,13]. The physical properties of RM can be changed to varying degrees through acid-base treatment and calcination modification. RM also has good adsorption properties [14,15,16].
In the process of bayer process alumina production, the precipitation of silicoaluminate enters the RM. Substances such as Ca3Al2(SiO4)(OH)8, Na6Ca2Al6Si6O24(CO3)2·2H2O, CaAl2Si2O8·4H2O, CaAl2O4·10H2O, Fe2O3, γ-FeO(OH), CaTiO3, and MgCO3 in RM are insoluble in alkaline solution and are inert at room temperature. Another type of anion containing Al and Si and a cation containing Na and Ca in RM mostly exist in the form of Sodalite and Natrolite [17,18]. These substances are products of the desilication reaction of sodium aluminate solution during alumina production. They no longer react in an environment with only NaOH, but under different conditions, compounds mainly composed of Al, Si, and Na can react to form other substances.
Some components of RM can react in a calcium-rich environment. Under the conditions of a CaO/Na2O ratio of 6.5, a liquid-solid ratio of 4 mL/g, and a leaching temperature of 95 °C, with a reaction time of 5 h, the desilication rate can reach 92.44%, and the Na2O content can reach 0.61%. The desilication process is controlled by internal diffusion in the shrinking core model [19]. In the process of calcification, with the increase in temperature, the alkali recovery rate reaches more than 93%, and spherical and compact Katoite aggregates are formed in the calcification process [20]. The study found that under the conditions of 260 °C, a liquid-solid ratio of 5:1, and a CaO/SiO2 mass ratio of 3.5, with a NaOH solution concentration of 200 g/L, the calcification effect of RM is good [21].
Several scholars have studied the calcification effects of RM under different environmental conditions, but there is limited research on the solidification mechanisms of RM incorporating with CH (RMCH) under normal temperature and normal pressure. With the growing issues of RM occupying land, causing environmental pollution, and low utilization rates, its large-scale sustainable utilization and application are urgent. Under different dosages of CH, standard temperature, and humidity curing, the unconfined compressive strength of samples at different ages was tested to analyze the reaction progress, products, mineral composition, and microstructure of substances such as hydroxysodalite and faujasite-Na. The phase changes after the addition of CH to the RM were studied through the analysis of the transformations of Al, Si, Na, and Ca, and the solidification enhancement mechanism of Bayer process RM was derived from the analysis.
2. Materials and Methods
2.1. Materials
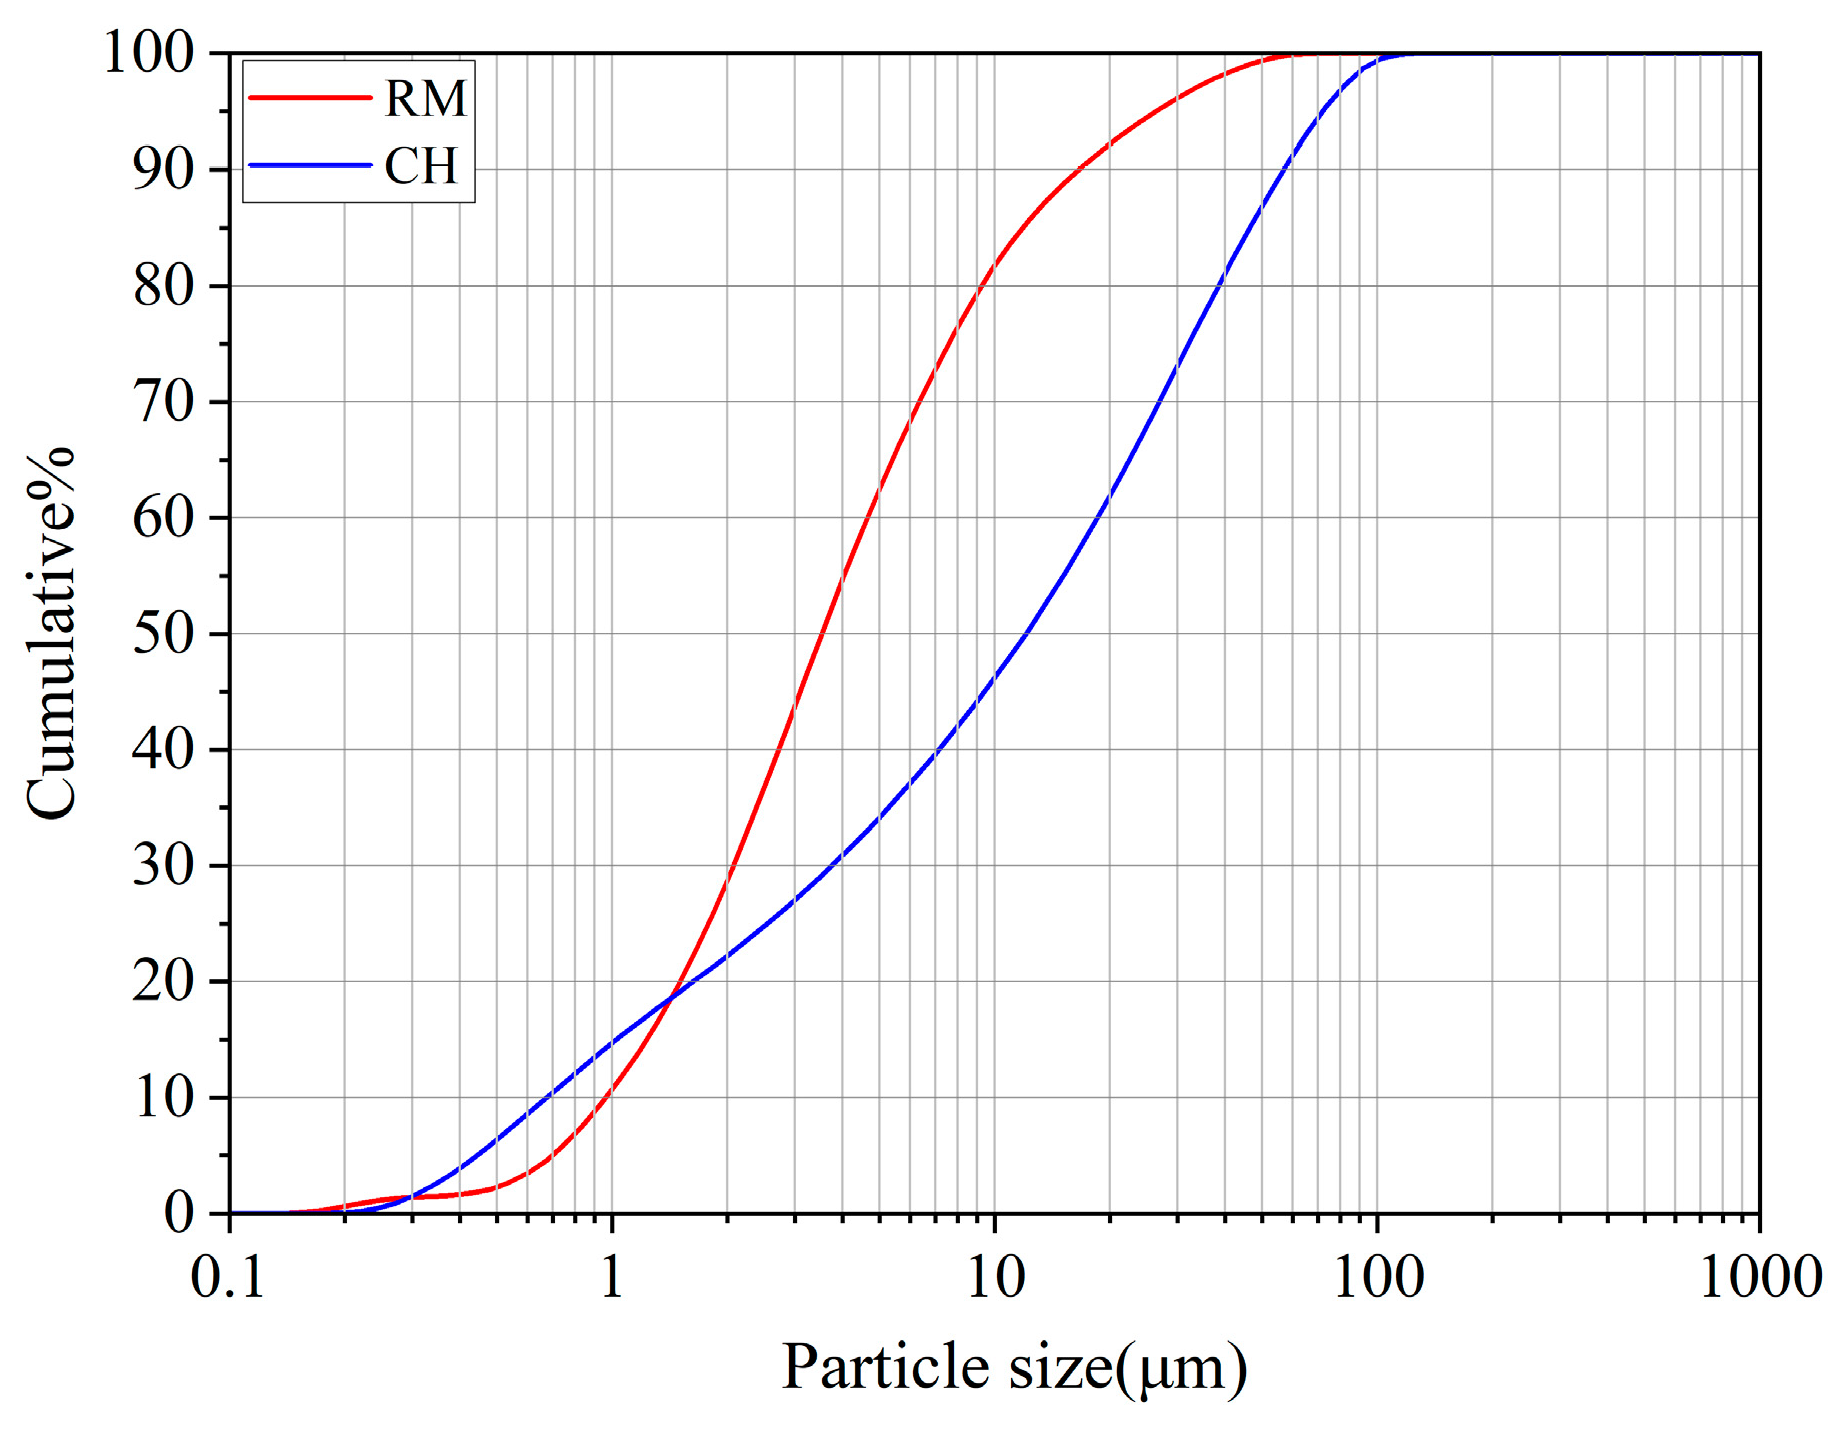
The RM used in the experiment was obtained from a factory in Lvliang, Shanxi. Before the experiment, the RM was crushed and passed through a 1 mm sieve; the chemical components are shown in Table 1. The CH used in the experiment was analytical grade. The particle distribution of RM and CH can be seen in Figure 1.

Table 1.
Main chemical components of RM (%).
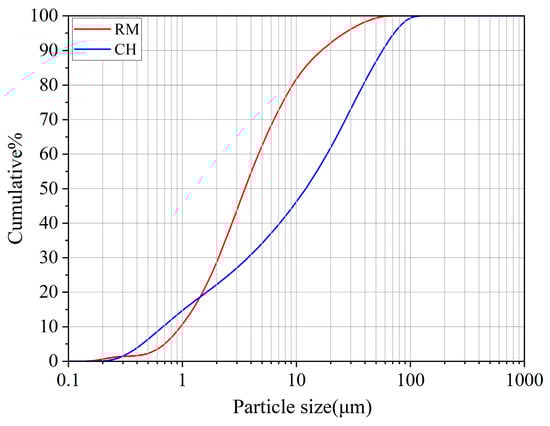
Figure 1.
Particle size distribution of RM and CH.
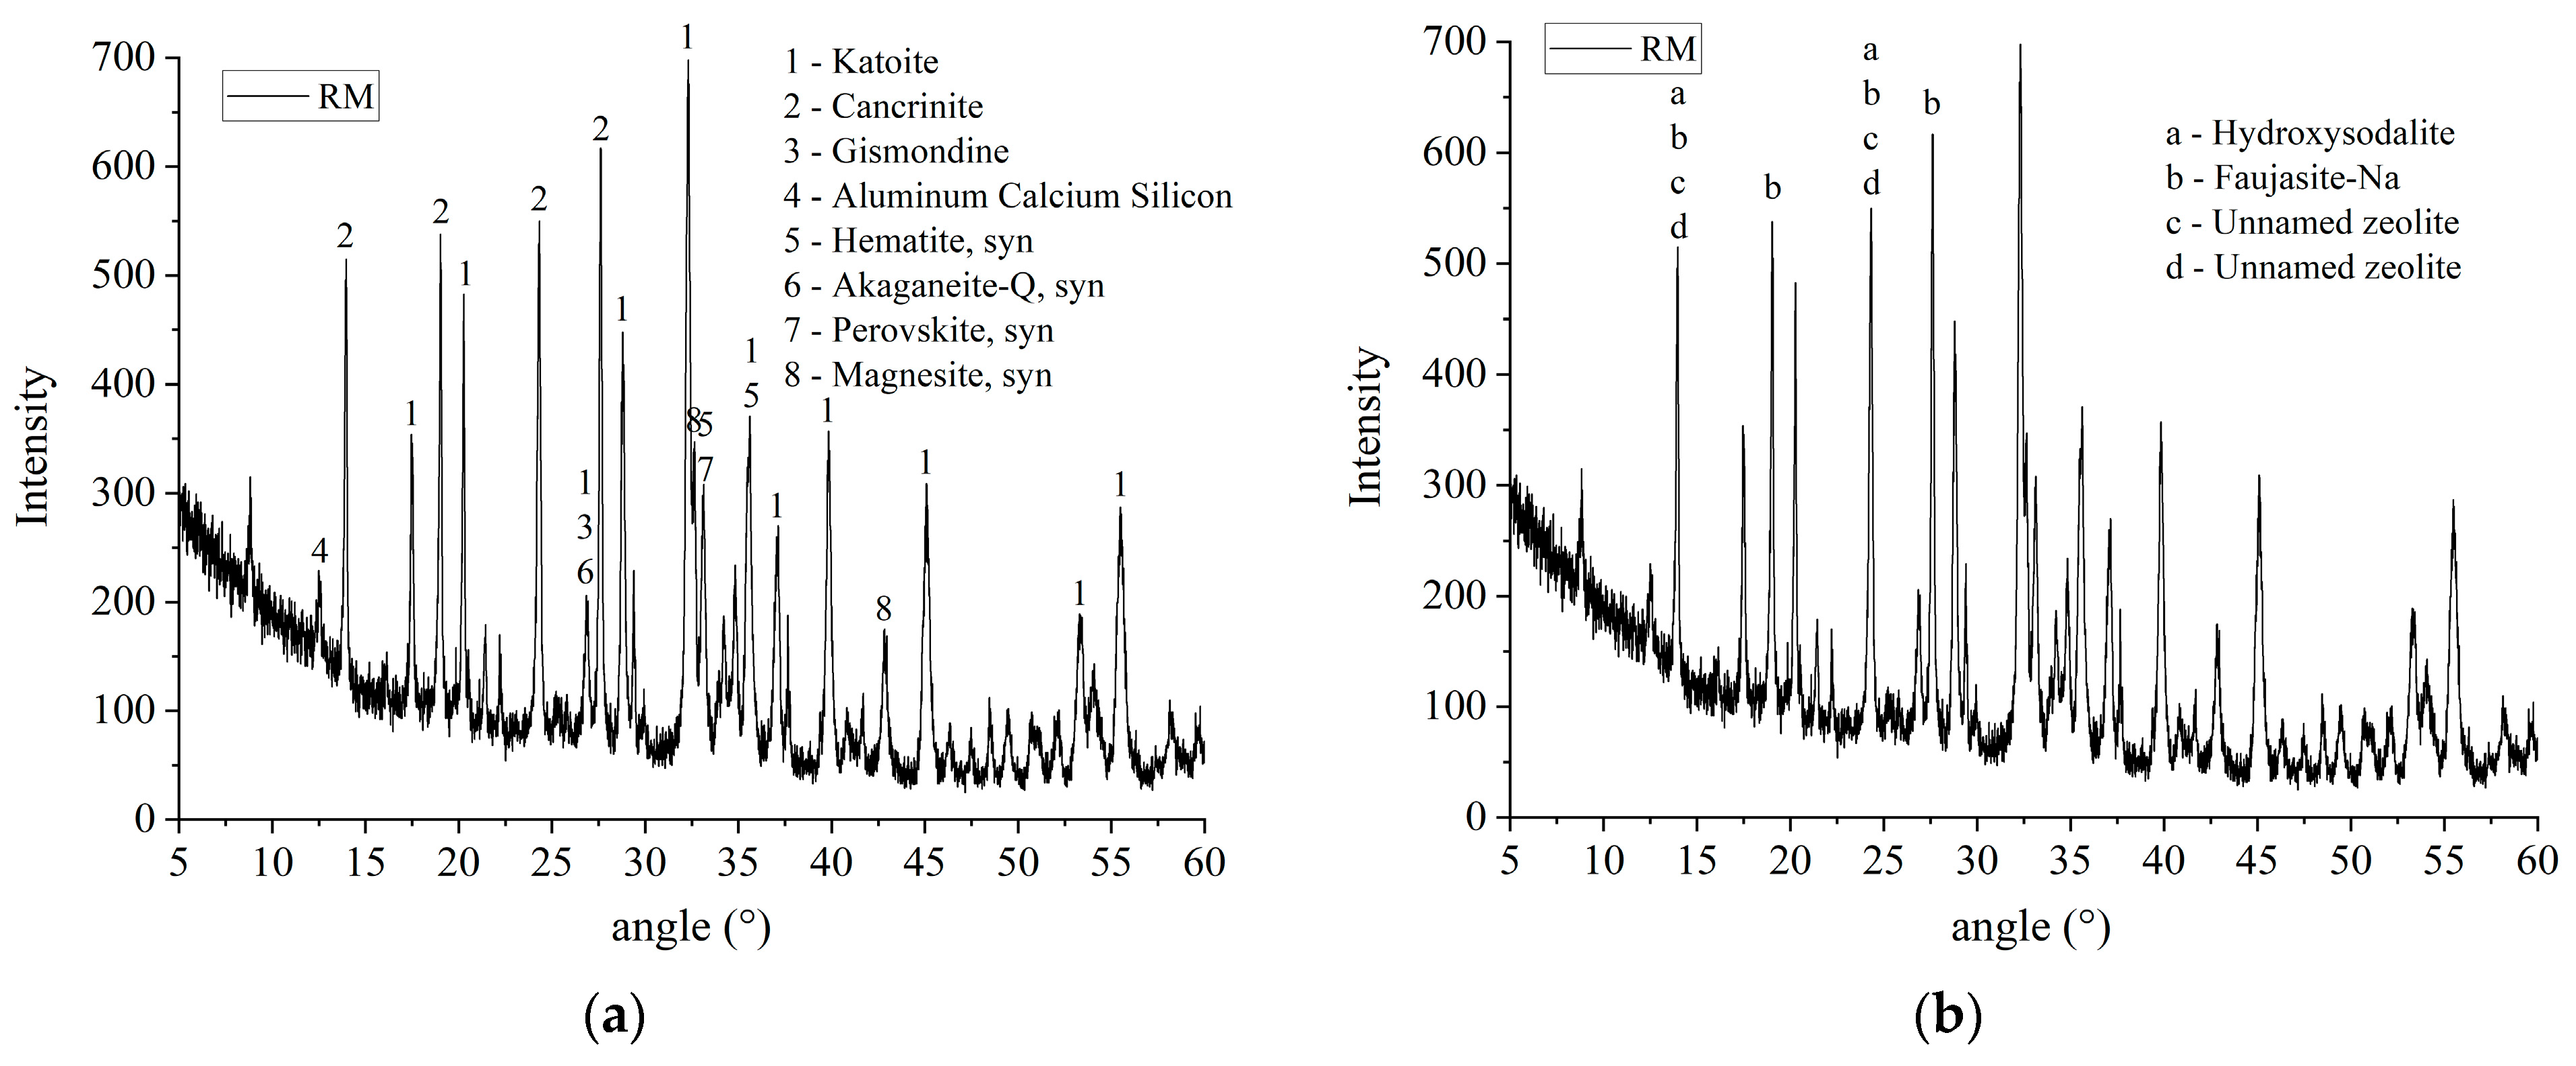
Figure 2 is the XRD pattern of the RM. In Figure 2a, the chemical formulas of minerals 1–8 are Ca3Al2(SiO4)(OH)8, Na6Ca2Al6Si6O24(CO3)2·2H2O, CaAl2Si2O8·4H2O, CaAl2O4·10H2O, Fe2O3, γ-FeO(OH), CaTiO3, and MgCO3. In general, these minerals exhibit inertness. In Figure 2b, the chemical formulas of minerals a-d are Na8(AlSiO4)6(OH)2·4H2O, Na14Al12Si13O51·6H2O, 1.08Na2O·Al2O3·1.68SiO2·1.8H2O, 1.0Na2O·Al2O3·1.68SiO2·1.73H2O. These minerals are produced during the production of alumina.
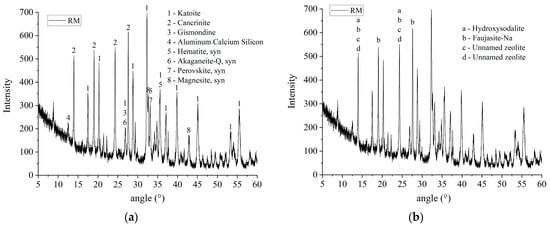
Figure 2.
XRD of RM, (a) Inactive substance in RM, and (b) Active substance in RM.
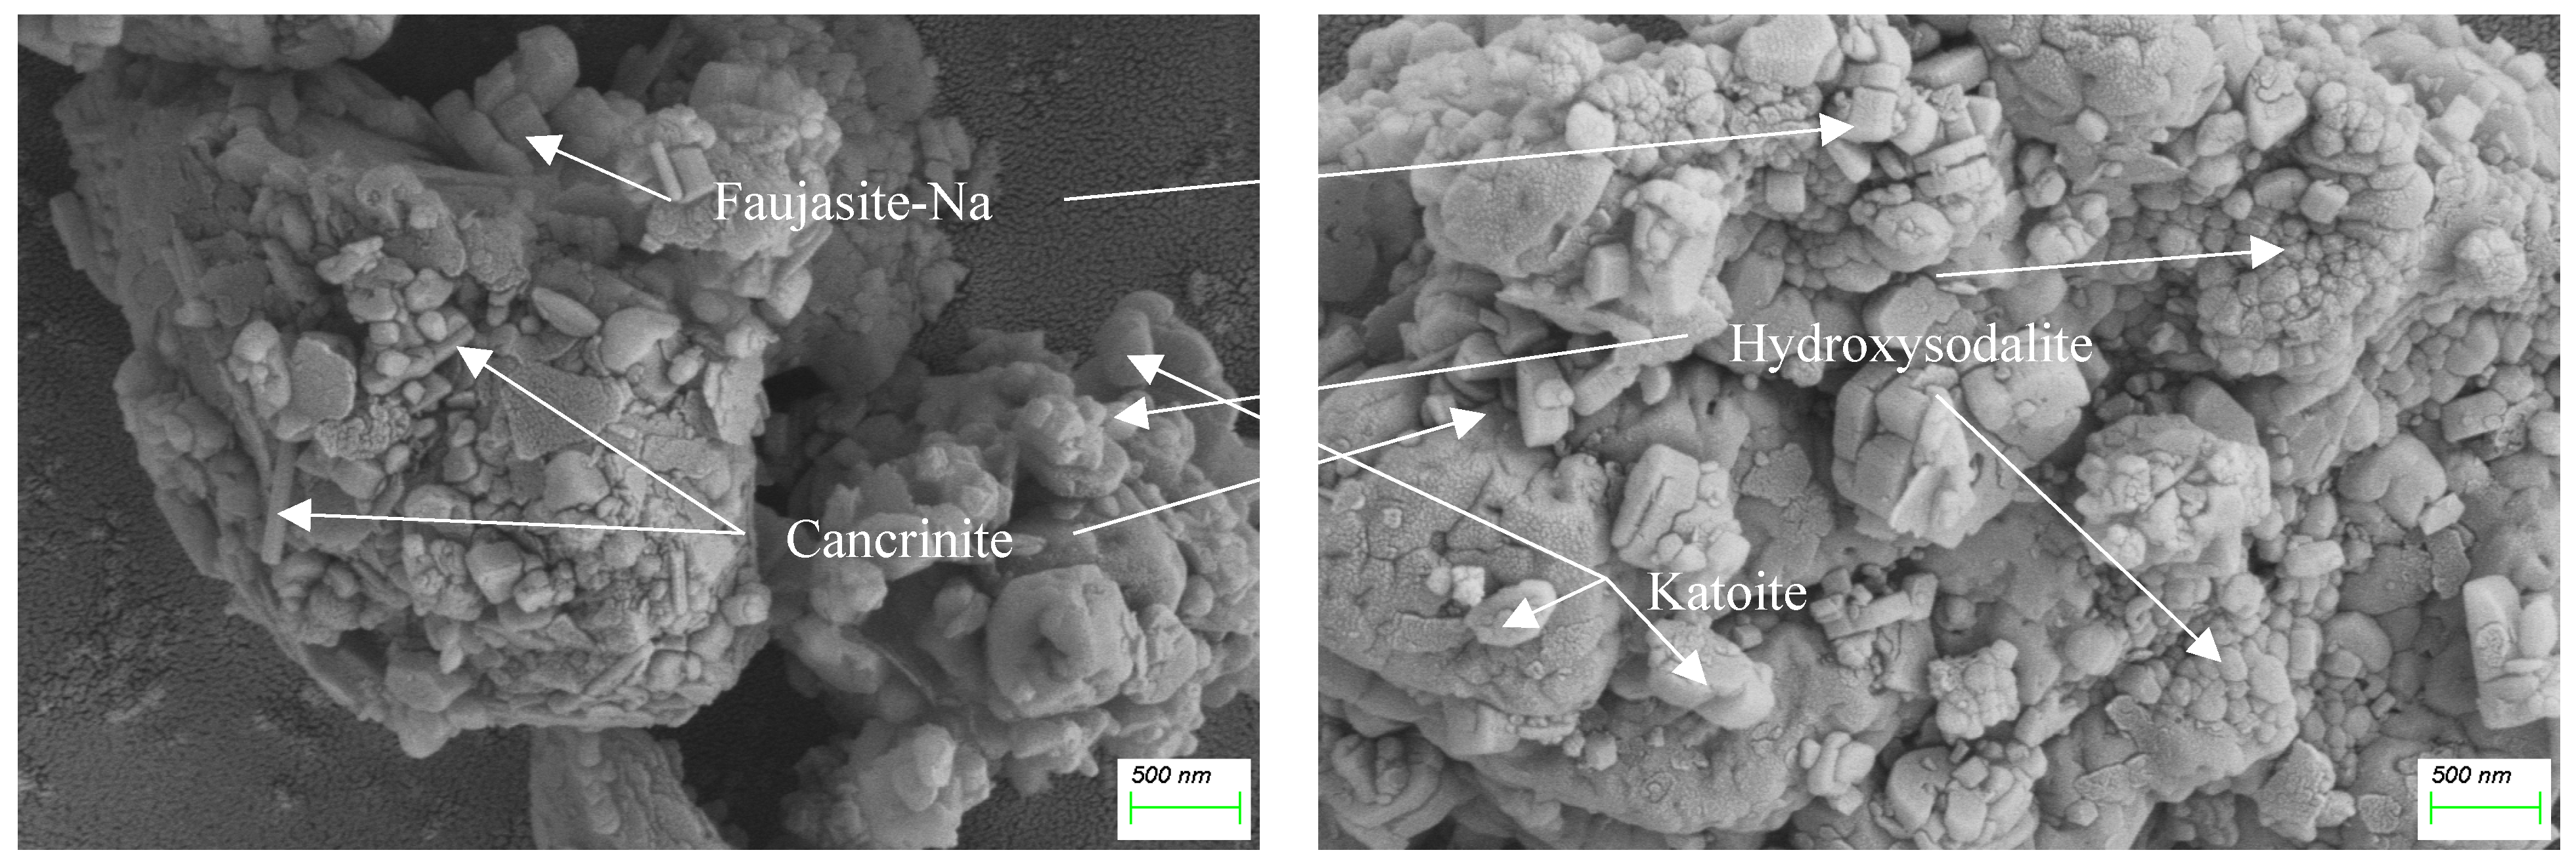
The morphology of the RM was characterized by SEM, as shown in Figure 3. There are four substances that exist in abundance in the RM, and one of them is hydroxysodalite, which forms filamentous spherical aggregates. The spherical particles within these aggregates have uneven agglomeration, and the size of each individual particle is approximately 100 nm [22,23,24]. Faujasite-Na has an octahedral crystal structure with agglomerated features, and the size ranges from 0.5 to 2 μm [25,26]. Katoite is mostly sub-spherical, forming hydrated garnet. Cancrinite is columnar, and its length and thickness vary with crystallinity.
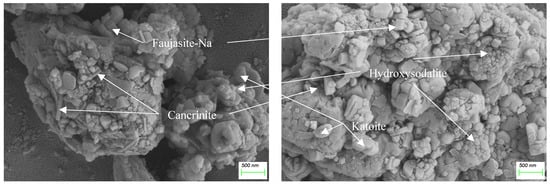
Figure 3.
SEM image of RM.
2.2. Mix Proportions
Based on the RM, the CH content was increased from 6.6% (equivalent to 5% lime content) to 46.2% in equal arithmetic progression with a range of 6.6%, according to a water-to-solid ratio of 0.8. The corresponding mix proportions are shown in Table 2.
Table 2.
Mix proportions of RM incorporating CH.
2.3. Methods
2.3.1. Unconfined Compressive Strength
First, the RM was crushed through a 1 mm sieve using a crusher; an appropriate amount of RM was divided into six portions and weighed in a soil sampler. Then, it was placed in a 105 °C oven and dried, and the moisture content was measured every 8 h. The continuous two measurements with a change of less than 1% were selected, and the moisture content was calculated. According to the “Standard Test Method for Basic Performance of Building Mortars” (JGJ/T70-2009) [27], 40 × 40 × 40 mm3 cubic specimens were prepared. Each group had three parallel samples. A sample group was made of RM, the corresponding percentage of CH, and purified water. First, add RM and CH and stir for 60 s, then add water and stir for 120 s, then quickly stir for 120 s. The mold was vibrated until no bubbles appeared, a plastic wrap was placed on it, and it was placed in a standard curing box (25 ± 2 °C, 90% humidity) at 20 ± 5 °C and 90% humidity for 24 ± 2 h after being prepared. When the sample is cured to the corresponding age, it is removed, and the unconfined compressive strength is measured. The remaining samples are soaked in ethanol to stop the hydration reaction, and the outer layer, about 5 mm thick, is cut off to avoid the influence of demolding oil on material analysis. After the sample is air-dried to complete dryness, take 2–3 mm thin slices and conduct XRD, FTIR, TG-DTG, and SEM tests.
2.3.2. XRD
The XRD test was performed using a Panalytical Empyrean X-ray diffractometer (Panalytical, Almelo, The Netherlands). The radiation source was Cu/Kα, and the scanning range of the diffraction angle 2θ was 5° to 90°, with a wavelength of 0.1504 nm. The test temperature was 23.0 °C, the tube voltage was 45.0 kV, the tube current was 40 mA, the scan rate of the diffraction angle 2θ was 5°/min, and the step size was 0.013°. Different minerals correspond to characteristic diffraction peaks at specific angles, and analyzing the changes in substances during the reaction process can be achieved through testing.
2.3.3. FTIR
The molecular bonds of the samples were characterized using a Nicolet IS10 Fourier transform infrared spectrometer (Thermo Scientific, Waltham, MA, USA). Prior to detection, the samples were dried in a 60 °C environment for 2 h, then crushed and ground. After uniform grinding, they were mixed with KBr (mass ratio of 1:100) and ground again. Finally, the mixture was pressed into thin sheets using a mold for FTIR analysis. The tested wave number range was 400–4000 cm−1.
2.3.4. TG-DTG
TG-DTG was performed using a Netzsch STA 449 F5 instrument (Netzsch, Selb, Germany), with temperature and mass sensitivity of 0.3 °C and 0.1 µg, respectively. The DTG device was heated at a rate of 10 °C per minute in an N2 atmosphere at 30 °C in an Al2O3 crucible, with a maximum temperature of 1000 °C.
2.3.5. SEM-EDS
The microscopic images of the samples were captured using a ZEISS Gemini SEM 300 tabletop scanning electron microscope (ZEISS, Oberkochen, Germany). The working voltage of the Zeiss SEM Gemini 300 can be adjusted from 1 kV to 30 kV. The working distance can be adjusted from 1 mm to 40 mm, and the magnification can be adjusted from 10 to 100,000 times. To prevent charge accumulation on the sample surface, a thin layer of gold was coated on the sample surface using a small ion sputtering device (SBC12) before SEM observation. By observing the microstructure and internal structure of the test sample and testing the element ratios in various parts of the sample, the shape of the product and the process of its variation can be understood.
3. Results and Discussion
3.1. Unconfined Compressive Strength
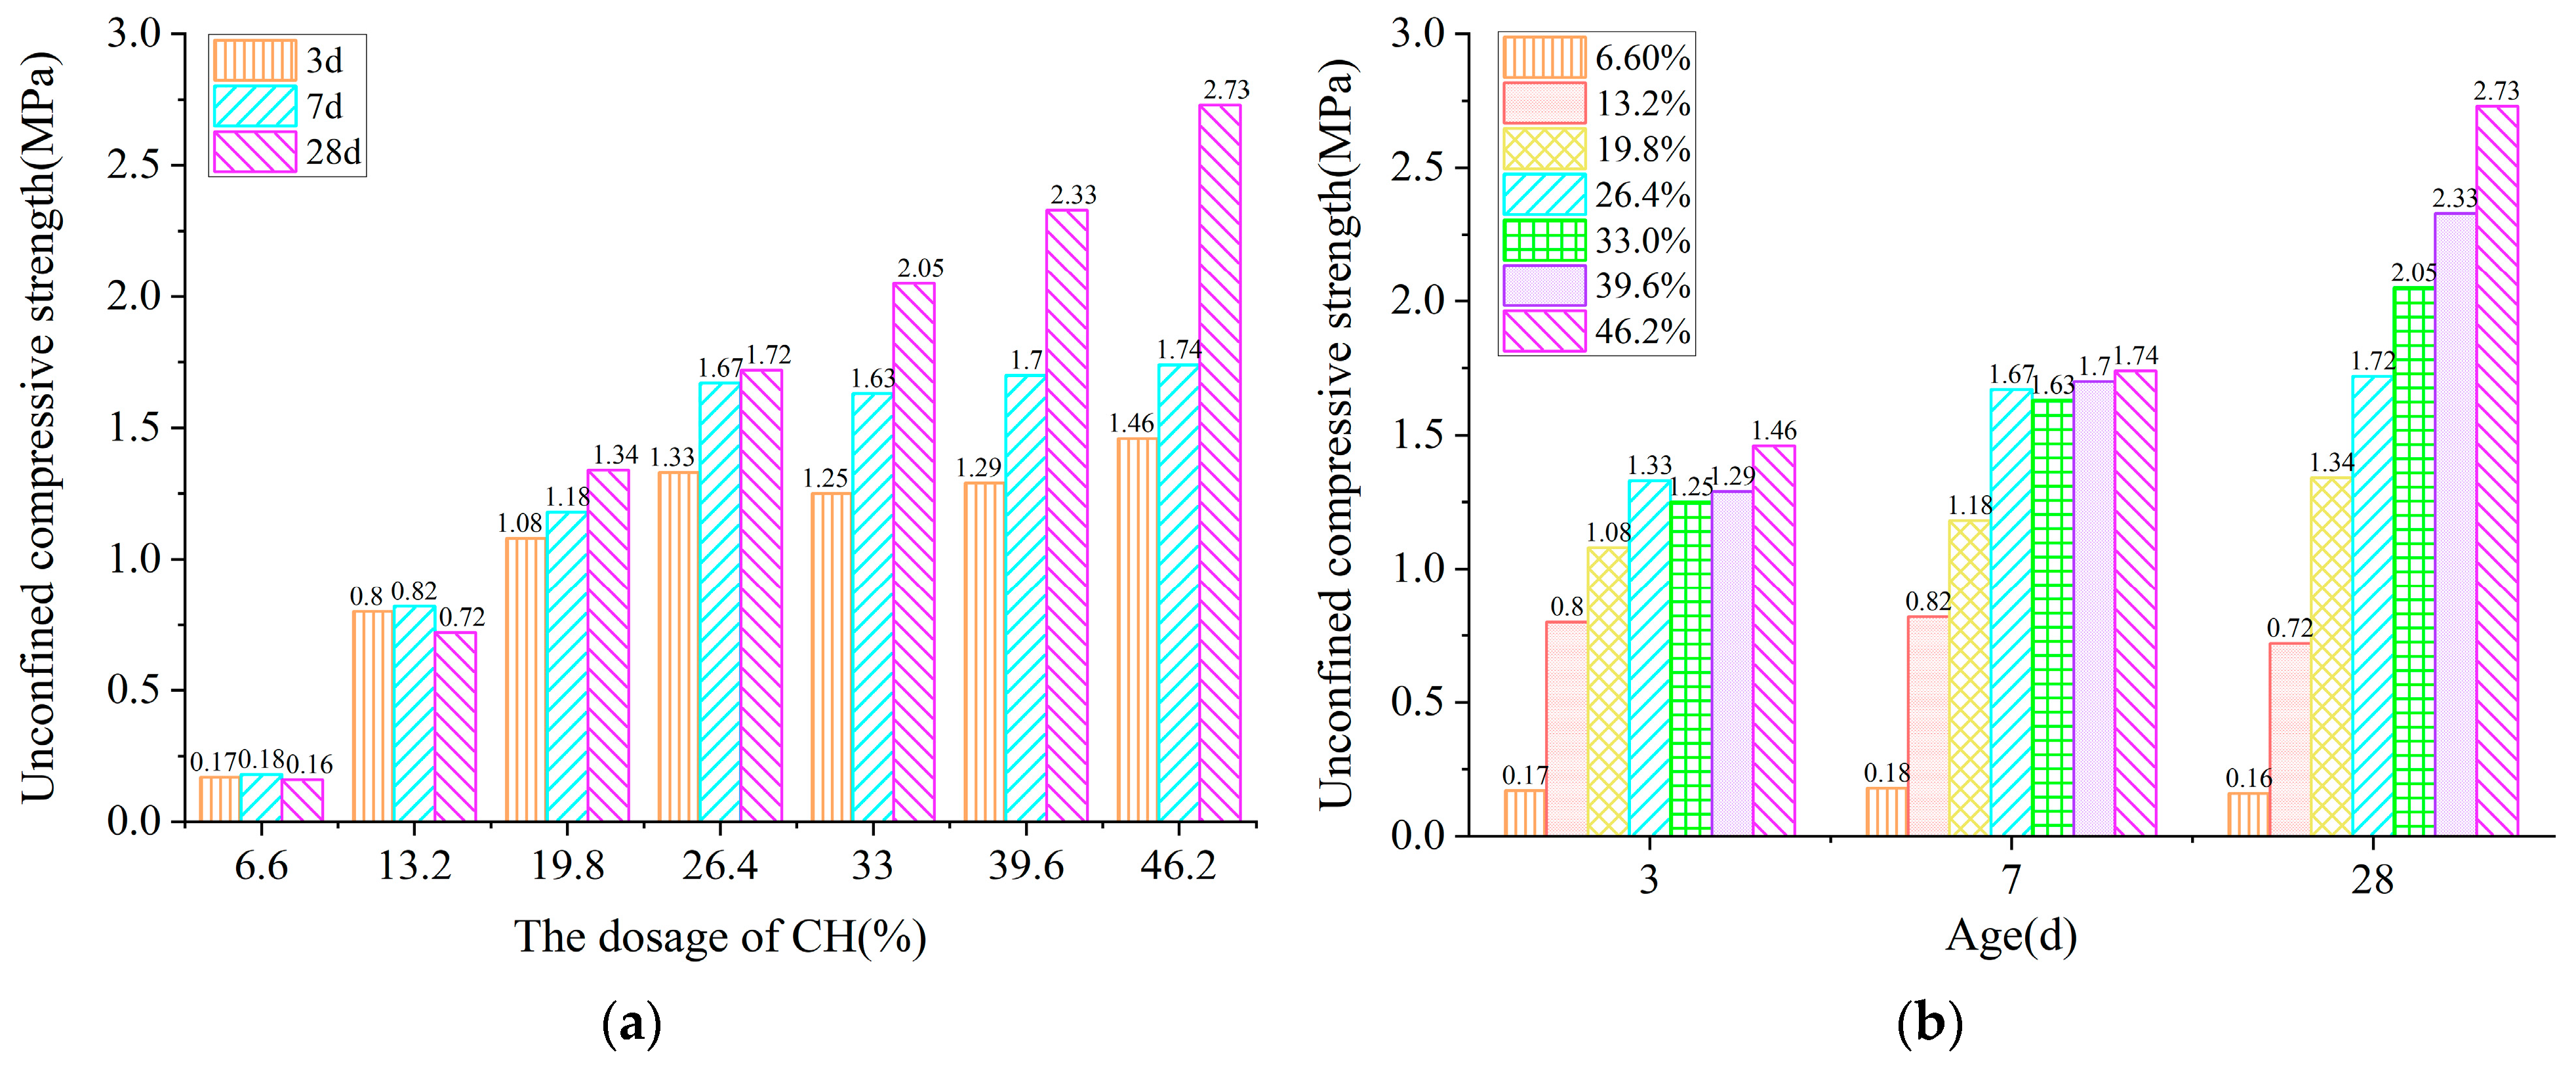
Figure 4a shows the variation of unconfined compressive strength of RMCH at different ages with varying CH content. When the CH content is 6.6% and 13.2%, the unconfined compressive strength of RMCH does not increase with increasing age, indicating that the solidification reaction has already been completed at 3 days. With an increase in the curing age, the unconfined compressive strength of RMCH at 28 days is lower than that at 7 days, possibly due to the lower CH content [28]. At an early age, Ca2+ is depleted, and there are no further products from the solidification reaction, resulting in no continuous increase in the unconfined compressive strength of RMCH. When the CH content is equal to or greater than 19.8%, the unconfined compressive strength of RMCH increases with an increase in curing age at all CH contents. For CH contents between 26.4% and 46.2%, the increase of unconfined compressive strength of RMCH is between 0.28 MPa and 0.41 MPa from 3 to 7 days. With an increase in the CH content, the maximum increase in the unconfined compressive strength of RMCH from 7 to 28 days is 0.99 MPa when the CH content is 46.2%.
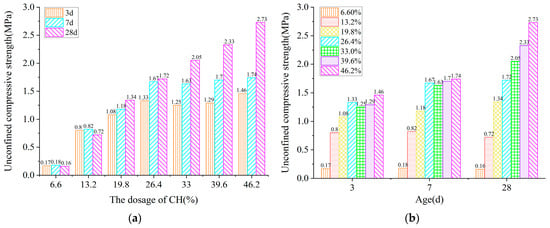
Figure 4.
Effect of CH dosage (a) and age (b) on unconfined compressive strength of RMCH.
Figure 4b shows the variation of unconfined compressive strength of RMCH with different CH contents at different curing ages. At 3 and 7 days, the unconfined compressive strength of RMCH gradually increases with an increase in CH content from 6.6% to 26.4%. When CH content is equal to or greater than 26.4%, the strength remains relatively stable, with a range of 1.63 MPa to 1.74 MPa at 7 days. Unlike at 3 and 7 days, at 28 days, the unconfined compressive strength of RMCH gradually increases with an increase in CH content. For CH contents in the range of 6.6% to 19.8%, the increase in unconfined compressive strength of RMCH is around 0.6 MPa. For CH contents in the range of 19.8% to 46.2%, the increase is in the range of 0.3 MPa to 0.4 MPa. Since the CH doping of more than 26.4%, the increase in strength in the early age of RMCH has slowed down; subsequent analysis will mainly focus on RMCH with a CH content of 26.4%.
3.2. XRD
3.2.1. Reaction of RM Activated Substances
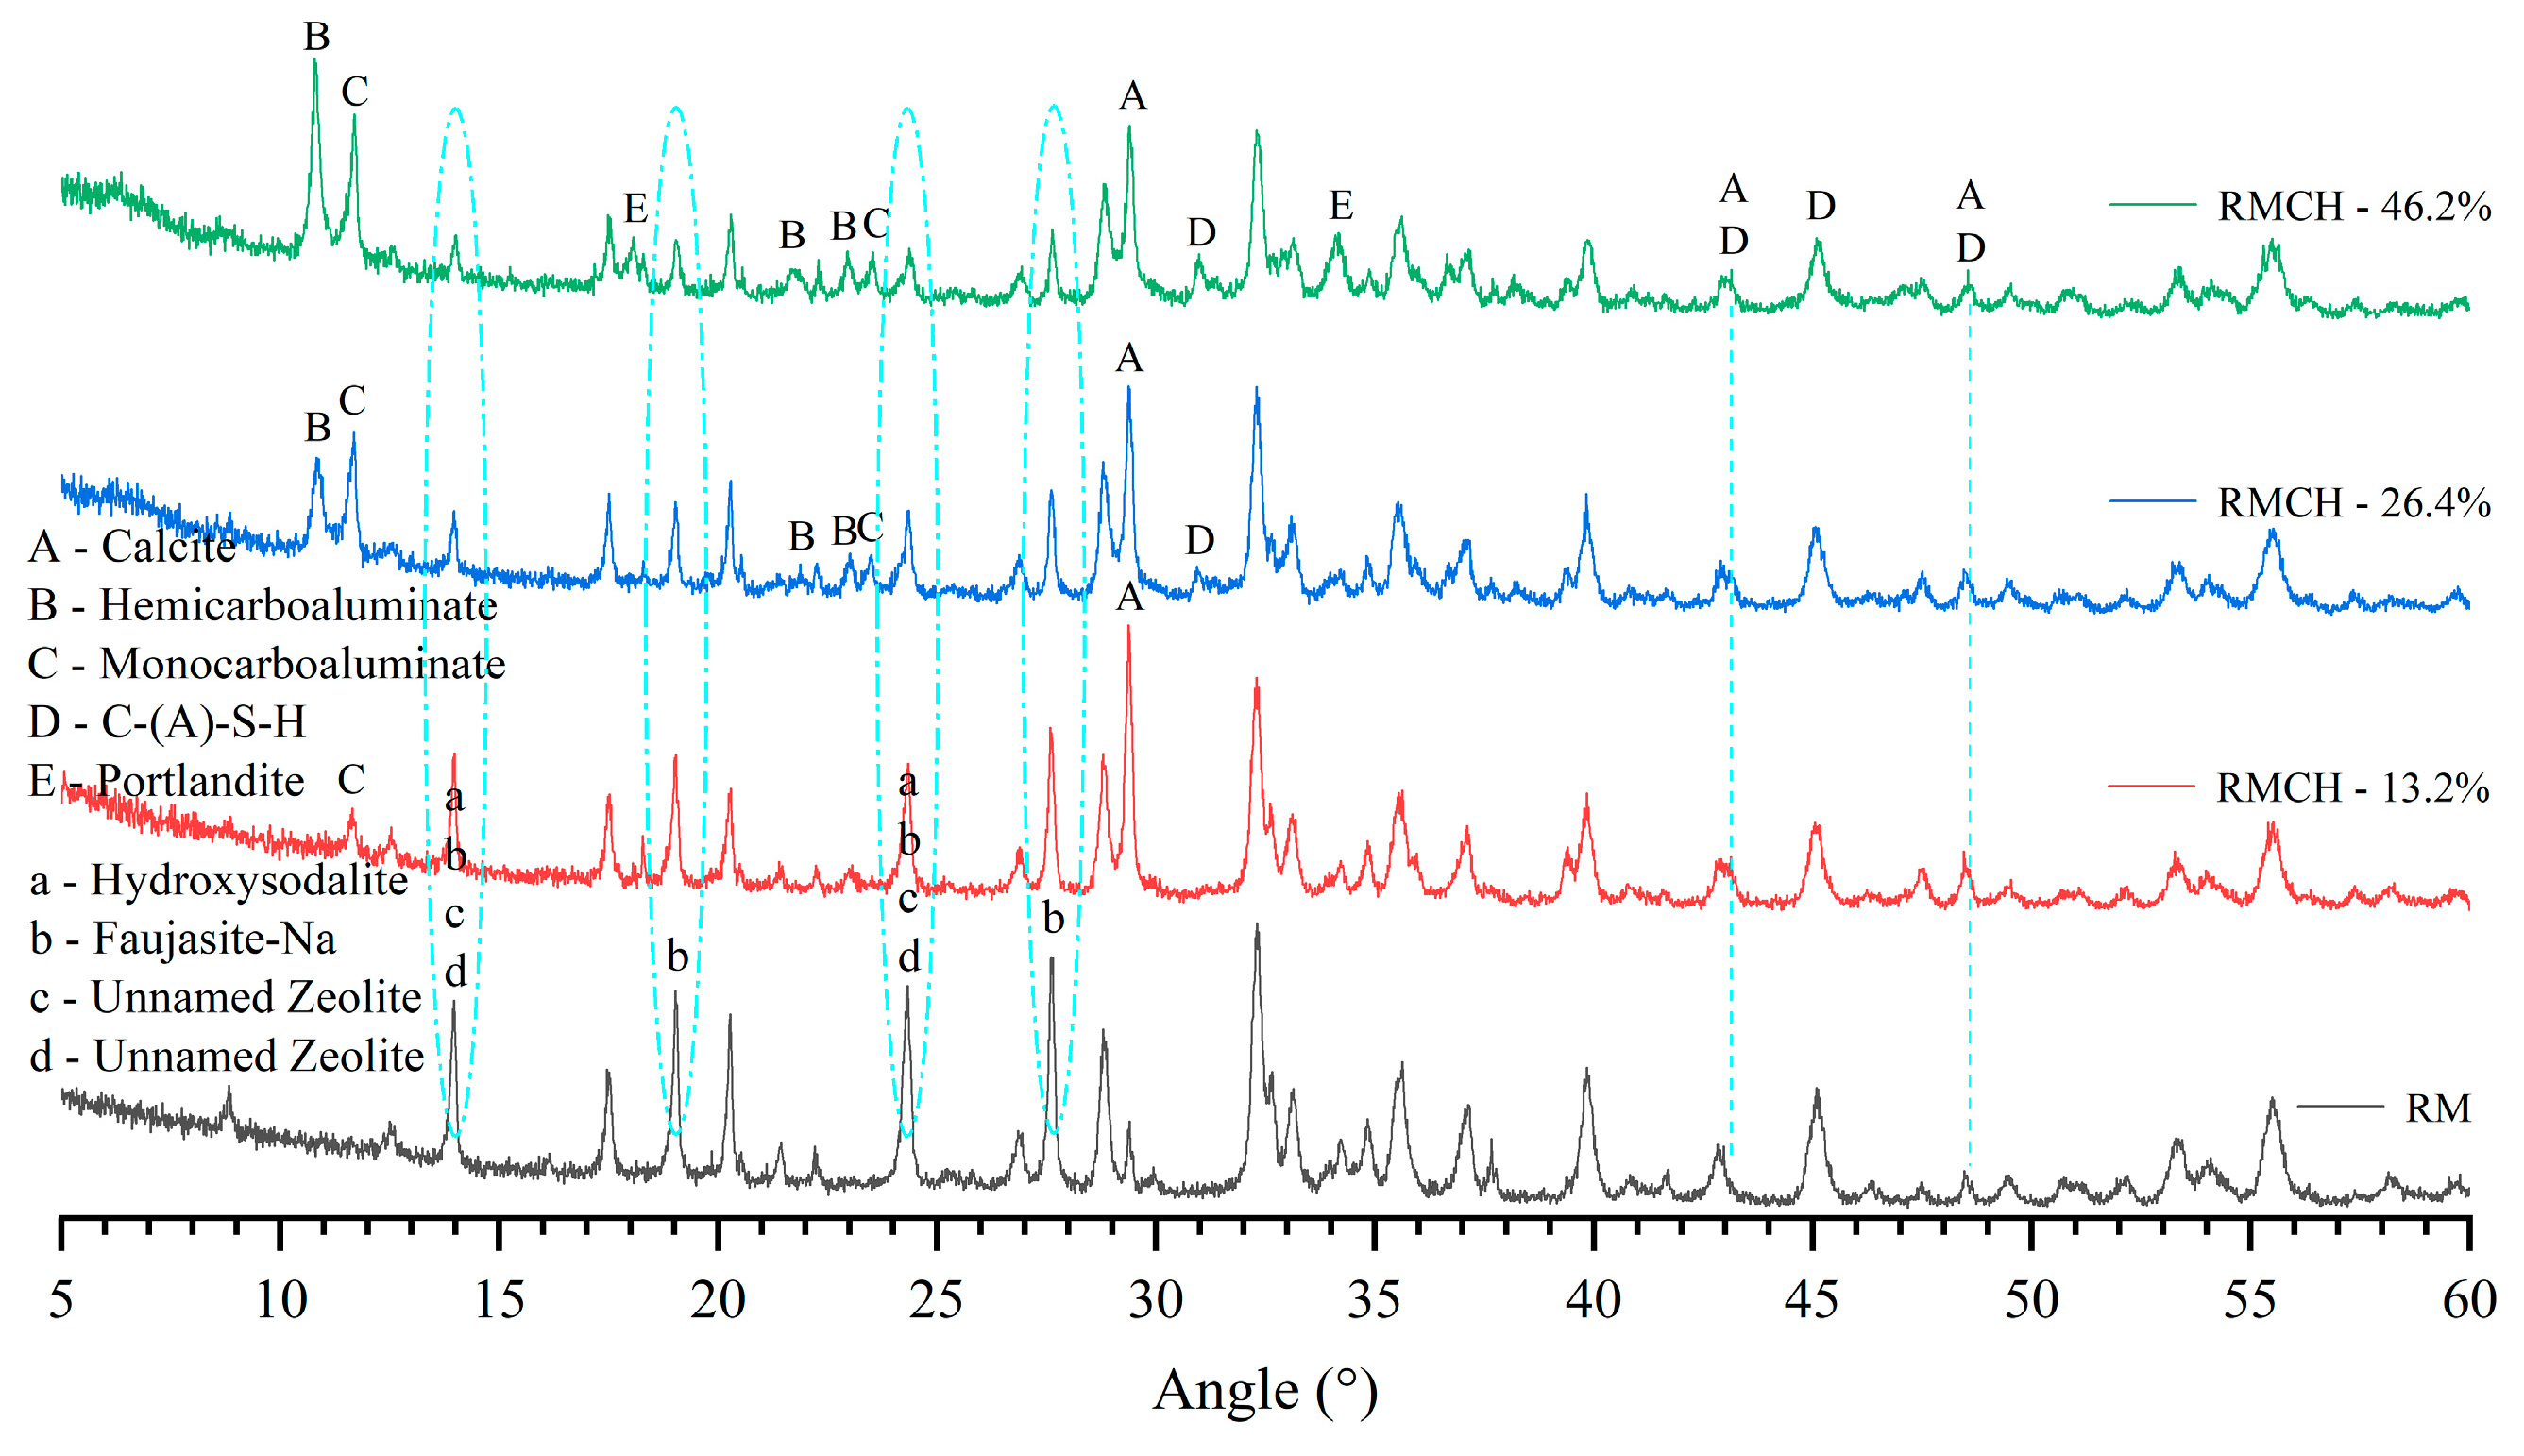
Figure 5 shows the 7-day XRD of RM and RMCH. Mineral a is a variant of sodium silicate slag formed in a sodium hydroxide environment [29,30], with the chemical formula Na8(AlSiO4)6(OH)2·4H2O; the minerals corresponding to the peaks at 13.97°, 19.02°, 24.32°, 27.61° are denoted as b, with the chemical formula Na14Al12Si13O51·6H2O. After 7 days, with the increase of CH, the XRD peaks corresponding to minerals a, b, c, and d gradually decrease rapidly, indicating that these minerals are active components in RM.
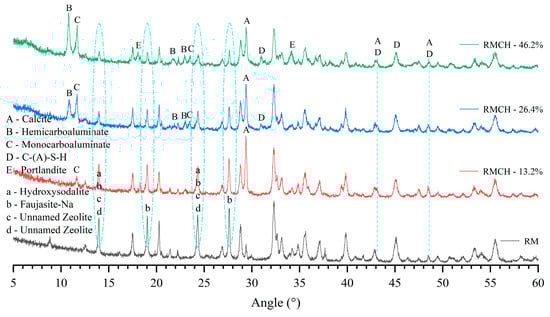
Figure 5.
XRD of RM and RMCH at 7 days.
- (1)
- Hydroxysodalite
Hydroxysodalite is a porous hydrophilic mineral. In the environment of alumina production, an increase in the concentration of SiO32− and Al(OH)4− leads to the precipitation of hydroxysodalite. In the presence of CH, the reaction equation of hydroxysodalite is shown as Equation (1), which generates calcium silicate hydrate(C-S-H), Al(OH)4−, and Na+ in the reaction [31]. These substances provide hydration ions for the subsequent formation of minerals such as hemicarboaluminate, monocarboaluminate, and Calcium aluminate silicate hydrate (C-(A)-S-H), which contribute to the strength of RM solidification.
Na8(AlSiO4)6(OH)2·H2O + Ca(OH)2 → C-S-H + Al(OH)4− + Na+
- (2)
- Faujasite-Na
The chemical formulas of minerals b, c, and d in Figure 5 are Na14Al12Si13O51·6H2O, 1.08Na2O·Al2O3·1.68SiO2·1.8H2O, 1.0Na2O·Al2O3·1.68SiO2·1.73H2O, respectively. Among them, c and d are different forms of b, collectively referred to as faujasite-Na [32]. In the desilication reaction of alumina production, SiO32− and Al(OH)4− react with Na+ to form Na2O·Al2O3·nSiO2·(6-2n)H2O, as shown in Equation (2) [33].
SiO32− + Al(OH)4− + Na+ + H2O → Na2O·Al2O3·nSiO2·(6-2n)H2O + OH−
Equation (2) indicates that in the absence of Ca2+, SiO32−, Al(OH)4− and Na+ can form Na2O·Al2O3·nSiO2·(6-2n)H2O. However, due to the lower solubility of C-S-H compared to sodium aluminum silicate hydrate, in the presence of CH [31], faujasite-Na decomposes to produce C-S-H with even lower solubility while releasing Al(OH)4−.
Na2O·Al2O3·nSiO2·(6-2n)H2O + Ca(OH)2 → C-S-H + Al(OH)4− + Na+
3.2.2. 7d RMCH Solidification Products
Figure 5 compares the 7d XRD of RM and RMCH; it is found that in addition to the diffraction peaks of RM and the diffraction peaks of CH at 18.06° and 34.16°, new diffraction peaks are also generated. This indicates that the RM reacted with CH, and new substances were formed. When the CH content is 13.2% and 26.4%, compared with RM, the CH diffraction peak in RMCH is not obvious, indicating that almost all of the CH in RMCH has reacted at 7d; when the CH content is 46.2%, the CH diffraction peak in RMCH is obvious, indicating that in addition to reacting with RM, there is still a large amount of excess CH in RMCH at 7d, ensuring an excess of Ca2+ and OH− in the system.
- (1)
- Hemicarboaluminate and monocarboaluminate
In the XRD of RMCH at 7d, at 10.78°, 21.68°, and 22.92°, the peaks correspond to Hemicarboaluminate, with the chemical formula Ca4Al2O6(CO3)0.5(OH)·11.5H2O, and at 11.66° and 23.53°, the peaks correspond to monocarboaluminate, with the chemical formula Ca4Al2O6CO3·11H2O. During cement hydration, in the presence of calcite, tricalcium aluminate in cement reacts with CaCO3 to form hemicarboaluminate and monocarboaluminate [34]. However, initially, Hemicarboaluminate is predominantly formed, and after a certain period of continuous hydration, it gradually converts to monocarboaluminate, regardless of the molar volume ratio of CaCO3 (Equation (4)) [35]. The carbonated aluminate phase always transforms from hemicarboaluminate to monocarboaluminate [36].
2(Ca4Al2O6(CO3)0.5(OH)·11.5H2O) + CaCO3 = 2(Ca4Al2O6CO3·11H2O) + Ca2+ + 2OH− + H2O
From Figure 5, it can be observed that with the increase in CH concentration, the peak values of hemicarboaluminate and monocarboaluminate in RMCH exhibit different variations. When the CH content is 13.2%, only a lower peak value of monocarboaluminate appears at 11.66° in RMCH. The corresponding peaks of hydroxysodalite and faujasite-Na show a limited decrease compared to RM (with 0% CH content). This indicates that when the CH content is low, fewer hydration products are generated in the system, and a smaller amount of Al(OH)4−, which is formed by hydroxysodalite hydration (Equation (1)), reacts with CaCO3 to produce a small amount of Hemicarboaluminate (Equation (5)), which quickly converts to monocarboaluminate. When the CH content is 26.4% and 46.2%, with the increase in CH content, the peak value of Hemicarboaluminate (B) at 10.78° increases, and the corresponding peak values of active substances (a-d) decreases, indicating an increase in the generation of Al(OH)4− with the increase in CH content, resulting in an increase in the formation of Hemicarboaluminate, which corresponds to the strongest peak in RMCH with 46.2% CH content. The formation of Hemicarboaluminate consumes CaCO3 (Equation (4)). When the CH content is 46.2%, the consumption of CaCO3 is the most, and the remaining CaCO3 is the least, corresponding to the weakest peak (A).
7Ca2+ + 4Al(OH)4− + CaCO3 + 11H2O + 10OH− = 2Ca4Al2O6(CO3)0.5(OH)·11.5H2O
- (2)
- C-(A)-S-H
As shown in Figure 5, the peaks at 31°, 43.5°, and 48.7° represent C-S-H [37,38,39], where the peak intensity increases with the addition of CH. According to Formulas (1) and (3), CH contributes to the decomposition of hydroxysodalite and faujasite-Na. The peak corresponding to C-A-S-H appears at 45.5° [40], but it is difficult to clearly distinguish due to the gel-like state of the product and the presence of Katoite, which is abundant at 45.5° in the RM. In RMCH, the decomposition of hydroxysodalite and faujasite-Na generates C-S-H and Al(OH)4−, and then reacts to produce C-(A)-S-H.
- (3)
- Calcite
In the XRD of RMCH at 7d, the peak at 29.40° corresponds to calcite, with a chemical formula of CaCO3. During the sample preparation process, a large amount of CH comes into contact with water during stirring, dissolves in water to form Ca2+ and OH−, and in the subsequent curing process, CO2 continues to be absorbed by the pore water, generating CO32−, and both react to form CaCO3.
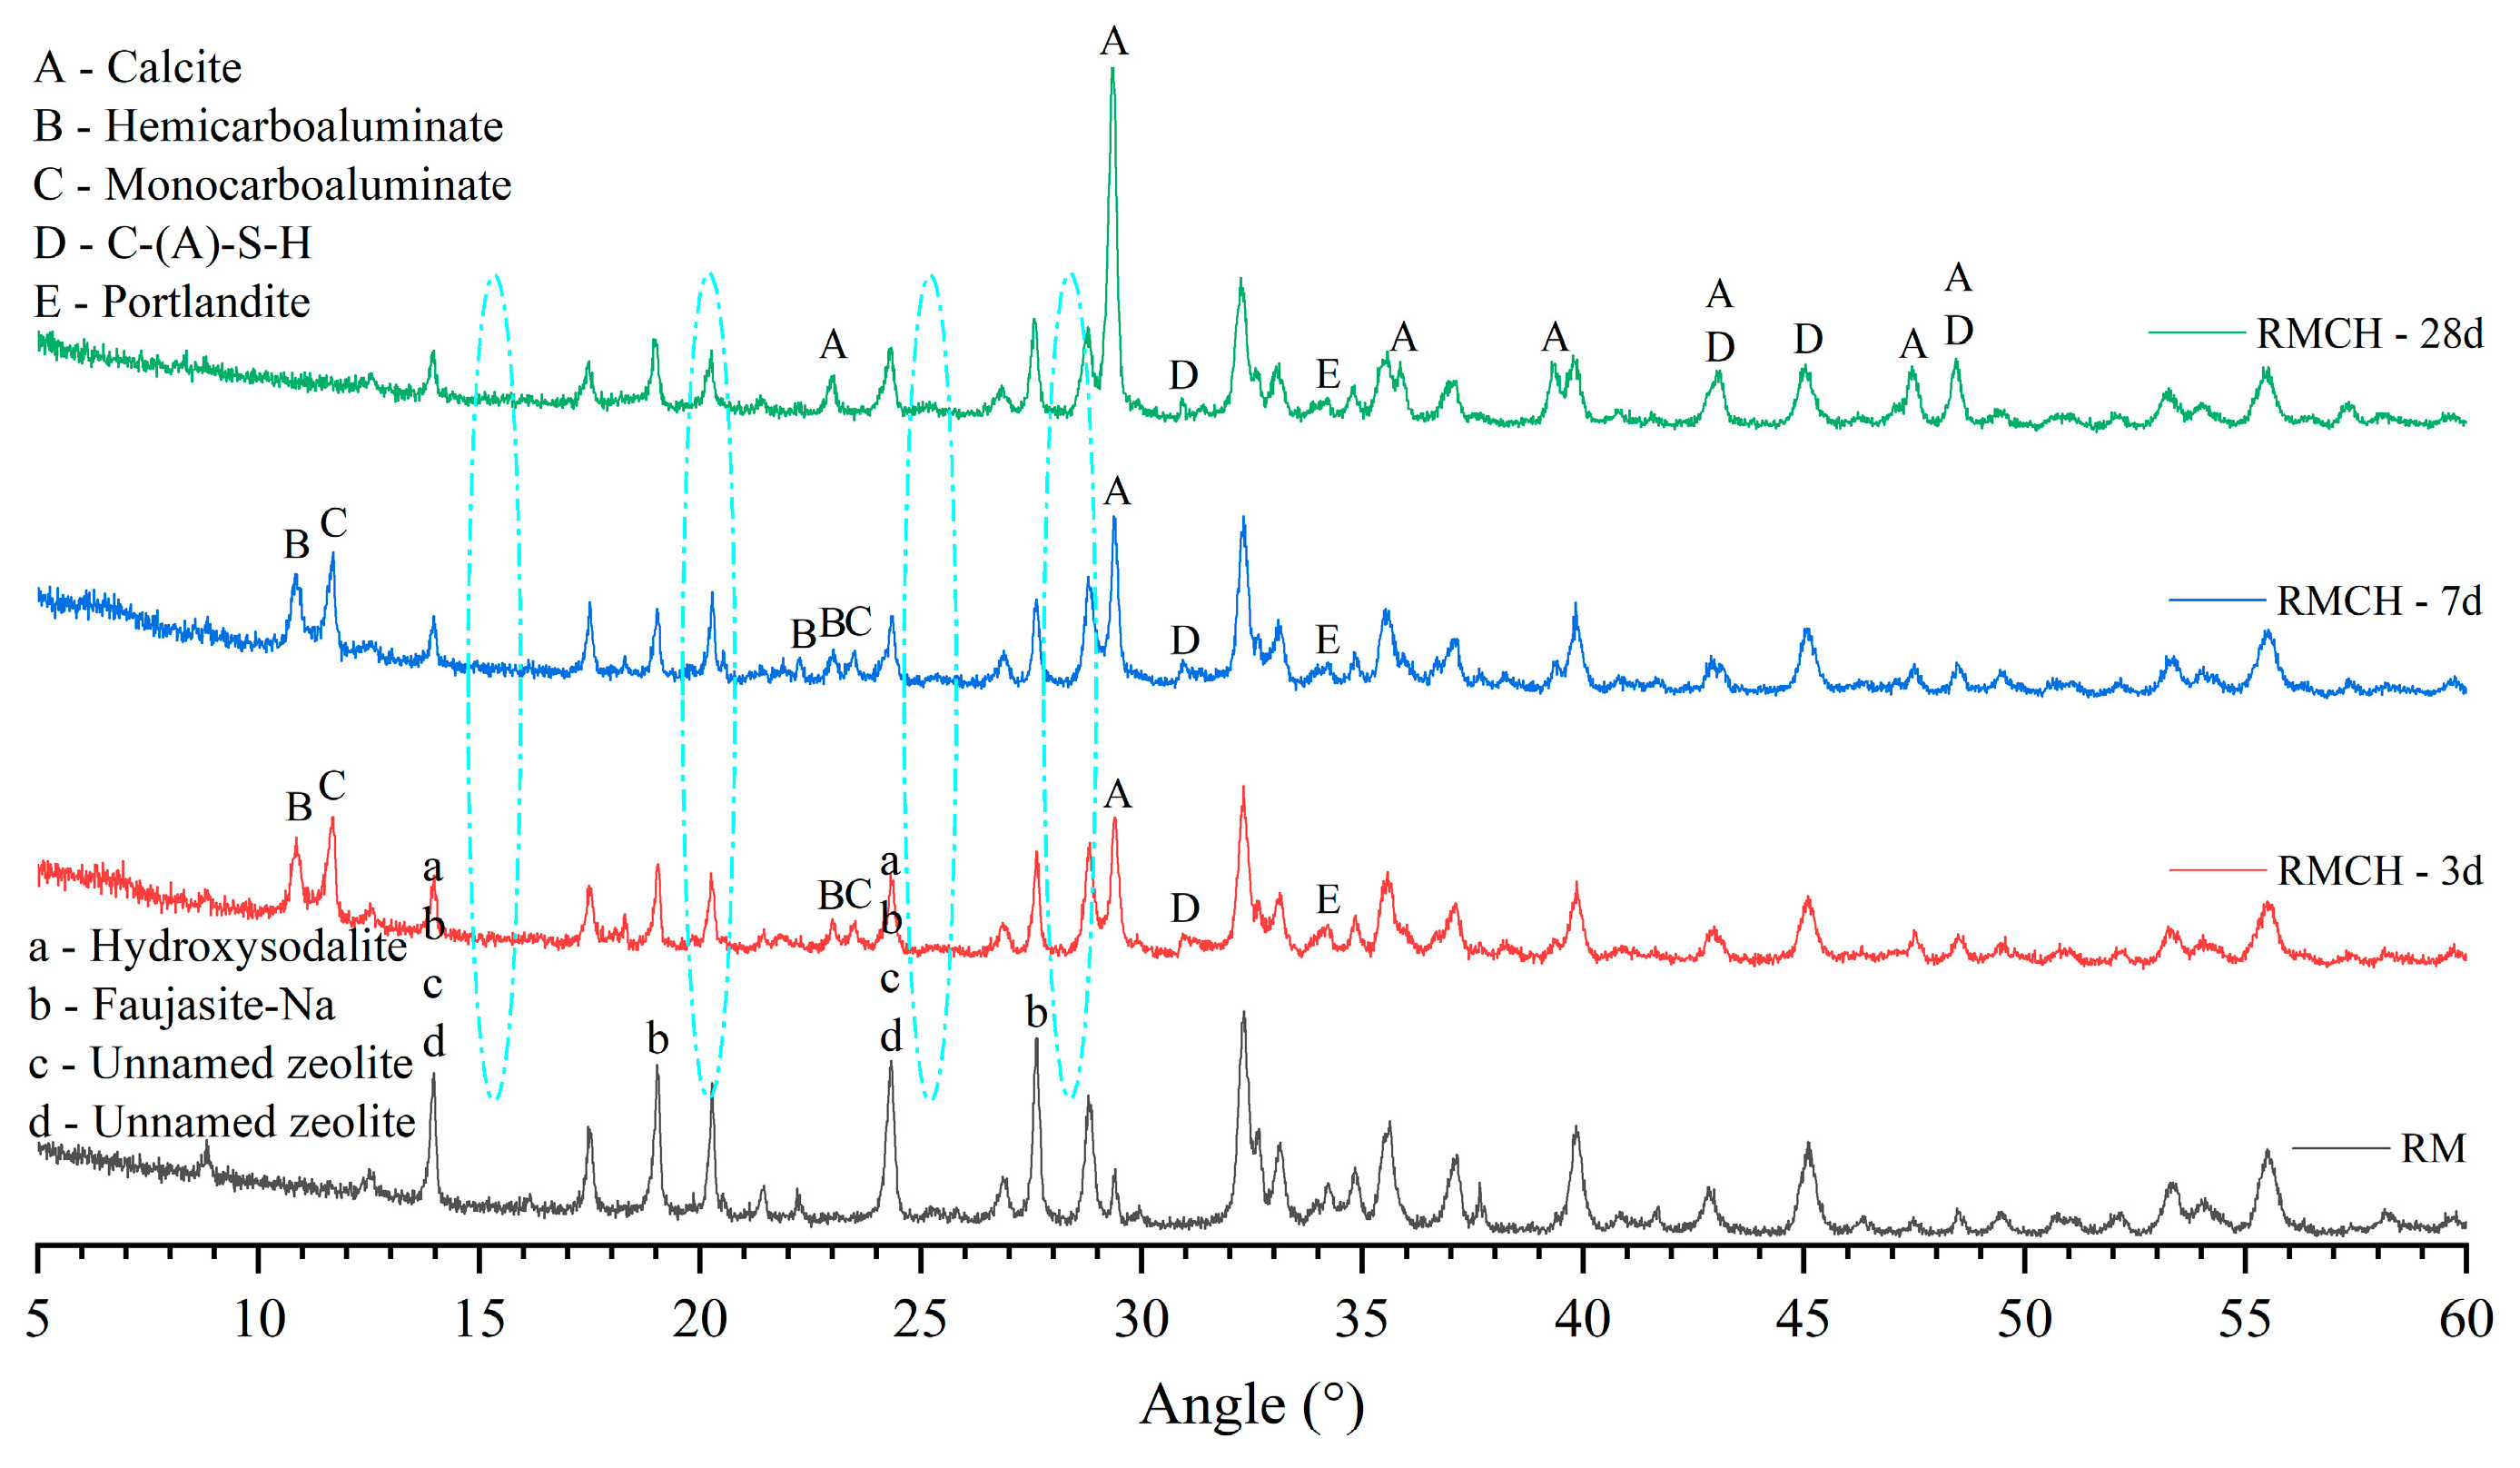
3.2.3. Different Age of RMCH Curing Products
Figure 6 shows the XRD of RM and RMCH incorporating 26.4% CH content at 3, 7, and 28 days. It can be seen from the figure that the peak values of minerals a-d significantly decrease at 3d and 7d, but there is little change after 7d, indicating that the reaction of active substances in the RM mainly occurs before 7d. At 28d, the hemicarboaluminate and monocarboaluminate represented by peaks B and C disappear. This is because Hemicarboaluminate first converts to monocarboaluminate in a high CaCO3 environment and then reacts with CO32− in an alkaline environment to decompose into calcite or vaterite, as well as amorphous alumina-containing minerals [41]. Figure 6 also shows that the intensity of the calcite peak (A) at 28d increases significantly, indicating that calcite continues to form, possibly due to the decomposition of monocarboaluminate. With an increase in the curing age, the peak values of C-(A)-S-H show little variation, with some peaks overlapping with calcite and katoite. In an environment of continuous curing, the peak intensity of Portlandite at 7d is very weak, indicating that Portlandite has already participated in the solidification of minerals in the RM to a large extent at an earlier age or reacted with CO2 to form CaCO3.
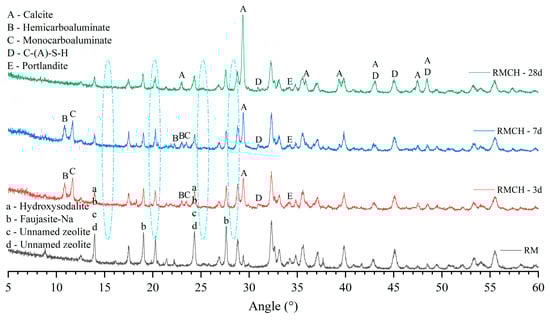
Figure 6.
XRD of RM and RMCH with 26.4% CH content at 3, 7, and 28 days.
3.3. FTIR
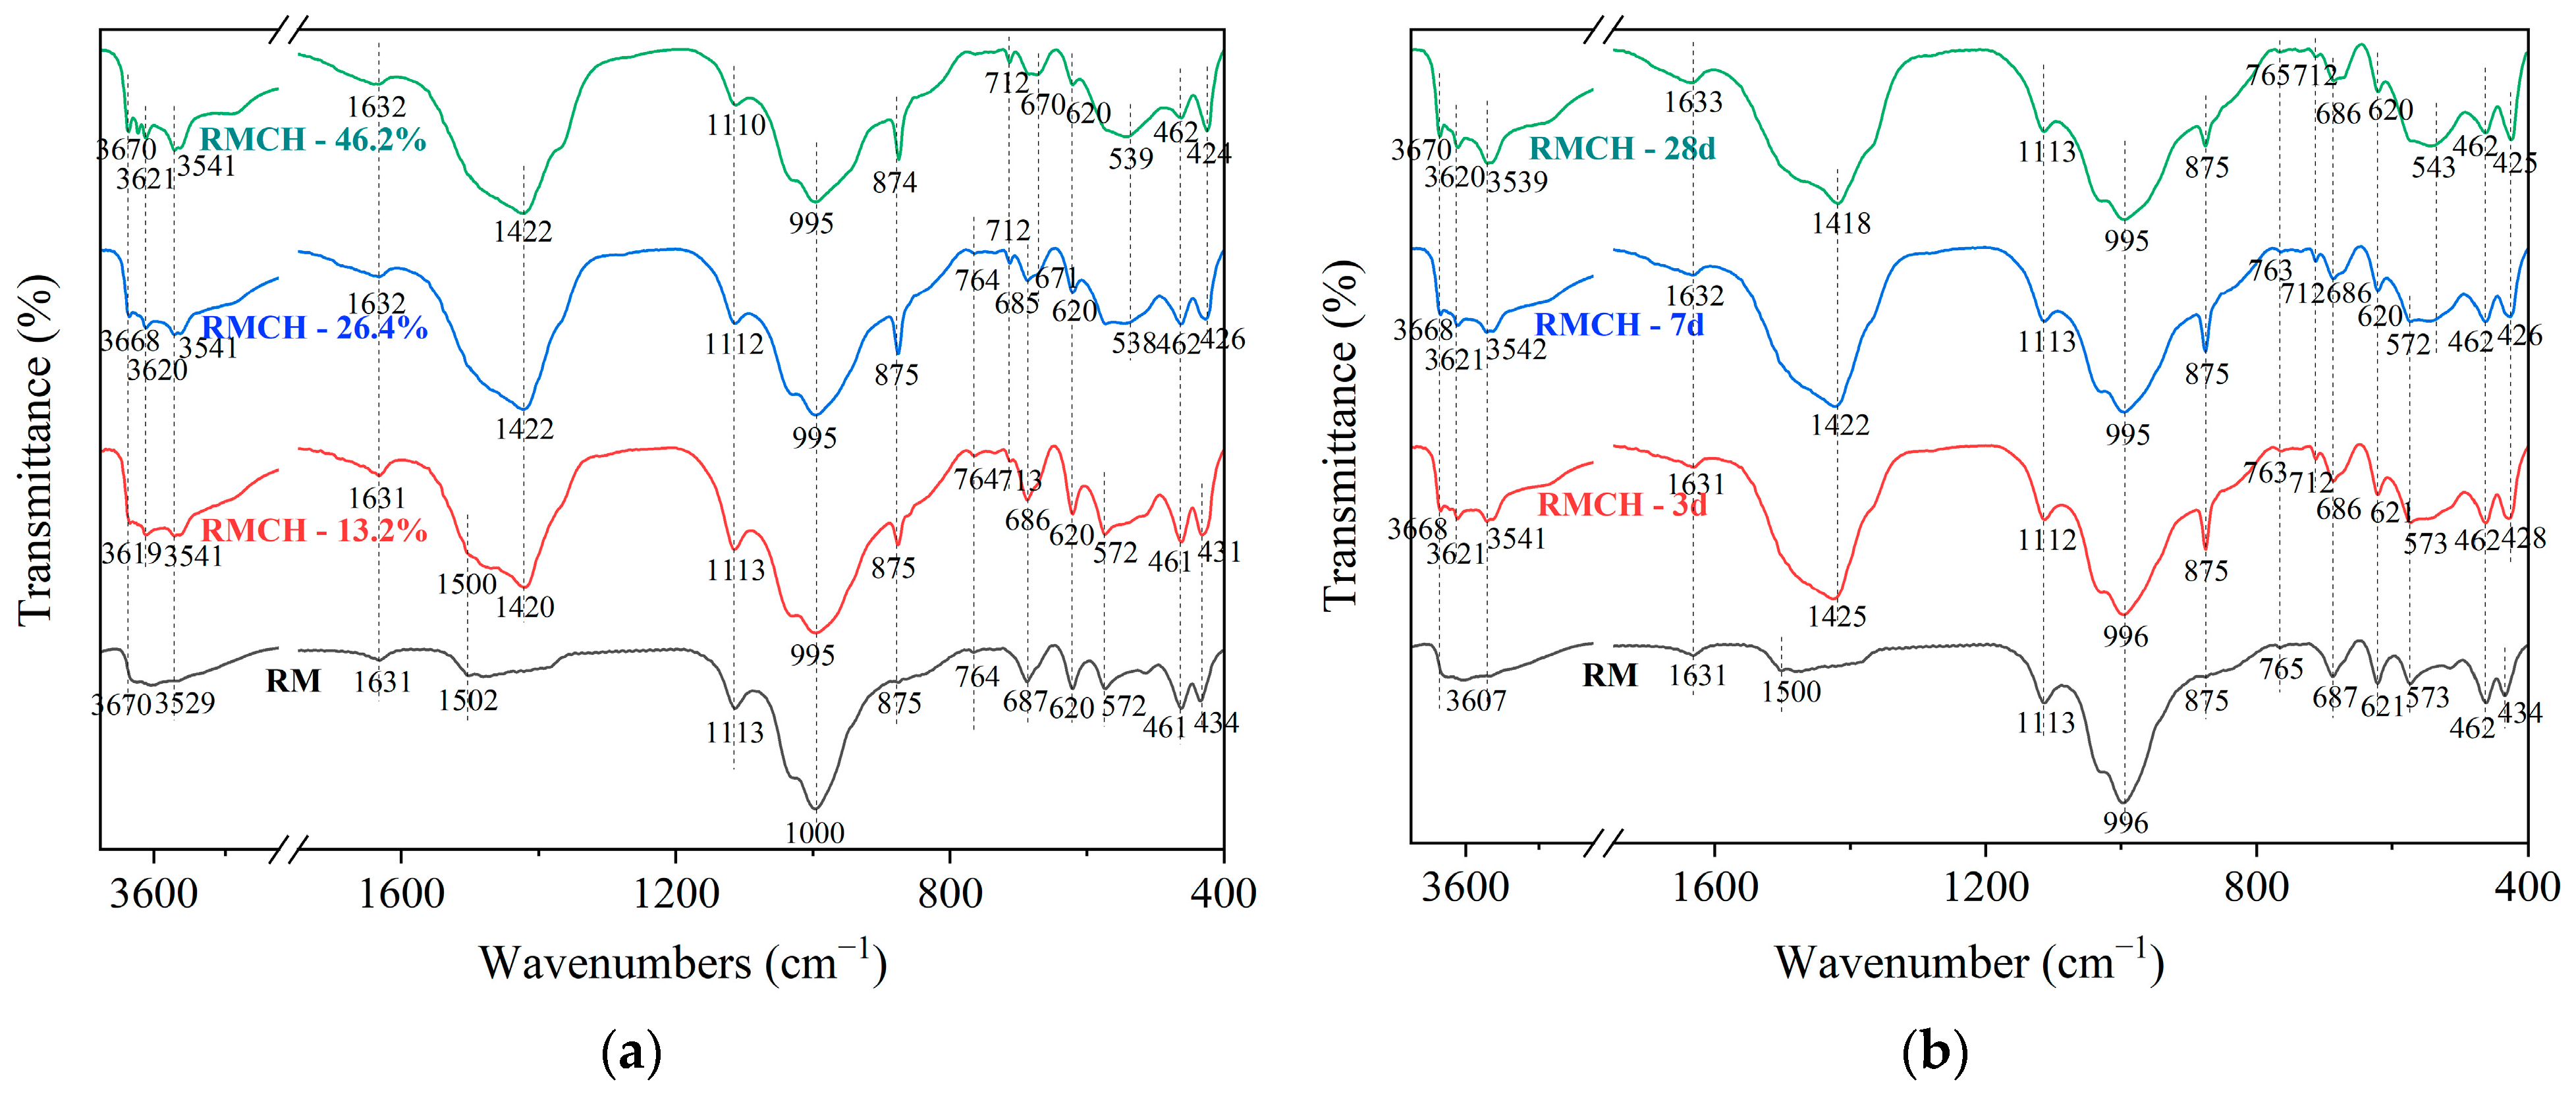
The FTIR spectrum shows the absorption peaks of vibration characteristics of chemical bonds. Figure 7 presents the FTIR spectra of different CH content at 7 days and different aging periods for RMCH incorporating 26.4% CH.
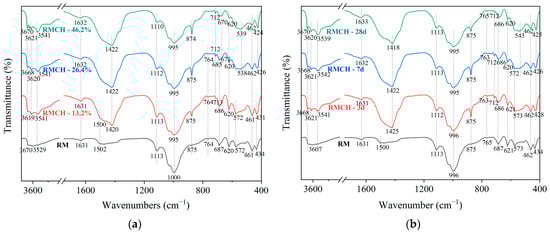
Figure 7.
FTIR of RMCH with different CH content at 7 days (a) and different ages incorporating 26.4% CH (b).
From Figure 7a, it can be observed that the bands between 3670 and 3529 cm−1 and 1631 cm−1 are caused by O-H stretching vibrations, indicating the presence of O-H bonds in the active materials of RM [42]. Comparing the vibrational characteristic peaks of RMCH and RM, it can be seen that with the increase in CH content, the vibrational characteristic peaks of RMCH are enhanced. The peaks at 3670 cm−1, 3620 cm−1, and 3529 cm−1 correspond to the bending and stretching vibrations of water molecules’ O-H bonds in hydrated products. The peaks at 3620 cm−1 and 3541 cm−1 correspond to the stretching vibrations of Al-OH bonds [43]. The peak at 1631 cm−1 is attributed to H2O trapped within the aluminum silicate structure [44]. The absorption peak near 1631 cm−1 is attributed to the asymmetric stretching and bending vibrations of H-O-H bonds, indicating the presence of interlayer water, mainly derived from C-(A)-S-H gel [45].
At 1502 cm−1, the peak represents the stretching and bending vibrations of C-O bonds in CO32−. The absorption band at 764 cm−1 is caused by the bending vibrations of CO32− combined with the main channel phase of Cancrinite [46].
The peak at 1113 cm−1 is attributed to the asymmetric stretching of the Si-O-Al framework. The peaks observed at 687 cm−1, 620 cm−1, and 572 cm−1 are due to the symmetric stretching of the Si-O-Al framework [47,48]. The peak at 434 cm−1 represents the bending vibration of O-Al(Si)-O. It can be seen that the absorption peaks of RMCH with CH addition are weaker than those of RM, indicating that CH facilitates the reaction of active materials in RM. hydroxysodalite and faujasite-Na all have Si-O-Al and O-Al(Si)-O bonds.
Al-O-Al bonding was found at 671 cm−1, and a dense band attributed to Al-O bending vibration was observed at 538 cm−1 and 424 cm−1. These peaks were present in RMCH-26.4% and RMCH-46.2%, indicating that high CH content facilitates the formation of these new substances [49]. Al-O-Al and Al-O bonds exist in hemicarboaluminate and monocarboaluminate. Additionally, it is possible that the transition from Si-O-Al and O-Al(Si)-O bonds to Al-O-Al(Si-O-Si) and Al-O bonds occurred from 687 cm−1 to 670 cm−1, 572 cm−1 to 537 cm−1, and 432 cm−1 to 424 cm−1.
The peak at 995 cm−1 corresponds to the stretching vibration of Si-O bonds; the absorption peak near 995 cm−1 is due to the stretching vibration of Si-O-Si/Al bonds [50], mainly from C-(A)-S-H [51,52]. At 1420 cm−1, 875 cm−1, and 712 cm−1, characteristic peaks of stretching and bending vibrations of C-O bonds in carbonate are observed. The peaks become more pronounced after the absorption of CO2, indicating a significant increase in carbonized products [53]. There are slight differences in the variation patterns at these three positions, with a deeper and wider peak at 1420 cm−1 and narrower peaks at 875 cm−1 and 712 cm−1. These peaks correspond to hemicarboaluminate, monocarboaluminate, and calcite [49].
The peak at 462 cm−1 corresponds to the stretching vibration of Fe-O bonds [54], indicating that iron does not participate in the hydration process. Therefore, these two peaks persist throughout, but their changes are insignificant.
Analyzing the variation of RMCH with age at a CH content of 26.4% in Figure 7b, several distinct characteristics are observed. The gradually increasing peak intensity of the H-O-H bending vibration at 1631 cm−1 indicates an increase in C-(A)-S-H. The symmetric stretching peaks of the Si-O-Al framework in the regions of 687 cm−1, 620 cm−1, and 572 cm−1 decrease, suggesting a reaction of the active substances in the RM. At 875 cm−1 and 712 cm−1, characteristic peaks of C-O bonds in carbonate are observed. The intensity of these peaks is significantly higher at 3d and 7d compared to 28d. Combined with the XRD peak analysis in Figure 6, it is found that hemicarboaluminate and monocarboaluminate are more abundant at 3d and 7d, while they are almost completely decomposed at 28d. Therefore, it can be concluded that these peaks correspond to hemicarboaluminate and monocarboaluminate.
3.4. TG-DTG
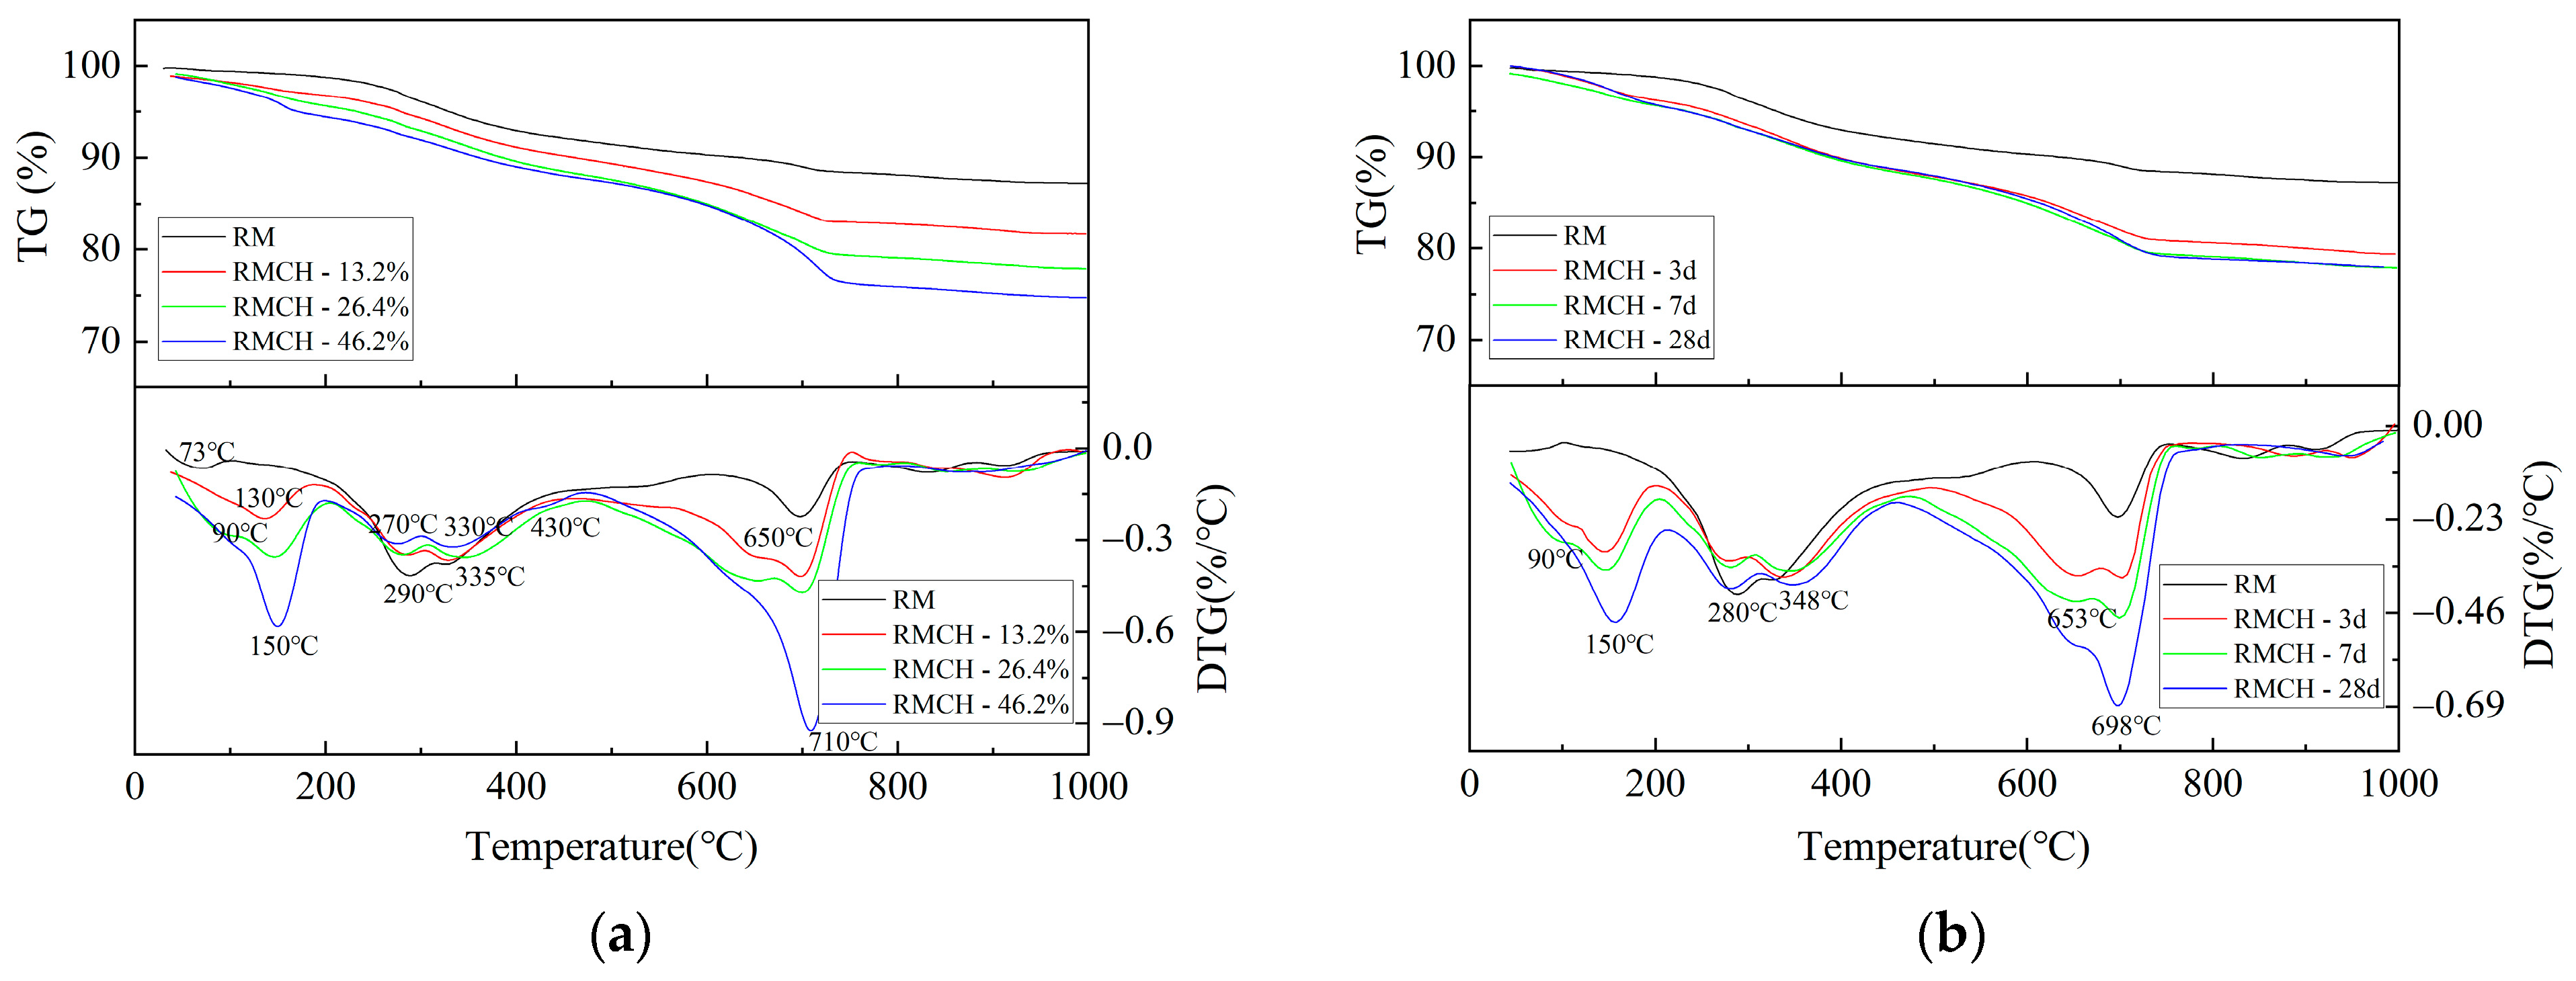
Figure 8a provides a TG-DTG characterization of RMCH with different CH content at 7 days, describing the endothermic decomposition of RMCH. The results show that the peak patterns of RM and RMCH are different, with the peak values of RMCH increasing with CH content. The weight loss of RM between 30 °C and 160 °C is 0.93%, with an endothermic peak at 73 °C. This weight loss is mainly caused by the evaporation of free water, and the low weight loss rate is due to prior drying before the experiment. The weight loss of RM between 160 °C and 470 °C is 8.4%, with endothermic peaks at 290 °C and 335 °C. This is attributed to the vaporization of crystalline water in some minerals within the RM, accompanied by endothermic reactions. The weight loss of RM between 620 °C and 710 °C is 1.4%, with an endothermic peak at 700 °C, indicating the decomposition of carbonate minerals. After 710 °C, the mass reduction is slow [55]. The TG-DTG of RMCH is related to the CH content. Taking RMCH-46.2% as an example, the weight loss of RMCH between 30 °C and 190 °C is 5.4%, with an endothermic peak at 150 °C, primarily due to the evaporation of free water. The weight loss of RMCH between 190 °C and 400 °C is 4.6%, with endothermic peaks at 270 °C and 330 °C, indicating endothermic reactions caused by the release of crystalline water in RMCH. The weight loss of RMCH between 400 °C and 470 °C is 1.3%, with an endothermic peak at 430 °C, representing the degradation of CH and indicating the structural thermal degradation of hydroxyl groups on CH [56]. The weight loss of RMCH between 470 °C and 710 °C is 11.1%, with an endothermic peak at 710 °C, indicating the decomposition of carbonate minerals.
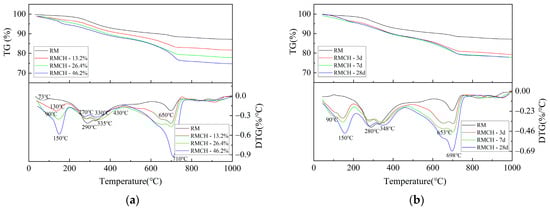
Figure 8.
TG-DTG of RMCH with different CH content at 7 days (a) and different ages incorporating 26.4% CH (b).
The endothermic peaks at 328 °C and 710 °C can be associated with the decomposition of hydroxysodalite [31]. The peak at 710 °C is attributed to the decomposition of Cancrinite, specifically the reaction of CO32− within Cancrinite, leading to the destruction of the crystal structure.
According to Figure 8a, it can be observed that the peak intensity increases with the increase of CH at 150 °C, 330 °C, 650 °C, and 710 °C. At 180 °C (close to 150 °C), the evaporation of free water in Hemicarboaluminate occurs, and at 328 °C, the destruction of bound water takes place [28]. At 150 °C, the crystal structure of monocarboaluminate is destroyed [49], and the remaining chemically bound water is released between 200 and 330 °C [57]. When the temperature is increased from 500 °C to 710 °C, the decarbonization reaction of monocarboaluminate leads to weight loss [41]. The decomposition of calcite takes place at 650 °C and 710 °C, releasing CO2 at these temperatures [58]. The presence of a peak at 150 °C corresponds to the decomposition of C-(A)-S-H. The peak at 150 °C is attributed to the loss of interlayer water molecules [59].
From Figure 8b, it can be observed that with an increase in curing age, the peak intensity increases at 150 °C, 650 °C, and 700 °C. The peak at 150 °C can be attributed to the loss of free water in monocarboaluminate and C-(A)-S-H. The increase in peak intensity at 650 °C and 700 °C is believed to be associated with the decomposition of calcite, which corresponds to the changes in XRD peaks shown in Figure 6.
3.5. SEM-EDS
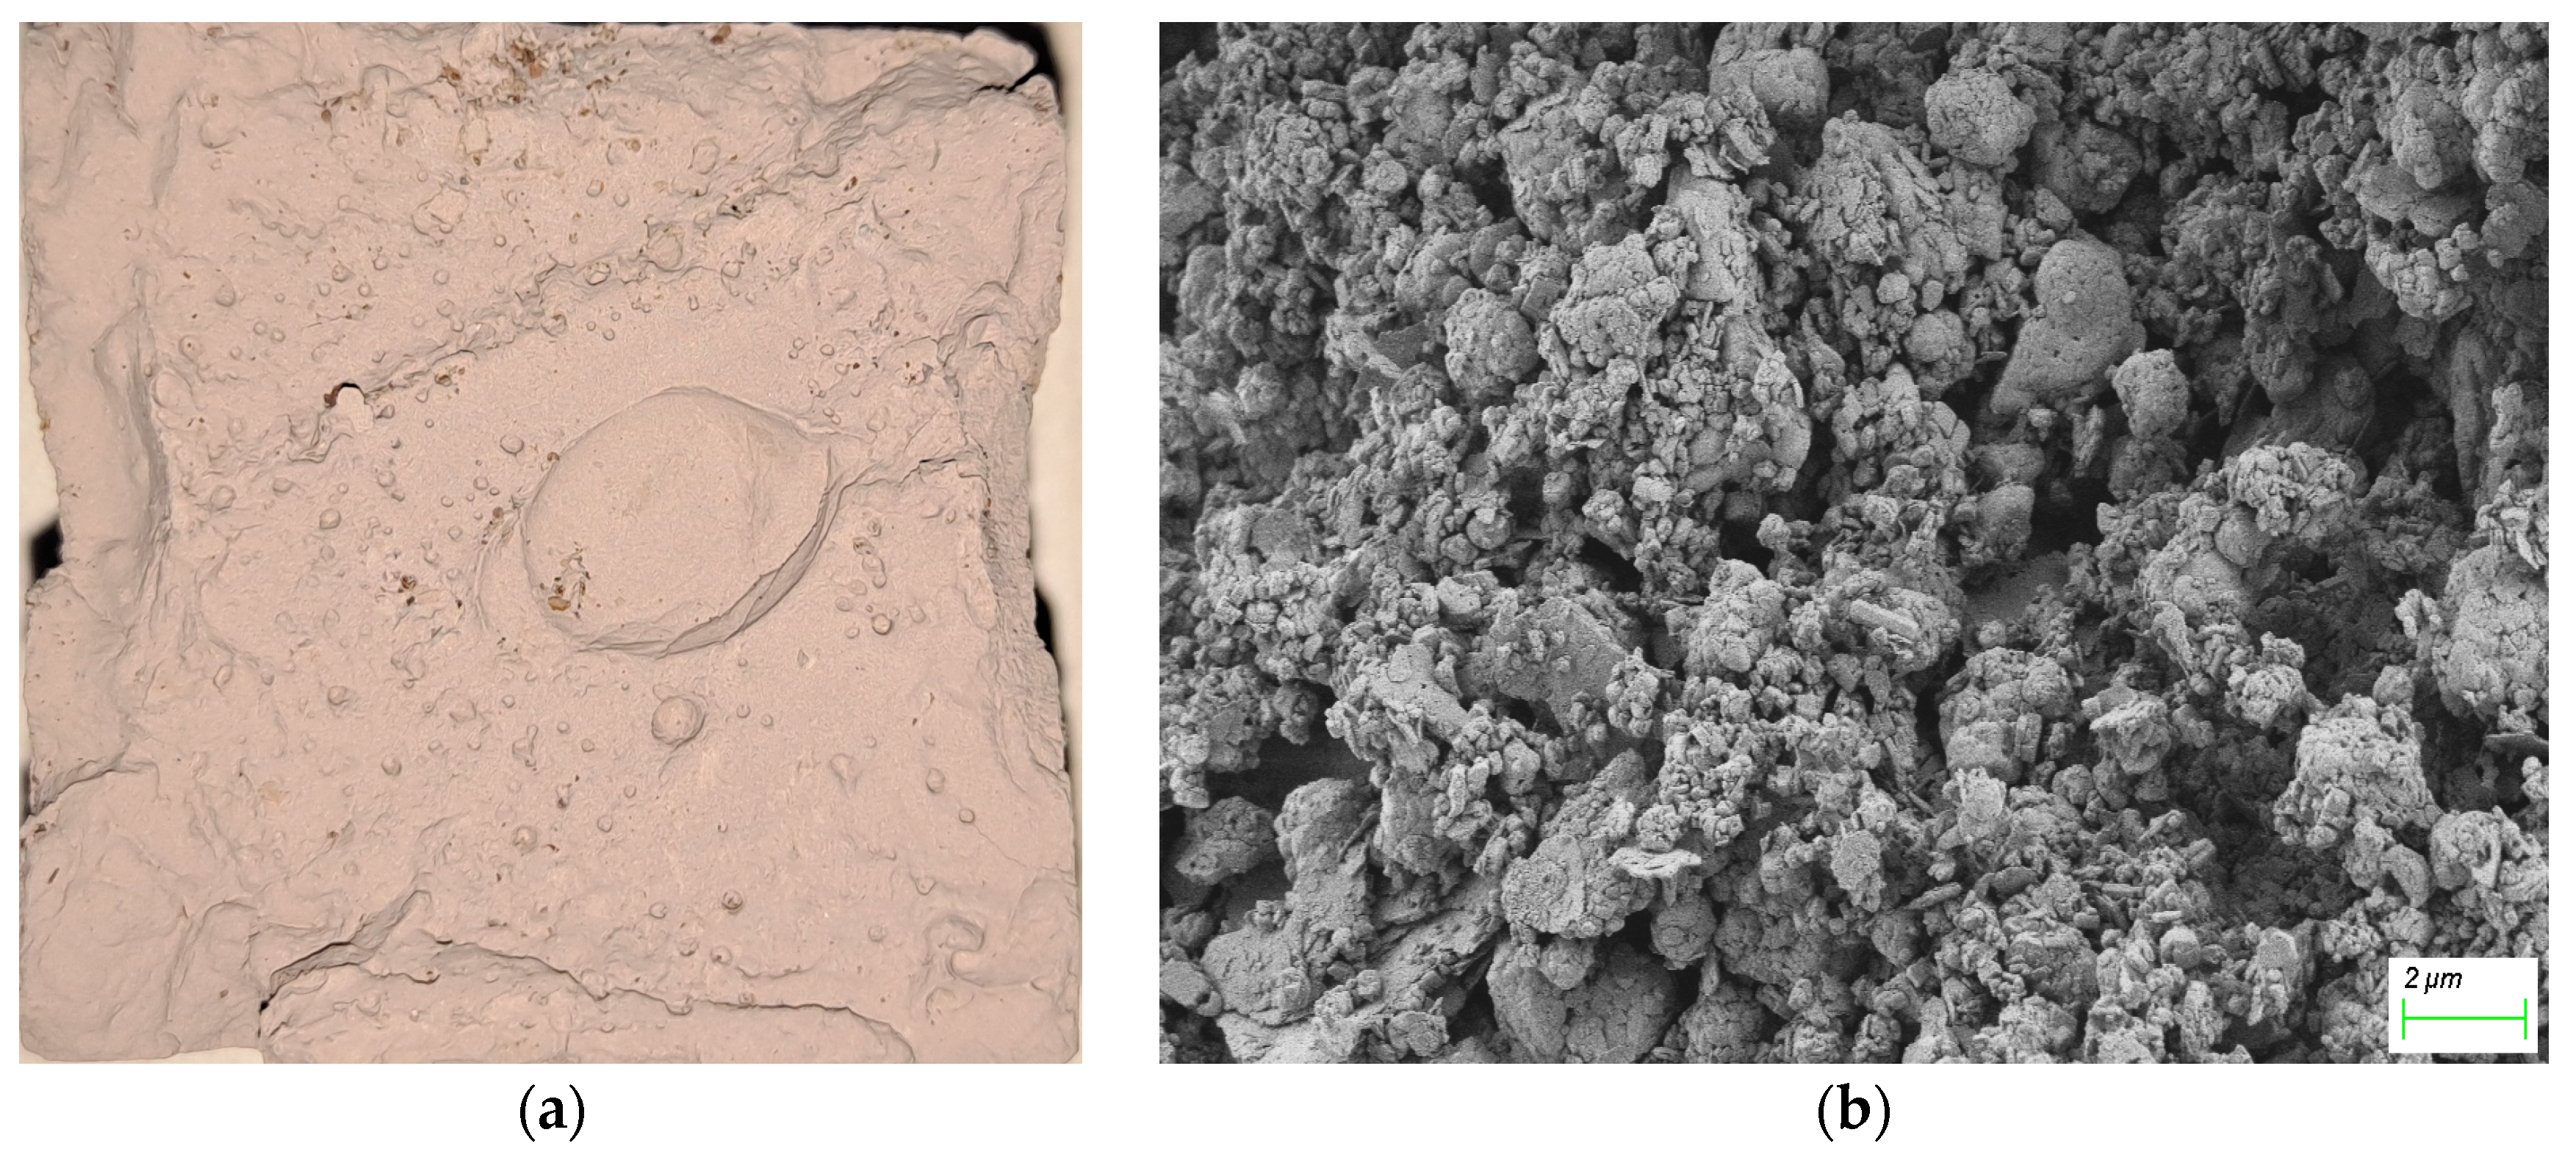
When the CH content is 0, RM is mixed with water, placed in a mold, and cured for 28 days with a plastic wrap on the surface. If the surface is humid, no strength is observed. Figure 9a shows a dried photo after tearing off the film, revealing uneven surfaces and the presence of large pores on the surface of the RM block. Observation with SEM at 5k× magnification, as shown in Figure 9b, after mixing RM with water, the main form of the mixture is still small block-like particles, as shown in Figure 3. These particles are mixed together in a muddy structure, but they do not exhibit any strength due to the lack of binding. This indicates that there is no formation of cementitious products when water is added to RM.
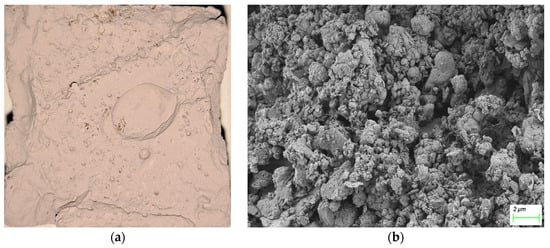
Figure 9.
Air-dried image of RM (a) and SEM image of RM at 5k× (b).
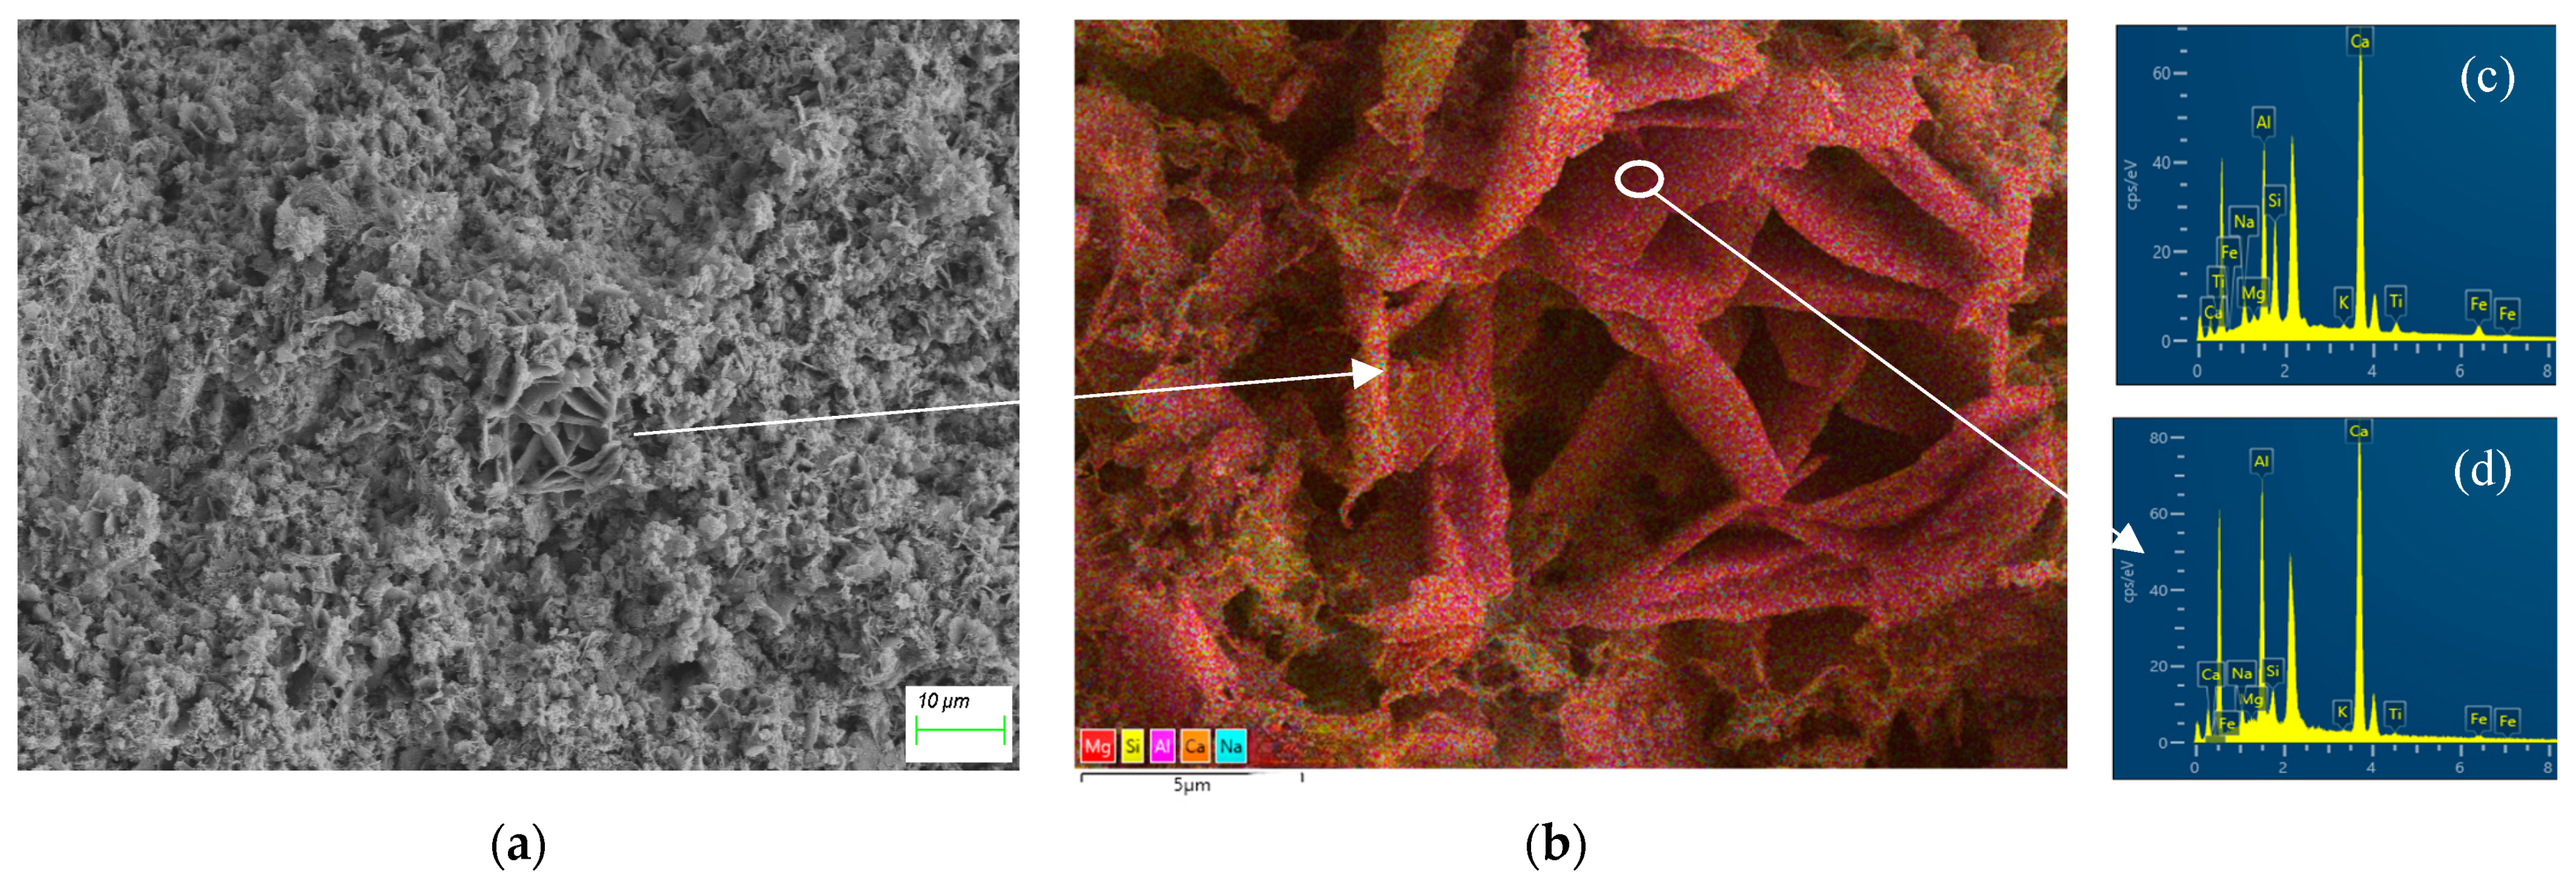
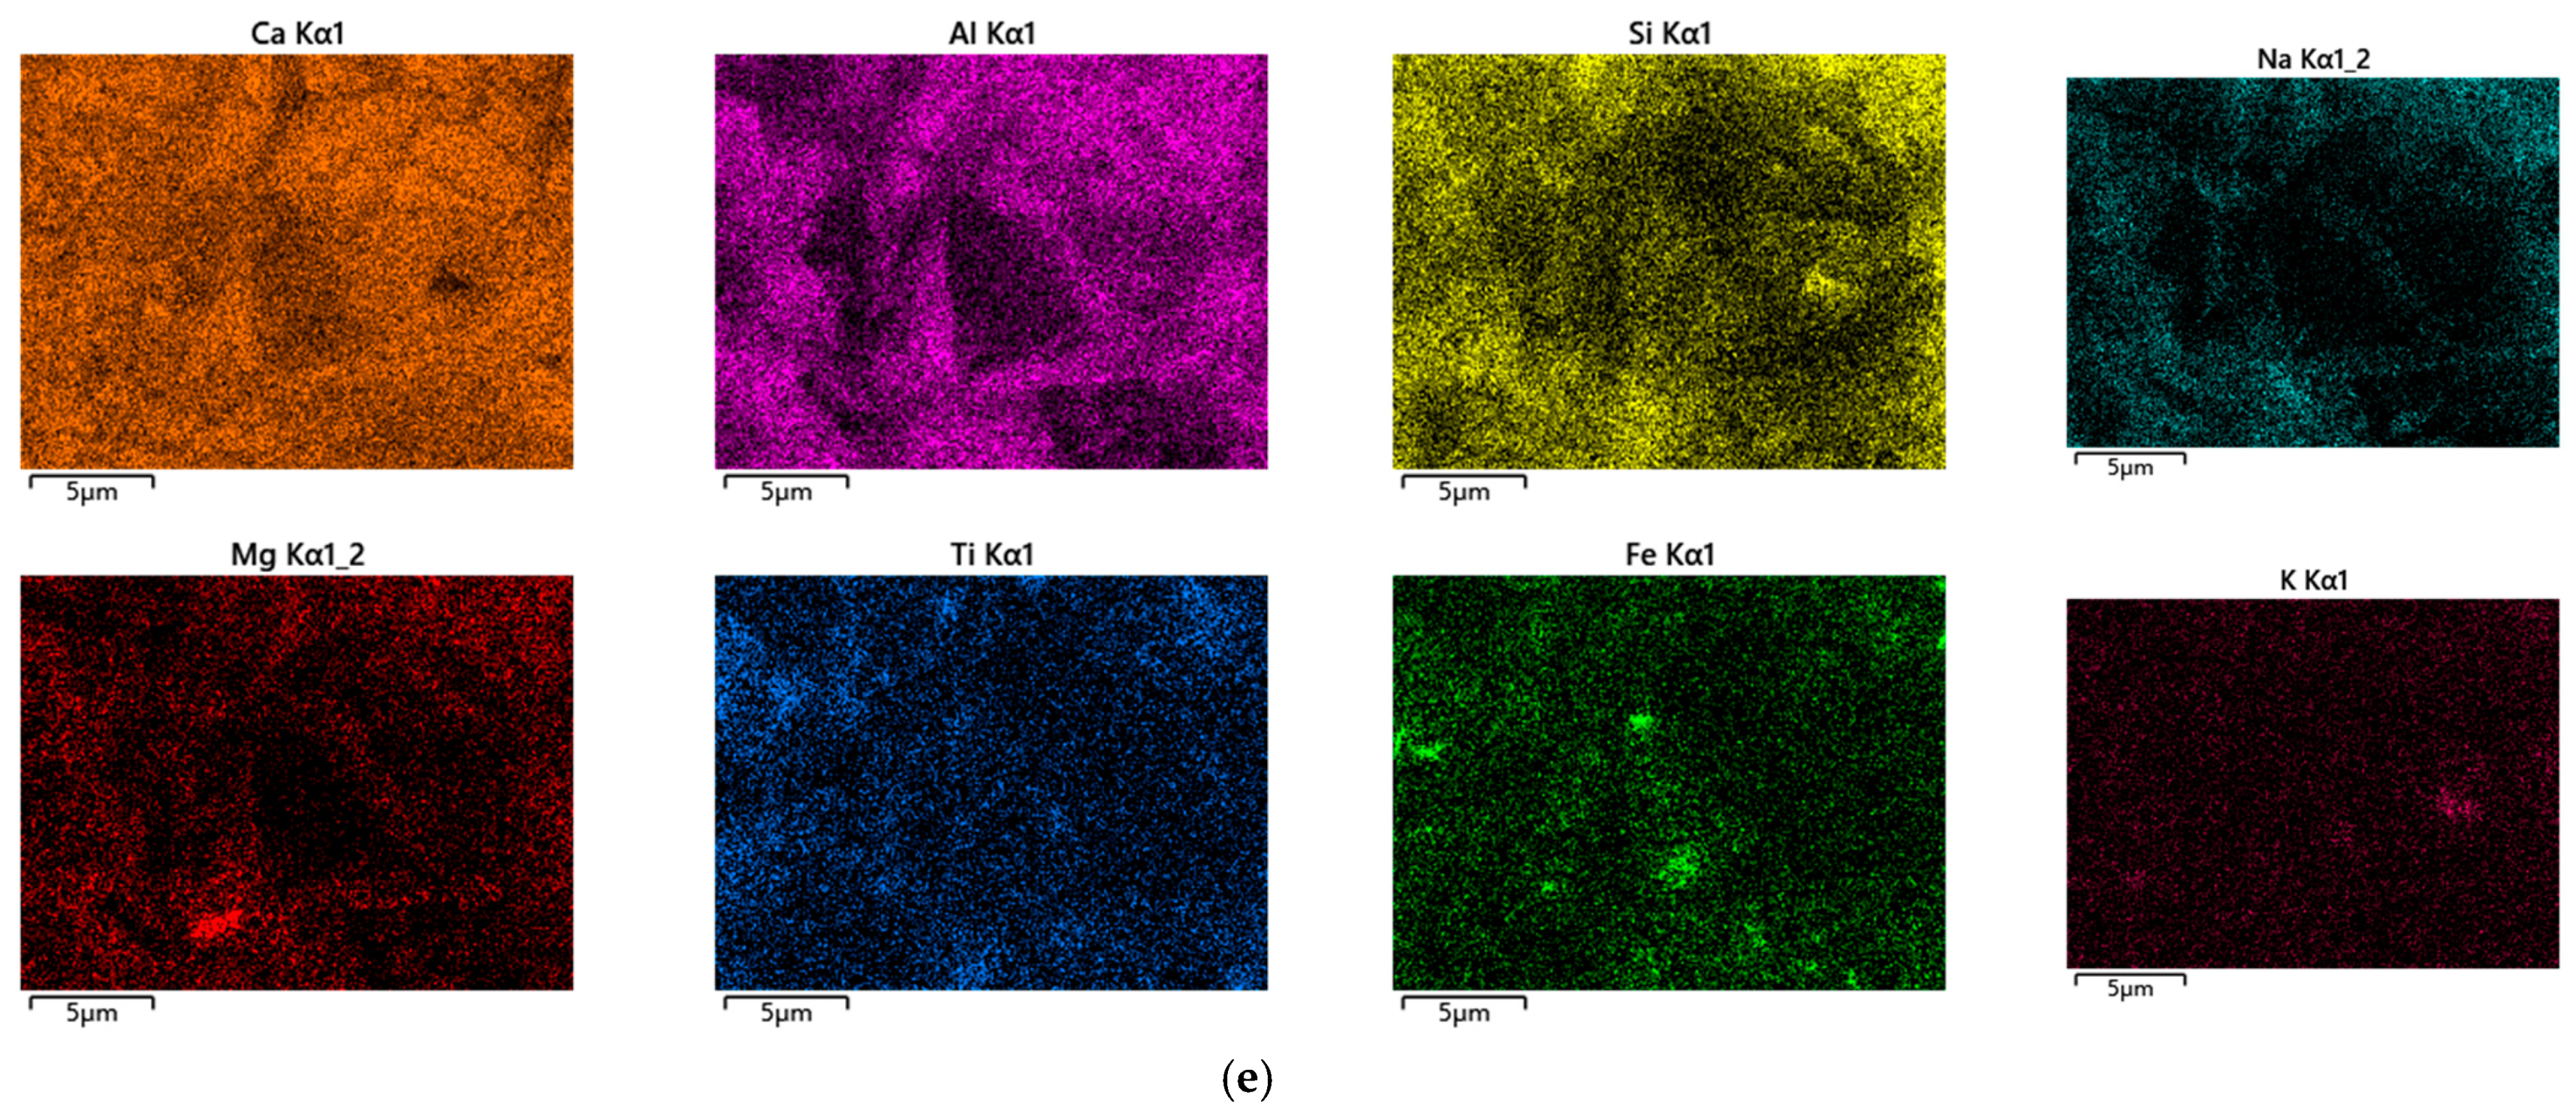
Figure 10 shows the 7-day SEM images and EDS spectra of RMCH with a CH content of 46.2%. Figure 10a displays a 1k× morphology with a diameter of 13.09 μm. This area is further enlarged to 5k× in Figure 10b. EDS layer characterization was performed to obtain elemental distribution maps of the characterization area. The elemental distribution map is shown in Figure 10e; different colors represent different elemental distributions, with brighter colors indicating a higher degree of element enrichment. The large patchy region in Figure 10b appears dark red, indicating a high aluminum (Al) content and a low silicon (Si) content. This observation is consistent with the elemental distribution characteristics of Al and Si shown in Figure 10e. The overall elemental distribution map corresponding to Figure 10b is shown in Figure 10c, and the corresponding EDS data can be found in Table 3. The irregular hexagonal thin sheet-like material with dimensions of 2–8 μm was analyzed using EDS line spectrum analysis, as shown in Figure 10d. The EDS data can be found in Table 4, confirming the presence of hemicarboaluminate [57] and monocarboaluminate [41], which is consistent with previous studies [60]. Additionally, an area enriched with iron (Fe) was observed in Figure 10e.
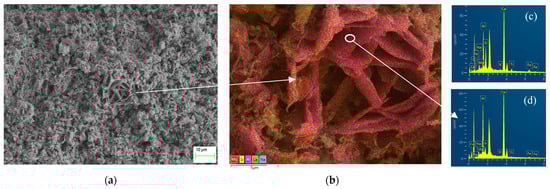

Figure 10.
SEM images of RMCH incorporated CH 46.2% at 7 days, (a) SEM image at 1k×, (b) SEM image at 5k×, (c) Total element distribution spectrum, (d) Line spectrum, (e) Element distribution map.
Table 3.
EDS data corresponding to Figure 10c.
Table 4.
EDS data corresponding to Figure 10d.
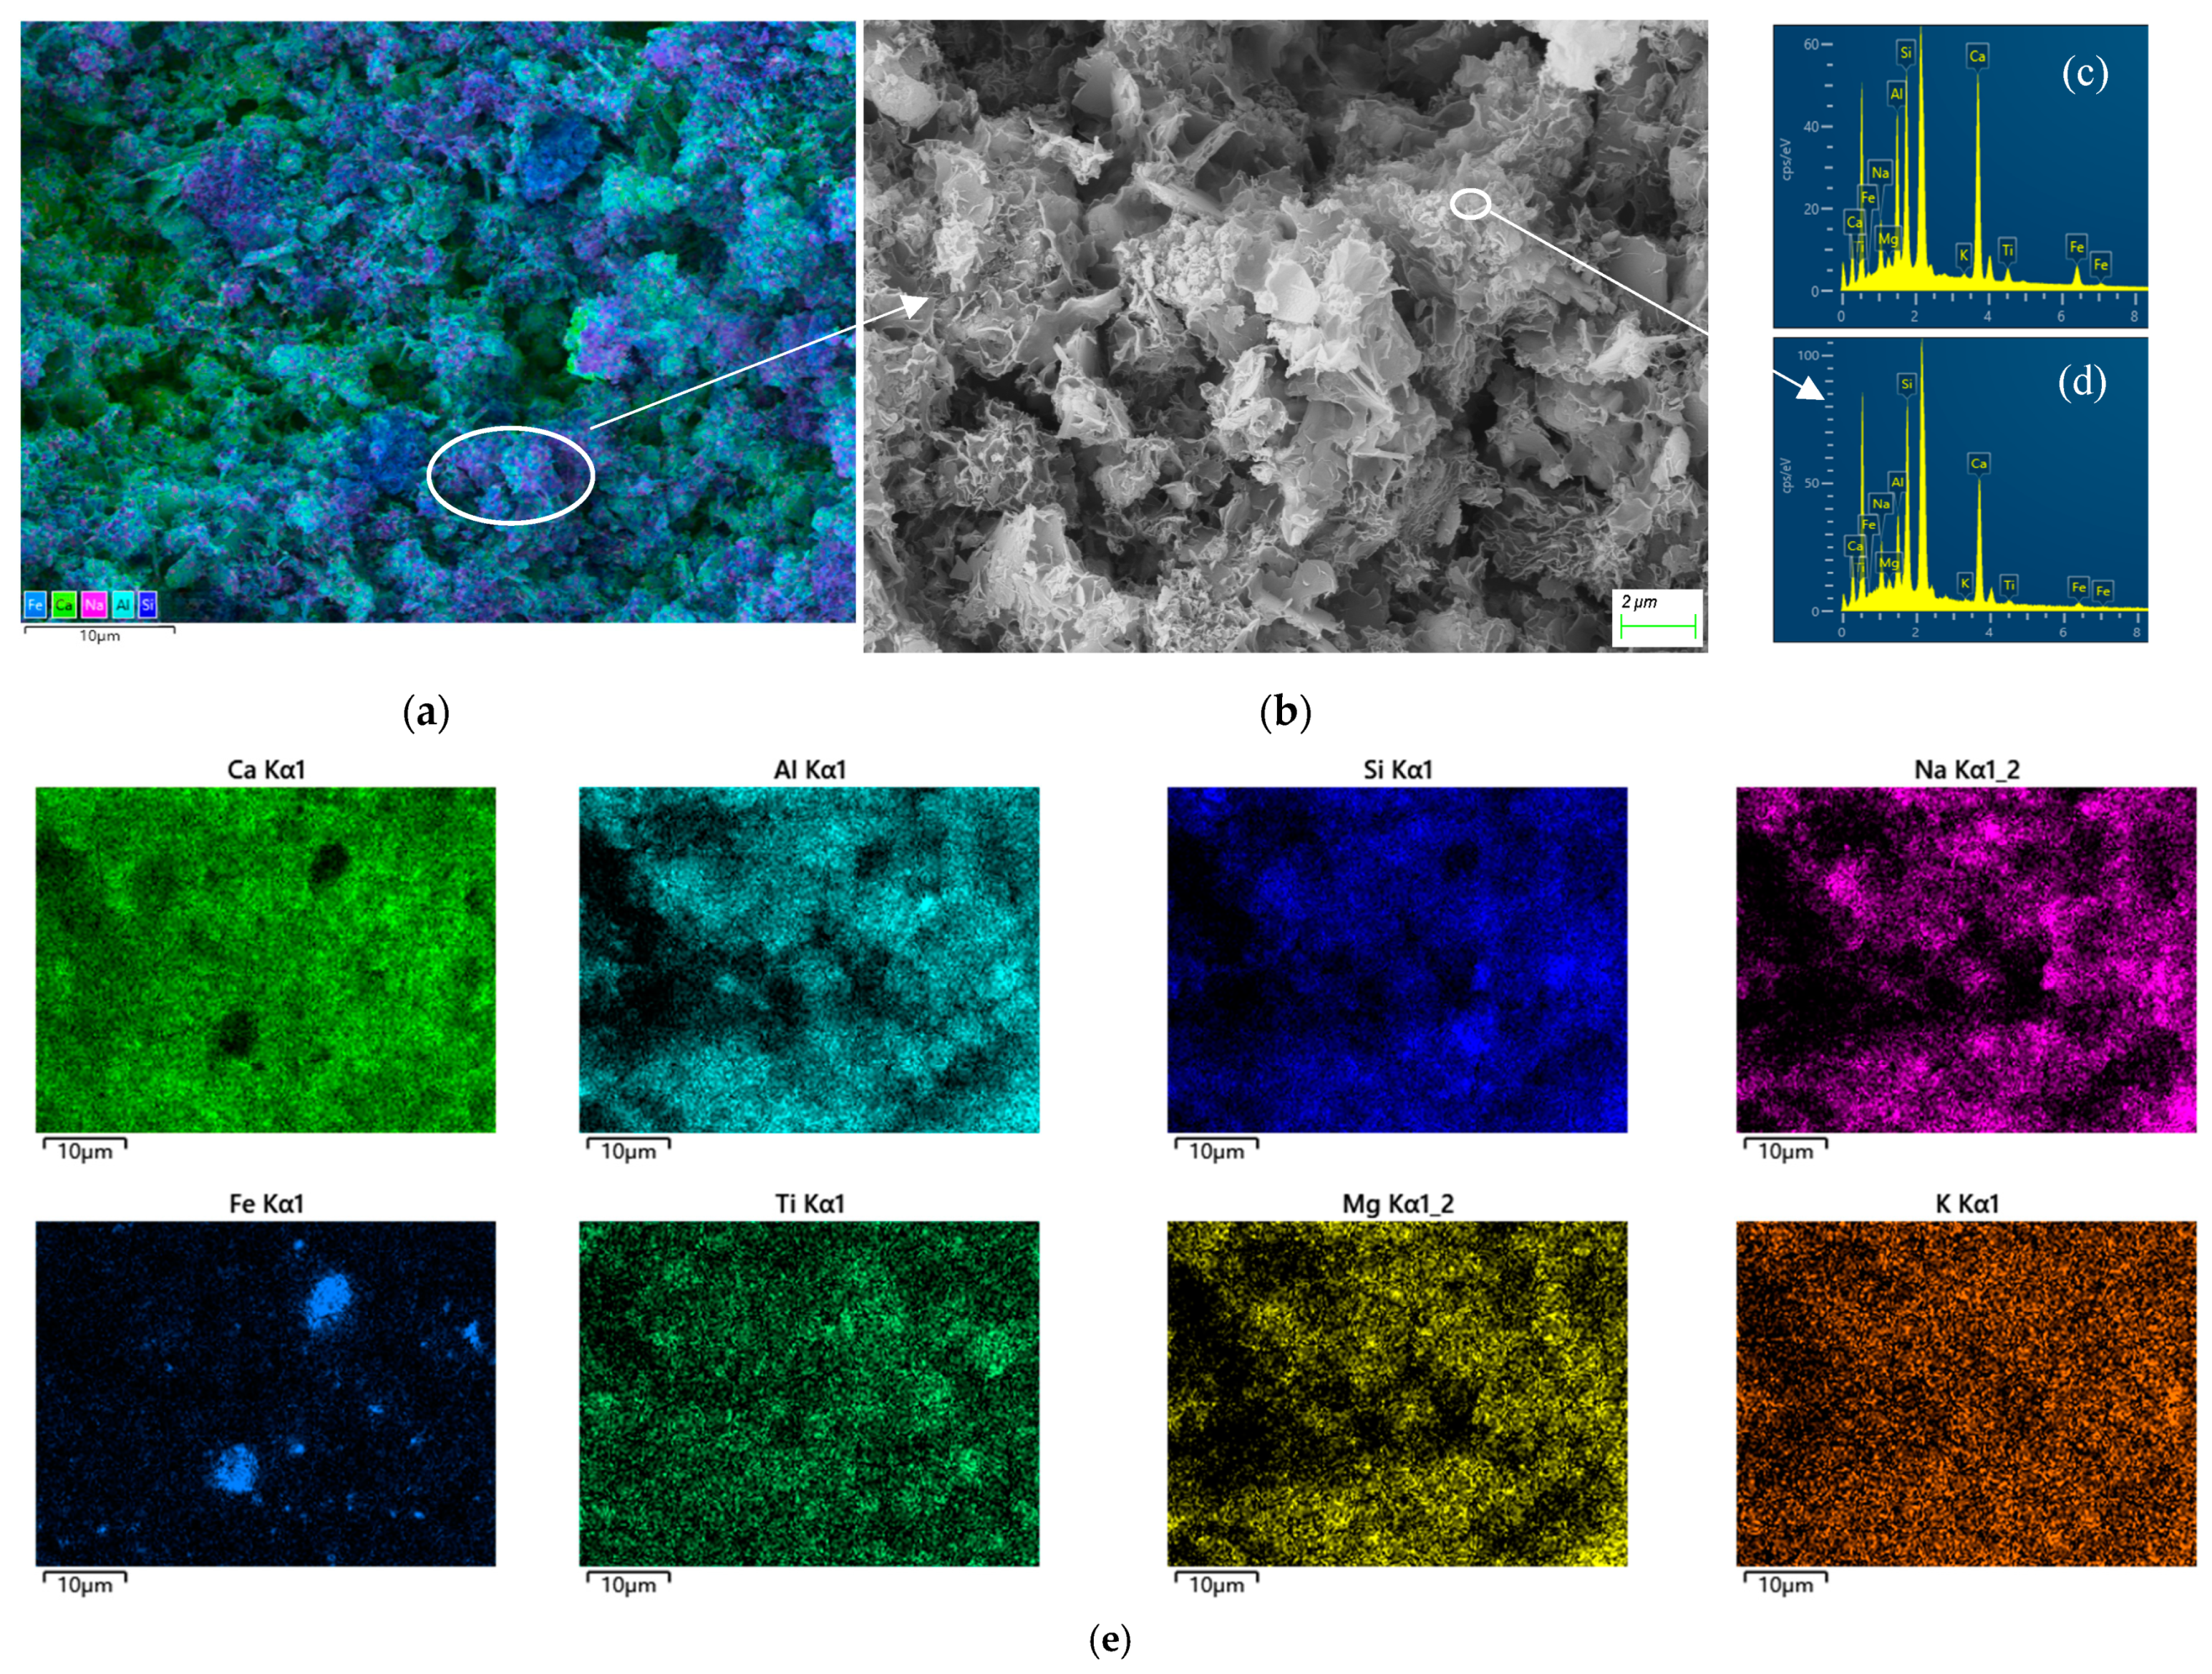
Figure 11 shows the 28-day SEM images and EDS spectra of RMCH with a CH dosage of 26.4%. In Figure 11a, it can be observed that the colors blue and green are the most abundant, with the majority of the right side covered in dark blue. Using EDS layer characterization, the element distribution map is shown in Figure 11e. Comparing Figure 11a and Figure 11e, Si, Al, and Ca are relatively enriched elements. The total element distribution spectrum corresponding to Figure 11a is shown in Figure 11c, and the corresponding EDS data can be found in Table 5. These randomly oriented nanosheets have a thickness of several tens of nm and dimensions of 1 micron. They exhibit a large number of pores of varying sizes. The nanosheets support and intertwine with each other, forming a mechanically stable overall porous structure [37]. Line spectrum analysis was conducted using EDS, as shown in Figure 11d, and the EDS data can be found in Table 6. The enlarged morphology of C-(A)-S-H can also be observed in Figure 11a, and this result is confirmed by XRD analysis. An area enriched with Fe was also observed in Figure 11e, similar to the Fe observed in Figure 11e, indicating that Fe in the RM exists as a stable block-like material and is less prone to reaction and decomposition in this environment.
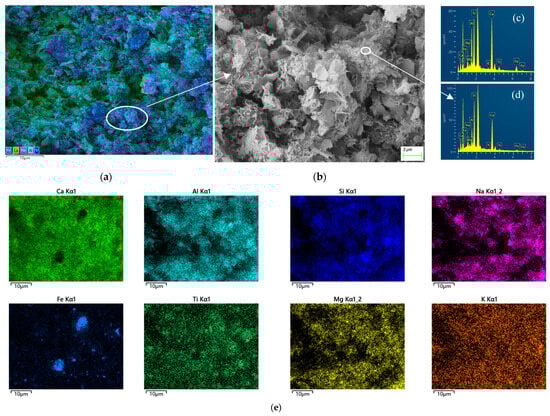
Figure 11.
SEM images of RMCH incorporated CH 26.4% at 28 days, (a) SEM image at 1k×, (b) SEM image at 5k×, (c) Total element distribution spectrum, (d) Line spectrum, (e) Element distribution map.
Table 5.
EDS data corresponding to Figure 11c.
Table 6.
EDS data corresponding to Figure 11d.
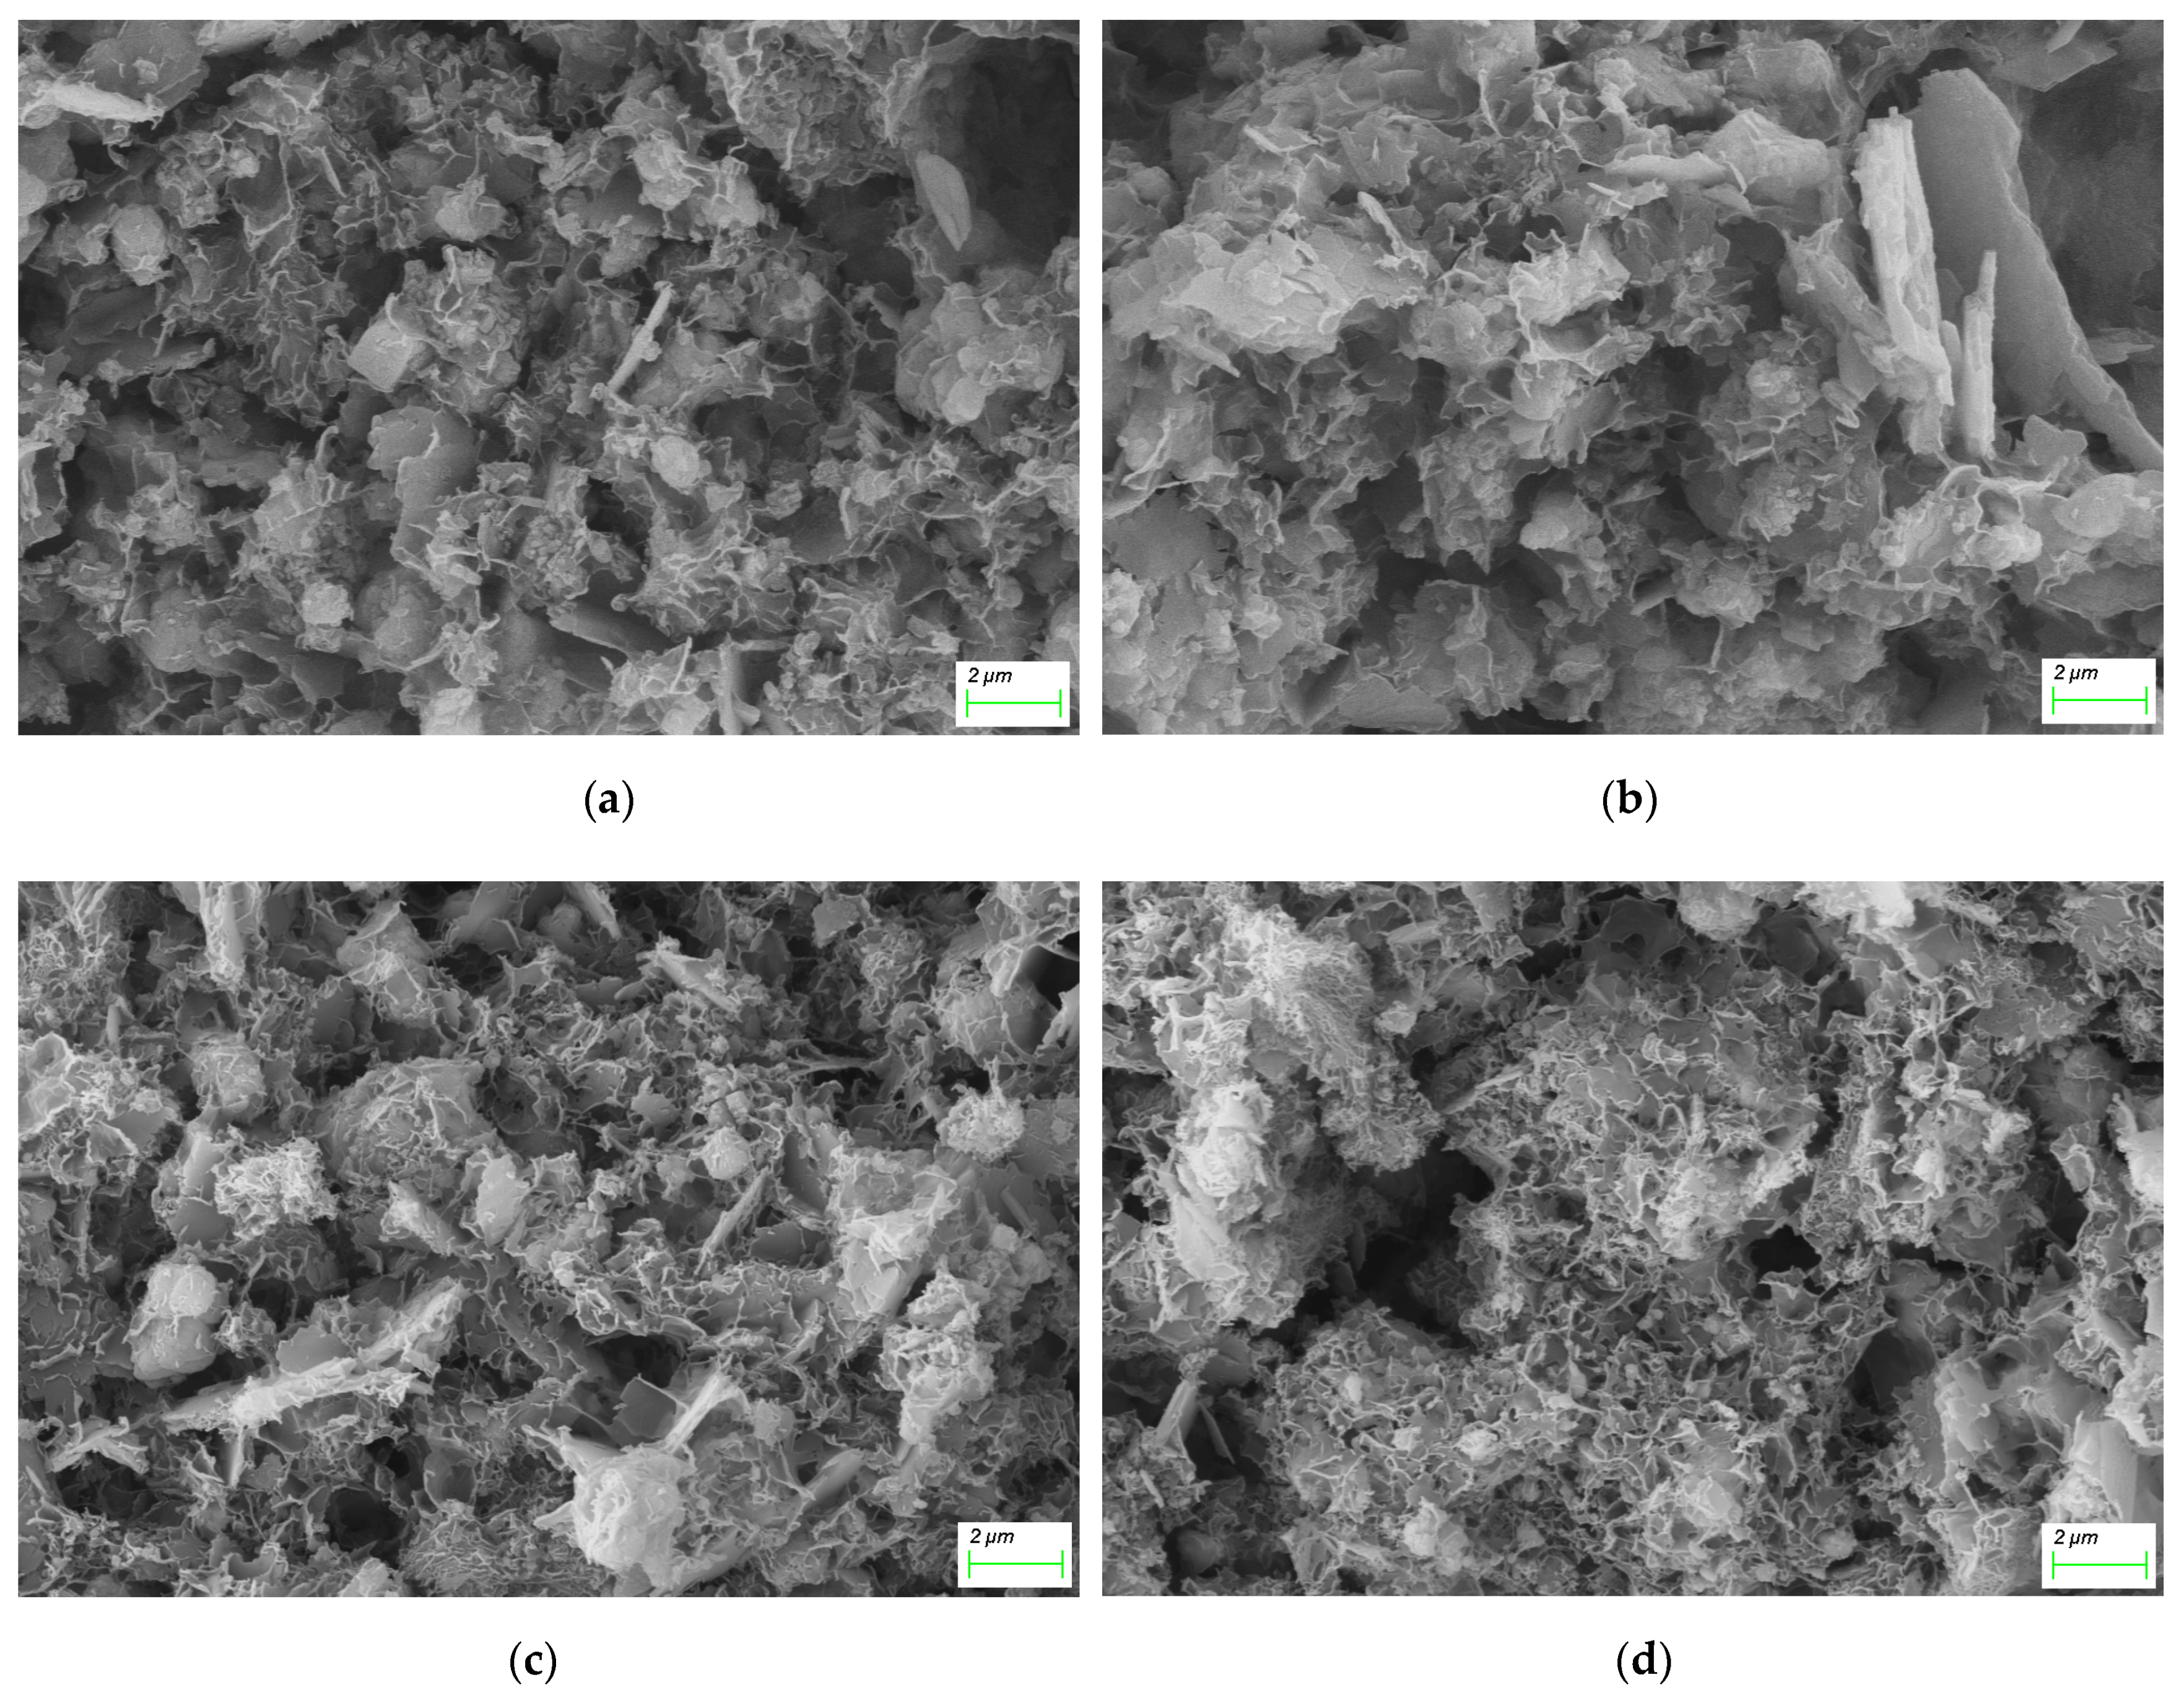
Figure 12 shows the SEM images of RMCH at different ages and CH contents. Figure 12a and b are SEM images of samples containing 13.2% and 26.4% CH, respectively, at 7 days. It can be observed that the overall pore size on the sample surface decreases. The 26.4% CH sample exhibits more plate-like crystals and amorphous gels compared to the 13.2% CH sample. Figure 12c,d are SEM images of samples containing 26.4% and 46.2% CH, respectively, at 28 days. The particles seen in Figure 12c disappear in Figure 12d, replaced by a large amount of gel-like material, resulting in a denser overall texture.
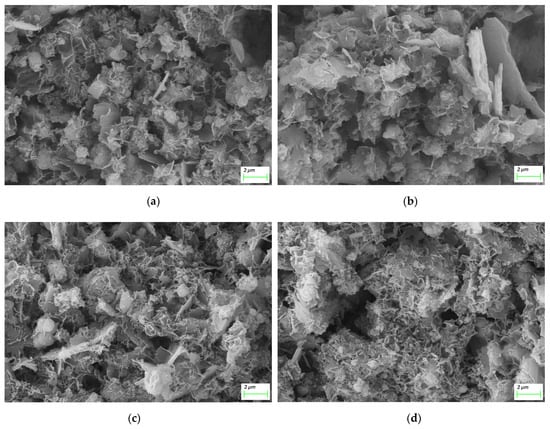
Figure 12.
SEM images of RMCH with different CH dosages at different ages, (a) RMCH13.2%—7d, (b) RMCH26.4%—7d, (c) RMCH26.4%—28d, (d) RMCH46.2%—28d.
Comparing Figure 12a,b, it can be observed that with the increase in CH content from 13.2% to 26.4% at a curing age of 7 days, there is a denser overlap between monocarboaluminate and C-(A)-S-H crystals, and the pores between mineral particles are significantly reduced. The morphology of C-(A)-S-H crystals becomes rounder, indicating an improved structural density. Comparing Figure 12b,c, at a CH content of 26.4%, there is a denser morphology of C-(A)-S-H at both 7 and 28 days. Monocarboaluminate is almost absent. Comparing Figure 12c,d, at a curing age of 28 days, with the increase in CH content from 26.4% to 46.2%, the initial pore size decreases, and the contact between mineral particles increases, resulting in the formation of more hydration products, which play a role in filling and cementing [56]. When CH content reaches 46.2%, blocky and interleaved C-(A)-S-H fills the pores, and the decomposition of monocarboaluminate forms amorphous aluminum-containing minerals [41], bonding loose mineral particles together, further improving the compactness, cementitiousness, and strength of the framework structure. This may contribute significantly to the strength and stability of the samples, consistent with the unconfined compressive strength development and XRD analysis results mentioned above.
4. Conclusions
In order to study the solidification reinforcement mechanism of Bayer RM by CH, unconfined compressive strength tests were first conducted on Bayer RM paste with different dosages of calcium hydroxide at different ages. Then, characterization was performed using XRD, FTIR, TG-DTG, and SEM-EDS. The results showed that:
- With the increasing dosage of CH, the unconfined compressive strength of RMCH gradually increased. At the ages of 3d and 7d, when the CH dosage was 26.4%, the unconfined compressive strength of RMCH reached a relatively stable plateau. Further, increasing the CH dosage did not significantly increase the unconfined compressive strength of RMCH. At the age of 28 days, with every 6.6% increase in CH dosage, the unconfined compressive strength of RMCH continued to increase, with the smallest increase exceeding 14%.
- When the CH dosage is low, RMCH has basically completed all solidification reactions at 3d, and the Ca2+ in the system is depleted. This is manifested as a small change in unconfined compressive strength from 3d-7d-28d, and even a decrease in unconfined compressive strength with increasing age. The CH dosage of 26.4% is the turning point for the increase in the unconfined compressive strength of RMCH.
- In the presence of CH, hydroxysodalite and faujasite-Na decompose to produce C-S-H, Al(OH)4−, and Na+. These ions will then react further to form hemicarboaluminate, monocarboaluminate, and C-(A)-S-H, which greatly contributes to the strength of RM solidification. With the increase in curing age, hemicarboaluminate in RMCH gradually transforms into monocarboaluminate, and monocarboaluminate decomposes into amorphous calcium aluminate and calcite. To avoid insufficient research, the changes in the pore structure of solidified red mud can be studied using techniques such as low-field nuclear magnetic resonance.
Author Contributions
Conceptualization, Z.S. and P.Q.; methodology, Z.S.; validation, Z.S. and P.Q.; formal analysis, Z.S. and G.K.; resources, P.Q., G.K. and Z.S.; data curation, Z.S., S.H., X.G. and Z.Z.; writing, original draft preparation, Z.S. and P.Q.; writing, review and editing, Z.S., P.Q., G.K. and S.H.; visualization, Z.S., P.Q., G.K., X.G. and Z.Z.; supervision, P.Q., G.K., Z.S. and S.H. All authors have read and agreed to the published version of the manuscript.
Funding
The research described in this paper was financially supported by the National Science Foundation of China (51978438) and Taiyuan University of Technology and Shanxi Provincial Basic Research Plan Free Exploring Projects of China (No. 202203021221039).
Institutional Review Board Statement
Not applicable.
Informed Consent Statement
Not applicable.
Data Availability Statement
The data presented in this study are available upon request from the corresponding author.
Conflicts of Interest
The authors declare no conflicts of interest.
References
- Liu, W.C.; Chen, X.Q.; Li, W.X.; Yu, Y.F.; Yan, K. Environmental assessment, management and utilization of red mud in China. J. Clean. Prod. 2014, 84, 606–610. [Google Scholar] [CrossRef]
- Wang, X.; Jing, H.; Zhang, M.; Li, J.; Ma, Y.; Yan, L. Analysis of Alkali in Bayer Red Mud: Content and Occurrence State in Different Structures. Sustainability 2023, 15, 12686. [Google Scholar] [CrossRef]
- Liu, Y.J.; Naidu, R.; Ming, H. Red mud as an amendment for pollutants in solid and liquid phases. Geoderma 2011, 163, 1–12. [Google Scholar] [CrossRef]
- Gundy, S.; Farkas, G.; Székely, G.; Kásler, M. No short-term cytogenetic consequences of Hungarian red mud catastrophe. Mutagenesis 2013, 28, 1–5. [Google Scholar] [CrossRef] [PubMed]
- Ding, Y.; Ye, X.W.; Su, Y.H.; Zheng, X.L. A framework of cable wire failure mode deduction based on Bayesian network. Structures 2023, 57, 104996. [Google Scholar] [CrossRef]
- Ding, Y.; Ye, X.W.; Guo, Y. Copula-based JPDF of wind speed, wind direction, wind angle, and temperature with SHM data. Probabilist. Eng. Mech. 2023, 73, 103483. [Google Scholar] [CrossRef]
- Feng, Y.B.; Yang, C. Analysis on physical and mechanical properties of red mud materials and stockpile stability after dilatation. Adv. Mater. Sci. Eng. 2018, 2018, 8784232. [Google Scholar] [CrossRef]
- Ortega, J.M.; Cabeza, M.; Tenza-Abril, A.J.; Real-Herraiz, T.; Climent, M.Á.; Sánchez, I. Effects of red mud addition in the microstructure, durability and mechanical performance of cement mortars. Appl. Sci. 2019, 9, 984. [Google Scholar] [CrossRef]
- Cheng, X.W.; Yang, X.Z.; Zhang, C.; Gao, X.S.; Yu, Y.J.; Mei, K.Y.; Guo, X.Y.; Zhang, C.M. Effect of red mud addition on oil well cement at high temperatures. Adv. Cem. Res. 2019, 33, 28–38. [Google Scholar] [CrossRef]
- Li, W.Y.; Zhang, Z.Y.; Zhou, J.B. Preparation of building materials from Bayer red mud with magnesium cement. Constr. Build. Mater. 2022, 323, 126507. [Google Scholar] [CrossRef]
- Ma, H.Y.; Xu, B.W.; Liu, J.; Pei, H.F.; Li, Z.J. Effects of water content, magnesia-to-phosphate molar ratio and age on pore structure, strength and permeability of magnesium potassium phosphate cement paste. Mater. Design 2014, 64, 497–502. [Google Scholar] [CrossRef]
- Mukiza, E.; Zhang, L.L.; Liu, X.M.; Zhang, N. Utilization of red mud in road base and subgrade materials: A review. Resour. Conserv. Recycl. 2019, 141, 187–199. [Google Scholar] [CrossRef]
- Zhang, J.Z.; Yao, Z.Y.; Wang, K.; Wang, F.; Jiang, H.G.; Liang, M.; Wei, J.C.; Airey, G. Sustainable utilization of bauxite residue (Red Mud) as a road material in pavements: A critical review. Constr. Build. Mater. 2021, 270, 121419. [Google Scholar] [CrossRef]
- Sushil, S.; Batra, V.S. Modification of red mud by acid treatment and its application for CO removal. J. Hazard. Mater. 2012, 203–204, 264–273. [Google Scholar] [CrossRef]
- Lyu, F.; Niu, S.L.; Wang, L.; Liu, R.Q.; Sun, W.; He, D.D. Efficient removal of Pb(II) ions from aqueous solution by modified red mud. J. Hazard. Mater. 2021, 406, 124678. [Google Scholar] [CrossRef]
- Wahyudi, A.; Kurniawan, W.; Hinode, H. Utilization of modified red mud as a heterogeneous base catalyst for transesterification of canola oil. J. Chem. Eng. Jpn. 2017, 50, 561–567. [Google Scholar] [CrossRef]
- Gräfe, M.; Power, G.; Klauber, C. Bauxite residue issues: III. Alkalinity and associated chemistry. Hydrometallurgy 2011, 108, 60–79. [Google Scholar] [CrossRef]
- Lu, G.Z.; Zhang, T.A.; Zheng, C.Z.; Zhu, X.F.; Zhang, W.G.; Wang, Y.X. The influence of the silicon saturation coefficient on a calcification-carbonation method for clean and efficient use of bauxite. Hydrometallurgy 2017, 174, 97–104. [Google Scholar] [CrossRef]
- Yang, W.Z.; Ma, W.H.; Li, P.F.; Liu, Z.W.; Yan, H.W. Alkali recovery of bauxite residue by calcification. Minerals 2022, 12, 636. [Google Scholar] [CrossRef]
- Liu, G.T.; Liu, Y.; Zhang, T.A. Approaches to improve alumina extraction based on the phase transformation mechanism of recovering alkali and extracting alumina by the calcification-carbonization method. Hydrometallurgy 2019, 189, 105123. [Google Scholar] [CrossRef]
- Chen, Y.; Zhang, T.A.; Lv, G.Z.; Chao, X.; Yang, X.W. Research on the dealkalization treatment of bauxite residue and deep extraction of alumina. Bull. Environ. Contam. Toxicol. 2022, 109, 180–185. [Google Scholar] [CrossRef] [PubMed]
- Cheng, L.W.; Wang, Y.l.; Wang, B.; Qi, T.G.; Liu, G.H.; Zhou, Q.S.; Peng, Z.H.; Li, X.B. Phase transformation of desilication products in red mud dealkalization process. J. Sustain. Metall. 2022, 8, 541–550. [Google Scholar] [CrossRef]
- Liu, B.; Sun, H.J.; Peng, T.J.; He, Q. One-step synthesis of hydroxysodalite using natural bentonite at moderate temperatures. Minerals 2018, 8, 521. [Google Scholar] [CrossRef]
- Andrades, R.C.; Neves, R.F.; Diaz, F.R.V.; Júnior, A.H.M. Influence of alkalinity on the synthesis of zeolite a and hydroxysodalite from metakaolin. J. Nano Res. 2020, 61, 51–60. [Google Scholar] [CrossRef]
- Lu, G.Z.; Zhang, T.A.; Cheng, C.; Zhang, W.G.; Wang, L.; Wang, Y.X.; Zhang, Z.M. Zeolite a preparation from high alumina fly ash of china using alkali fusion and hydrothermal synthesis method. Mater. Res. Express 2019, 6, 065049. [Google Scholar] [CrossRef]
- Gross, M.; Soulard, M.; Caullet, P.; Patarin, J.; Saude, I. Synthesis of faujasite from coal fly ashes under smooth temperature and pressure conditions: A cost saving process. Micropor. Mesopor. Mat. 2007, 104, 67–76. [Google Scholar] [CrossRef]
- JGJ/T70-2009; Standard Test Method for Basic Performance of Building Mortars. Ministry of Housing and Urban-Rural Development: Beijing, China, 2009.
- Wang, X.; Fan, Y.F.; Ni, W.; Fu, P.F. Stimulating CO2 sequestration of aluminum-rich refining slag (ARS): A proposed method of preventing katoite formation using desulfuration gypsum. J. Build. Eng. 2023, 63, 105470. [Google Scholar] [CrossRef]
- Wu, Y.J.; Deng, D.D.; Jiang, J.; Li, F.; Zeng, J.Q.; Guo, X.Y.; Zhu, F.; Jiang, Y.F.; Xue, S.G. Ca-driven stable regulatory of alkalinity within desilication products: Experimental, modeling, transformation mechanism and DFT study. Sci. Total Environ. 2023, 868, 161708. [Google Scholar] [CrossRef]
- Whittington, B.I.; Fletcher, B.L.; Talbot, C. The effect of reaction conditions on the composition of desilication product DSP formed under simulated Bayer conditions. Hydrometallurgy 1998, 49, 1–22. [Google Scholar] [CrossRef]
- Abramorv, B.Я.; Nicholaev, И.B.; Stelimakova, Г.Д. Alkali Method Comprehensive Treatment of Physical and Chemical Principles of Aluminum-Containing Raw Materials, 1st ed.; Central South University of Technology Press: Changsha, China, 1988; pp. 90−91, 113, 135−136. [Google Scholar]
- Walkley, B.; Nicolas, R.S.; Sani, M.; Bernal, S.A.; van Deventer, J.S.J.; Provis, J.L. Structural evolution of synthetic alkali-activated CaO-MgO-Na2O-Al2O3-SiO2 materials is influenced by Mg content. Cem. Concr. Res. 2017, 99, 155–171. [Google Scholar] [CrossRef]
- Li, R.B.; Zhang, T.A.; Liu, Y.; Lv, G.Z.; Xie, L.Q. Calcification–carbonation method for red mud processing. J. Hazard. Mater. 2016, 316, 94–101. [Google Scholar] [CrossRef] [PubMed]
- Photong, C.; Pragot, W. Effect of adding monohydrocalcite on the microstructural change in cement hydration. ACS Omega 2022, 7, 36318–36329. [Google Scholar] [CrossRef] [PubMed]
- Xiao, J.; Ma, B.G.; Dong, R.S.; Chen, J.Q. Hydration properties of C3A-CaCO3-H2O system. Bull. Chin. Ceram. Soc. 2013, 32, 346–351. [Google Scholar]
- Ipavec, A.; Gabrovsek, R.; Vuk, T.; Kaucic, V.; Macek, J.; Meden, A. Carboaluminate phases formation during the hydration of calcite-containing portland cement. J. Am. Ceram. Soc. 2011, 94, 1238–1242. [Google Scholar] [CrossRef]
- Buchwald, A.; Hilbig, H.; Kaps, C. Alkali-activated metakaolin-slag blends—Performance and structure in dependence of their composition. J. Mater. Sci. 2007, 42, 3024–3032. [Google Scholar] [CrossRef]
- Kamruzzaman, A.H.M.; Chew, S.H.; Lee, F.H. Structuration and destructuration behavior of cement-treated singapore marine clay. J. Geotech. Geoenviron. Eng. 2009, 135, 573–589. [Google Scholar] [CrossRef]
- Yi, Y.L.; Zheng, X.; Liu, S.Y.; Al-Tabbaa, A. Comparison of reactive magnesia- and carbide slag-activated ground granulated blastfurnace slag and Portland cement for stabilisation of a natural soil. Appl. Clay Sci. 2015, 111, 21–26. [Google Scholar] [CrossRef]
- Chen, R.; Cai, G.; Dong, X.; Mi, D.; Puppala, A.J.; Duan, W. Mechanical properties and micro-mechanism of loess roadbed filling using by-product red mud as a partial alternative. Constr. Build. Mater. 2019, 216, 188–201. [Google Scholar] [CrossRef]
- Chang, J.; Xiong, C. Accelerated carbonation mechanism of monocarboaluminate under alkaline environment. J. Dalian Univ. Technol. 2019, 59, 536–542. [Google Scholar]
- Sha, L.; Zou, Z.M.; Qu, J.; Li, X.F.; Huang, Y.Y.; Wu, C.J.; Xu, Z.G. As(III) removal from aqueous solution by katoite (Ca3Al2(OH)12). Chemosphere 2020, 260, 127555. [Google Scholar] [CrossRef]
- Alex, T.C.; Kumar, R.; Roy, S.K.; Mehrotra, S.P. Mechanically induced reactivity of gibbsite: Part 2. Attrition milling. Powder Technol. 2014, 264, 229–235. [Google Scholar] [CrossRef]
- Castaldi, P.; Silvetti, M.; Garau, G.; Deiana, S. Influence of the pH on the accumulation of phosphate by red mud (a bauxite ore processing waste). J. Hazard. Mater. 2010, 182, 266–272. [Google Scholar] [CrossRef]
- Zhang, W.; Gu, J.; Zhou, X.; Li, Y.; Wang, Y.; Xue, Y.; Liu, X. Circulating fluidized bed fly ash based multi-solid wastes road base materials: Hydration characteristics and utilization of SO3 and f-CaO. J. Clean. Prod. 2021, 316, 128355. [Google Scholar] [CrossRef]
- Liu, Z.B.; Li, H.X.; Huang, M.M.; Jia, D.M.; Zhang, N. Effects of cooling method on removal of sodium from active roasting red mud based on water leaching. Hydrometallurgy 2017, 167, 92–100. [Google Scholar] [CrossRef]
- Kurdakova, S.V.; Grishchenko, R.O.; Druzhinina, A.I.; Ogorodova, L.P. Thermodynamic properties of synthetic calcium-free carbonate cancrinite. Phys. Chem. Miner. 2014, 41, 75–83. [Google Scholar] [CrossRef]
- Sirbescu, M.; Jenkins, D.M. Experiments on the stability of cancrinite in the system Na2O-CaO-Al2O3-SiO2-CO2-H2O. Am. Mineral. 1999, 84, 1850–1860. [Google Scholar] [CrossRef]
- Eisinas, A.; Dambrauskas, T.; Baltakys, K.; Ruginyte, K. The peculiarities of mayenite formation from synthetic katoite and calcium monocarboaluminate samples in temperature range 25–1150 °C. J. Therm. Anal. Calorim. 2019, 138, 2275–2282. [Google Scholar] [CrossRef]
- Kucharczyk, S.; Sitarz, M.; Zajac, M.; Deja, J. The effect of CaO/SiO2 molar ratio of CaO-Al2O3-SiO2 glasses on their structure and reactivity in alkali activated system. Spectrochim. Acta Part A Mol. Biomol. Spectrosc. 2018, 194, 163–171. [Google Scholar] [CrossRef]
- Ryu, G.S.; Lee, Y.B.; Koh, K.T.; Chung, Y.S. The mechanical properties of fly ash-based geopolymer concrete with alkaline activators. Constr. Build. Mater. 2013, 47, 409–418. [Google Scholar] [CrossRef]
- Zhang, N.; Liu, X.; Sun, H.; Li, L. Pozzolanic behaviour of compound-activated red mud-coal gangue mixture. Cem. Concr. Res. 2011, 41, 270–278. [Google Scholar] [CrossRef]
- Veerasingam, S.; Venkatachalapathy, R. Estimation of carbonate concentration and characterization of marine sediments by Fourier Transform Infrared Spectroscopy. Infrared. Phys. Techn. 2014, 66, 136–140. [Google Scholar] [CrossRef]
- Ni, F.; He, J.S.; Wang, Y.B.; Luan, Z.K. Preparation and characterization of a cost-effective red mud/polyaluminum chloride composite coagulant for enhanced phosphate removal from aqueous solutions. J. Water Process Eng. 2015, 6, 158–165. [Google Scholar] [CrossRef]
- Zhu, X.B.; Li, W.; Guan, X.M. An active dealkalization of red mud with roasting and water leaching. J. Hazard. Mater. 2015, 286, 85–91. [Google Scholar] [CrossRef] [PubMed]
- Lin, M.; Chen, G.; Chen, Y.H.; Han, D.D.; Xu, J. Hydrothermal solidification of alkali-activated clay-slaked lime mixtures. Constr. Build. Mater. 2022, 325, 126660. [Google Scholar] [CrossRef]
- Lapeyre, J.; Ponduru, S.A.; Okoronkwo, M.; Ma, H.Y.; Kumar, A. Hydration of high-alumina calcium aluminate cements with carbonate and sulfate additives. J. Therm. Anal. Calorim. 2022, 147, 5575–5587. [Google Scholar] [CrossRef]
- Castaldi, P.; Silvetti, M.; Enzo, S.; Deiana, S. X-ray diffraction and thermal analysis of bauxite ore-processing waste (red mud) exchanged with arsenate and phosphate. Clays Clay Miner. 2011, 59, 189–199. [Google Scholar] [CrossRef]
- Zhang, W.S.; Zhang, J.T.; Ye, J.Y.; Ren, X.H.; Liu, L.; Shen, W.G. Hydration kinetics and microstructure development of normal and NaAlO2-activated Al-doped β-C2S pastes. J. Am. Ceram. Soc. 2022, 105, 2221–2233. [Google Scholar] [CrossRef]
- Chang, J.; Xiong, C.; Zhang, Y.Y.; Wang, D. Foaming characteristics and microstructure of aerated steel slag block prepared by accelerated carbonation. Constr. Build. Mater. 2019, 209, 222–233. [Google Scholar] [CrossRef]
Disclaimer/Publisher’s Note: The statements, opinions and data contained in all publications are solely those of the individual author(s) and contributor(s) and not of MDPI and/or the editor(s). MDPI and/or the editor(s) disclaim responsibility for any injury to people or property resulting from any ideas, methods, instructions or products referred to in the content. |
© 2024 by the authors. Licensee MDPI, Basel, Switzerland. This article is an open access article distributed under the terms and conditions of the Creative Commons Attribution (CC BY) license (https://creativecommons.org/licenses/by/4.0/).