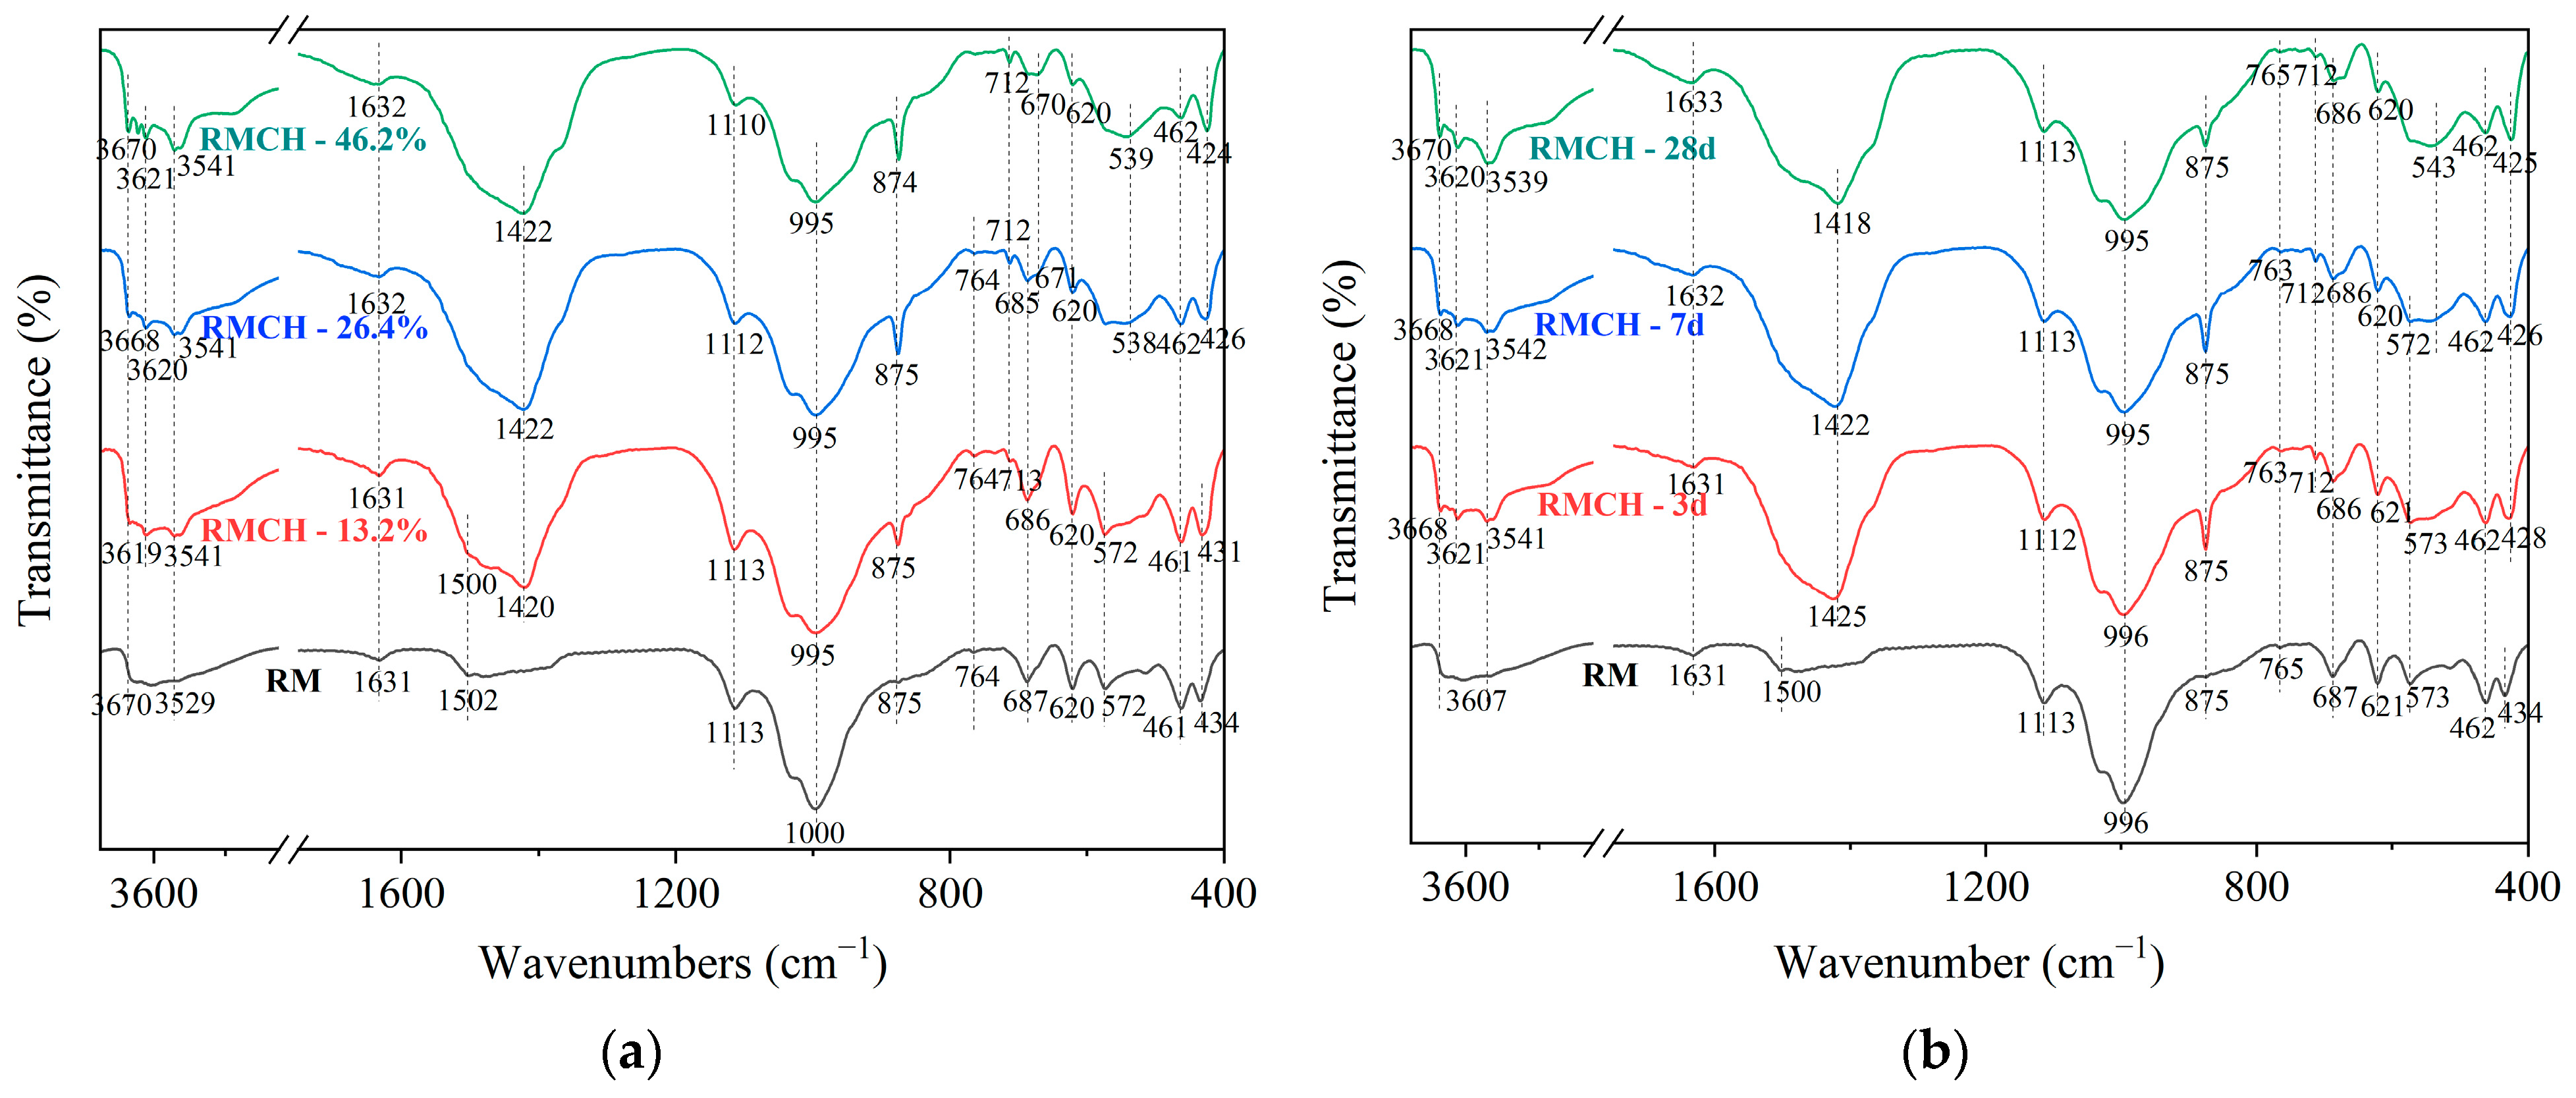
3.3. FTIR
The FTIR spectrum shows the absorption peaks of vibration characteristics of chemical bonds.
Figure 7 presents the FTIR spectra of different CH content at 7 days and different aging periods for RMCH incorporating 26.4% CH.
From
Figure 7a, it can be observed that the bands between 3670 and 3529 cm
−1 and 1631 cm
−1 are caused by O-H stretching vibrations, indicating the presence of O-H bonds in the active materials of RM [
42]. Comparing the vibrational characteristic peaks of RMCH and RM, it can be seen that with the increase in CH content, the vibrational characteristic peaks of RMCH are enhanced. The peaks at 3670 cm
−1, 3620 cm
−1, and 3529 cm
−1 correspond to the bending and stretching vibrations of water molecules’ O-H bonds in hydrated products. The peaks at 3620 cm
−1 and 3541 cm
−1 correspond to the stretching vibrations of Al-OH bonds [
43]. The peak at 1631 cm
−1 is attributed to H
2O trapped within the aluminum silicate structure [
44]. The absorption peak near 1631 cm
−1 is attributed to the asymmetric stretching and bending vibrations of H-O-H bonds, indicating the presence of interlayer water, mainly derived from C-(A)-S-H gel [
45].
At 1502 cm
−1, the peak represents the stretching and bending vibrations of C-O bonds in CO
32−. The absorption band at 764 cm
−1 is caused by the bending vibrations of CO
32− combined with the main channel phase of Cancrinite [
46].
The peak at 1113 cm
−1 is attributed to the asymmetric stretching of the Si-O-Al framework. The peaks observed at 687 cm
−1, 620 cm
−1, and 572 cm
−1 are due to the symmetric stretching of the Si-O-Al framework [
47,
48]. The peak at 434 cm
−1 represents the bending vibration of O-Al(Si)-O. It can be seen that the absorption peaks of RMCH with CH addition are weaker than those of RM, indicating that CH facilitates the reaction of active materials in RM. hydroxysodalite and faujasite-Na all have Si-O-Al and O-Al(Si)-O bonds.
Al-O-Al bonding was found at 671 cm
−1, and a dense band attributed to Al-O bending vibration was observed at 538 cm
−1 and 424 cm
−1. These peaks were present in RMCH-26.4% and RMCH-46.2%, indicating that high CH content facilitates the formation of these new substances [
49]. Al-O-Al and Al-O bonds exist in hemicarboaluminate and monocarboaluminate. Additionally, it is possible that the transition from Si-O-Al and O-Al(Si)-O bonds to Al-O-Al(Si-O-Si) and Al-O bonds occurred from 687 cm
−1 to 670 cm
−1, 572 cm
−1 to 537 cm
−1, and 432 cm
−1 to 424 cm
−1.
The peak at 995 cm
−1 corresponds to the stretching vibration of Si-O bonds; the absorption peak near 995 cm
−1 is due to the stretching vibration of Si-O-Si/Al bonds [
50], mainly from C-(A)-S-H [
51,
52]. At 1420 cm
−1, 875 cm
−1, and 712 cm
−1, characteristic peaks of stretching and bending vibrations of C-O bonds in carbonate are observed. The peaks become more pronounced after the absorption of CO
2, indicating a significant increase in carbonized products [
53]. There are slight differences in the variation patterns at these three positions, with a deeper and wider peak at 1420 cm
−1 and narrower peaks at 875 cm
−1 and 712 cm
−1. These peaks correspond to hemicarboaluminate, monocarboaluminate, and calcite [
49].
The peak at 462 cm
−1 corresponds to the stretching vibration of Fe-O bonds [
54], indicating that iron does not participate in the hydration process. Therefore, these two peaks persist throughout, but their changes are insignificant.
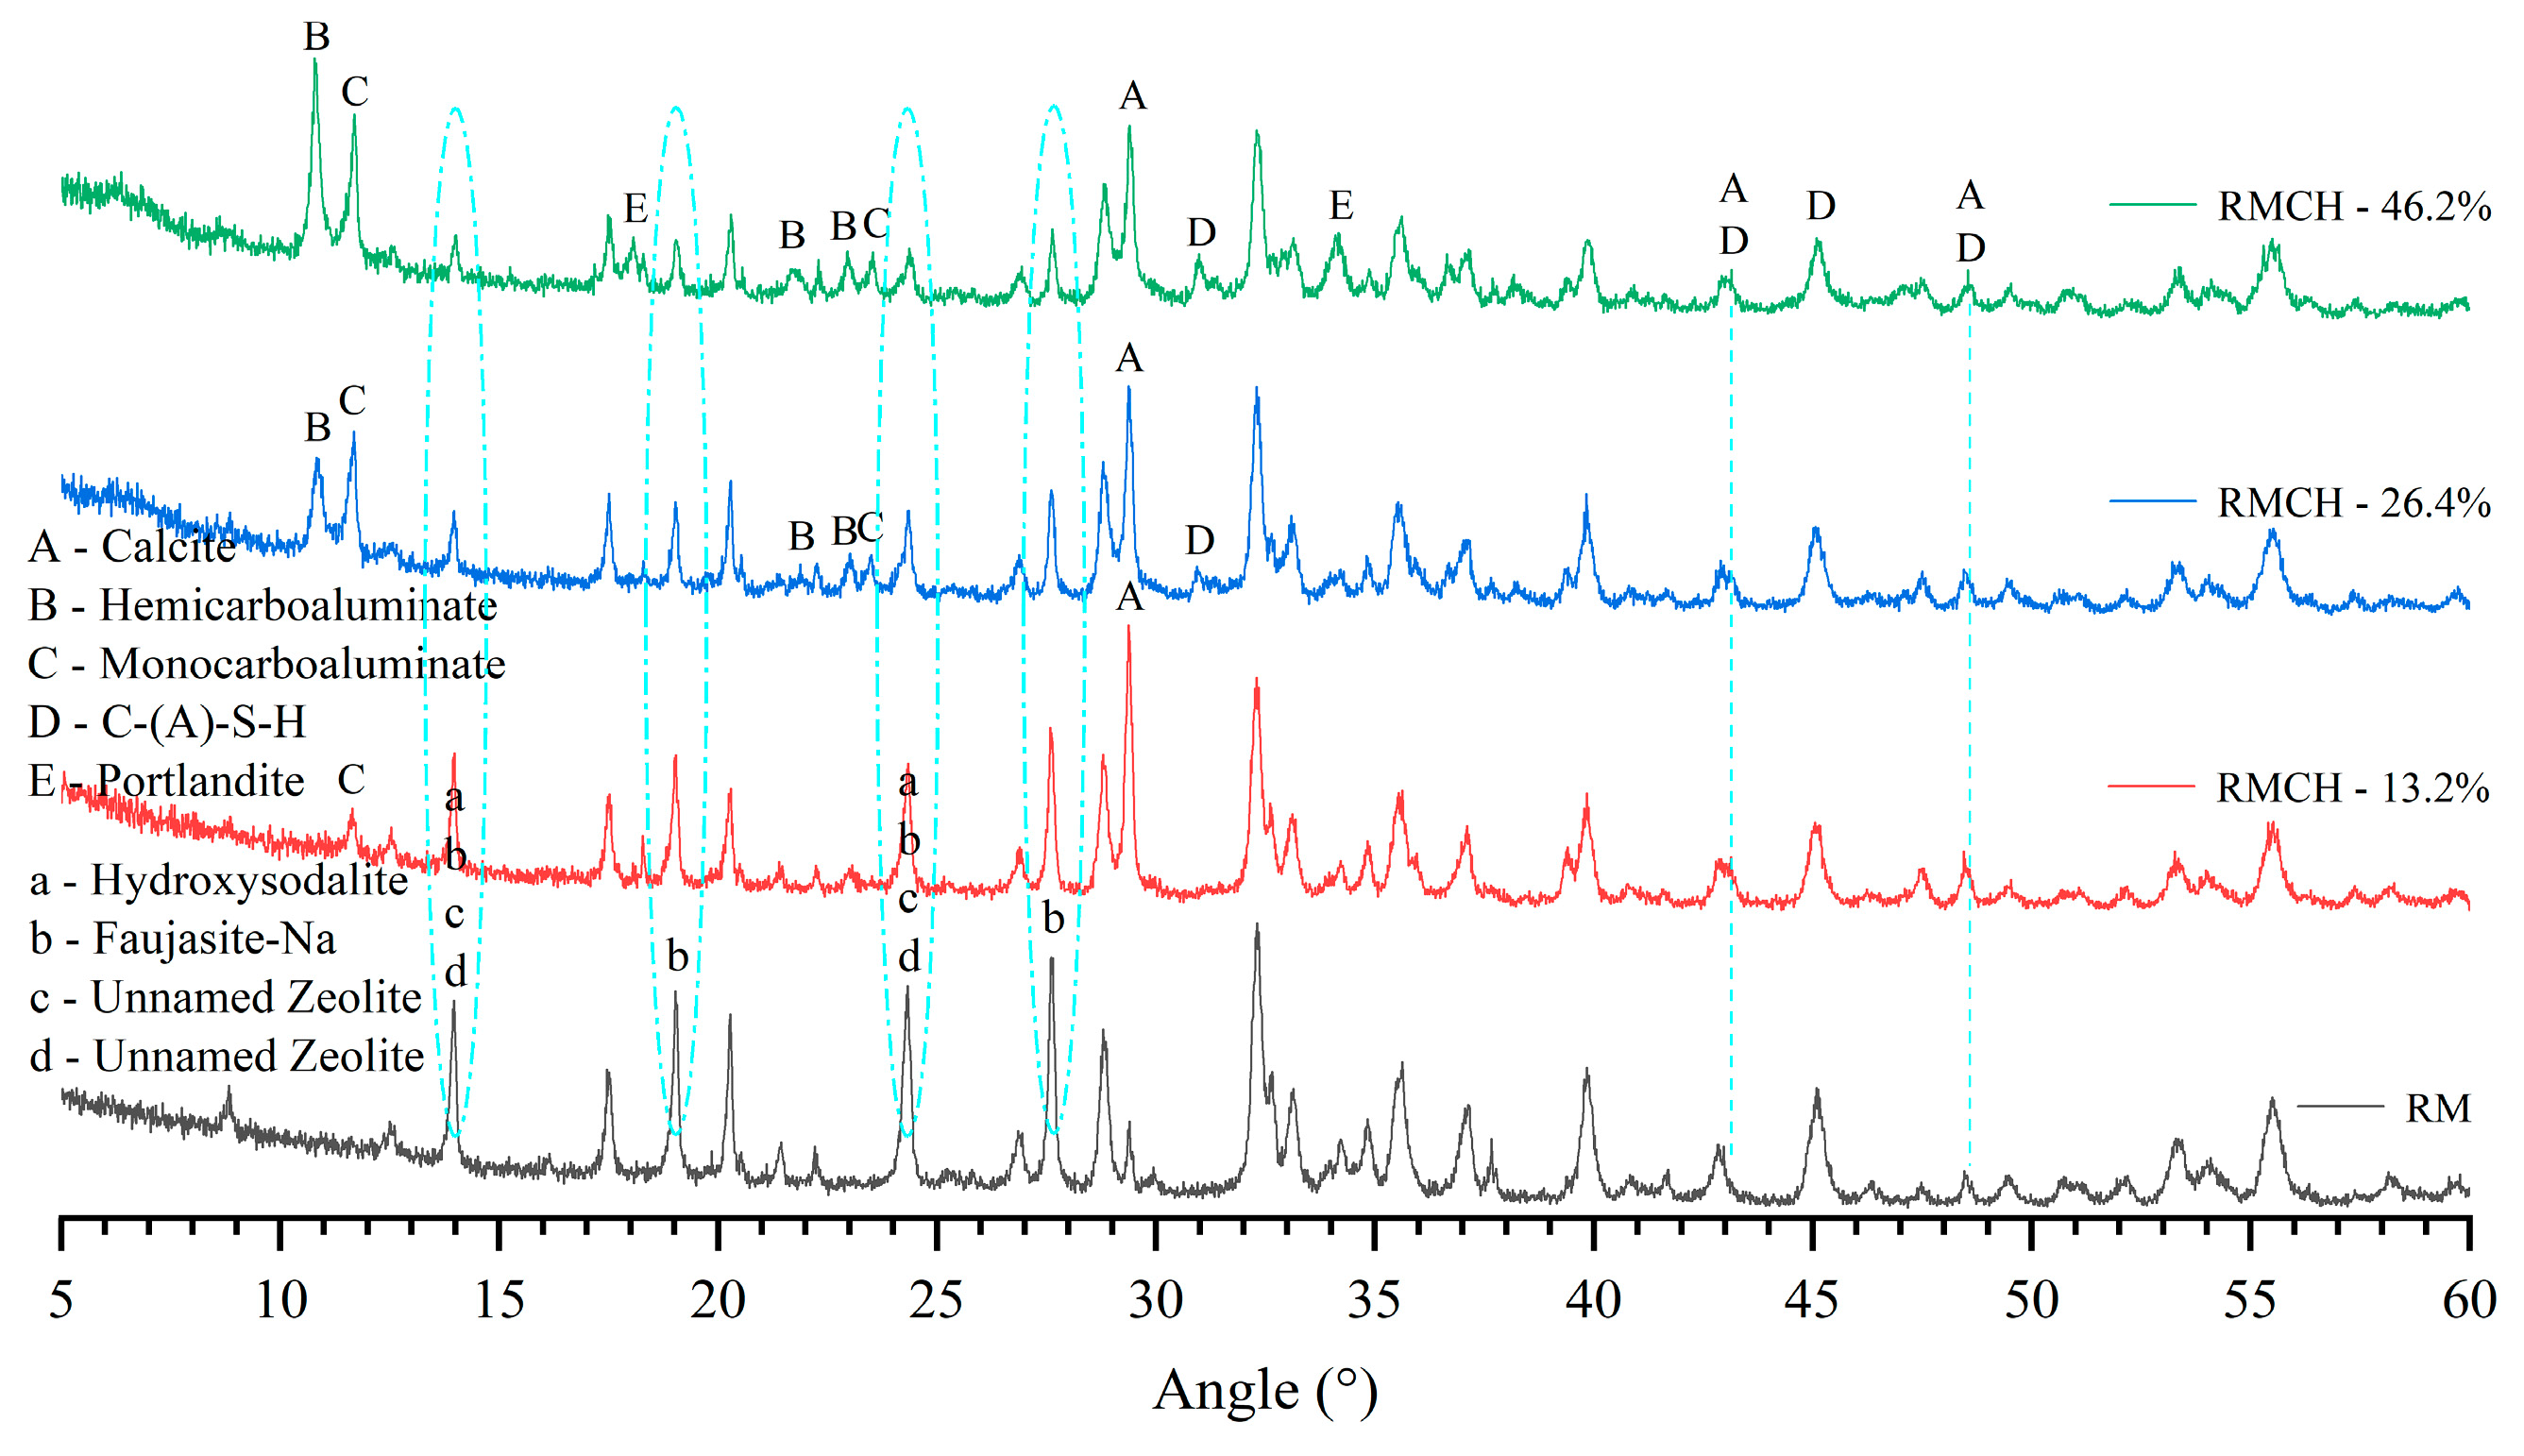
Analyzing the variation of RMCH with age at a CH content of 26.4% in
Figure 7b, several distinct characteristics are observed. The gradually increasing peak intensity of the H-O-H bending vibration at 1631 cm
−1 indicates an increase in C-(A)-S-H. The symmetric stretching peaks of the Si-O-Al framework in the regions of 687 cm
−1, 620 cm
−1, and 572 cm
−1 decrease, suggesting a reaction of the active substances in the RM. At 875 cm
−1 and 712 cm
−1, characteristic peaks of C-O bonds in carbonate are observed. The intensity of these peaks is significantly higher at 3d and 7d compared to 28d. Combined with the XRD peak analysis in
Figure 6, it is found that hemicarboaluminate and monocarboaluminate are more abundant at 3d and 7d, while they are almost completely decomposed at 28d. Therefore, it can be concluded that these peaks correspond to hemicarboaluminate and monocarboaluminate.
3.4. TG-DTG
Figure 8a provides a TG-DTG characterization of RMCH with different CH content at 7 days, describing the endothermic decomposition of RMCH. The results show that the peak patterns of RM and RMCH are different, with the peak values of RMCH increasing with CH content. The weight loss of RM between 30 °C and 160 °C is 0.93%, with an endothermic peak at 73 °C. This weight loss is mainly caused by the evaporation of free water, and the low weight loss rate is due to prior drying before the experiment. The weight loss of RM between 160 °C and 470 °C is 8.4%, with endothermic peaks at 290 °C and 335 °C. This is attributed to the vaporization of crystalline water in some minerals within the RM, accompanied by endothermic reactions. The weight loss of RM between 620 °C and 710 °C is 1.4%, with an endothermic peak at 700 °C, indicating the decomposition of carbonate minerals. After 710 °C, the mass reduction is slow [
55]. The TG-DTG of RMCH is related to the CH content. Taking RMCH-46.2% as an example, the weight loss of RMCH between 30 °C and 190 °C is 5.4%, with an endothermic peak at 150 °C, primarily due to the evaporation of free water. The weight loss of RMCH between 190 °C and 400 °C is 4.6%, with endothermic peaks at 270 °C and 330 °C, indicating endothermic reactions caused by the release of crystalline water in RMCH. The weight loss of RMCH between 400 °C and 470 °C is 1.3%, with an endothermic peak at 430 °C, representing the degradation of CH and indicating the structural thermal degradation of hydroxyl groups on CH [
56]. The weight loss of RMCH between 470 °C and 710 °C is 11.1%, with an endothermic peak at 710 °C, indicating the decomposition of carbonate minerals.
The endothermic peaks at 328 °C and 710 °C can be associated with the decomposition of hydroxysodalite [
31]. The peak at 710 °C is attributed to the decomposition of Cancrinite, specifically the reaction of CO
32− within Cancrinite, leading to the destruction of the crystal structure.
According to
Figure 8a, it can be observed that the peak intensity increases with the increase of CH at 150 °C, 330 °C, 650 °C, and 710 °C. At 180 °C (close to 150 °C), the evaporation of free water in Hemicarboaluminate occurs, and at 328 °C, the destruction of bound water takes place [
28]. At 150 °C, the crystal structure of monocarboaluminate is destroyed [
49], and the remaining chemically bound water is released between 200 and 330 °C [
57]. When the temperature is increased from 500 °C to 710 °C, the decarbonization reaction of monocarboaluminate leads to weight loss [
41]. The decomposition of calcite takes place at 650 °C and 710 °C, releasing CO
2 at these temperatures [
58]. The presence of a peak at 150 °C corresponds to the decomposition of C-(A)-S-H. The peak at 150 °C is attributed to the loss of interlayer water molecules [
59].
From
Figure 8b, it can be observed that with an increase in curing age, the peak intensity increases at 150 °C, 650 °C, and 700 °C. The peak at 150 °C can be attributed to the loss of free water in monocarboaluminate and C-(A)-S-H. The increase in peak intensity at 650 °C and 700 °C is believed to be associated with the decomposition of calcite, which corresponds to the changes in XRD peaks shown in
Figure 6.
3.5. SEM-EDS
When the CH content is 0, RM is mixed with water, placed in a mold, and cured for 28 days with a plastic wrap on the surface. If the surface is humid, no strength is observed.
Figure 9a shows a dried photo after tearing off the film, revealing uneven surfaces and the presence of large pores on the surface of the RM block. Observation with SEM at 5k× magnification, as shown in
Figure 9b, after mixing RM with water, the main form of the mixture is still small block-like particles, as shown in
Figure 3. These particles are mixed together in a muddy structure, but they do not exhibit any strength due to the lack of binding. This indicates that there is no formation of cementitious products when water is added to RM.
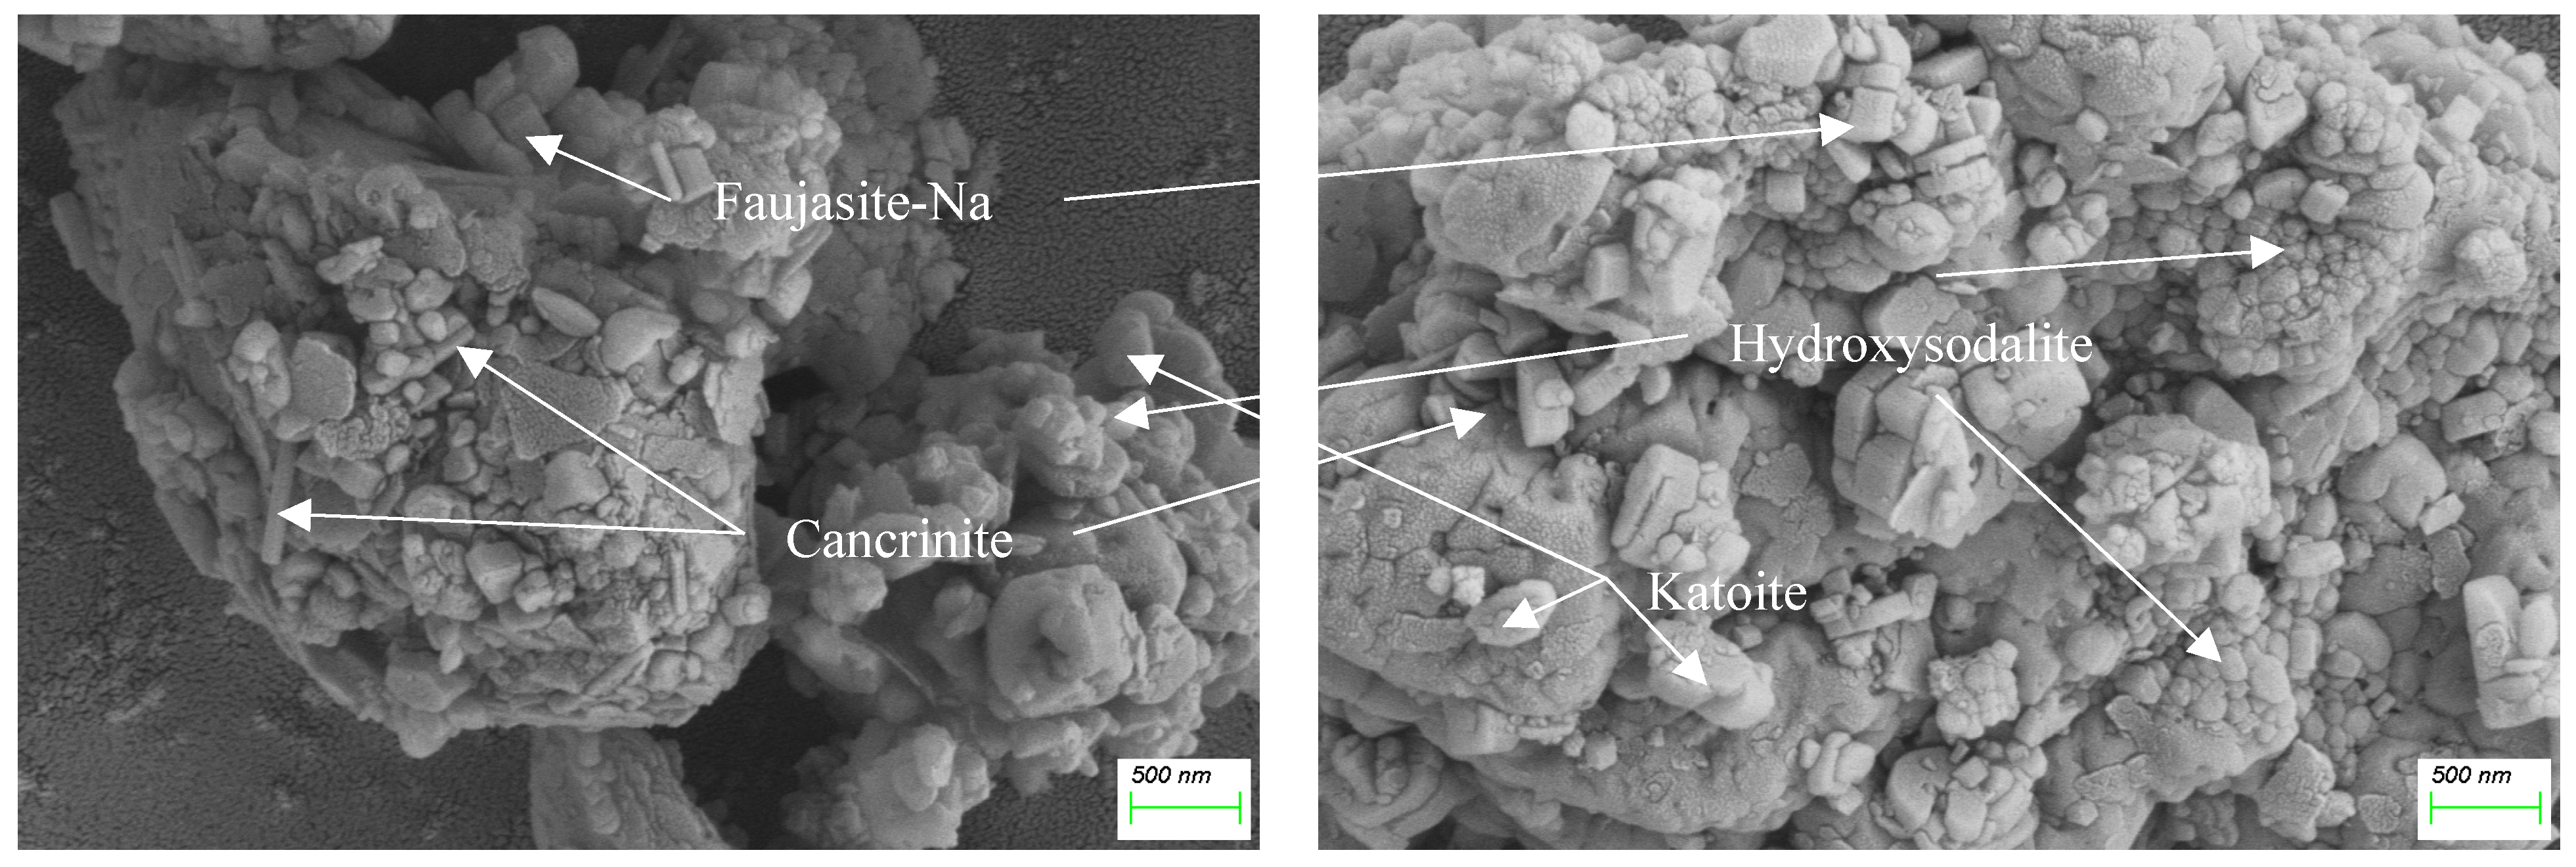
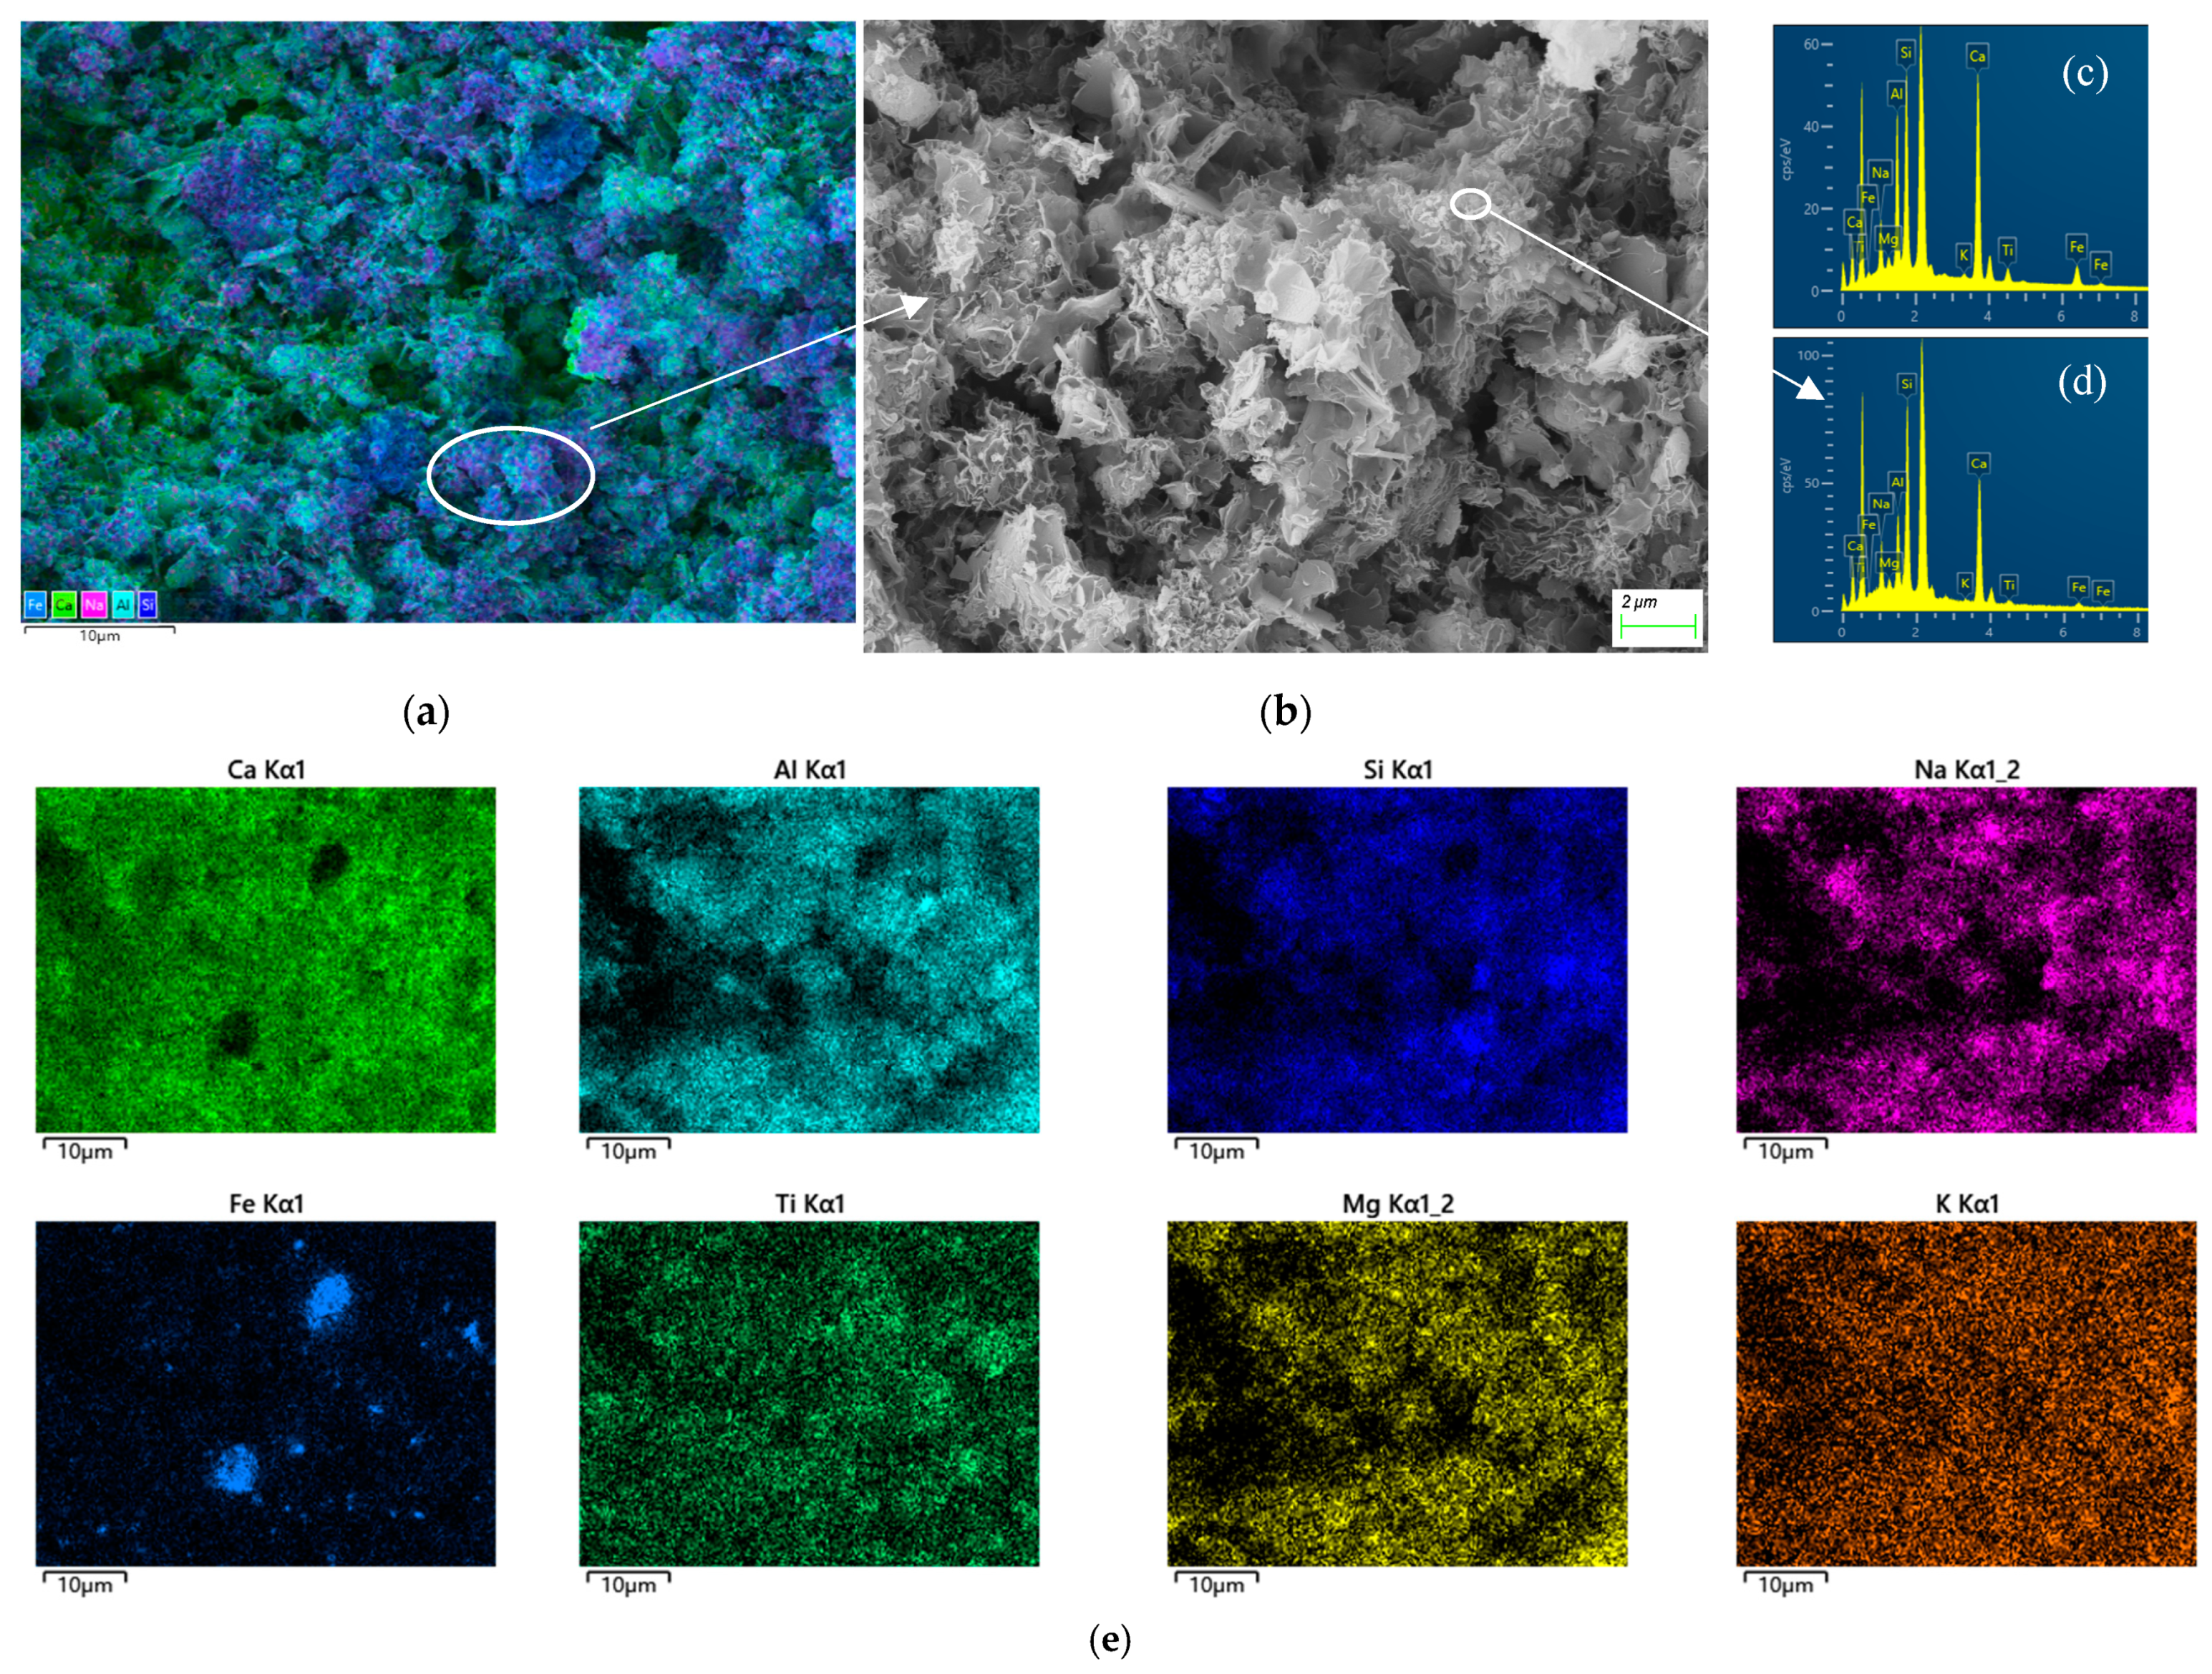
Figure 10 shows the 7-day SEM images and EDS spectra of RMCH with a CH content of 46.2%.
Figure 10a displays a 1k× morphology with a diameter of 13.09 μm. This area is further enlarged to 5k× in
Figure 10b. EDS layer characterization was performed to obtain elemental distribution maps of the characterization area. The elemental distribution map is shown in
Figure 10e; different colors represent different elemental distributions, with brighter colors indicating a higher degree of element enrichment. The large patchy region in
Figure 10b appears dark red, indicating a high aluminum (Al) content and a low silicon (Si) content. This observation is consistent with the elemental distribution characteristics of Al and Si shown in
Figure 10e. The overall elemental distribution map corresponding to
Figure 10b is shown in
Figure 10c, and the corresponding EDS data can be found in
Table 3. The irregular hexagonal thin sheet-like material with dimensions of 2–8 μm was analyzed using EDS line spectrum analysis, as shown in
Figure 10d. The EDS data can be found in
Table 4, confirming the presence of hemicarboaluminate [
57] and monocarboaluminate [
41], which is consistent with previous studies [
60]. Additionally, an area enriched with iron (Fe) was observed in
Figure 10e.
Figure 11 shows the 28-day SEM images and EDS spectra of RMCH with a CH dosage of 26.4%. In
Figure 11a, it can be observed that the colors blue and green are the most abundant, with the majority of the right side covered in dark blue. Using EDS layer characterization, the element distribution map is shown in
Figure 11e. Comparing
Figure 11a and
Figure 11e, Si, Al, and Ca are relatively enriched elements. The total element distribution spectrum corresponding to
Figure 11a is shown in
Figure 11c, and the corresponding EDS data can be found in
Table 5. These randomly oriented nanosheets have a thickness of several tens of nm and dimensions of 1 micron. They exhibit a large number of pores of varying sizes. The nanosheets support and intertwine with each other, forming a mechanically stable overall porous structure [
37]. Line spectrum analysis was conducted using EDS, as shown in
Figure 11d, and the EDS data can be found in
Table 6. The enlarged morphology of C-(A)-S-H can also be observed in
Figure 11a, and this result is confirmed by XRD analysis. An area enriched with Fe was also observed in
Figure 11e, similar to the Fe observed in
Figure 11e, indicating that Fe in the RM exists as a stable block-like material and is less prone to reaction and decomposition in this environment.
Figure 12 shows the SEM images of RMCH at different ages and CH contents.
Figure 12a and b are SEM images of samples containing 13.2% and 26.4% CH, respectively, at 7 days. It can be observed that the overall pore size on the sample surface decreases. The 26.4% CH sample exhibits more plate-like crystals and amorphous gels compared to the 13.2% CH sample.
Figure 12c,d are SEM images of samples containing 26.4% and 46.2% CH, respectively, at 28 days. The particles seen in
Figure 12c disappear in
Figure 12d, replaced by a large amount of gel-like material, resulting in a denser overall texture.
Comparing
Figure 12a,b, it can be observed that with the increase in CH content from 13.2% to 26.4% at a curing age of 7 days, there is a denser overlap between monocarboaluminate and C-(A)-S-H crystals, and the pores between mineral particles are significantly reduced. The morphology of C-(A)-S-H crystals becomes rounder, indicating an improved structural density. Comparing
Figure 12b,c, at a CH content of 26.4%, there is a denser morphology of C-(A)-S-H at both 7 and 28 days. Monocarboaluminate is almost absent. Comparing
Figure 12c,d, at a curing age of 28 days, with the increase in CH content from 26.4% to 46.2%, the initial pore size decreases, and the contact between mineral particles increases, resulting in the formation of more hydration products, which play a role in filling and cementing [
56]. When CH content reaches 46.2%, blocky and interleaved C-(A)-S-H fills the pores, and the decomposition of monocarboaluminate forms amorphous aluminum-containing minerals [
41], bonding loose mineral particles together, further improving the compactness, cementitiousness, and strength of the framework structure. This may contribute significantly to the strength and stability of the samples, consistent with the unconfined compressive strength development and XRD analysis results mentioned above.


