Abstract
Road silt loading (sL) directly affects the fugitive road dust (FRD) emission factor, which is an important parameter in the study of FRD emissions. In this study, an improved collection method combined with the AP−42 method was newly developed to estimate the sL of asphalt roads in Jinan, China. The characteristics of sL in Jinan followed the order National highway (NH) > Branch road (BR) > Provincial highway (PH) > Country highway (CH) > Minor arterial (MiA) > Major arterial (MaA) > Urban expressway (UE) with 3.9 ± 2.5, 3.9 ± 1.9, 3.8 ± 2.8, 3.8 ± 0.9, 2.1 ± 1.4, 1.7 ± 1.2, and 1.4 ± 1.2 g/m2, respectively. The size orders of PM2.5 and PM10 emission factors are consistent with total suspended particulate (TSP). The characteristics of the TSP emission factor of FRD followed the order NH > PH > CH > Expressway (EW) > MiA > BR > MaA > UE with 27.3, 23.4, 19.4, 13.7, 7.7, 7.4, 6.2, and 3.0 g/VKT (vehicle kilometers traveled), respectively. The annual emissions of TSP, PM10, and PM2.5 from FRD in Jinan in 2020 were about 985.2, 209.8, and 57.8 kt, respectively. Laiwu, Jiyang, and Licheng districts show the top three TSP emissions of FRD; the sum of their emissions accounts for 44.7% of the TSP emissions from FRD in Jinan. TSP emissions from municipal roads and administrative roads accounted for about 29.2% and 70.8% of the total emissions in Jinan, respectively, of which emissions from MiA accounted for the largest proportion of TSP emissions from municipal roads, contributing about 37.9%, while TSP emissions from NH made the largest contribution to TSP emissions from administrative roads, with a contribution of about 35.8%. Based on Monte Carlo simulation results using Crystal Ball, the uncertainty range of the emission inventory of FRD in Jinan ranged from −79.9 to 151.8%. In 2020, about 985,200 tons of road particulate matter in Jinan City entered the atmosphere, having an adverse effect on air quality and human health.
1. Introduction
In recent years, the frequent occurrence of dust and haze pollution events in northern, northeastern, and central China has attracted widespread attention in China [1,2], in which PM2.5 and PM10 have become the focus of attention as the core factors of pollution events [3,4]. Particulate matter pollution adversely affects the atmospheric environment and human health; in particular, heavy metal element-enriched PM2.5 and PM10 particles significantly endanger human health [5,6]. Road silt accumulation into the atmosphere due to motor vehicle traffic was one of the main contributing sources of particulate emissions from fugitive dust, and PM2.5 and PM10 concentrations near roads were more than 2−3 times higher than those in residential areas, due to the influence of fugitive road dust (FRD) [7,8]. Road silt, consisting of migrating and deposited soil sand and dust, construction dust, motor vehicle exhaust, and particles from tire wear, can be re-suspended in the atmosphere by motor vehicle wake or wind pickup, causing air pollution and endangering human health [9,10].
Current research on FRD focuses on emission characteristics and their chemical composition, as well as on sL [11,12,13,14,15]. Numerous studies have demonstrated that seasonal variations, local climatic conditions, atmospheric deposition, meteorology, road humidity, traffic characteristics, roadway type, and surrounding construction sites exert diverse effects on sL. Additionally, roadway sL may vary between urban and suburban areas [16,17,18,19,20]. Roadway sL is an important factor in measuring potential FRD emissions, but its wide range and scale make it difficult to monitor quickly and accurately, posing a great challenge for sL abatement. To date, few studies have reported the spatial and temporal characteristics of large-area road sL over time.
A literature review revealed that there is a lack of research related to the emission of particulate matter from road dust sources in Jinan as a study area, and there are few studies on the quantitative emissions of particulate matter from dust sources in Jinan. In this study, the 12 districts of Jinan are divided into urban functional core areas (UFCAs) and non-urban functional core areas (NUFCAs) based on degree of urbanization, with UFCAs including Shizhong, Tianqiao, Licheng, Lixia, and Huaiyin districts, and NUFCAs including Changqing, Zhangqiu, Laiwu, Gangcheng, Jiyang, Shanghe, and Pingyin districts.
The types of roads included in this study include administrative roads in addition to municipal roads, and the lengths of each type of road were obtained based on cartographic measurements. Municipal roads included MaA, MiA, BR, and UE, while administrative roads consisted of NH, PH, CH, and EW. The annual emissions of particulate matter from each type of road dust source were estimated at the township and street levels in Jinan, and a high spatial and temporal resolution emission inventory (1 km × 1 km) of road dust sources in Jinan was constructed based on the road network. Uncertainty analysis of the emission inventory was carried out by using the Monte Carlo method. The Monte Carlo method is a statistical method that generates random numbers to obtain a final result on the basis of the probabilities of various events through multiple simulations [21]. The established emission inventory of road dust in Jinan can reveal the impact of road dust on the atmospheric environment in Jinan, which will have a positive impact on the formulation of corresponding regulations, standards and countermeasures, the improvement of urban ambient air quality, and the improvement of health of the residents.
The present research is poised to delineate the influence exerted by road dust on the atmospheric environment within the city of Jinan. It is projected to exert a beneficial impact on the formulation of pertinent regulatory frameworks, standards, and strategic initiatives. Furthermore, it is anticipated to facilitate improvements in the quality of urban environmental air, thereby fostering the advancement of the physical and psychological well-being of the populace.
2. Materials and Methods
2.1. Study Area
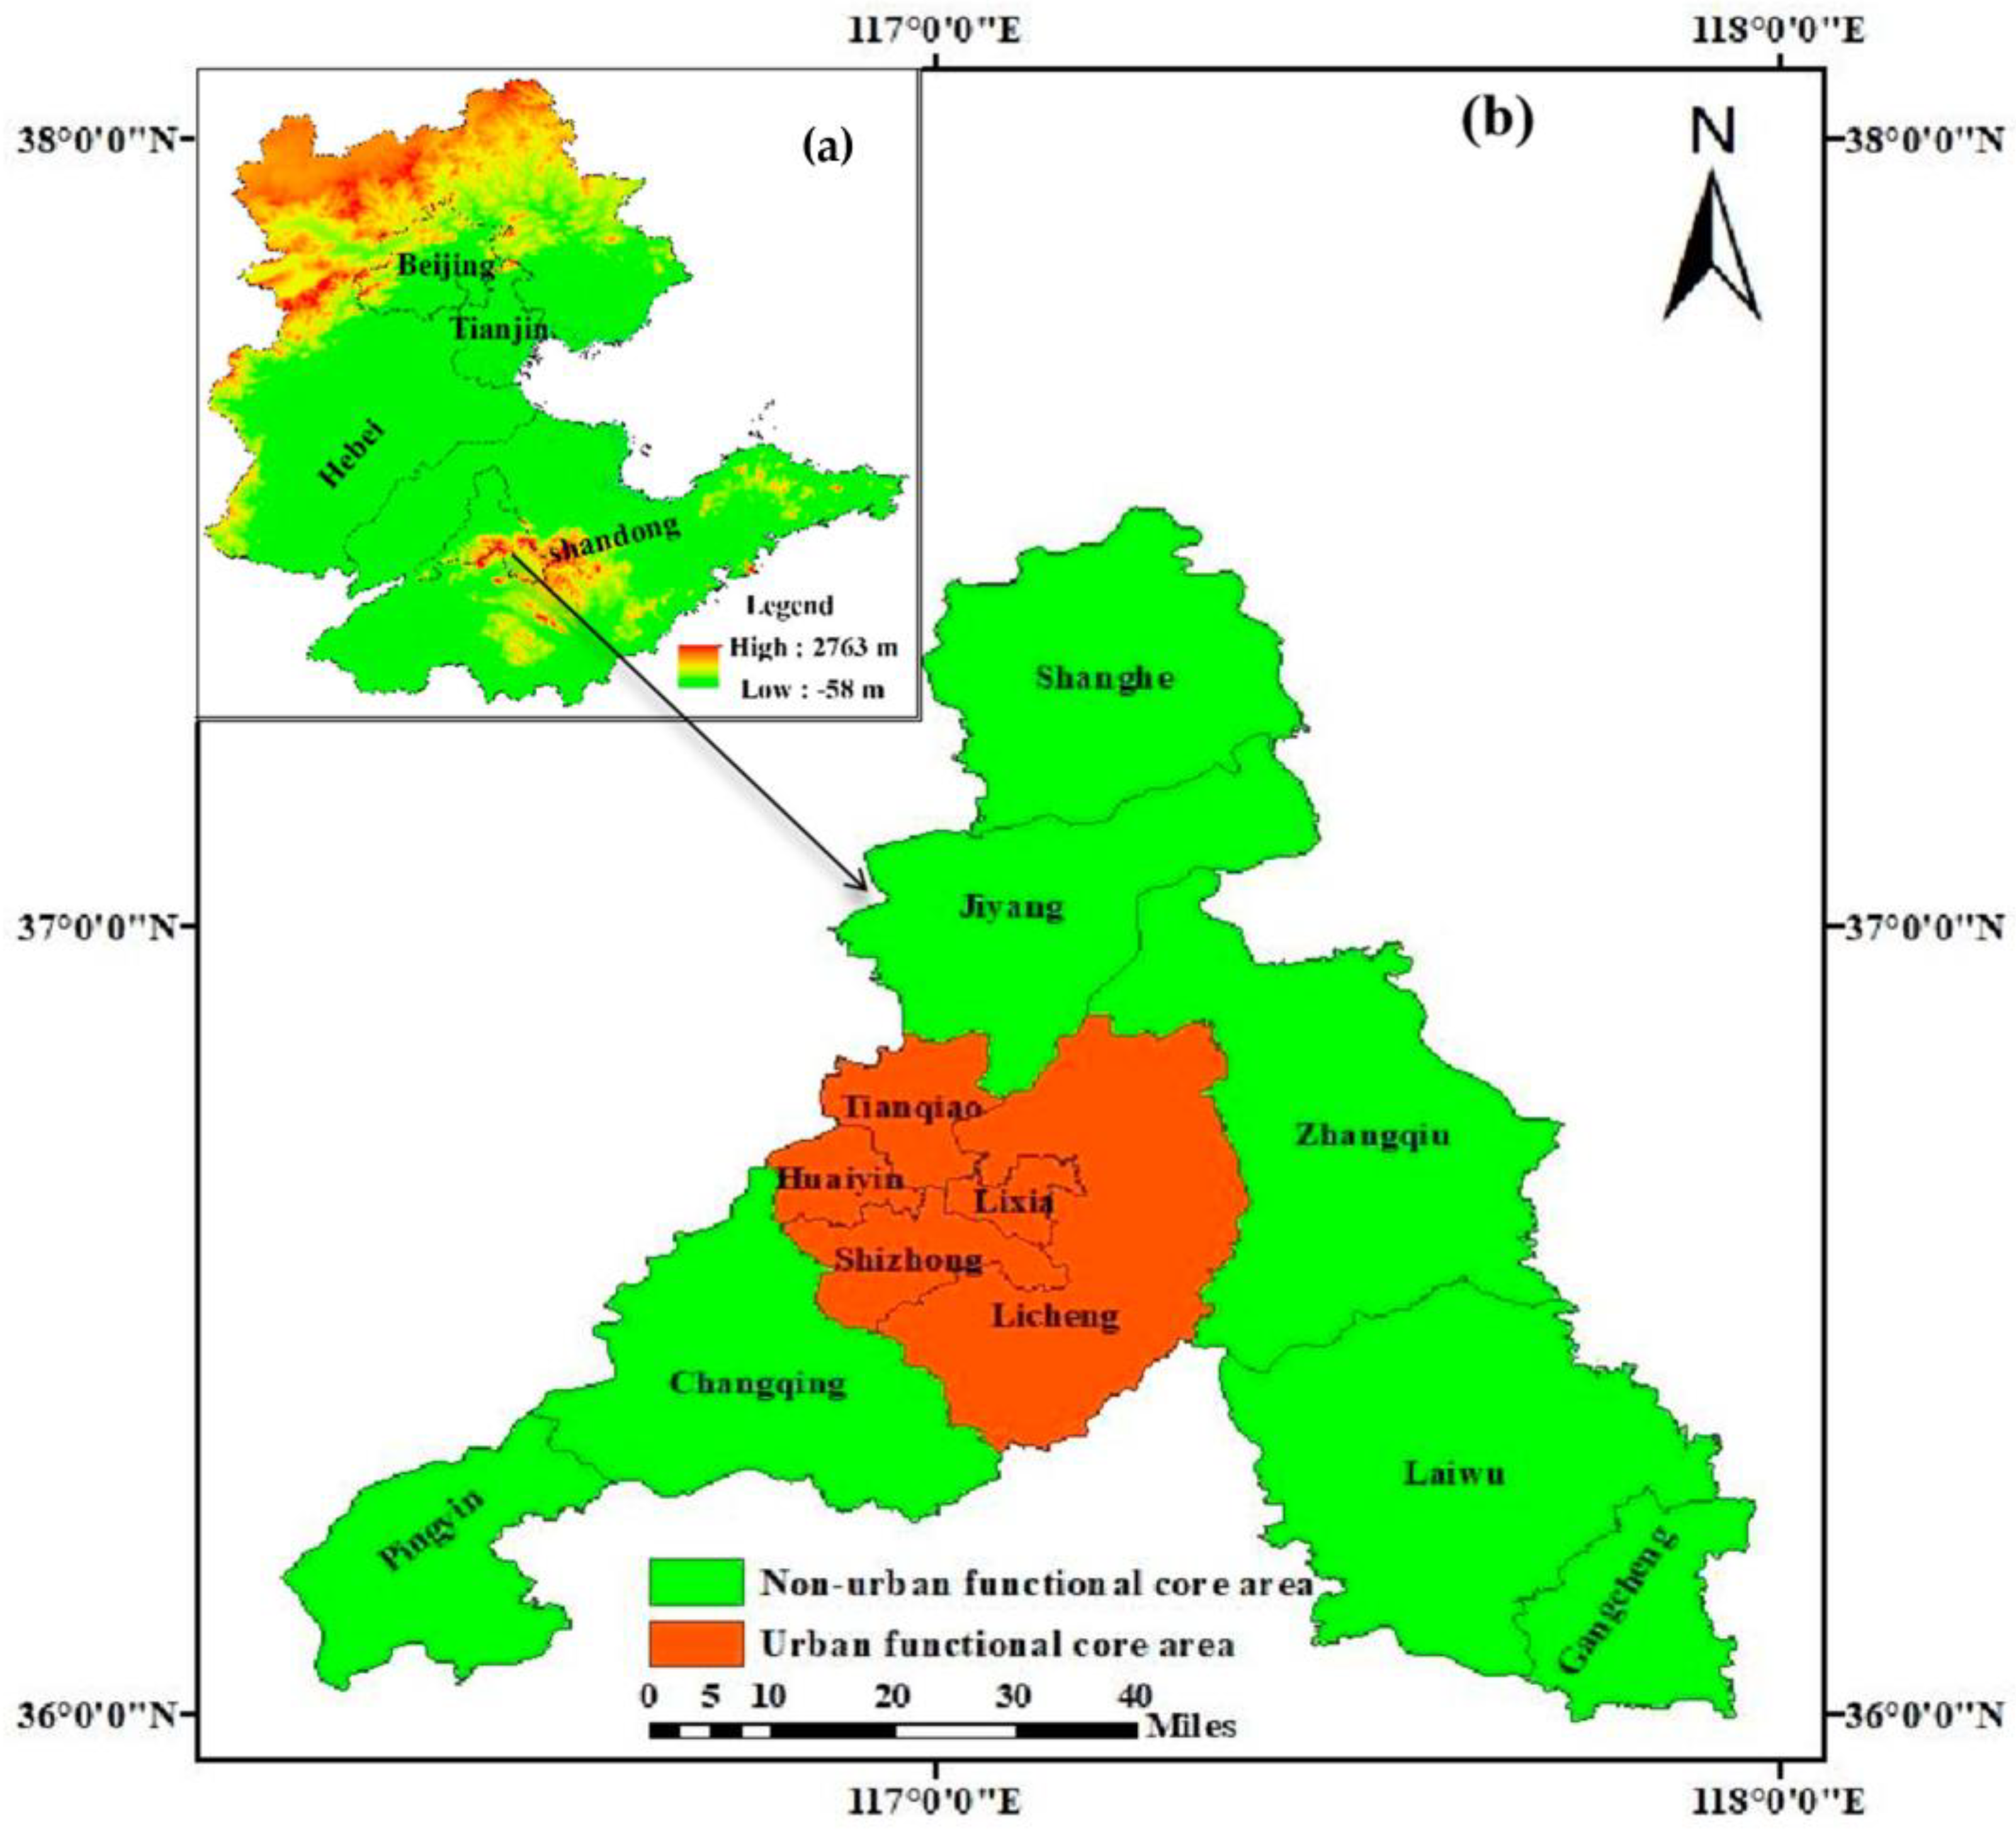
Jinan, the capital city of Shandong Province, is located in the North China Plain (Figure 1), and has a resident population of over 9 million. It is one of the “2 + 26” cities in the Beijing–Tianjin–Hebei air pollution transmission channel. Jinan is positioned at the intersection of southern Shandong Province’s low mountain and hill region and the northwestern alluvial plain. It is nestled close to Mount Tai in the southern direction and is demarcated by the Yellow River to the north. The terrain of Jinan features higher elevation in the south gradually transitioning to lower elevation in the north, encompassing a series of low mountains and hills, gently sloping plains at their foothills, and an extensive alluvial plain formed by the Yellow River. The air pollutants discharged locally are easily blocked by the southern terrain, and gather over Jinan or diffuse in the direction of Beijing–Tianjin–Hebei, which has great impact on air pollution in the Beijing–Tianjin–Hebei region.

Figure 1.
(a) Location of Jinan; (b) Locations of the twelve districts of Jinan.
In recent years, with further improvement of Jinan’s urbanization level, the urban built-up area was predicted to reach 841.2 square kilometers in 2020, which is 1.4 square kilometers higher than that of the previous year. The optimization of the road traffic network is constantly improving. In 2020, the road length was anticipated to be 7301 km, an increase of about 4.5% over the previous year. With the rapid development of the economy and the further improvement of urban construction, the number of vehicles is increasing year by year. Jinan had 3.139 million civil motor vehicles at the end of 2020, of which 2.794 million were civil vehicles, an increase of 8.1% over the previous year [22]. This means that all kinds of air pollutants emitted by motor vehicles (including particulate matter emitted from FRD sources) have an increasingly prominent impact on urban air, and if these emissions are not targeted and controlled, the problem of urban air pollution will undoubtedly be further aggravated.
2.2. Sample Collection
A total of 240 road dust samples were collected from 107 typical municipal roads and administrative roads in 12 municipal districts of Jinan using a fixed sampling method. The proportion of sampling points in the 12 districts was as follows: Shizhong (10%), Tianqiao (10%), Huanyin (10%), Lixia (8.75%), Licheng (11.25%), Changqing (8.75%), Zhangqiu (7.5%), Laiwu (7.5%), Gangcheng (7.5), Jiyang (8.75%), Shanghe (8.75%), Pinyin (7.5%). It is well known that conducting manual cleaning [23,24,25,26,27] or vacuum cleaning [28,29,30] allows fixed sampling. Fixed sampling was conducted by this means from September to October 2020. Each sample was composed of three sub-samples, which were respectively located in the middle of the road and on a 1 m2 road surface on both sides of the lane. Depending on the amount and particle size of road dust, the dust was obtained by vacuum cleaner or manual dust sweeping, and transferred to polyethylene bags. During the sampling period, the weather conditions were stable; only weather without rain and snow and where the wind speed was less than 4 m/s was selected for measurement, and it was necessary to avoid daily road sprinkling and ensure that the road surface was dry for at least 2 h.
2.3. Road Silt Loading Analysis
In the laboratory, samples were oven-dried at 40 °C for 24 h, mechanically passed through a 20 mesh sieve to remove large debris, and then sieved though a 200 mesh (75 μm) sieve. Analyses were restricted to <75 μm particles because of the higher environmental and health risks associated with fine particles compared to coarser fractions [31,32,33,34]. The sample was thoroughly sifted using a vibrating screen. Post-sieving, the total mass (M) of the material that passed through the 200 mesh screen was recorded. The sieving process was then repeated until the mass (M) of the material passing through the screen remained consistent. The continuous binary error was less than 3%. The road dust passing through the two sieves was weighed three times and recorded. The average value was W, which was calculated by the following formula:
where sL (g/m2) is the road silt loading, W (g) is the sample weight after passing through the 200 mesh sieve, and S (m2) is the sampling area.
2.4. Calculation of Emission Factors
To study the impact of sL on the atmospheric environment, the AP−42 model was used to calculate the emission factors, emissions, and emission intensity of FRD for the whole city, different districts, and different types of roads in 2020. Equations (2) and (3) describe the emission factor calculation:
where EFi,j,m (g/VKT) is the emission factors for PMi (TSP, PM10, and PM2.5) of different particle sizes i for road category j with different pollution control technologies m (VKT: Vehicle Kilometers of Travel), k is the particle size multiplier for particle size range i, sLj (g/m2) is the surface silt loading of road category j, Wj (ton) is the average weight of the vehicles traveling on road category j, (%) is the removal efficiency of different pollution control technologies m for road dust, is the proportion of vehicles in category p passing through road category j, and is the mass of vehicles in category p.
This study was calculated using the 2011 modified AP−42 model, as the pre-modified estimates were much higher than the actual resuspension conditions [35]. In 2011, the AP−42 model improved with the k values of 3.23, 0.62, and 0.15 for TSP, PM10, and PM2.5 based on a larger set of measurement data that was deployed to estimate re-suspension emissions.
The average annual traffic flow is the average number of vehicles passing through a particular type of roadway over a one-year period. In this study, the average daily and average annual traffic flow was calculated by assuming that a camera records the traffic flow at a suitable location on a typical road of each road type; the duration of each video was 30 min, and the 30-min traffic flow of different types of motor vehicles on the road was obtained through slow playback analysis of the video. The sampling time period of this study included the morning peak (7:00−9:00), the evening peak (17:00−20:00), and normal time periods on holidays and weekdays, so as to minimize errors caused by differences in the sampling time period. Table 1 shows the annual average traffic volume of different road types in Jinan.

Table 1.
Average annual volume of traffic by road type.
The weight of a vehicle is a crucial factor that impacts non-exhaust emissions. Heavier vehicles with a larger curb weight can create more turbulence, leading to increased dust emissions from re-suspension [20,36]. Heavy-duty weighted vehicles have the ability to grind coarser particles into finer ones, resulting in higher levels of resuspended PM emissions [37]. Furthermore, the frictional force associated with vehicle weight is a primary contributor to road wear, tire wear, and brake wear, which further contributes to typical non-exhaust emissions. Mobile vehicles are divided into six types denoted in Power-driven vehicles—Types—Terms and definitions [38], including large bus, medium bus, light bus, heavy truck, medium truck and light truck. Based on the proportion of different types of vehicles traveling on various roads in Jinan district, the average weight of each type of mobile vehicle traveling on different road types was estimated using Equation (3), as shown in Figure 2.
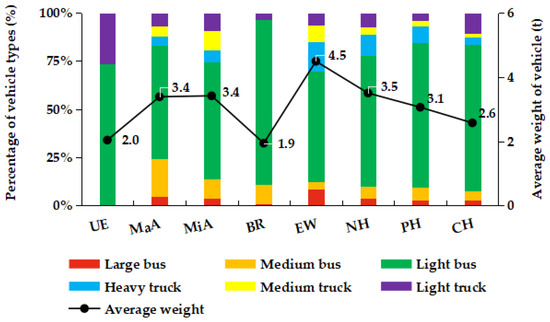
Figure 2.
Percentage and average weight of vehicle types.
2.5. Emissions Calculation
The emissions of TSP, PM10, and PM2.5 from FRD could be calculated by the following Equation (4):
where (t/a) is the emissions of PMi from FRD, (g/VKT) is the emission factor of the roads, L (km) is the length of the road network, N (v/a) is the average annual traffic flow of the road, and n is the number of wet days. According to precipitation data in Jinan in 2020 obtained from a meteorological website, the number of days with rainfall greater than 0.254 mm in 2020 was 73.
We applied the distance measurement function in 91WEMAP to measure the length L of UE, NH PH, CH, EW, MaA, MiA, and BR in the 12 districts of Jinan city. Figure 3 shows the road length results.
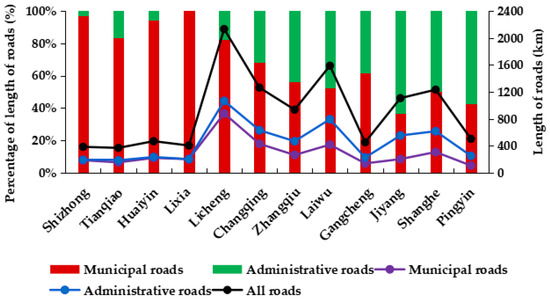
Figure 3.
Percentage and length of municipal and administrative roads.
ArcGIS was used to divide the area of Jinan city into 1 km × 1 km grids, count the number of grids corresponding to each of the 12 districts, and record the road type and length information in the grids. The ratio of the road length in each grid to the same type of road length in the district was used as the allocation factor to allocate FRD particulate emissions in the district, and the annual FRD emissions in each grid were calculated, so as to obtain the spatial distribution characteristics of particulate matter from road dust sources in Jinan city based on the urban road network at a high spatial resolution (1 km × 1 km).
2.6. Uncertainty Analysis
Assessing the potential uncertainty in emissions from different sources and regions to quantify the reliability of emission inventories is of paramount importance, as uncertainty studies can identify the direction of improvement for emission inventories and quantify the magnitude of improvements in emission inventories. Inventory uncertainty is inevitable, even if representative values of emission factors based on detailed experimental protocols are chosen for the estimation of emission inventories.
Uncertainty in the emission inventory of particulate matter from FRD is related to a variety of factors, such as the sampling method for sL, the efficiency of the particulate matter control measures for FRD, the volume of traffic, and the number of rainfall days. In this study, particle size multipliers, control efficiencies, and vehicle weights of the six types of vehicles were obtained from references or the “Technical Manual for the Compilation of the Urban Air Pollutant Emission Inventory”, while the other parameters were obtained by actual measurements. In this study, the Monte Carlo simulation method in Crystal Ball software 11.1.2.4. was used to evaluate the uncertainty of the particulate matter emission inventory of FRD in the urban and non-urban functional core areas of Jinan city, and the number of simulations was set to 10,000 with a confidence interval of 95%. The statistical distributions and coefficients of variation of the input parameters, such as activity levels and emission factors, used to estimate the uncertainty of the particulate matter emission inventories from FRD were determined based on data fitting and references to relevant published literature. Table 2 shows the coefficients of variation for the probability distributions of the relevant input parameters, and the methodology for determining them.
Table 2.
Selected parameters for the method and assumptions of uncertainty analysis.
3. Results and Discussion
3.1. Spatial Characteristics of sL on Different Types of Road
3.1.1. Spatial Characteristics of sL on Municipal Roads
Various studies have proved that the road sL of different types of roads are obviously different, due to their different functions [17,40,41]. Table 3 and Figure 4 show the road sL on different types of roads in 2020.
Table 3.
Descriptive statistics of sL in UFCAs and NUFCAs in 2020.
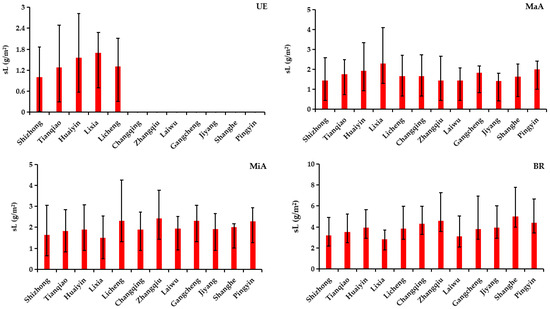
Figure 4.
The sL of municipal roads in different districts.
The average values of sL for the four types of municipal roads (UE, MaA, MiA, and BR) in the UFCAs of Jinan were 1.4, 1.9, 2.1, and 3.5 g/m2, respectively. The main reasons for these results may be related to the traffic characteristics of the different types of roads and the conditions of the road surfaces. A number of BR in Jinan have been in use for a long time, and there are obvious aging phenomena, coupled with the fact that compared with other roads, there are big differences in the mode and frequency of road sweeping and cleaning operations on BR, which lead to BR having the highest sL among municipal roads. The value of sL on UE is the smallest; the sL of UE is primarily attributed to vehicles, with reduced impact from sand settlement in the surrounding landscape. The main reason is the relatively recent construction of UE; the damage to the road surface is slight, and the main body of the road is mainly elevated, so it is not easy for soil and sand in the surrounding environment to be brought up to the road surface by external force.
As of 2020, no UE have been built in the NUFCAs of Jinan. The average values of sL of the MaA, MiA, and BR in the NUFCAs are 1.6, 2.2, and 4.2 g/m2, respectively; the average value of the sL of the MaA in the NUFCAs is found to be smaller than that in the UFCAs, and slightly larger than that of the UE, which is mainly due to the fact that the number of MaA in the NUFCAs are fewer and shorter, and they are often located in busy areas in the centers of districts and counties in the NUFCAs. Compared with other road types, MaA in NUFCAs have more comprehensive and timely cleaning and maintenance, and the environment and greening around the roads are better, so the chance of particles in the surrounding environment entering the MaA is smaller.
As can be seen from the sL of municipal roads in Jinan, the sL of the same type of municipal road varies greatly in different districts, and the values of the sL of municipal roads in the same district can be up to a hundred times different. In the UFCAs, the difference in the sL of different types of roads in Lixia district is the largest at (0.05–9.03) g/m2, and the standard errors of the sL of the MaA and MiA are the largest, at 1.8 and 2.0, respectively. The huge disparity in the urbanization level may be the main reason for the great variability of sL in streets or townships in Lixia district. Areas such as Baotu neighborhood, Daming Lake neighborhood, Quancheng Road neighborhood, and other neighborhoods have a high degree of overall greening. The road maintenance and repair are relatively perfect, and therefore, the regional road surface environment and traffic conditions are good. By contrast, the green area is relatively low in Shunhua Road Street, Zhiyuan Street, and Yaojia Street, city modernization construction is being further improved, street construction areas and construction vehicles are relatively more, and these factors undoubtedly increase the sL on the road surface in these neighborhoods.
Among the NUFCAs, Zhangqiu district has the largest range of differences in sL on different types of roads of 0.02–7.66 g/m2. The urban–rural divide may be the main reason for the huge difference in sL in NUFCAs, and the difference is especially obvious in Zhangqiu district. Currently, the urban centers of the NUFCAs have a higher degree of urbanization and construction, and the regional environmental factors or road conditions and road cleaning measures affecting the sL are generally better than those in the suburbs or new towns under reconstruction. The sL in suburbs or new towns under reconstruction is either due to urban construction, resulting in construction dust entering the road environment, or due to the existence of large un-green and less green areas in the construction area, resulting in exposed particulate matter entering the road environment due to human disturbances or wind and other factors. Urbanization is part of a process of old and new kinetic energy conversion: peak carbon emissions and carbon neutrality are targeted for achievement, with a strategy that promotes a coordinated approach to carbon reduction, pollution reduction, green expansion, and economic growth. The transformation of industries is to be facilitated, and the development and dissemination of low-carbon technologies are to be encouraged. With the implementation of this strategy in the strong provincial capital of Shandong Province, the level of urbanization in Jinan city is anticipated to experience a continuous rise, and the difference in sL caused by the urbanization construction process will continue to exist for a long time.
3.1.2. Spatial Characteristics of sL on Administrative Roads
Due to limited conditions, the sampling of sL on EW was not conducted. However, considering that UE have a similar natural environment in which the road is situated and pavement, this study replaces the sL of EW with the sL of UE in the same district, and the value of the sL of EW in the NUFCAs is replaced by the average value of the sL of UE in Jinan city. Table 4 shows the results of the sL of administrative roads in Jinan.
Table 4.
The sL of administrative roads in the NUFCAs.
The sL of NH, PH, and CH in Jinan are 3.84, 3.78, and 3.75 g/m2, respectively, which are almost the same because the pavement materials, proportion of vehicle types, and natural environment of the roads are almost the same for the NH, PH, and CH in the study area. Compared with municipal roads, the accumulated road dust load of administrative roads is much larger than that of municipal roads, other than BR. Vehicle emissions and the migration and settlement of surrounding particulates make a significant contribution to sL on administrative roads, excluding expressways. For example, medium and heavy trucks account for about 15% of all vehicles on NH and PH; because of their large total mass, they are prone to cause damage to the road surface under high load conditions, and the particulate matter produced by non-exhaust fumes (tire wear, brake wear, and road wear) and exhaust emissions during driving is much larger than that from small buses, which account for the highest percentage of vehicles on municipal roads. In addition, the cleaning frequency of administrative roads is much lower than that of municipal roads, and there is also a big gap between the geographic environment around NH, PH and CH and that of municipal roads; for example, there are more village roads and unpaved roads connected to NH, PH and CH, and when vehicles pass through these roads to join the NH or PH, it is very easy to bring up dust into the atmosphere.
3.2. Emission Factors
3.2.1. Emission Factors of TSP, PM10, and PM2.5 from the FRD of Municipal Roads
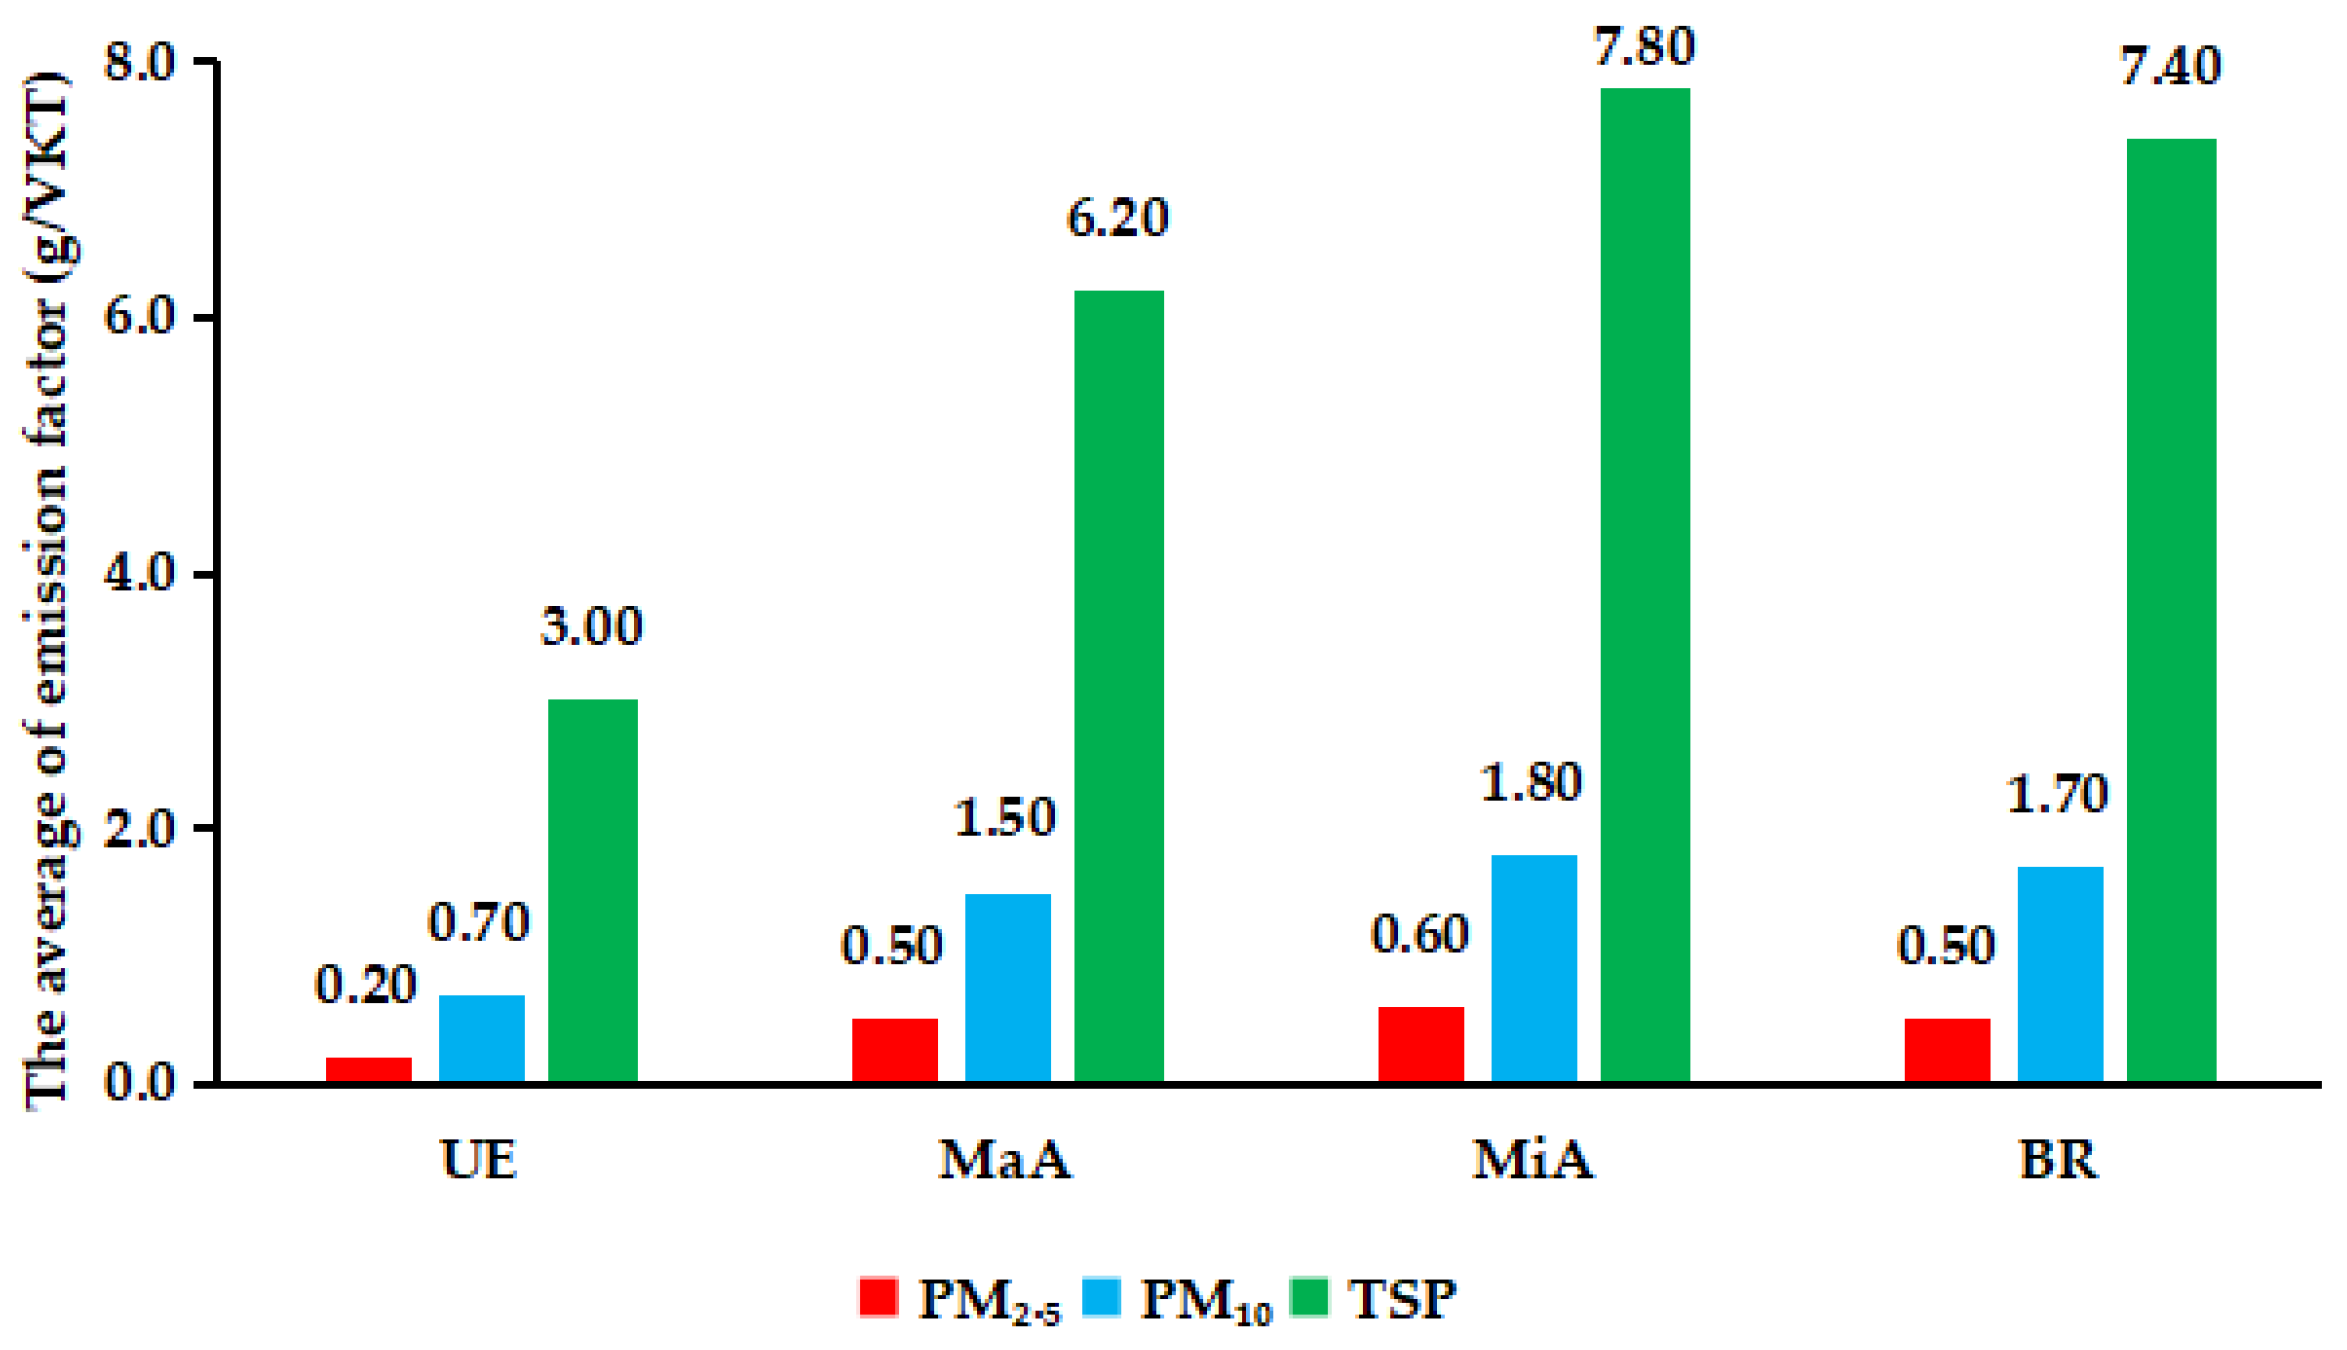
The emission factors of TSP from FRD on the EW, MaA, MiA, and BR in Jinan are 3.0, 6.2, 7.8, and 7.4 g/VKT, respectively; the emission factors of PM10 from FRD are 0.7, 1.5, 1.8, and 1.7 g/VKT, respectively. The PM2.5 emission factors were 0.2, 0.5, 0.6, and 0.5 g/VKT (Figure 5 and Figure 6). Particulate matter emission factors for FRD from different road types of the same particle size vary by a factor of several times, and the present study discusses the TSP emission factors of FRD for the four types of municipal roads in Jinan.
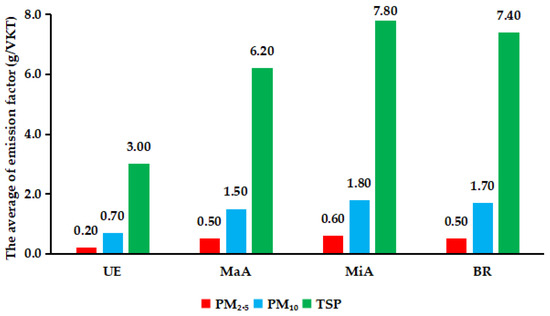
Figure 5.
Characteristics of average emission factors for different kinds of municipal roads in Jinan.

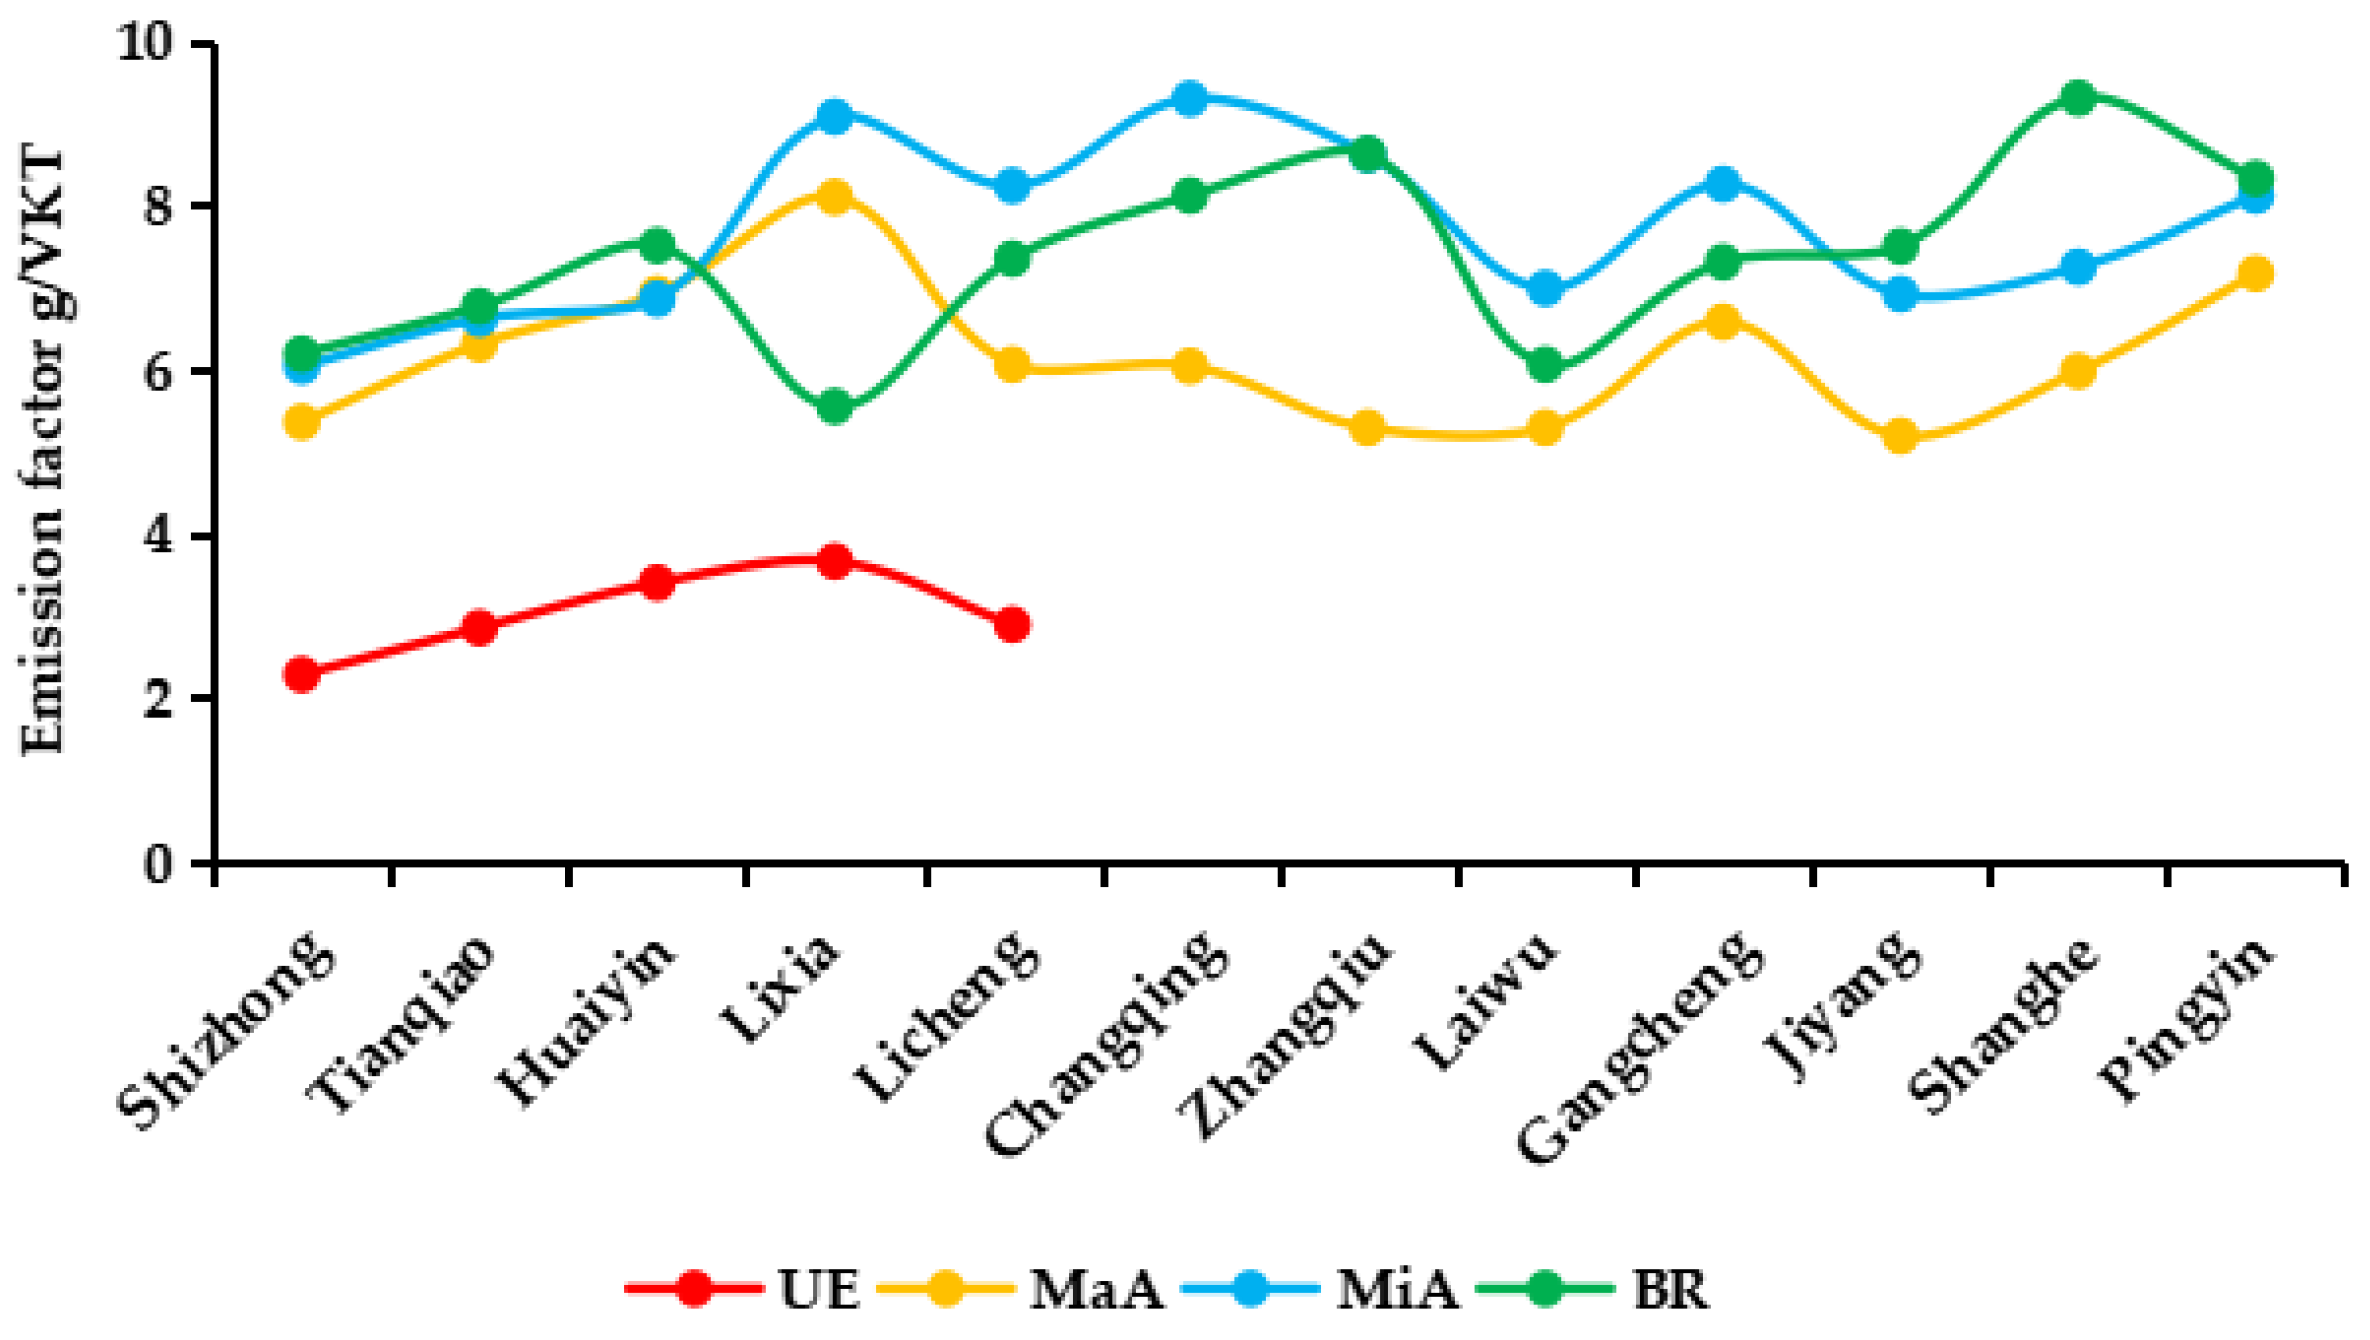
Figure 6.
Characteristics of TSP emission factors for different kinds of municipal roads.
The ranking of the TSP emission factor of municipal roads in Jinan is MiA > BR > MaA > EW, which may be due to different cleaning measures being taken on different roads, which makes the efficiency of the control measures of FRD particulate matter different, and the different cleaning methods also affect the size of the sL. In addition to the sL and the efficiency of FRD particulate matter control measures, the difference in the average weight of vehicles traveling on different roads is another important factor that affects the size of the TSP emission factor of FRD sources. For example, the sL of MiA is 1.2 and 1.5 times higher than that of MaA and EW, respectively. Although the sL of MiA is smaller than that of BR, the traffic volume of large buses and trucks on MiA is much larger than that on BR, resulting in the average weight of vehicles traveling on MiA (3.4 t) being about 1.8 times the average weight of vehicles traveling on BR. The TSP emission factor of FRD of the BR is larger than the MaA, which is mainly attributed to the different cleaning measures adopted for BR and MaA; for example, MaA undergo vacuum sweeping as the main measure, and water sprinkling measures are ensured more than two times a day, while BR undergo ordinary manual sweeping as the main measure. The cleaning measures for EW are the same as those for MaA, but in Jinan, large buses, medium buses, heavy trucks, and medium trucks are strictly prohibited on EW. The proportion of light buses and trucks on EW is about 75% and 25%, respectively, which makes the average weight of the vehicles traveling on the expressway only 2.0 t. In addition, the sL on expressways is the smallest among all municipal roads, which ultimately leads to expressways having the smallest particulate emission factor in the ranking of the particulate emission factors of the dust sources of municipal roads.
3.2.2. Emission Factors of TSP, PM10, and PM2.5 from the FRD of Administrative Roads
Table 5 shows the calculation results of the TSP, PM10, and PM2.5 emission factors of FRD in Jinan. Since the emission factors for different particle sizes of FRD are in the same order, this paper takes the TSP emission factor of FRD as the example for discussion. The order of TSP emission factors from FRD is NH > PH > CH > EW. The main factors affecting the size of the TSP emission factor of FRD are sL, average vehicle weight, and efficiency of particulate matter control measures for FRD sources. The particulate matter control measures for FRD sources on NH, PH and CH were similar, and the magnitude of their emission factors depended on average vehicle weight and sL. Although the average vehicle weight of vehicles traveling on EW was the largest, its sL was much smaller than that on NH, PH and CH, and the difference in sL between PH and CH was small, so the average weight of vehicles traveling on roads is the determining factor affecting the size of the emission factors of particulate matter from FRD sources on PH and CH.
Table 5.
Emission factors on different kinds of administrative roads.
The average TSP emission factor of administrative roads is 2.8 times higher than the maximum TSP emission factor of municipal roads. The main reasons for this include: (1) Except for EW, the sLs of administrative roads are similar to those of BR, which is about 1.8 times the sL of MiA. (2) The road cleaning measures of administrative roads are limited, except for special sections of some roads (e.g., densely populated areas) that are subject to regular sweeping and sprinkling. Other sections of the roads do not have regular road cleaning measures, which makes the efficiency of road cleaning in removing dust on administrative roads much smaller than that for municipal roads; for example, the efficiency of particulate control measures for road dust sources on municipal roads, except for feeder roads, can be up to 55%. (3) The proportion of truck traffic among highway vehicles is about 40%, of which the proportion of heavy truck traffic can be as high as 20%, which makes the average weight of vehicles traveling on the EW the largest (about 4.5 t). Although the sL of EW and UE are equal to each other, the TSP emission factor of EW is about four times that of the TSP emission factor of UE.
3.3. Emission Inventory of FRD
According to the estimation formula of particulate matter emissions from FRD sources, this study calculated TSP, PM10, and PM2.5 emissions of FRD by road type in each district in Jinan city in 2020; Figure 7 shows the emissions of TSP.
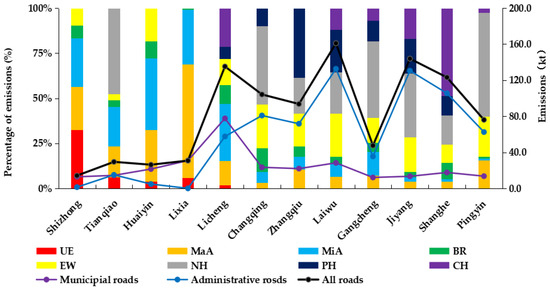
Figure 7.
TSP emissions from different sources of FRD in 12 districts of Jinan.
In 2020, the total annual emissions of TSP, PM10 and PM2.5 from about 5400 kilometers of roads in Jinan were as follows: TSP emissions were 985.2 kt, PM10 emissions were 209.8 kt, and PM2.5 emissions were 57.8 kt, of which the TSP emissions from municipal roads and administrative roads were about 287.4 kt and 697.8 kt, accounting for 29.2% and 70.8%. Among the 12 districts in Jinan, the total emissions of particulate matter from FRD in Licheng district accounted for the largest proportion, with annual emissions of TSP, PM10, and PM2.5 of 135.2, 30.1, and 8.8 kt, respectively, which accounted for 57.3%, 56.5%, and 55.6% of the total emissions of TSP, PM10, and PM2.5 from the UFCAs of Jinan, and for 13.7%, 14.3%, and 15.1% of the total emissions of TSP, PM10, and PM2.5 from Jinan city. This is mainly due to the fact that among the five districts in the UFCAs of Jinan, Licheng district ranks first in terms of its length of transportation roads, which is about 1065.2 km, accounting for 19.7% of the total length of roads in Jinan, and among which the length of MiA accounts for the highest proportion, which is about 37.1%.
By calculating the emissions of particulate matter from different types of roads, it is found that MiA accounts for the highest proportion of particulate matter among municipal roads, with a TSP emission of 108.9 kt, accounting for 37.9% of the total TSP emission from municipal roads; the highest proportion of particulate matter emission from administrative roads is from NH, with an emission of 249.5 kt, accounting for 35.8% of the total TSP emission from administrative roads. The main reason for the above results is that among the four types of municipal roads, the emission factor of particulate matter from MiA is the largest at 7.8 g/VKT, and its road length accounts for as much as 33.3% of the total length of municipal roads; the length of NH accounts for 26.9% of the total length of administrative roads. Although its length is slightly smaller than that of EW, the emission factor of particulate matter from NH is about twice as much as that from EW. In UFCAs, the particulate emissions from FRD sources mainly come from municipal roads, which contribute 58.1% of the total TSP emissions from FRD in the UFCAs, while TSP emissions from administrative roads account for as much as 82.6% of the total TSP emissions from FRD sources in NUFCAs of Jinan City.
The annual emissions of PM2.5 from FRD sources in Jinan in 2020 were 57.8 kt, as shown in Table 6; compared with Beijing’s 27.1 kt and 18.1 kt in 2019 and 2020, respectively, emissions in Jinan were 2.1 and 3.2 times higher, respectively. The emissions of PM2.5 from FRD sources in Wuhan in 2016 were only one-fifth of the emissions in Jinan, while emissions in Jinan in 2020 were close to twice as large as those in Tianjin in 2010 and Xi’an in 2018. It is worth noting that, with the exception of Wuhan, which has a smaller city area than Jinan, the other cities are either larger than or roughly the same size as Jinan; in the case of roads, Jinan has longer municipal roads, which may be the reason why the emission results of the city are larger than those of the other cities.
Table 6.
Urban FRD emissions at different cities in China.
The spatial distribution characteristics of PM2.5, PM10, and TSP in Jinan are highly similar, and the grid emission intensity increases with increasing particle size. Figure 8 shows the results of the spatial distribution characteristics of TSP from FRD in Jinan. The areas with high concentrations of particulate matter emissions from FRD are mainly concentrated in the UFCAs and the centers of districts in NUFCAs, and along EW and NH. This is mainly because UFCAs and the central regions of districts in the NUFCAs show the highest degrees of urbanization, population density, road grid density, and road traffic flow; these characteristics make the road dust source particulate matter emissions intensity of the central city and other districts and counties in the central region relatively high.
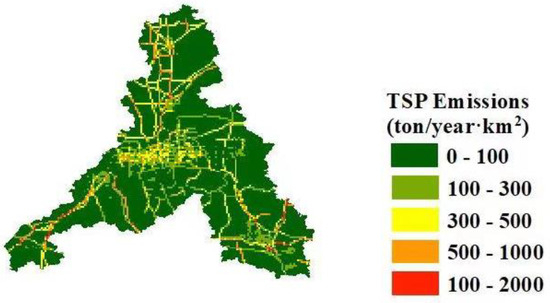
Figure 8.
Spatial distributions of emission intensities of TSP from the FRD grid in Jinan in 2020 (1 km × 1 km).
3.4. Uncertainty Analysis Conclusion
In this study, the uncertainty of the particulate emission inventory of FRD in Jinan in 2020 was quantitatively evaluated based on a Monte Carlo simulation, and Figure 9 and Figure 10 show the results.
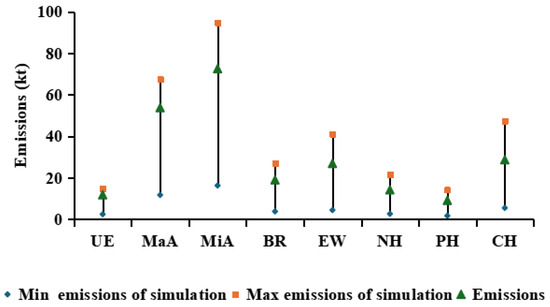
Figure 9.
Simulation results for the range of TSP emissions in UFCAs.
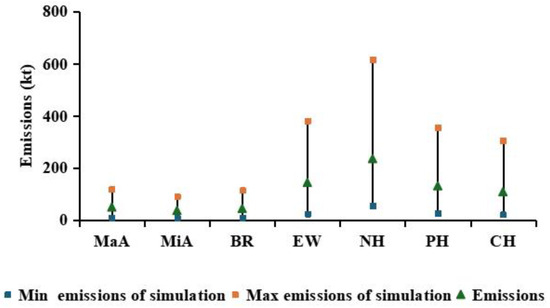
Figure 10.
Simulation results for the range of TSP emissions in NUFCAs.
The uncertainty ranges of particulate matter emissions from FRD on EW, MaA, MiA, BR, EW, NH, PH, and CH in the UFCAs of Jinan were −79.5–125.1%, −78.2–125.5%, −77.6–130.7%, −80.2–142.2%, −83.6–152.8%, −81.3–152.7%, −81.3–155.8% and −80.9–165.44%. The uncertainty ranges of particulate emissions from FRD on MaA, MiA, BR, EW, NH, PH, and CH in the NUFCAs were −79.6–137.3%, −78.6–148.1%, −78.1–156.6%, −83.3–164.6%, −76.6–161.3%, −79.2–170%, and −80.4–180.8%, respectively. The uncertainty range of particulate matter emissions from FRD on administrative roads in the NUFCAs of Jinan is larger than that from municipal roads, which is consistent with the results of the UFCAs, and CH are still the roads with the largest uncertainty in emissions. However, by comparing the uncertainty ranges of the UFCAs and NUFCAs, it can be found that the uncertainty range of FRD emissions in NUFCAs is larger than that in UFCAs. Specifically, the uncertainties of particulate matter emissions from FRD in the UFCAs and the NUFCAs are −80.4–143.8% and −79.4–159.8%, respectively. The reason why the uncertainties of particulate matter emissions from FRD in NUFCAs are larger than those from UFCAs is that NUFCAs are dominated by administrative roads, and the variations in parameters, such as sL, vehicle flows, and control measures for particulate matter from FRD, such as the removal efficiencies of FRD, are greater in administrative roads. The coefficients of variation of the parameters, such as dust accumulation load, traffic volume, and removal efficiency of the control measures for road dust sources, were higher than those of the municipal roads.
4. Conclusions
Based on road sL monitoring data in 2020 in Jinan, this study analyzed the spatial distributions of road sL in Jinan. Meanwhile, based on the emission factors of TSP, PM10, and PM2.5 from FRD on the different types of roads in Jinan, the annual emission intensities and emissions of TSP, PM10, and PM2.5 from FRD on the 12 districts of Jinan were deeply investigated. The results are shown below.
The average values of sL on EW, MaA, MiA, and BR in the UFCAs of Jinan are 1.4, 1.9, 2.1, and 3.5 g/m2, respectively, while the average values of sL on MaA, MiA, and BR in the NUFCAs are 1.6, 2.2, and 4.2 g/m2, respectively. Cleaning measures and the environmental conditions of the roads are the main factors affecting sL. The sL on NH, PH, and CH are 3.84, 3.78, and 3.75 g/m2, respectively, indicating that sL on administrative roads is much larger than that on municipal roads other than BR.
The size ranking of particulate matter TSP, PM10 and PM2.5 emission factors in FRD of EW, MaA, MiA and BR in Jinan is the same. The trend of the emission factors is MiA > BR > MaA > EW, and the main reasons for the size of the emission factors are the sL of the road, the average weight of vehicles on the road, and the different removal efficiencies of FRD under different cleaning measures. The size of administrative road emission factors are in the order NH > PH > CH > EW; the emission factors of NH and PH are larger, mainly due to the contribution of sL.
In 2020, the total annual emissions of TSP, PM10, and PM2.5 in Jinan were predicted to be 985.2, 209.8, and 57.8 kt, respectively, and the particulate matter TSP from FRD of administrative roads and municipal roads was predicted to be 287.4 and 697.8 kt, respectively. Licheng district has the largest share of total emissions of the twelve districts of Jinan, and its annual emissions of TSP, PM10, and PM2.5 were 135.2, 30.1, and 8.8 kt respectively, accounting for 13.7, 14.3, and 15.1% of the total emissions in Jinan. MiAs account for the largest share of municipal road emissions, with TSP emissions as high as 108.9 kt, accounting for 37.9% of municipal road emissions; the highest share of administrative road emissions is NH, with emissions of 249.5 kt, accounting for about 35.8%. The particulate matter emissions from FRD in UFCAs are mainly from municipal roads, while the particulate matter emissions from administrative roads account for the highest percentage of emissions in NUFCAs.
In Jinan city, the areas with highest concentrations of particulate matter emissions from FRD sources are mainly concentrated in the UFCAs of Jinan, consisting of Tianqiao, Shizhong, Licheng, Lixia and Huaiyin districts, the seven district centres of the NUFCAs, and areas along EW and NH. The road dust sources of particulate emissions in general present the characteristics of the discharge of particles along the road.
In 2020, the uncertainty range of the particulate matter emission inventory of FRD in Jinan was −79.9–151.8%, the uncertainty range of emissions from UFCAs was −80.4–143.8%, and the uncertainty range of emissions from NUFCAs was −79.4–159.8%; the uncertainty range of emissions from municipal roads was −78.83–149.11%, and that of emissions from administrative roads was −80.82–162.89%. The uncertainty ranges of particulate matter emissions from NUFCAs and administrative roads were the largest.
Heavy metals enriching road dust will enter the atmosphere and cause harm to human health. According to the literature, potentially toxic elements in road dust in 58 cities in China exist to different degrees, and the accumulation situation in eastern cities is more serious than in western cities. For example, the mean values of Pb, Cd, Cr, Cu, Zn, and Ni in road dust in 58 cities were 146.6, 5.1, 140.6, 158.2, 667.3, and 42.5 mg/kg [46]. Therefore, it would be meaningful to conduct further research into the concentrations of heavy metals in road dust within Jinan, a pivotal transportation hub in Eastern China, and to investigate their potential impacts on human health in subsequent studies. In order to improve the research further, the next step should be focused on the following aspects: (1) the key chemical components in road dust, such as heavy metals, should be quantitatively analyzed in typical cities; (2) the adverse impact on the ecological environment from road dust emission should be explored; (3) the source apportionment of road dust should be obtained using models such as Positive Matrix Factorization (PMF).
Author Contributions
Conceptualization, X.L. and N.W.; methodology, X.L.; software, X.L.; validation, X.L., X.Q. and B.J.; formal analysis, X.L.; investigation, X.L.; resources, X.L.; data curation, X.L.; writing—original draft preparation, X.L.; writing—review and editing, N.W.; visualization, N.W.; supervision, N.W.; project administration, X.L.; funding acquisition, X.L. All authors have read and agreed to the published version of the manuscript.
Funding
This research received no external funding.
Institutional Review Board Statement
Not applicable.
Informed Consent Statement
Not applicable.
Data Availability Statement
The data presented in this study are available upon request from the corresponding author. The data are not publicly available due to privacy.
Acknowledgments
The authors are very grateful to the editor and anonymous reviewers for their help and recommendations.
Conflicts of Interest
The authors declare no conflicts of interest.
References
- Amato, F.; Pandolfi, M.; Moreno, T.; Furger, M.; Pey, J.; Alastuey, A.; Bukowiecki, N.; Prevot, A.; Baltensperger, U.; Querol, X. Sources and variability of inhalable road dust particles in three European cities. Atmos. Environ. 2011, 45, 6777–6787. [Google Scholar] [CrossRef]
- Tian, Y.; Chen, G.; Wang, H.; Huang, F.; Shi, G.; Han, B.; Feng, Y.-C. Source regional contributions to PM2.5 in a megacity in China using an advanced source regional apportionment method. Chemosphere 2016, 147, 256–263. [Google Scholar] [CrossRef] [PubMed]
- Fan, M.; Zhang, Y.; Lin, Y.; Cao, F.; Sun, Y.; Qiu, Y.; Xing, G.; Dao, X.; Fu, P. Specific sources of health risks induced by metallic elements in PM2.5 during the wintertime in Beijing, China. Atmos. Environ. 2020, 246, 118112. [Google Scholar] [CrossRef]
- Li, Y.; Ji, Y.; Wang, S.; Zang, L.; Zhao, J. Pollution characteristics and health risk assessment of PM2.5-bound heavy metals in road dust deposition dduring spring in Tianjin city. Res. Environ. 2018, 31, 853–859. [Google Scholar]
- Fitz, D.; Bumiller, K.; Bufalino, C.; James, D. Real-time PM10 emission rates from paved roads by measurement of concentrations in the vehicle’s wake using on-board sensors part 1. SCAMPER method characterization. Atmos. Environ. 2020, 230, 117483. [Google Scholar] [CrossRef]
- Bogacki, M.; Mazur, M.; Oleniacz, R.; Rzeszutek, M.; Szulecka, A. Re-entrained road dust PM10 emission from selected streets of Krakow and its impact on air quality. In E3S Web of Conferences; EDP Sciences: Les Ulis, France, 2018; Volume 28, pp. 1003–1012. [Google Scholar]
- Luo, H.; Liao, L.; Wang, D.; You, S.; Tang, Y.; Liao, J.; Song, S.; Wen, J. Source list of atmospheric fine particulate matter from industrial emission in Guilin region. Chin. J. Environ. 2015, 9, 4942–4946. [Google Scholar]
- Wang, H.; Fan, S.; Han, L.; Li, T.; Qu, S.; Cui, H.; Liu, J. Emission characteristics of road silt loading at the exit of typical construction sites in autumn in Tongzhou District, Beijing. J. Environ. Eng. 2022, 12, 6–14. [Google Scholar]
- Alves, C.; Vicente, E.; Vicente, A.; Rienda, I.C.; Tomé, M.; Querol, X.; Amato, F. Loadings, chemical patterns and risks of inhalable road dust particles in an Atlantic city in the north of Portugal. Sci. Total Environ. 2020, 737 (Suppl. S2), 139596. [Google Scholar] [CrossRef] [PubMed]
- Ma, Y.; Gong, M.; Zhao, H.; Li, X. Contribution of road dust from Low Impact Development (LID) construction sites to atmospheric pollution from heavy metals. Sci. Total Environ. 2020, 698, 134243. [Google Scholar] [CrossRef]
- Li, P.; Xin, J.; Wang, Y.; Li, G.; Pan, X.; Wang, S.; Cheng, M.; Wen, T.; Wang, G.; Liu, Z. Association between particulate matter and its chemical constituents of urban air pollution and daily mortality or morbidity in Beijing City. Environ. Sci. Pollut. Res. Int. 2015, 22, 358–368. [Google Scholar] [CrossRef]
- Li, Y.; Song, N.; Yu, Y.; Yang, Z.; Shen, Z. Characteristics of PAHs in street dust of Beijing and the annual wash-off load using an improved load calculation method. Sci. Total Environ. 2017, 581, 328–336. [Google Scholar] [CrossRef]
- Men, C.; Liu, R.; Wang, Q.; Guo, L.; Miao, Y.; Shen, Z. Uncertainty analysis in source apportionment of heavy metals in road dust based on positive matrix factorization model and geographic information system. Sci. Total Environ. 2019, 652, 27–39. [Google Scholar] [CrossRef]
- Duan, X.; Yu, H.; Ye, T.; Huang, Y.; Li, J.; Yuan, G.; Albanese, S. Geostatistical mapping and quantitative source apportionment of potentially toxic elements in top- and sub-soils: A case of suburban area in Beijing. China. Ecol. Indic. 2020, 112, 106085. [Google Scholar] [CrossRef]
- Men, C.; Wang, Y.; Liu, R.; Wang, Q.; Miao, Y.; Jiao, L.; Shoaib, M.; Shen, Z. Temporal variations of levels and sources of health risk associated with heavy metals in road dust in Beijing from May 2016 to April 2018. Chemosphere 2021, 270, 129434. [Google Scholar] [CrossRef]
- Amato, F.; Martijn, S.; Hugo, A.; Denier, G.; Marco, P.; Andrés, A.; Keuken, M.; Querol, X. Effect of rain events on the mobility of road dust load in two Dutch and Spanish roads. Atmos. Environ. 2012, 62, 352–358. [Google Scholar] [CrossRef]
- Chen, J.; Wang, W.; Liu, H.; Ren, L. Determination of road dust loadings and chemical characteristics using resuspension. Environ. Monit. Assess. 2012, 184, 1693–1709. [Google Scholar] [CrossRef]
- He, M. Organophosphate esters in road dust from a suburban area of Chongqing, China: Characterization of particle size distribution and human exposure. Arch. Environ. Contam. Toxicol. 2019, 76, 630–639. [Google Scholar]
- Barnes, D.; Connor, B.; Trost, E.; McTigue, K.; Krauss, K.; Bluehorse, B. Managing Alaska’s road dust problem: A model for road dust impacted regions. J. Transp. Eng. A Syst. 2020, 146, 04020019. [Google Scholar] [CrossRef]
- Wu, F.; Kong, S.; Yan, Q.; Wang, W.; Liu, H.; Wu, J.; Zheng, H.; Zheng, S.; Cheng, Y.; Niu, Z.; et al. Sub-type source profiles of fine particles for fugitive dust and accumulative health risks of heavy metals: A case study in a fast-developing city of China. Environ. Sci. Pollut. Res. 2020, 27, 16554–16573. [Google Scholar] [CrossRef]
- Zheng, J.; Frey, H. Quantitative Analysis of Variability and Uncertainty with Known Measurement Error: Methodology and Case Study. Risk Anal. 2010, 25, 663–675. [Google Scholar] [CrossRef]
- SBJ (Statistics Bureau of Jinan). Jinan Statistic Yearbook 2021; China Statistics Press: Beijing, China, 2021. (In Chinese)
- Han, L.; Zhuang, G.; Cheng, S.; Wang, Y.; Li, J. Characteristics of re-suspended road dust and its impact on the atmospheric environment in Beijing. Atmos. Environ. 2007, 41, 7485–7499. [Google Scholar] [CrossRef]
- Acosta, J.; Faz, A.; Kalbitz, K.; Jansen, B.; Martinez-Martinez, S. Heavy metal concentrations in particle size fractions from street dust of Murcia (Spain) as the basis for risk assessment. Environ. Monit. Assess. 2011, 13, 3087–3096. [Google Scholar] [CrossRef]
- Aryal, R.; Beecham, S.; Sarkar, B.; Chong, M.; Kinsela, A.; Kandasamy, J.; Vigneswaran, S. Readily Wash-Off road dust and Associated Heavy Metals on Motorways. Water. Air. Soil. Pollut. 2017, 228, 2–12. [Google Scholar] [CrossRef]
- Aguilera, A.; Morales, J.; Goguitchaichvili, A.; García-Oliva, F.; Armendariz-Arnez, C.; Quintana, P.; Bautista, F. Spatial distribution of magnetic material in Municipal road dust classified by land use and type of road in San Luis Potosí, Mexico. Air Qual. Atmos. Health 2020, 13, 951–963. [Google Scholar] [CrossRef]
- Kolakkandi, V.; Sharma, B.; Rana, A.; Dey, S.; Rawat, P.; Sarkar, S. Spatially resolved distribution, sources and health risks of heavy metals in size-fractionated road dust from 57 sites across megacity Kolkata. India. Sci. Total Environ. 2020, 705, 135805. [Google Scholar] [CrossRef]
- Suryawanshi, P.; Rajaram, B.; Bhanarkar, A.; Chalapati Rao, C. Determining heavy metal contamination of road dust in Delhi. India. Atmos. Environ. 2016, 29, 221–234. [Google Scholar] [CrossRef]
- Adamiec, E.; Jarosz-Krzemi nska, E.; Wieszała, R. Heavy metals from non-exhaust vehicle emissions in urban and motorway road dusts. Environ. Monit. Assess. 2016, 188, 5–11. [Google Scholar] [CrossRef]
- Candeias, C.; Vicente, E.; Tomé, M.; Rocha, F.; Ávila, P.; Célia, A. Geochemical, Mineralogical and Morphological characterisation of rosd dust and associated health risks. Int. J. Int. J. Environ. 2020, 17, 55–63. [Google Scholar]
- Charlesworth, S.; De, M.; Ordóñez, A. A review of the distribution of particulate trace elements in urban terrestrial environments and its application to considerations of risk. Environ. Geochem. 2011, 33, 103–123. [Google Scholar] [CrossRef]
- Kennedy, N.; Hinds, W. Inhalability of large solid particles. J. Aerosol. Sci. 2002, 33, 237–255. [Google Scholar] [CrossRef]
- Li, H.; Zuo, X. Speciation and size distribution of copper and zinc in urban road runoff. Bull. Environ. Contam. Toxicol. 2013, 90, 471–476. [Google Scholar] [CrossRef]
- Zhao, H.; Li, X. Understanding the relationship between heavy metals inroad-deposited sediments and washoff particles in urban stormwater using simulated rainfall. J. Hazard Mater. 2013, 246–247, 267–276. [Google Scholar] [CrossRef] [PubMed]
- Sahu, S.; Gufran, B.; Neha, S. Emissions inventory of anthropogenic PM2.5 and PM10 in Delhi during Commonwealth Games 2010. Atmos. Environ. 2011, 45, 6180–6190. [Google Scholar] [CrossRef]
- Zhao, G.; Chen, Y.; Philip, K.; Hopke, P.; Holsen, T.; Dhaniyala, S. Characteristics of traffic-induced fugitive dust from unpaved roads. Aerosol Sci Technol. 2017, 51, 1324–1331. [Google Scholar] [CrossRef]
- Singh, V.; Biswal, A.; Amit, P.; Kesarkar, S.; Khaiwal, R. High resolution vehicular PM10 emissions over megacity Delhi: Relative contributions of exhaust and non-exhaust sources. Sci. Total Environ. 2020, 699, 134273. [Google Scholar] [CrossRef]
- GA 802-2014; Types of Motor Vehicle—Terms and Definitions. Ministry of Public Security of the People’s Republic of China: Beijing, China, 2014.
- Tian, H.; Zhu, C.; Gao, J.; Cheng, K.; Hao, J.; Wang, K.; Hua, S.; Wang, Y.; Zhou, J. Quantitative assessment of atmospheric emissions of toxic heavy metals from anthropogenic sources in China: Historical trend, spatial distribution, uncertainties, and control policies. Atmos. Chem. Phys. 2015, 15, 10127–10147. [Google Scholar] [CrossRef]
- Lee, B.; Dong, T. Effects of road characteristics on distribution and toxicity of polycyclic aromatic hydrocarbons in Municipal road dust of Ulsan. Korea. J. Hazard. Mater. 2010, 175, 540–550. [Google Scholar] [CrossRef]
- Amato, F.; Pandolfi, A.; Alastuey, A.; Lozano, J.; Contreras, G.; Querol, X. Impact of traffic intensity and pavement aggregate size on road dust particles loading. Atmos. Environ. 2013, 77, 711–717. [Google Scholar] [CrossRef]
- Wang, H.; Han, L.; Li, T.; Qu, S.; Zhao, Y.; Fan, S.; Chen, T.; Cui, H.; Liu, J. Temporal-spatial distributions of road silt loadings and fugitive road dust emissions in Beijing from 2019 to 2020. J. Environ. Sci. 2023, 132, 56–70. [Google Scholar] [CrossRef]
- Zhu, J.; Cheng, H.; Hu, C.; Wang, Z. Study on the emission inventory and spatial distribution characteristics of road dust sources in Wuhan. J. Nanjing Univ. Inf. Sci. Technol. (Nat. Sci. Ed.) 2018, 10, 557–562. [Google Scholar]
- Xu, Y.; Zhou, Q. Emission characteristics and spatial distribution of road fugitive dust in Tianjin, China. China Environ. Sci. 2012, 32, 2168–2173. [Google Scholar]
- Ba, L. Emission Inventory and Characteristics of Road Fugitive Dust in Guanzhong Urban Agglomeration. Master’s Thesis, Chang’an University, Xi’an, China, 2020. [Google Scholar]
- Wang, S.; Wang, L.; Huan, Y.; Wang, R.; Liang, T. Concentrations, spatial distribution, sources and environmental health risks of potentially toxic elements in urban road dust across China. Sci. Total Environ. 2022, 805, 150266. [Google Scholar] [CrossRef] [PubMed]


Disclaimer/Publisher’s Note: The statements, opinions and data contained in all publications are solely those of the individual author(s) and contributor(s) and not of MDPI and/or the editor(s). MDPI and/or the editor(s) disclaim responsibility for any injury to people or property resulting from any ideas, methods, instructions or products referred to in the content. |
© 2024 by the authors. Licensee MDPI, Basel, Switzerland. This article is an open access article distributed under the terms and conditions of the Creative Commons Attribution (CC BY) license (https://creativecommons.org/licenses/by/4.0/).