
Life Cycle Assessment of an Innovative Combined Treatment and Constructed Wetland Technology for the Treatment of Hexachlorocyclohexane-Contaminated Drainage Water in Hajek in the Czech Republic

 ,
,  , , and
Abstract
1. Introduction
2. Site and Methods
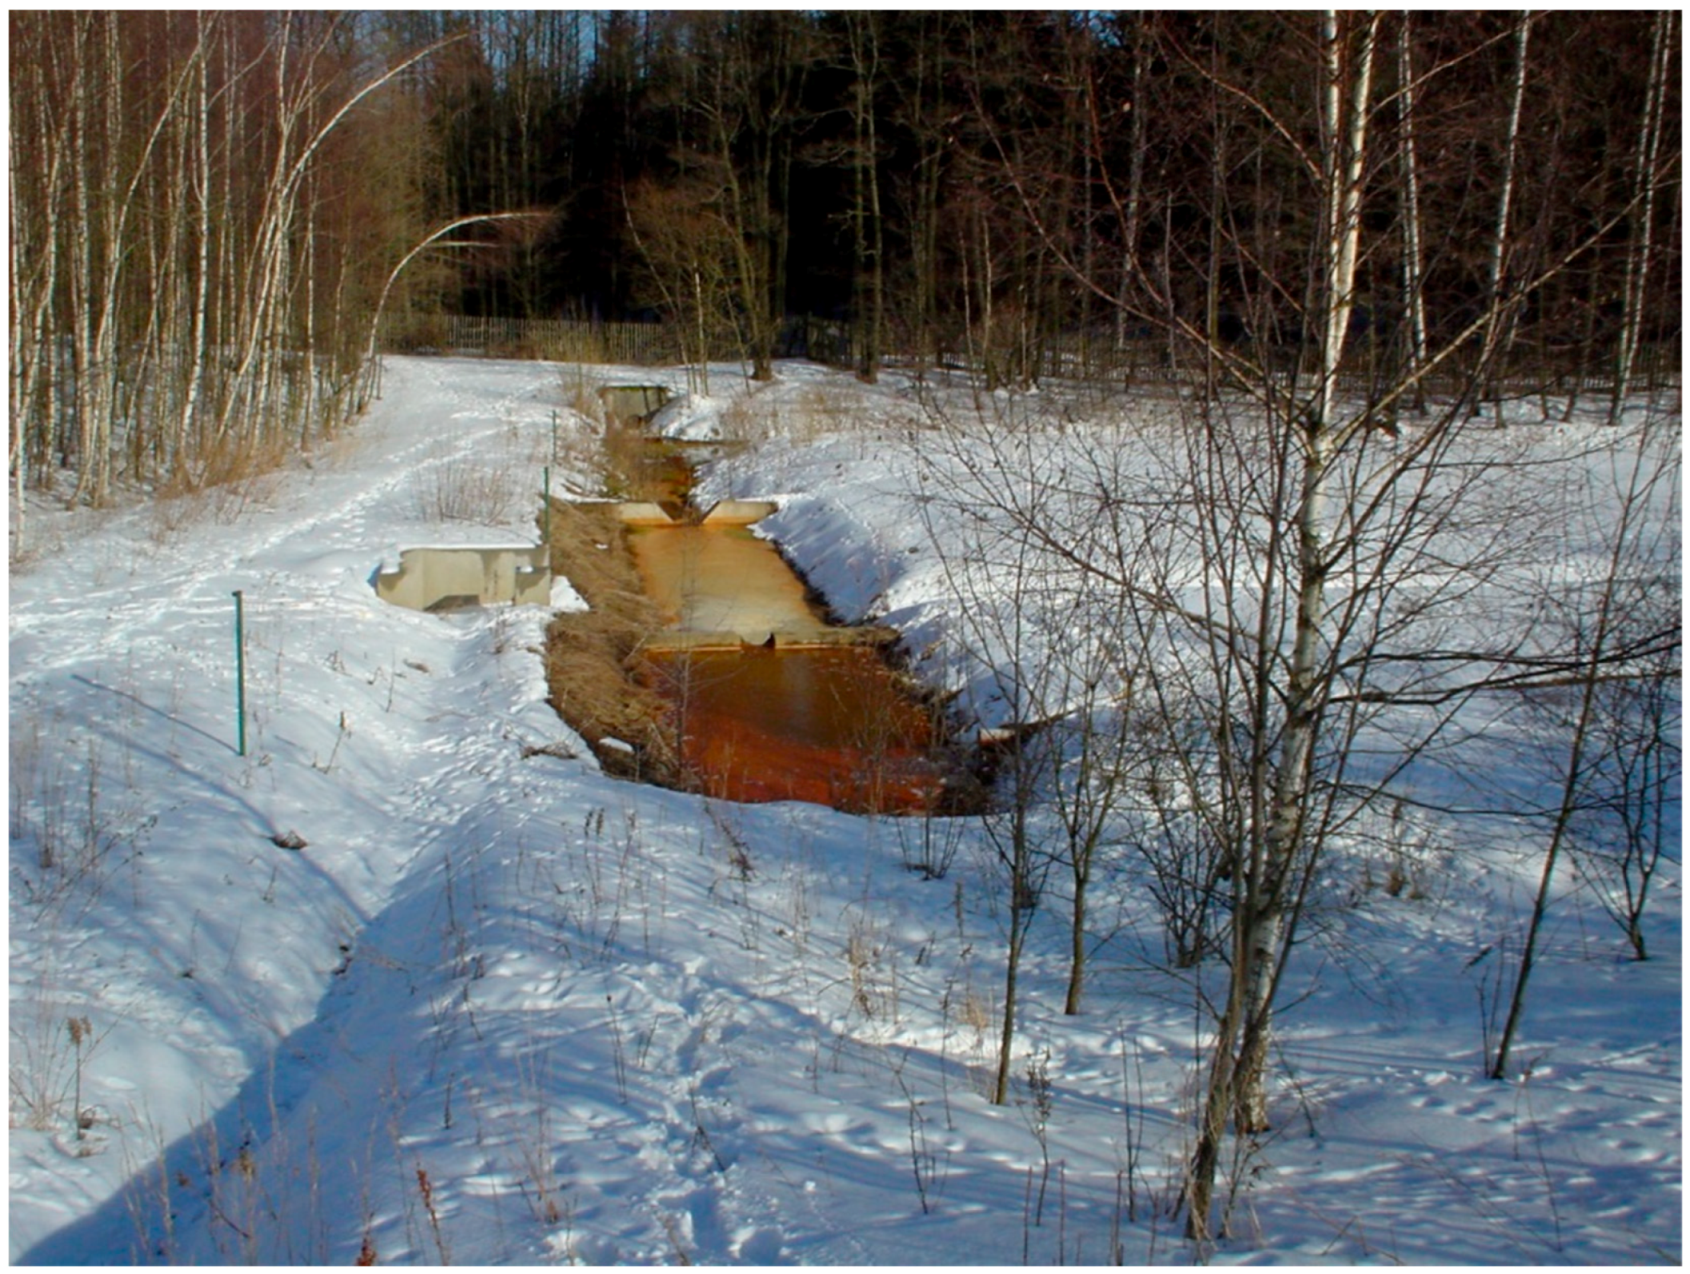
2.1. The Hajek Site
- engineered wetland;
- anaerobic biodegradation;
- a permeable reaction barrier using zerovalent iron;
- sorption remediation system.
2.2. Wetland+® Technology
2.3. Conventional WWTP Technology
2.4. Method
- definition of the purpose and scope, including setting the boundaries of the systems and the functional unit;
- inventory analysis (Life Cycle Inventory—LCI);
- impact assessment (Life Cycle Impact Assessment—LCIA);
- interpretation (ISO 14040).
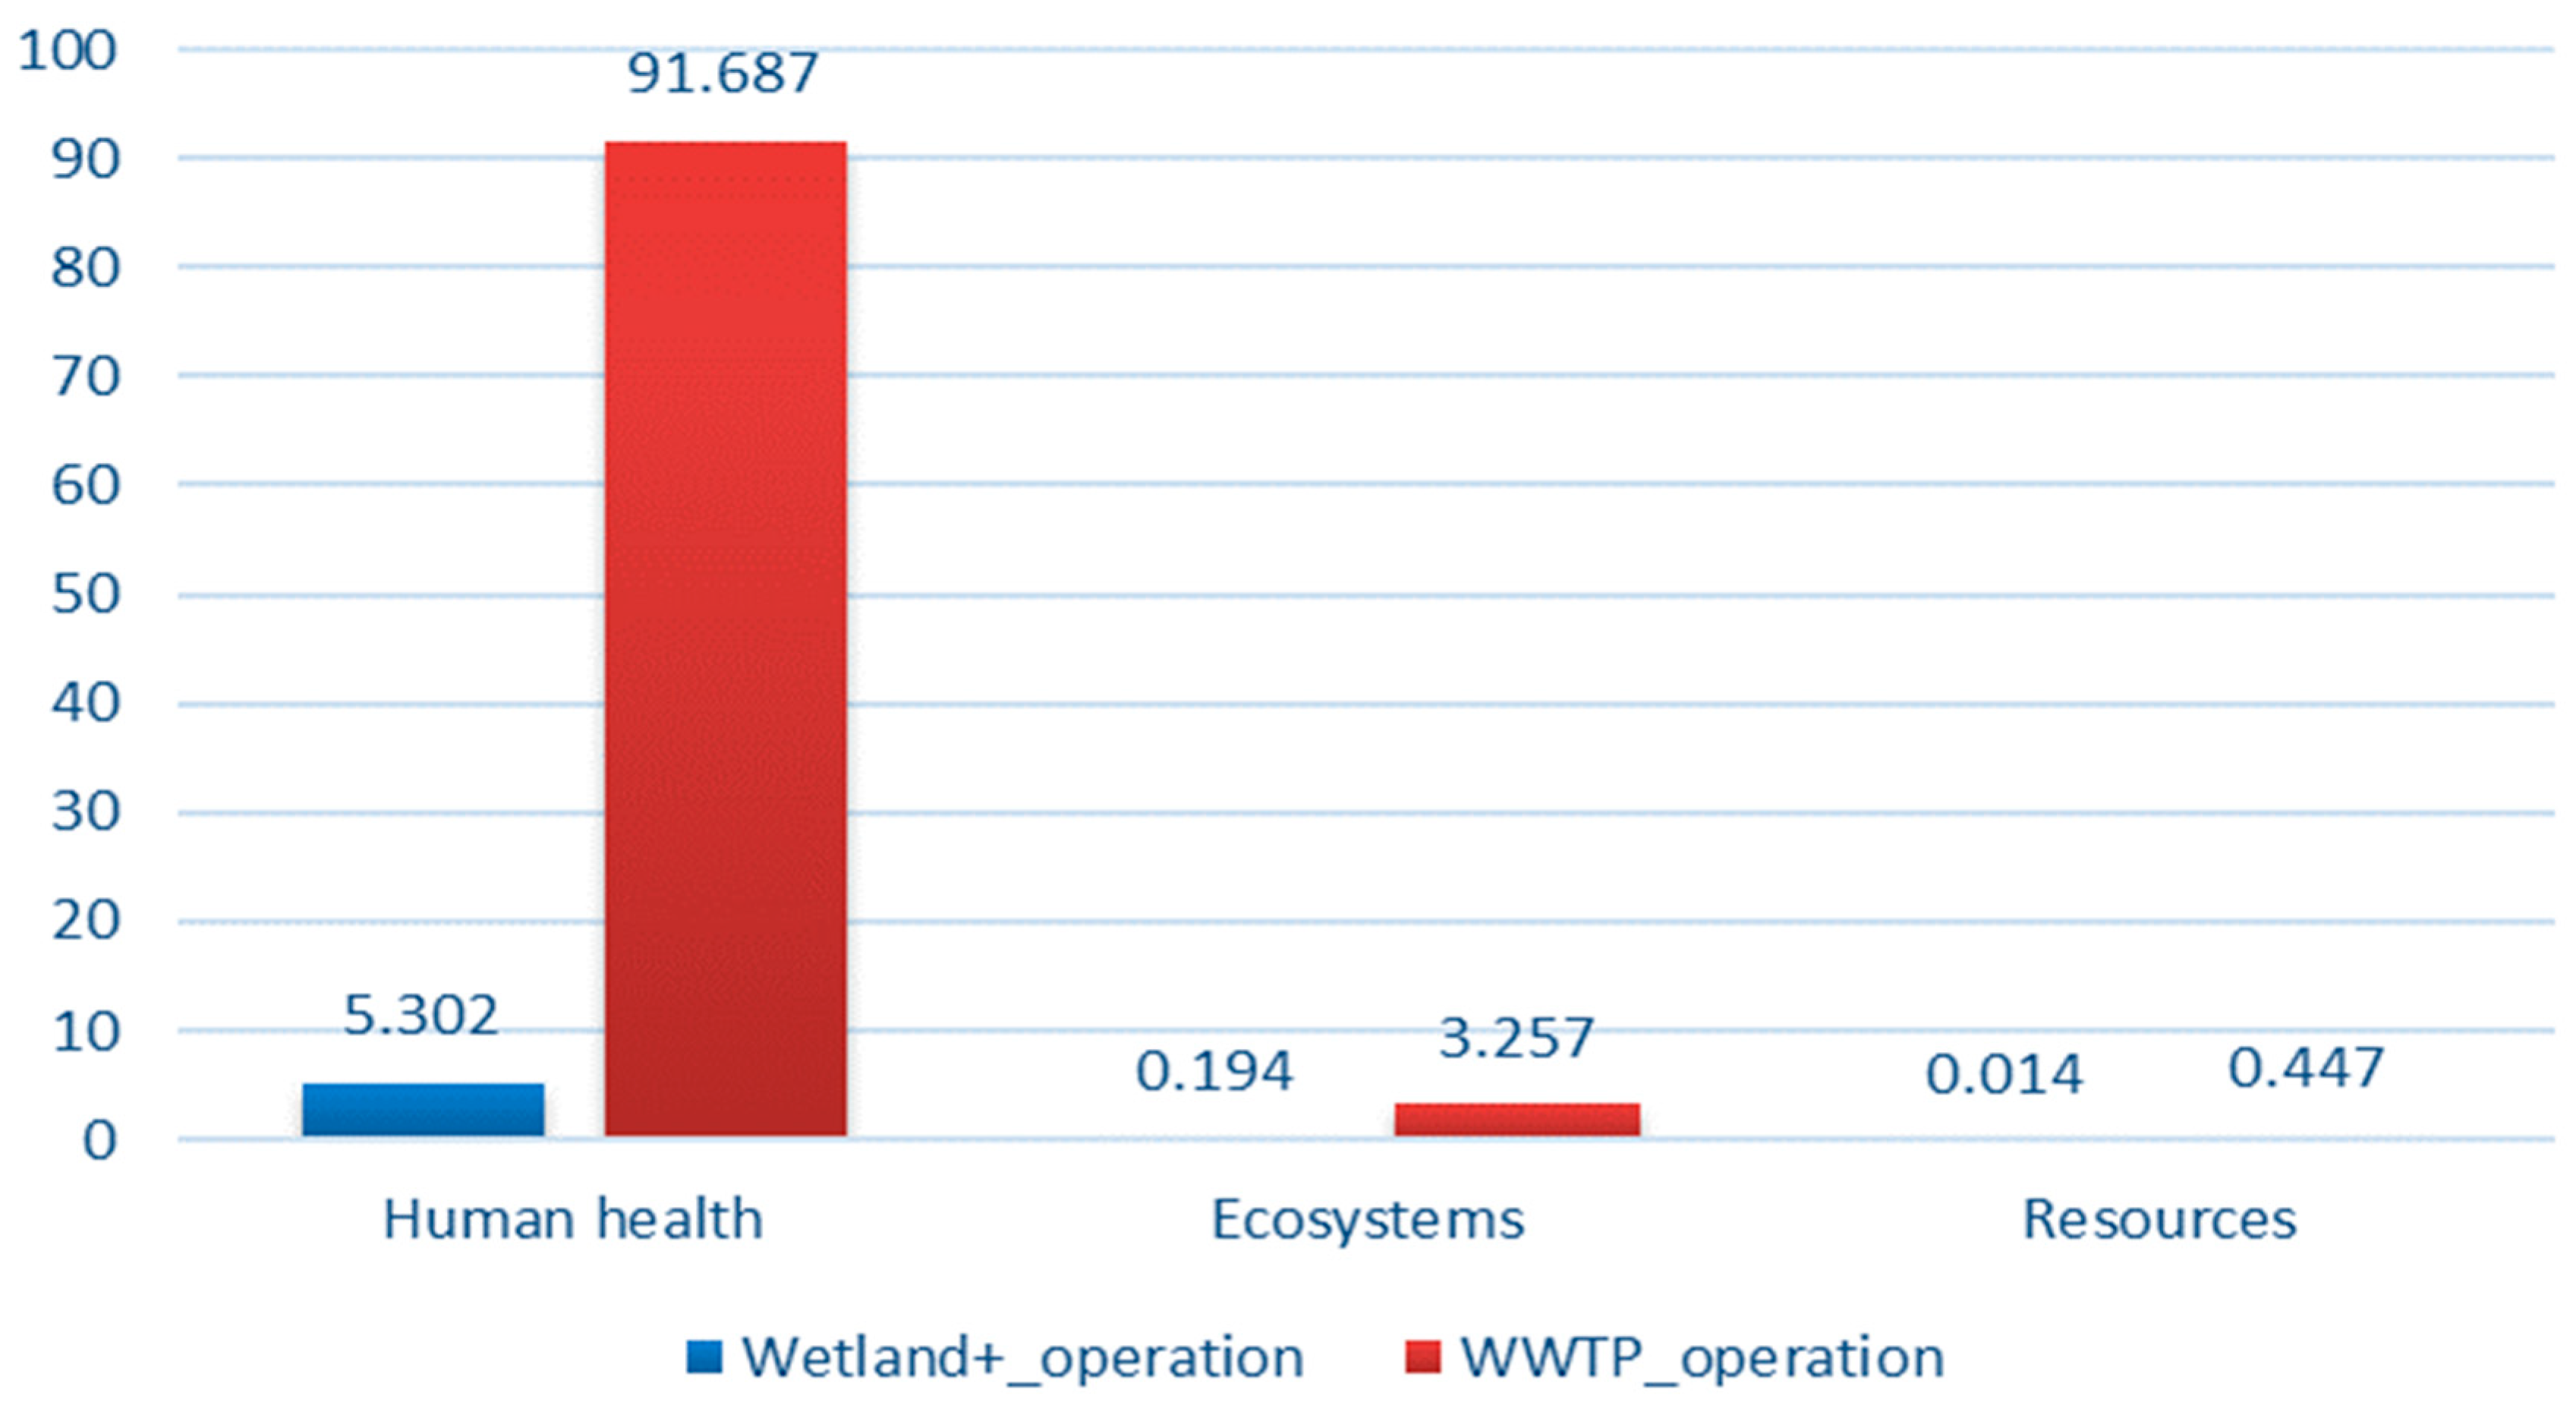
3. Results
4. Discussion and Conclusions
Author Contributions
Funding
Institutional Review Board Statement
Informed Consent Statement
Data Availability Statement
Conflicts of Interest
Appendix A

| Impact Category | Unit | Wetland+®_Construction | WWTP_Construction |
|---|---|---|---|
| Global warming | kg CO2 eq | 8.56 × 10⁻² | 2.62 × 10⁻² |
| Stratospheric ozone depletion | kg CFC11 eq | 7.42 × 10⁻⁸ | 6.68 × 10⁻⁹ |
| Ionizing radiation | kBq Co-60 eq | 7.53 × 10⁻⁴ | 1.39 × 10⁻³ |
| Ozone formation, human health | kg NOx eq | 1.78 × 10⁻⁴ | 6.19 × 10⁻⁵ |
| Fine particulate matter formation | kg PM2.5 eq | 8.44 × 10⁻⁵ | 4.05 × 10⁻⁵ |
| Ozone formation, terrestrial ecosystems | kg NOx eq | 1.89 × 10⁻⁴ | 6.31 × 10⁻⁵ |
| Terrestrial acidification | kg SO2 eq | 2.68 × 10⁻⁴ | 1.23 × 10⁻⁴ |
| Freshwater eutrophication | kg P eq | 8.58 × 10⁻⁶ | 1.19 × 10⁻⁵ |
| Marine eutrophication | kg N eq | 9.55 × 10⁻⁷ | 6.51 × 10⁻⁷ |
| Terrestrial ecotoxicity | kg 1,4-DCB | 9.77 × 10⁻² | 1.17 × 10⁻¹ |
| Freshwater ecotoxicity | kg 1,4-DCB | 2.01 × 10⁻³ | 2.70 × 10⁻³ |
| Marine ecotoxicity | kg 1,4-DCB | 2.49 × 10⁻³ | 3.39 × 10⁻³ |
| Human carcinogenic toxicity | kg 1,4-DCB | 8.41 × 10⁻³ | 3.08 × 10⁻³ |
| Human non-carcinogenic toxicity | kg 1,4-DCB | 1.43 × 10⁻² | 3.51 × 10⁻² |
| Land use | m2a crop eq | 5.46 × 10⁻³ | 4.75 × 10⁻⁴ |
| Mineral resource scarcity | kg Cu eq | 4.97 × 10⁻⁴ | 2.95 × 10⁻⁴ |
| Fossil resource scarcity | kg oil eq | 2.86 × 10⁻² | 8.19 × 10⁻³ |
| Water consumption | m3 | 6.37 × 10⁻⁴ | 1.90 × 10⁻⁴ |
| Impact Category | Unit | Wetland+®_Operation | WWTP_Operation |
|---|---|---|---|
| Global warming | kg CO2 eq | 1.43 × 10⁻¹ | 2.53 |
| Stratospheric ozone depletion | kg CFC11 eq | 2.35 × 10⁻⁸ | 4.36 × 10⁻⁷ |
| Ionizing radiation | kBq Co-60 eq | 4.01 × 10⁻² | 6.81 × 10⁻¹ |
| Ozone formation, human health | kg NOx eq | 2.32 × 10⁻⁴ | 4.30 × 10⁻³ |
| Fine particulate matter formation | kg PM2.5 eq | 1.32 × 10⁻⁴ | 2.99 × 10⁻³ |
| Ozone formation, terrestrial ecosystems | kg NOx eq | 2.34 × 10⁻⁴ | 4.33 × 10⁻³ |
| Terrestrial acidification | kg SO2 eq | 3.98 × 10⁻⁴ | 9.25 × 10⁻³ |
| Freshwater eutrophication | kg P eq | 2.04 × 10⁻⁴ | 2.98 × 10⁻³ |
| Marine eutrophication | kg N eq | 1.31 × 10⁻⁵ | 1.95 × 10⁻⁴ |
| Terrestrial ecotoxicity | kg 1,4-DCB | 2.66 × 10⁻¹ | 1.12 |
| Freshwater ecotoxicity | kg 1,4-DCB | 1.37 × 10⁻² | 7.94 × 10⁻² |
| Marine ecotoxicity | kg 1,4-DCB | 1.75 × 10⁻² | 1.09 × 10⁻¹ |
| Human carcinogenic toxicity | kg 1,4-DCB | 1.38 × 10⁻² | 1.56 × 10⁻¹ |
| Human non-carcinogenic toxicity | kg 1,4-DCB | 2.41 × 10⁻¹ | 3.17 |
| Land use | m2a crop eq | 4.89 × 10⁻³ | 2.09 × 10⁻² |
| Mineral resource scarcity | kg Cu eq | 3.68 × 10⁻⁴ | 1.48 × 10⁻³ |
| Fossil resource scarcity | kg oil eq | 3.54 × 10⁻² | 5.00 × 10⁻¹ |
| Water consumption | m3 | 2.96 × 10⁻³ | 4.64 × 10⁻² |
| Impact Category | Unit | Wetland+®_Construction + Operation | WWTP_Construction + Operation |
|---|---|---|---|
| Global warming | kg CO2 eq | 2.28 × 10⁻¹ | 2.55 |
| Stratospheric ozone depletion | kg CFC11 eq | 9.78 × 10⁻⁸ | 4.43 × 10⁻⁷ |
| Ionizing radiation | kBq Co-60 eq | 4.08 × 10⁻² | 6.82 × 10⁻¹ |
| Ozone formation, human health | kg NOx eq | 4.09 × 10⁻⁴ | 4.36 × 10⁻³ |
| Fine particulate matter formation | kg PM2.5 eq | 2.17 × 10⁻⁴ | 3.03 × 10⁻³ |
| Ozone formation, terrestrial ecosystems | kg NOx eq | 4.22 × 10⁻⁴ | 4.39 × 10⁻³ |
| Terrestrial acidification | kg SO2 eq | 6.67 × 10⁻⁴ | 9.37 × 10⁻³ |
| Freshwater eutrophication | kg P eq | 2.12 × 10⁻⁴ | 2.99 × 10⁻³ |
| Marine eutrophication | kg N eq | 1.41 × 10⁻⁵ | 1.95 × 10⁻⁴ |
| Terrestrial ecotoxicity | kg 1,4-DCB | 3.64 × 10⁻¹ | 1.23 |
| Freshwater ecotoxicity | kg 1,4-DCB | 1.57 × 10⁻² | 8.21 × 10⁻² |
| Marine ecotoxicity | kg 1,4-DCB | 2.00 × 10⁻² | 1.13 × 10⁻¹ |
| Human carcinogenic toxicity | kg 1,4-DCB | 2.22 × 10⁻² | 1.59 × 10⁻¹ |
| Human non-carcinogenic toxicity | kg 1,4-DCB | 2.55 × 10⁻¹ | 3.20 |
| Land use | m2a crop eq | 1.03 × 10⁻² | 2.14 × 10⁻² |
| Mineral resource scarcity | kg Cu eq | 8.65 × 10⁻⁴ | 1.77 × 10⁻³ |
| Fossil resource scarcity | kg oil eq | 6.40 × 10⁻² | 5.08 × 10⁻¹ |
| Water consumption | m3 | 3.59 × 10⁻³ | 4.66 × 10⁻² |
| Damage Category | Impact Category | Unit | Wetland+®_Construction | WWTP_Construction | ||
|---|---|---|---|---|---|---|
| Human health | Global warming, human health | DALY (shortened years of life or years with reduced quality of life as a result of disability) | 7.94 × 10⁻⁸ | 1.65 × 10⁻⁷ | 2.43 × 10⁻⁸ | 6.84 × 10⁻⁸ |
| Stratospheric ozone depletion | 3.94 × 10⁻¹¹ | 3.55 × 10⁻¹² | ||||
| Ionizing radiation | 6.39 × 10⁻¹² | 1.18 × 10⁻¹¹ | ||||
| Ozone formation, human health | 1.62 × 10⁻¹⁰ | 5.63 × 10⁻¹¹ | ||||
| Fine particulate matter formation | 5.30 × 10⁻⁸ | 2.54 × 10⁻⁸ | ||||
| Human carcinogenic toxicity | 2.79 × 10⁻⁸ | 1.02 × 10⁻⁸ | ||||
| Human non-carcinogenic toxicity | 3.26 × 10⁻⁹ | 8.01 × 10⁻⁹ | ||||
| Water consumption, human health | 1.33 × 10⁻⁹ | 3.58 × 10⁻¹⁰ | ||||
| Ecosystems | Global warming, terrestrial ecosystems | species·yr (loss of species during the year) | 2.40 × 10⁻¹⁰ | 3.86 × 10⁻¹⁰ | 7.33 × 10⁻¹¹ | 1.25 × 10⁻¹⁰ |
| Global warming, freshwater ecosystems | 6.55 × 10⁻¹⁵ | 2.00 × 10⁻¹⁵ | ||||
| Ozone formation, terrestrial ecosystems | 2.43 × 10⁻¹¹ | 8.14 × 10⁻¹² | ||||
| Terrestrial acidification | 5.69 × 10⁻¹¹ | 2.61 × 10⁻¹¹ | ||||
| Freshwater eutrophication | 5.76 × 10⁻¹² | 7.97 × 10⁻¹² | ||||
| Marine eutrophication | 1.62 × 10⁻¹⁵ | 1.11 × 10⁻¹⁵ | ||||
| Terrestrial ecotoxicity | 1.11 × 10⁻¹² | 1.34 × 10⁻¹² | ||||
| Freshwater ecotoxicity | 1.39 × 10⁻¹² | 1.86 × 10⁻¹² | ||||
| Marine ecotoxicity | 2.61 × 10⁻¹³ | 3.56 × 10⁻¹³ | ||||
| Land use | 4.84 × 10⁻¹¹ | 4.21 × 10⁻¹² | ||||
| Water consumption, Terrestrial ecosystem | 7.97 × 10⁻¹² | 2.10 × 10⁻¹² | ||||
| Water consumption, Aquatic ecosystems | 4.20 × 10⁻¹⁶ | 1.19 × 10⁻¹⁶ | ||||
| Resources | Mineral resource scarcity | $ (extra costs involved for future mineral and fossil resource extraction) | 1.15 × 10⁻⁴ | 9.00 × 10⁻³ | 6.82 × 10⁻⁵ | 2.08 × 10⁻³ |
| Fossil resource scarcity | 8.88 × 10⁻³ | 2.01 × 10⁻³ | ||||
| Damage Category | Impact Category | Unit | Wetland+®_Operation | WWTP_Operation | ||
|---|---|---|---|---|---|---|
| Human health | Global warming, human health | DALY (shortened years of life or years with reduced quality of life as a result of disability) | 1.32 × 10⁻⁷ | 3.18 × 10⁻⁷ | 2.35 × 10⁻⁶ | 5.50 × 10⁻⁶ |
| Stratospheric ozone depletion | 1.25 × 10⁻¹¹ | 2.31 × 10⁻¹⁰ | ||||
| Ionizing radiation | 3.40 × 10⁻¹⁰ | 5.78 × 10⁻⁹ | ||||
| Ozone formation, human health | 2.11 × 10⁻¹⁰ | 3.92 × 10⁻⁹ | ||||
| Fine particulate matter formation | 8.32 × 10⁻⁸ | 1.88 × 10⁻⁶ | ||||
| Human carcinogenic toxicity | 4.58 × 10⁻⁸ | 5.18 × 10⁻⁷ | ||||
| Human non-carcinogenic toxicity | 5.49 × 10⁻⁸ | 7.22 × 10⁻⁷ | ||||
| Water consumption, human health | 1.01 × 10⁻⁹ | 2.16 × 10⁻⁸ | ||||
| Ecosystems | Global warming, terrestrial ecosystems | species·yr (loss of species during the year) | 3.99 × 10⁻¹⁰ | 7.19 × 10⁻¹⁰ | 7.08 × 10⁻⁹ | 1.20 × 10⁻⁸ |
| Global warming, freshwater ecosystems | 1.09 × 10⁻¹⁴ | 1.93 × 10⁻¹³ | ||||
| Ozone formation, terrestrial ecosystems | 3.02 × 10⁻¹¹ | 5.58 × 10⁻¹⁰ | ||||
| Terrestrial acidification | 8.44 × 10⁻¹¹ | 1.96 × 10⁻⁹ | ||||
| Freshwater eutrophication | 1.37 × 10⁻¹⁰ | 2.00 × 10⁻⁹ | ||||
| Marine eutrophication | 2.23 × 10⁻¹⁴ | 3.31 × 10⁻¹³ | ||||
| Terrestrial ecotoxicity | 3.04 × 10⁻¹² | 1.27 × 10⁻¹¹ | ||||
| Freshwater ecotoxicity | 9.50 × 10⁻¹² | 5.50 × 10⁻¹¹ | ||||
| Marine ecotoxicity | 1.84 × 10⁻¹² | 1.15 × 10⁻¹¹ | ||||
| Land use | 4.33 × 10⁻¹¹ | 1.86 × 10⁻¹⁰ | ||||
| Water consumption, terrestrial ecosystem | 1.02 × 10⁻¹¹ | 1.88 × 10⁻¹⁰ | ||||
| Water consumption, aquatic ecosystems | 3.62 × 10⁻¹⁶ | 6.78 × 10⁻¹⁵ | ||||
| Resources | Mineral resource scarcity | $ (extra costs involved for future mineral and fossil resource extraction) | 8.51 × 10⁻⁵ | 1.98 × 10⁻³ | 3.41 × 10⁻⁴ | 6.26 × 10⁻² |
| Fossil resource scarcity | 1.90 × 10⁻³ | 6.23 × 10⁻² | ||||
| Damage Category | Impact Category | Unit | Wetland+®_Construction + Operation | WWTP_Construction + Operation | ||
|---|---|---|---|---|---|---|
| Human health | Global warming, human health | DALY (shortened years of life or years with reduced quality of life as a result of disability) | 2.12 × 10⁻⁷ | 4.83 × 10⁻⁷ | 2.37 × 10⁻⁶ | 5.57 × 10⁻⁶ |
| Stratospheric ozone depletion | 5.19 × 10⁻¹¹ | 2.35 × 10⁻¹⁰ | ||||
| Ionizing radiation | 3.47 × 10⁻¹⁰ | 5.79 × 10⁻⁹ | ||||
| Ozone formation, human health | 3.72 × 10⁻¹⁰ | 3.97 × 10⁻⁹ | ||||
| Fine particulate matter formation | 1.36 × 10⁻⁷ | 1.90 × 10⁻⁶ | ||||
| Human carcinogenic toxicity | 7.37 × 10⁻⁸ | 5.28 × 10⁻⁷ | ||||
| Human non-carcinogenic toxicity | 5.82 × 10⁻⁸ | 7.30 × 10⁻⁷ | ||||
| Water consumption, human health | 2.34 × 10⁻⁹ | 2.20 × 10⁻⁸ | ||||
| Ecosystems | Global warming, terrestrial ecosystems | species·yr (loss of species during the year) | 6.39 × 10⁻¹⁰ | 1.10 × 10⁻⁹ | 7.15 × 10⁻⁹ | 1.22 × 10⁻⁸ |
| Global warming, freshwater ecosystems | 1.75 × 10⁻¹⁴ | 1.95 × 10⁻¹³ | ||||
| Ozone formation, terrestrial ecosystems | 5.45 × 10⁻¹¹ | 5.67 × 10⁻¹⁰ | ||||
| Terrestrial acidification | 1.41 × 10⁻¹⁰ | 1.99 × 10⁻⁹ | ||||
| Freshwater eutrophication | 1.42 × 10⁻¹⁰ | 2.00 × 10⁻⁹ | ||||
| Marine eutrophication | 2.39 × 10⁻¹⁴ | 3.32 × 10⁻¹³ | ||||
| Terrestrial ecotoxicity | 4.16 × 10⁻¹² | 1.41 × 10⁻¹¹ | ||||
| Freshwater ecotoxicity | 1.09 × 10⁻¹¹ | 5.69 × 10⁻¹¹ | ||||
| Marine ecotoxicity | 2.10 × 10⁻¹² | 1.18 × 10⁻¹¹ | ||||
| Land use | 9.18 × 10⁻¹¹ | 1.90 × 10⁻¹⁰ | ||||
| Water consumption, terrestrial ecosystem | 1.81 × 10⁻¹¹ | 1.90 × 10⁻¹⁰ | ||||
| Water consumption, aquatic ecosystems | 7.83 × 10⁻¹⁶ | 6.90 × 10⁻¹⁵ | ||||
| Resources | Mineral resource scarcity | $ (extra costs involved for future mineral and fossil resource extraction) | 2.00 × 10⁻⁴ | 1.10 × 10⁻² | 4.09 × 10⁻⁴ | 6.47 × 10⁻² |
| Fossil resource scarcity | 1.08 × 10⁻² | 6.43 × 10⁻² | ||||
References
- Di, S.; Liu, R.; Chen, L.; Diao, J.; Zhou, Z. Selective bioaccumulation, biomagnification, and dissipation of hexachlorocyclohexane isomers in a freshwater food chain. Environ. Sci. Pollut. Res. 2018, 25, 18752–18761. [Google Scholar] [CrossRef] [PubMed]
- Wycisk, P.; Stollberg, R.; Neumann, C.; Gossel, W.; Weiss, H.; Weber, R. Integrated methodology for assessing the HCH groundwater pollution at the multi-source contaminated mega-site Bitterfeld/Wolfen. Environ. Sci. Pollut. Res. 2013, 20, 1907–1917. [Google Scholar] [CrossRef] [PubMed]
- Svermova, P.; Cernik, M.; Bardos, P.; Buresova, J.; Bałazińska, M. Survey on the socio-economic and environmental impact of Wetland+®. J. Environ. Eng. 2024; in press. ISSN 1943-7870. [Google Scholar]
- Mar-Pineda, C.G.; Poggi-Varaldo, H.M.; Ponce-Noyola, M.T.; Estrada-Bárcenas, D.A.; Ríos-Leal, E.; Esparza-García, F.J.; Galíndez-Mayer, J.; Rinderknecht-Seijas, N.F. Effect of zero-valent iron nanoparticles on the remediation of a clayish soil contaminated with γ-hexachlorocyclohexane (lindane) in a bioelectrochemical slurry reactor. Can. J. Chem. Eng. 2021, 99, 915–931. [Google Scholar] [CrossRef]
- Wu, F.; Zhou, Z.; Hicks, A.L. Life cycle impact of titanium dioxide nanoparticle synthesis through physical, chemical, and biological routes. Environ. Sci. Technol. 2019, 53, 4078–4087. [Google Scholar] [CrossRef] [PubMed]
- La-Laina-Cunha, A.C.; Ruiz, M.S.; Echevengua Teixeira, C. Environmental assessment of remediation technologies: An analytical framework for a hexachlorocyclohexane (HCH) contaminated site in Brazil. In Proceedings of the Second International Conference on Hazardous and Industrial Waste Management, Chania, Greece, 5–8 October 2010. [Google Scholar]
- Pincetl, S. 1-A living city: Using urban metabolism analysis to view cities as life forms. In Woodhead Publishing Series in Energy, Metropolitan Sustainability; Zeman, F., Ed.; Woodhead Publishing: Sawston, UK, 2012; pp. 3–25. ISBN 9780857090461. Available online: https://www.sciencedirect.com/science/article/abs/pii/B9780857090461500011?via%3Dihub (accessed on 13 December 2023).
- Lombardi, M.; Amicarelli, V.; Bux, C.; Varese, E. Sustainable Development and Waste Management, Reference Module in Earth Systems and Environmental Sciences; Elsevier: Amsterdam, The Netherlands, 2023; ISBN 9780124095489. [Google Scholar] [CrossRef]
- Liedtke, C.; Bienge, K.; Wiesen, K.; Teubler, J.; Greiff, K.; Lettenmeier, M.; Rohn, H. Resource Use in the Production and Consumption System—The MIPS Approach. Resources 2014, 3, 544–574. [Google Scholar] [CrossRef]
- Cahyandito, M.F. The MIPS Concept (Material Input per Unit of Service): A Measure for an Ecological Economy, 2009, University of Padjadjaran. Available online: https://www.researchgate.net/profile/Martha-Cahyandito/publication/228243237_The_MIPS_Concept_A_Measure_for_an_Ecological_Economy/links/57768b8408ae4645d60d7bb2/The-MIPS-Concept-A-Measure-for-an-Ecological-Economy.pdf (accessed on 16 October 2023).
- ISO 14040: 2006; Environmental management—Life Cycle Assessment—Principles and Framework. ISO: Geneva, Switzerland, 2006.
- ISO 14044: 2006; Environmental Management—Life Cycle Assessment—Requirements and Guidelines. ISO: Geneva, Switzerland, 2006.
- Finnveden, G.; Potting, J. Life Cycle Assessment. In Encyclopedia of Toxicology, 3rd ed.; Wexler, P., Ed.; Academic Press: Cambridge, MA, USA, 2014; pp. 74–77. ISBN 9780123864550. [Google Scholar] [CrossRef]
- Nijdam, D.; Blom, J.; Boere, J.A. Environmental Life Cycle Assessment (LCA) of two advanced wastewater treatment techniques. Stud. Surf. Sci. Catal. 1999, 120, 763–775. [Google Scholar]
- IEA. Total Energy Supply 2020. 2020. Available online: https://www.iea.org/regions/europe (accessed on 31 October 2023).
- Al-Anbari, M.A.; Altaee, S.A.; Kareem, S.L. Using Life Cycle Assessment (LCA) in Appraisal Sustainability Indicators of Najaf Wastewater Treatment Plant. Egypt. J. Chem. 2022, 65, 513–519. [Google Scholar] [CrossRef]
- Burchart-Korol, D.; Zawartka, P. Determinants of environmental assessment of Polish individual wastewater treatment plants in a life cycle perspective. Arch. Environ. Prot. 2019, 45, 44–54. [Google Scholar] [CrossRef]
- Friedrich, E.; Buckley, C.A. The Use of Life Cycle Assessment in the Selection of Water Treatment Processes, WRC Report No. 1077/1/02; Water Research Commission: Pretoria, South Africa, 2002; ISBN 1-86845-858-X. [Google Scholar]
- Morsy, K.M.; Mostafa, M.K.; Abdalla, K.Z.; Galal, M.M. Life Cycle Assessment of Upgrading Primary Wastewater Treatment Plants to Secondary Treatment Including a Circular Economy Approach. Air Soil Water Res. 2020, 13, 1178622120935857. [Google Scholar] [CrossRef]
- Raghuvanshi, S.; Bhakar, V.; Sowmya, C.; Sangwan, K.S. Waste water treatment plant life cycle assessment: Treatment process to reuse of water. Procedia CIRP 2017, 61, 761–766. [Google Scholar] [CrossRef]
- Rashid, S.S.; Liu, Y.-Q.; Mokhtar, H.; Zainudin, M.R.; Muda, M.F. Review of toxicity emission from municipal wastewater treatment by life cycle assessment. Gading J. Sci. Technol. 2022, 5, 10–18, eISSN 2637-0018. [Google Scholar]
- Rashid, S.S.; Harun, S.N.; Hanafiah, M.M.; Razman, K.K.; Liu, Y.-Q.; Tholibon, D.A. Life Cycle Assessment and Its Application in Wastewater Treatment: A Brief Overview. Processes 2023, 11, 208. [Google Scholar] [CrossRef]
- Alam, M.K.; Islam, M.A.S.; Saeed, T.; Rahman, S.M.; Majed, N. Life Cycle Analysis of Lab-Scale Constructed Wetlands for the Treatment of Industrial Wastewater and Landfill Leachate from Municipal Solid Waste: A Comparative Assessment. Water 2023, 15, 909. [Google Scholar] [CrossRef]
- Corbella, C.; Puigagut, J.; Garfi, M. Life cycle assessment of constructed wetland systems for wastewater treatment coupled with microbial fuel cells. Sci. Total Environ. 2017, 584–585, 355–362. [Google Scholar] [CrossRef] [PubMed]
- Lopsik, K. Life cycle assessment of small-scale constructed wetland and extended aeration activated sludge wastewater treatment system. Int. J. Environ. Sci. Technol. 2013, 10, 1295–1308. [Google Scholar] [CrossRef]
- Gongora, G.R.A.; Lu, R.H.; Hanandeh, A.E. Comparative life cycle assessment of aerobic treatment units and constructed wetlands as onsite wastewater treatment systems in Australia. Water Sci. Technol. 2021, 84, 1527–1540. [Google Scholar] [CrossRef] [PubMed]
- Resende, J.D.; Nolasco, M.A.; Pacca, S.A. Life cycle assessment and costing of wastewater treatment systems coupled to constructed wetlands. Resour. Conserv. Recycl. 2019, 148, 170–177. [Google Scholar] [CrossRef]
- Wang, S.; Ji, Z.; Wang, Y. Life Cycle Assessment of Artificial Wetland Systems for Rural Wastewater Treatment. E3S Web. Conf. 2021, 299, 02006. [Google Scholar] [CrossRef]


Disclaimer/Publisher’s Note: The statements, opinions and data contained in all publications are solely those of the individual author(s) and contributor(s) and not of MDPI and/or the editor(s). MDPI and/or the editor(s) disclaim responsibility for any injury to people or property resulting from any ideas, methods, instructions or products referred to in the content. |
© 2024 by the authors. Licensee MDPI, Basel, Switzerland. This article is an open access article distributed under the terms and conditions of the Creative Commons Attribution (CC BY) license (https://creativecommons.org/licenses/by/4.0/).
Share and Cite
Bałazińska, M.; Bardos, P.; Gzyl, G.; Antos, V.; Skalny, A.; Lederer, T. Life Cycle Assessment of an Innovative Combined Treatment and Constructed Wetland Technology for the Treatment of Hexachlorocyclohexane-Contaminated Drainage Water in Hajek in the Czech Republic. Sustainability 2024, 16, 4802. https://doi.org/10.3390/su16114802
Bałazińska M, Bardos P, Gzyl G, Antos V, Skalny A, Lederer T. Life Cycle Assessment of an Innovative Combined Treatment and Constructed Wetland Technology for the Treatment of Hexachlorocyclohexane-Contaminated Drainage Water in Hajek in the Czech Republic. Sustainability. 2024; 16(11):4802. https://doi.org/10.3390/su16114802
Chicago/Turabian StyleBałazińska, Maria, Paul Bardos, Grzegorz Gzyl, Vojtech Antos, Anna Skalny, and Tomas Lederer. 2024. "Life Cycle Assessment of an Innovative Combined Treatment and Constructed Wetland Technology for the Treatment of Hexachlorocyclohexane-Contaminated Drainage Water in Hajek in the Czech Republic" Sustainability 16, no. 11: 4802. https://doi.org/10.3390/su16114802
APA StyleBałazińska, M., Bardos, P., Gzyl, G., Antos, V., Skalny, A., & Lederer, T. (2024). Life Cycle Assessment of an Innovative Combined Treatment and Constructed Wetland Technology for the Treatment of Hexachlorocyclohexane-Contaminated Drainage Water in Hajek in the Czech Republic. Sustainability, 16(11), 4802. https://doi.org/10.3390/su16114802