
Enhancing Water Ecosystem Services Using Environmental Zoning in Land Use Planning

 , ,
, ,  ,
,  and
and
Abstract
1. Introduction
2. Methodology
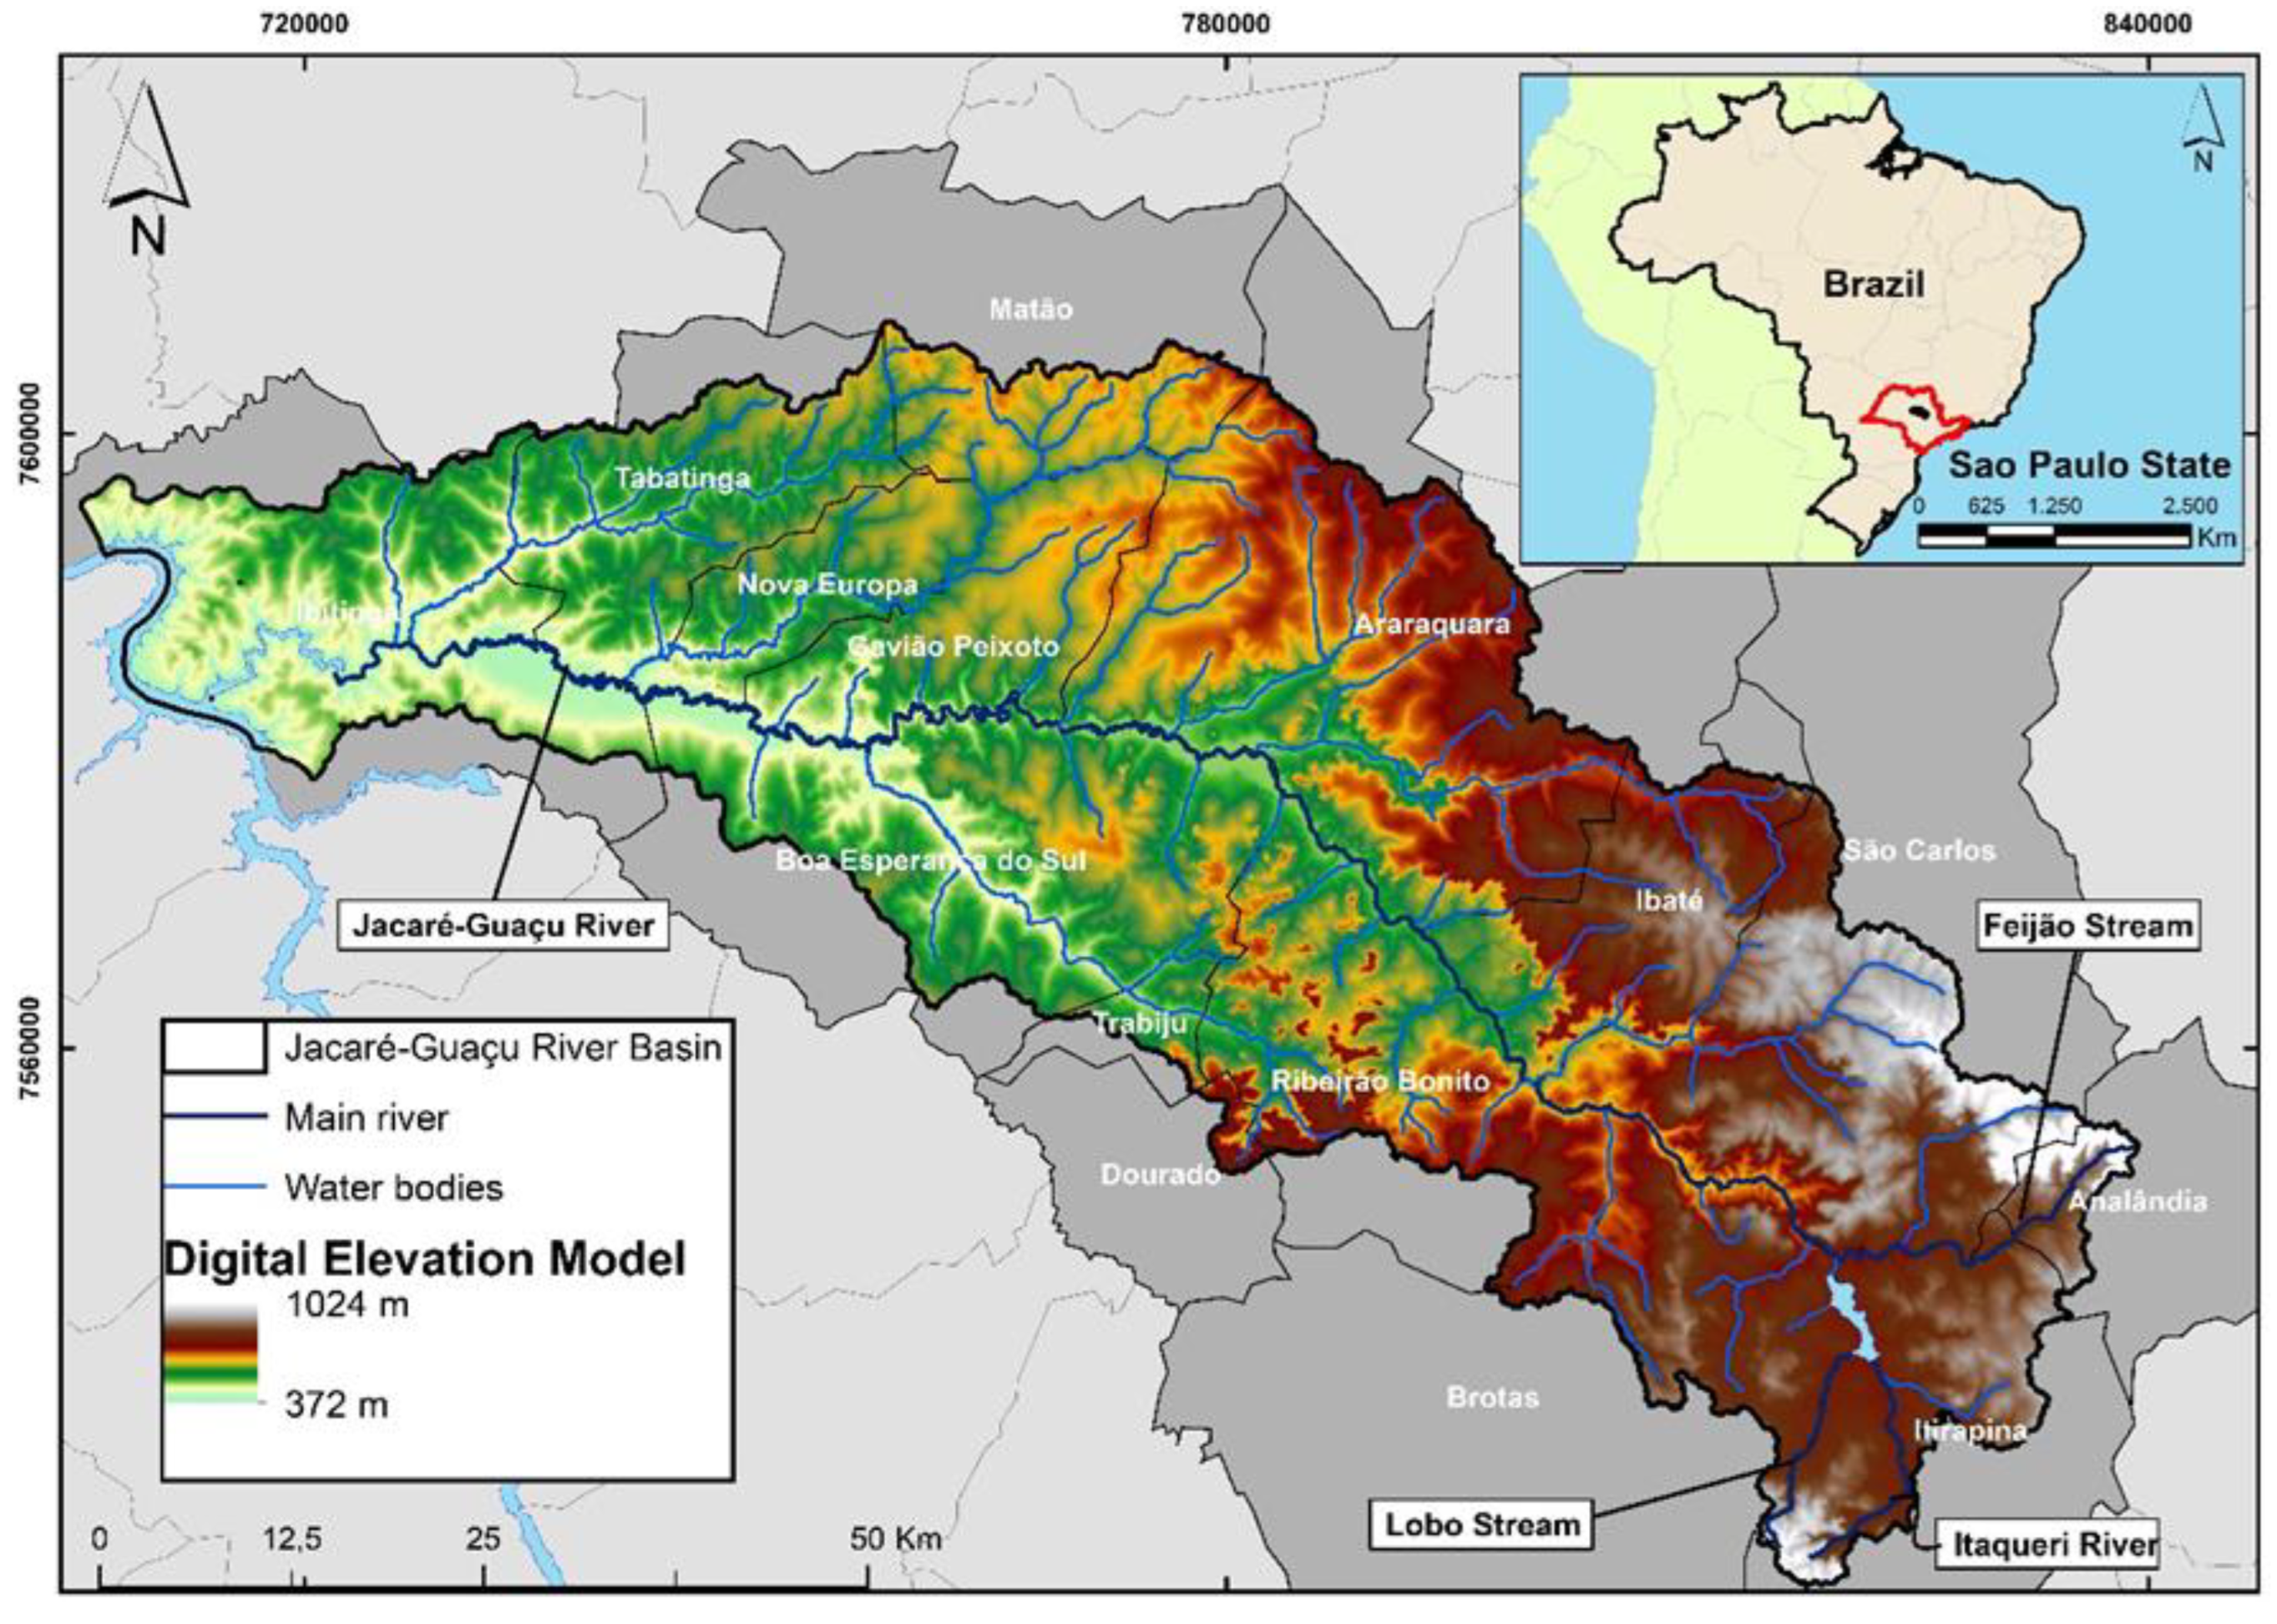
2.1. Study Area
2.2. Analysis of Land Use and Land Cover Changes
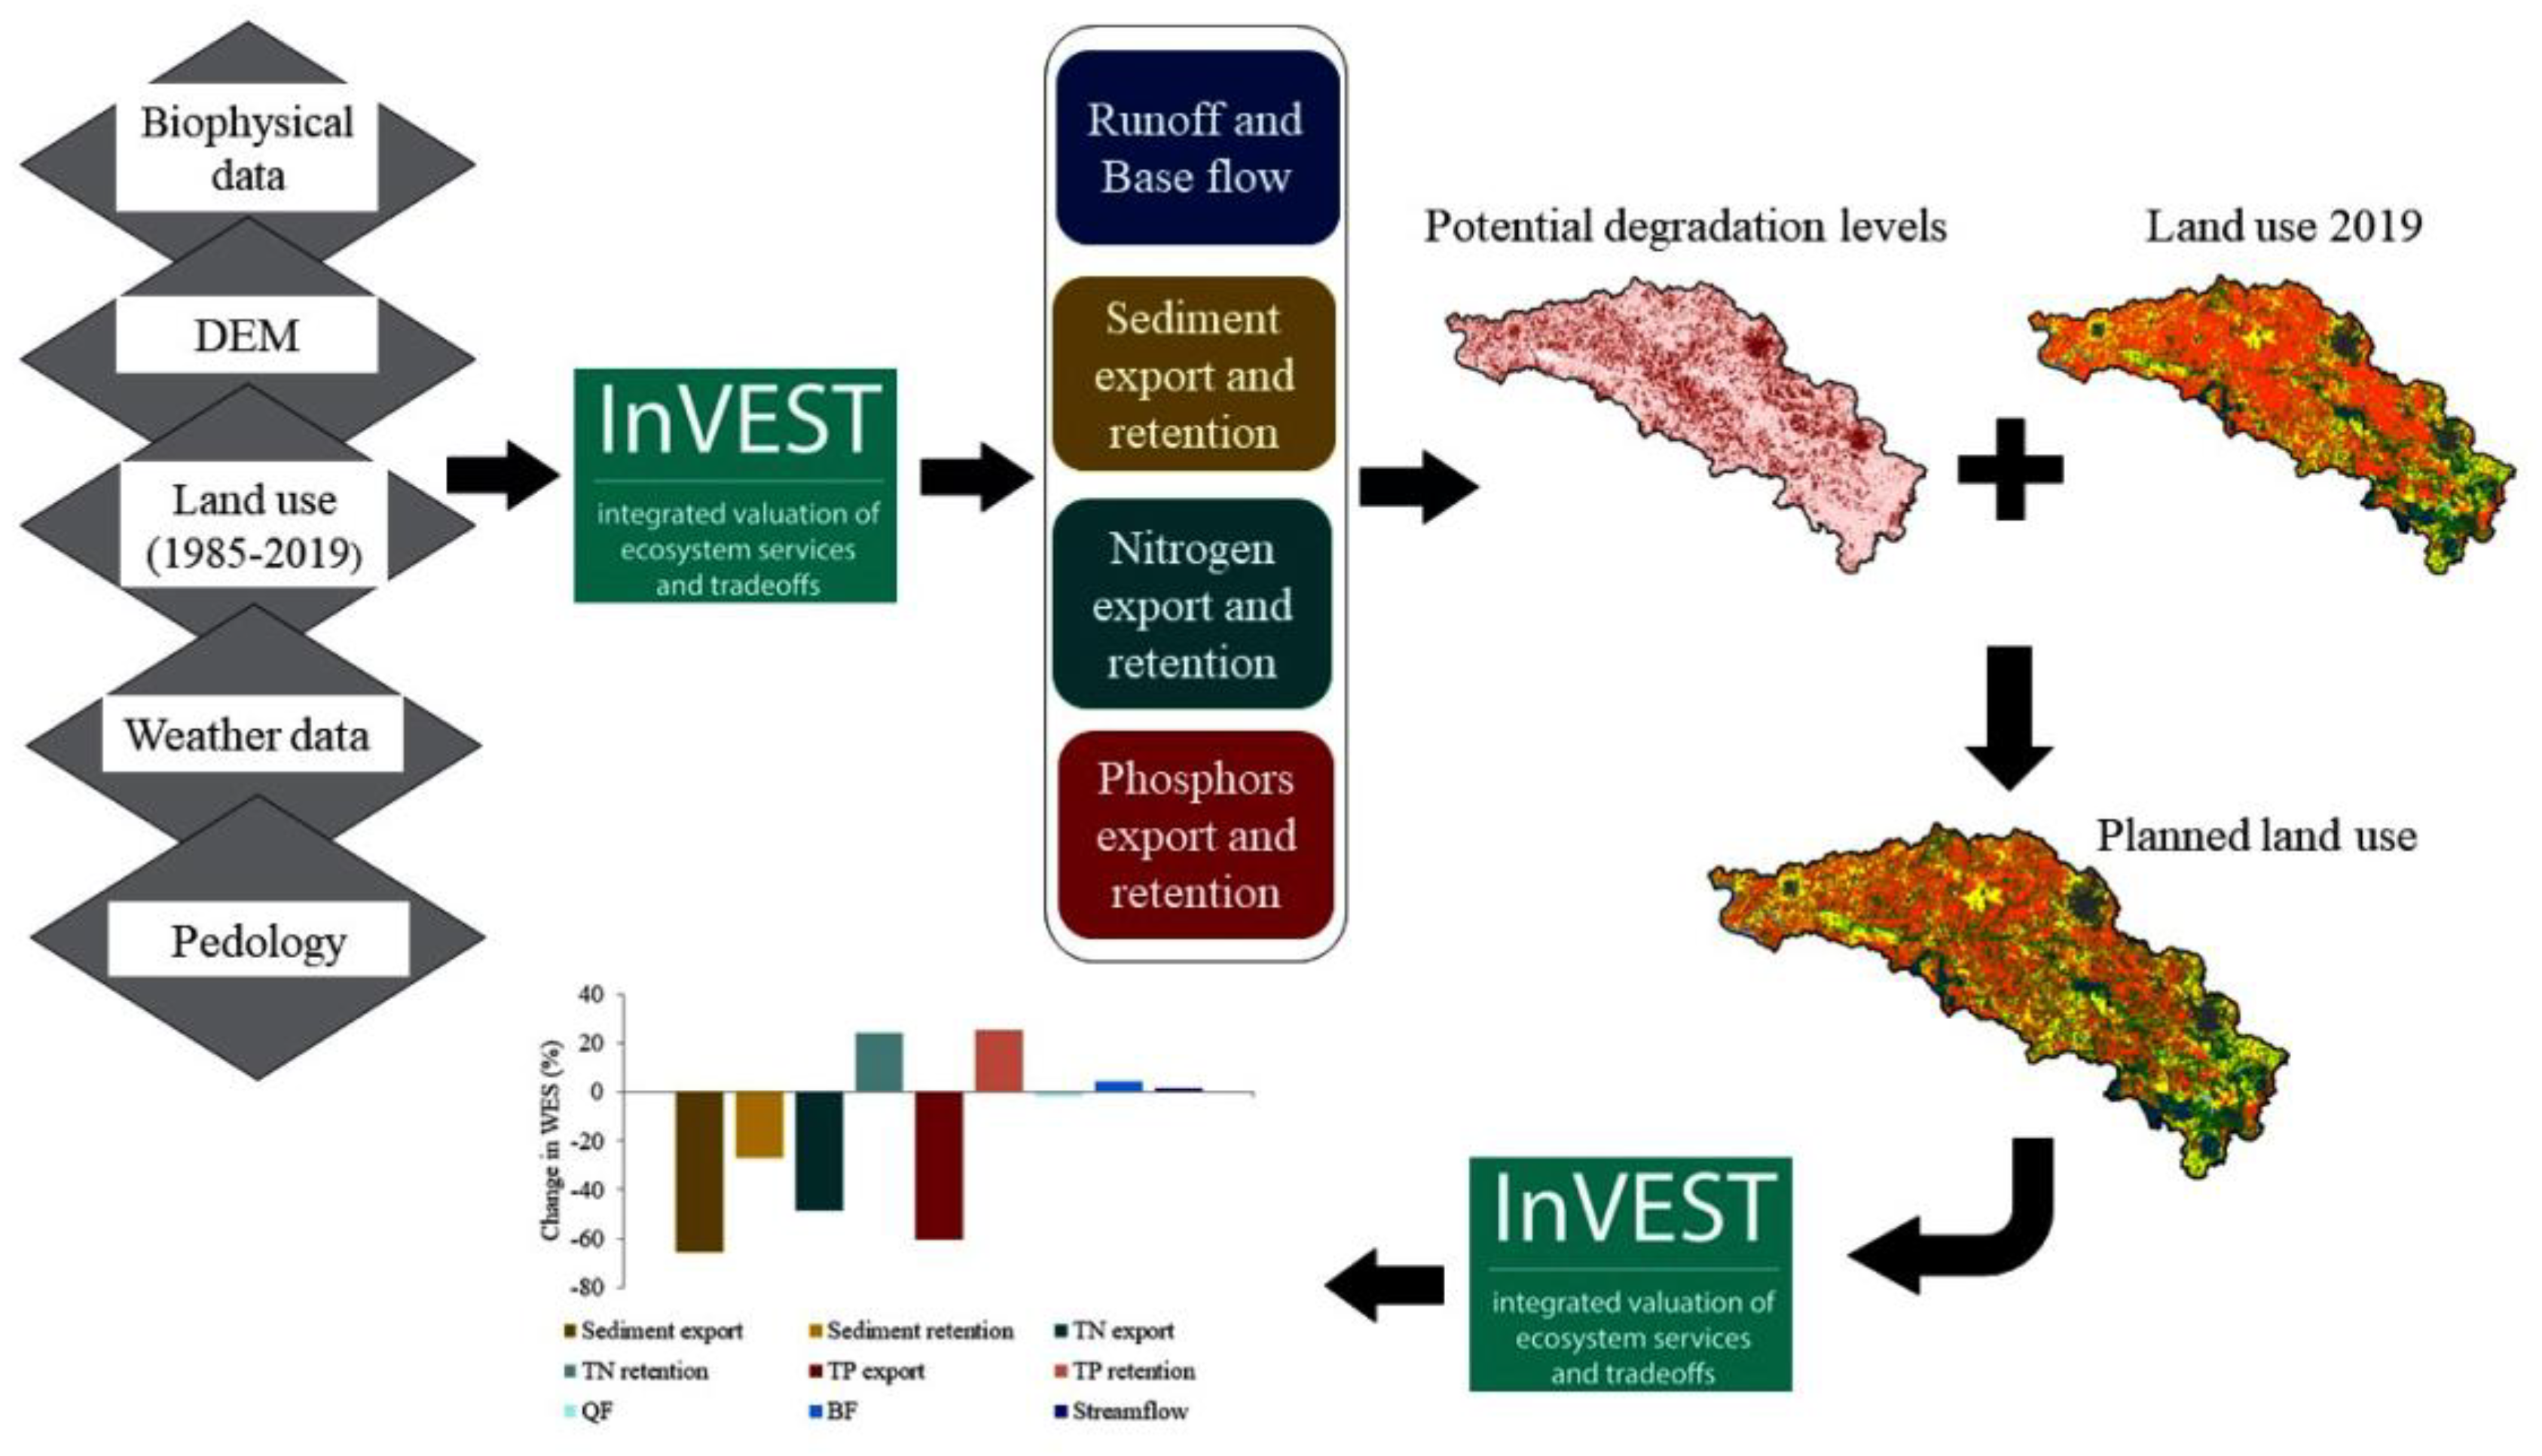
2.3. Biophysical Modelling and Quantification of the Effects of Land Use and Land Cover
2.4. Multicriteria and Spatial Analysis for the Proposition of Environmental Zoning
2.5. LULC Scenario Building and Quantification of Its Effects on Biophysical Indicators
3. Results
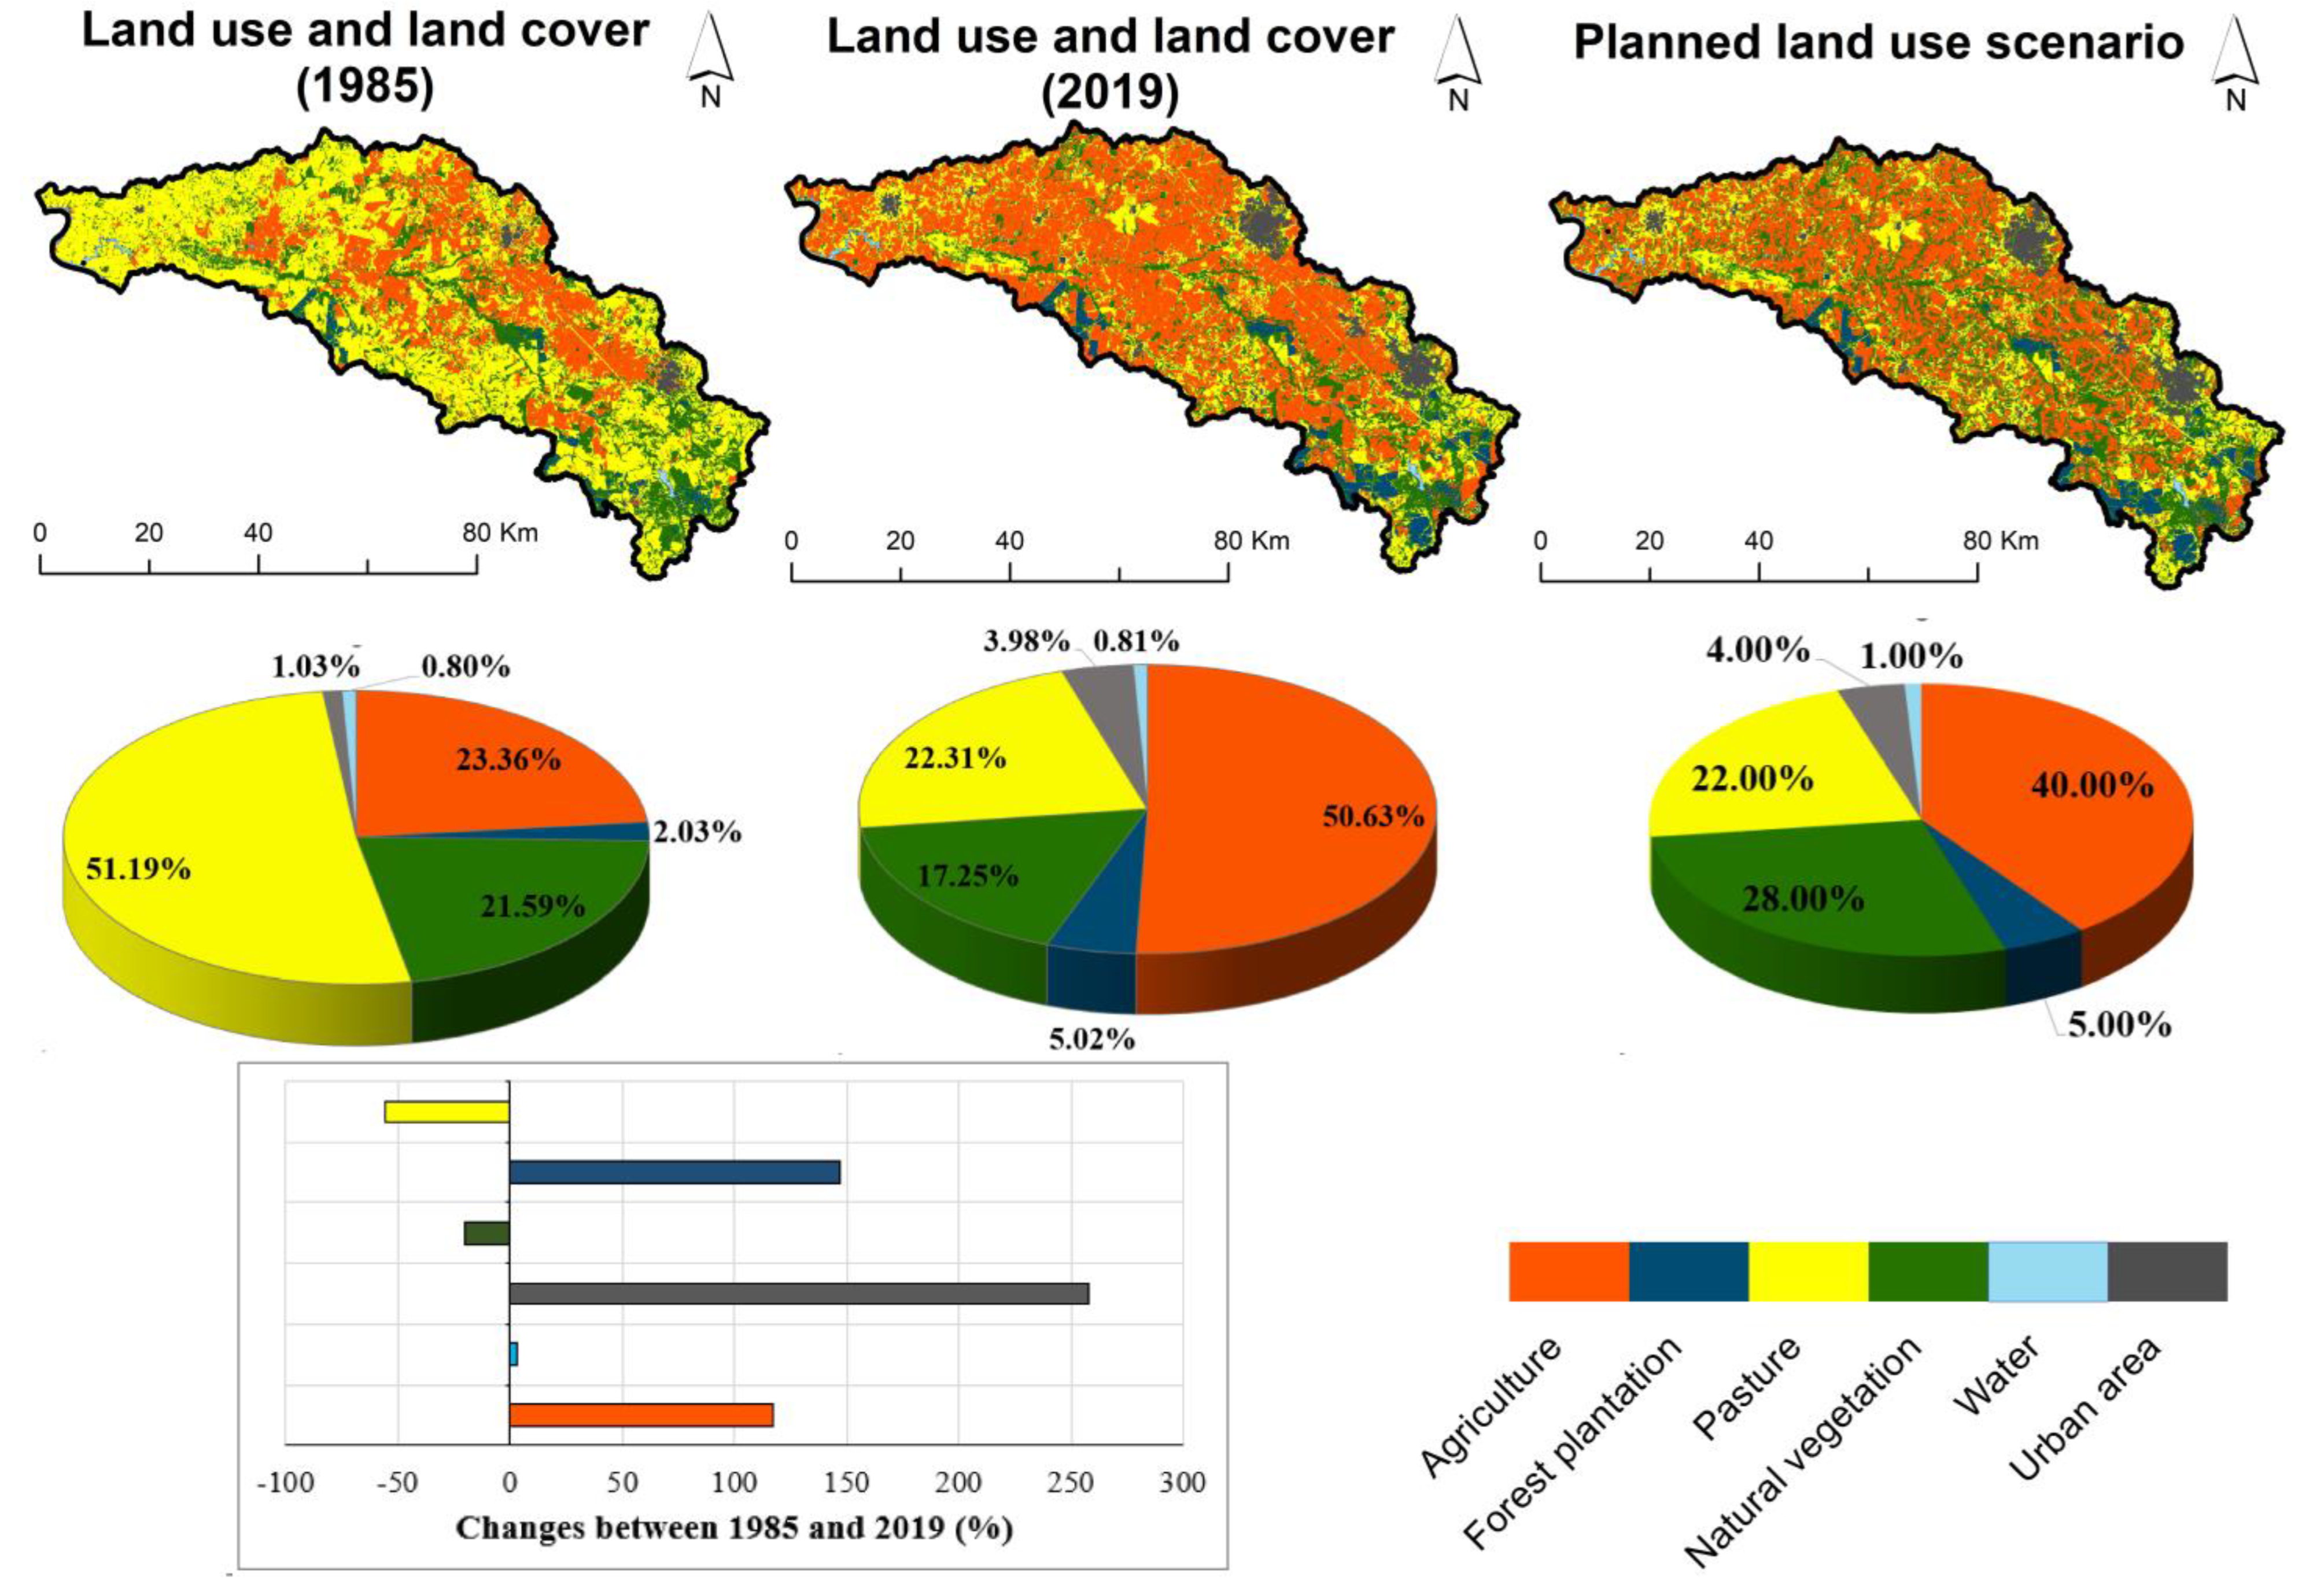
3.1. Land Use and Land Cover Changes between 1985 and 2019
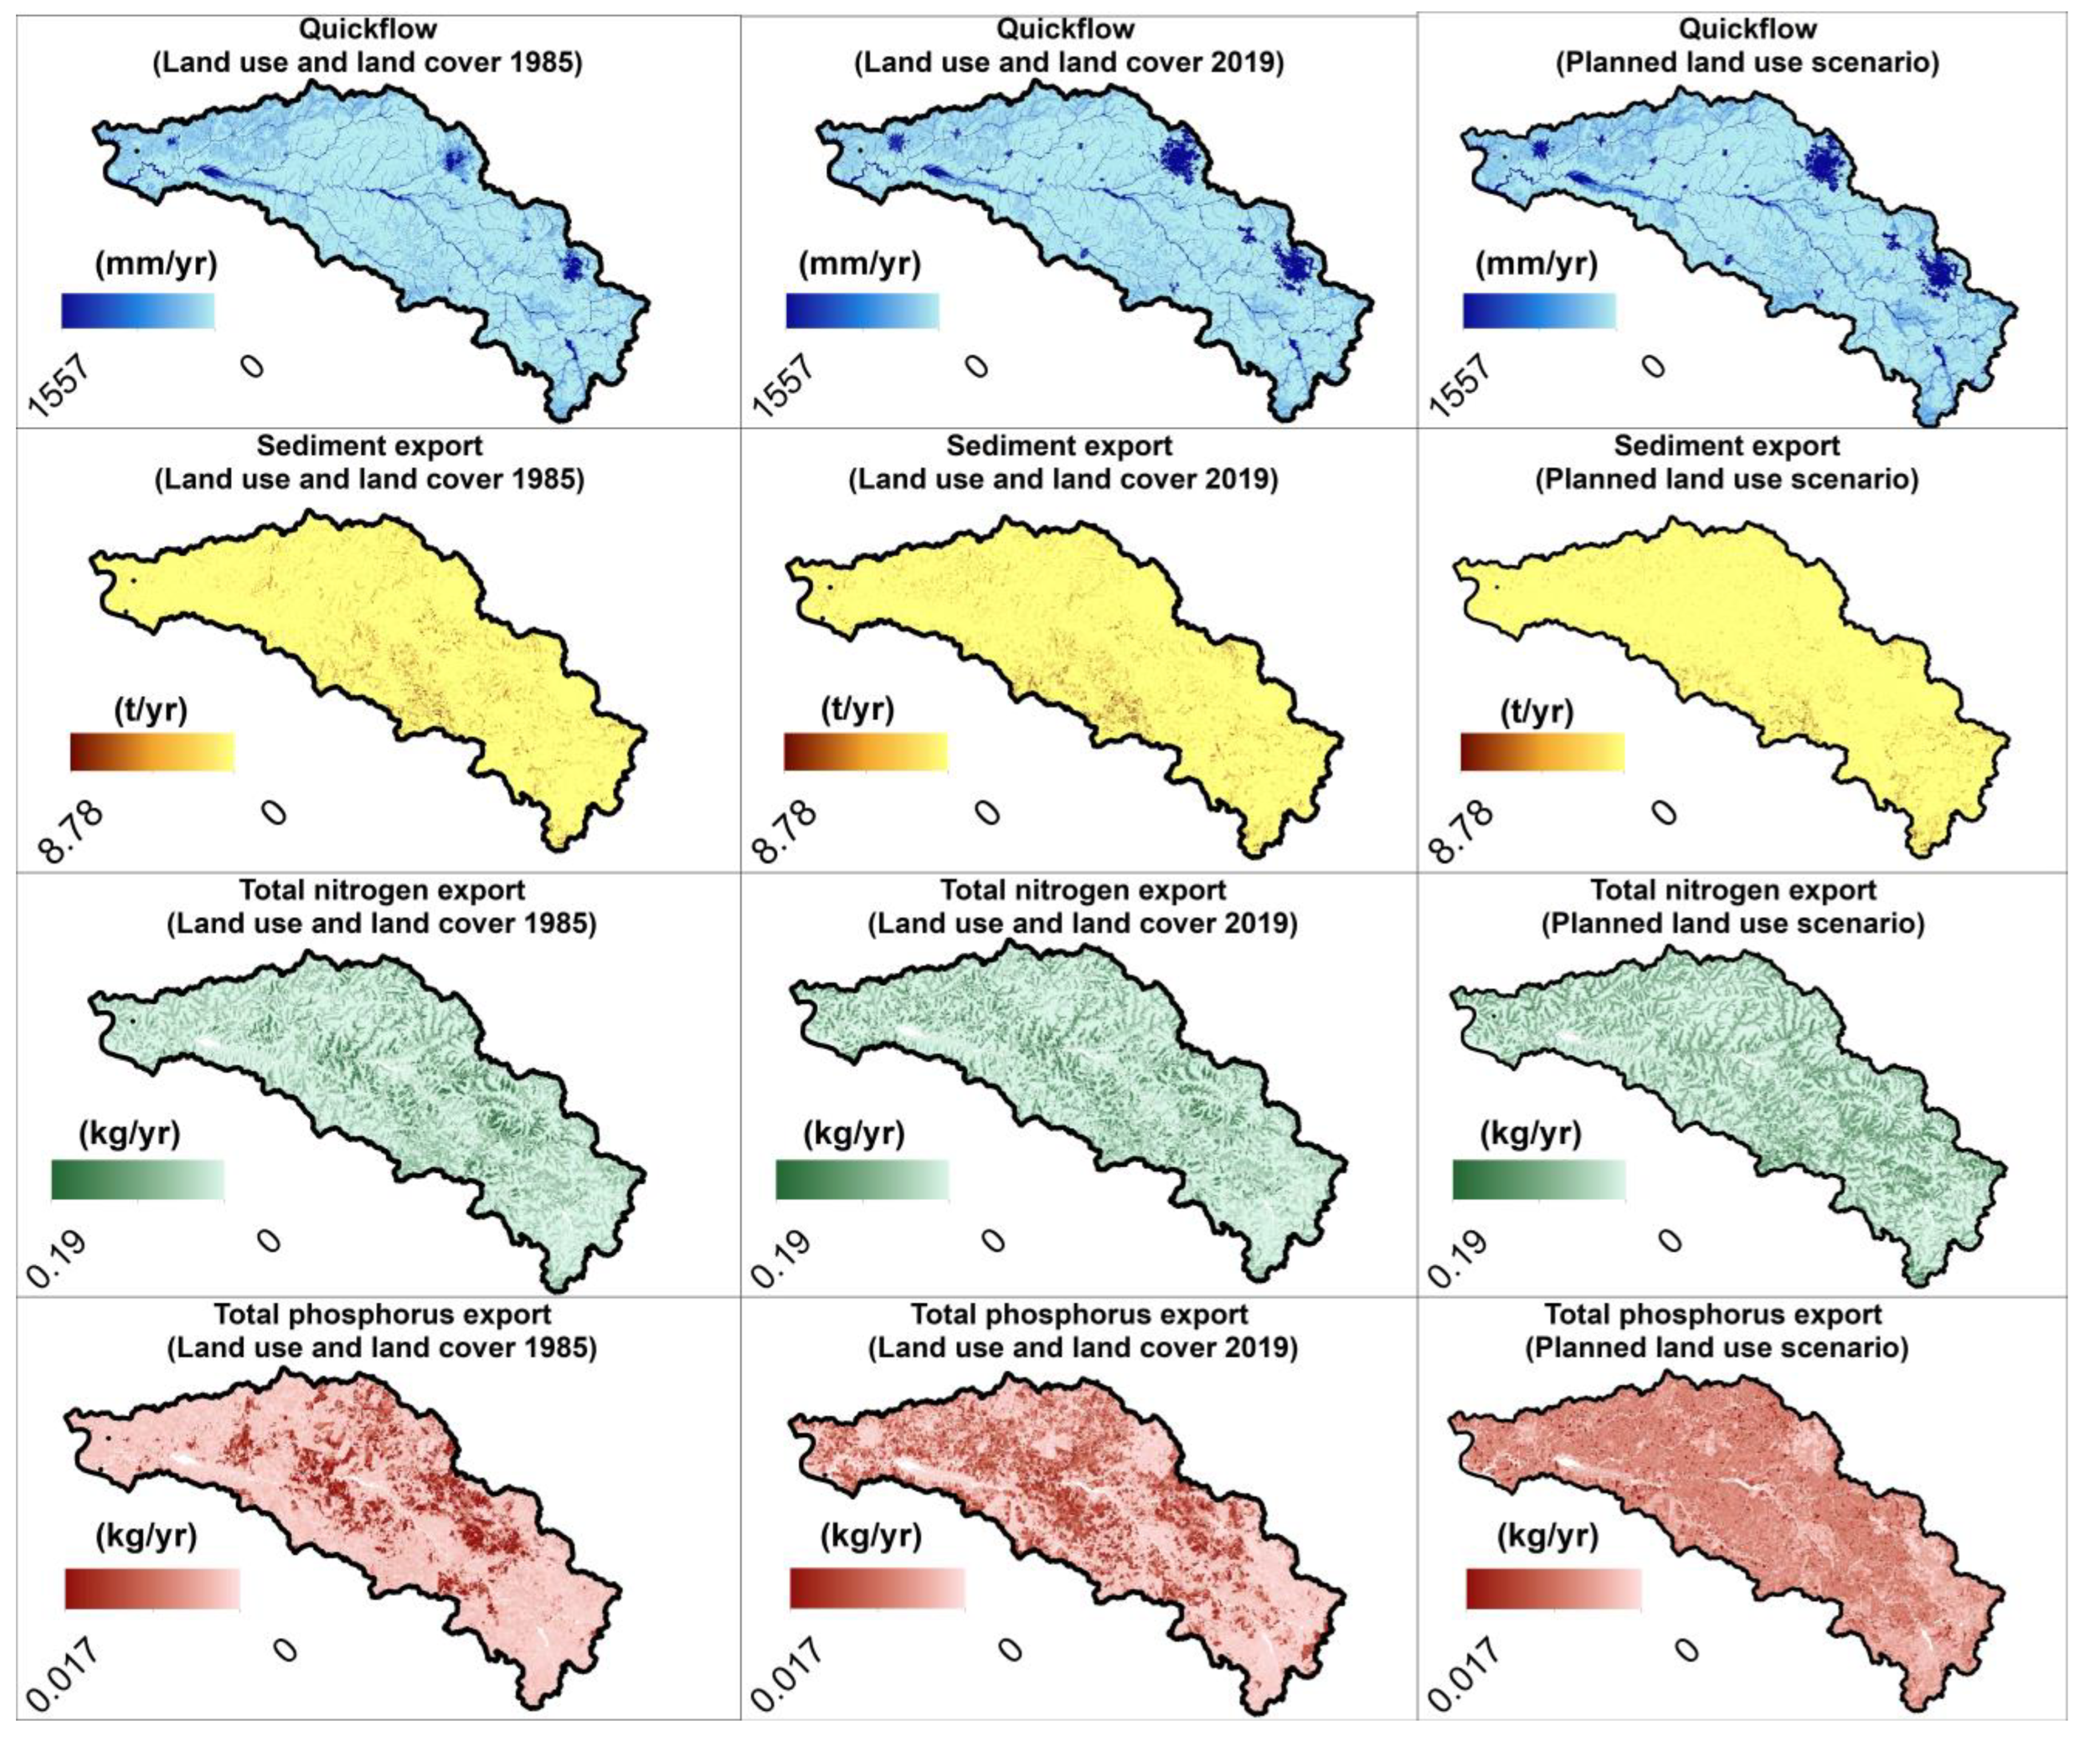
3.2. Changes in Surface Runoff and Exports of Sediments and Nutrients
3.3. Changes in Baseflow and Retentions of Sediments and Nutrients
3.4. Proposal for Environmental Zoning Aiming to Increase the Provision of Water Ecosystem Services
3.5. Effects of the Planned LULC Scenario on Surface Runoff, Sediment Exports, Nutrient Exports, and Water Ecosystem Services
4. Discussion
4.1. Analysis of the Effects of LULC Changes on Surface Runoff and the Exports of Sediments and Nutrients
4.2. Analysis of the Effects of LULC Changes on Baseflow and the Retentions of Sediments and Nutrients
4.3. Effects of Environmental Zoning on Biophysical Indicators
4.4. Methodological Potentials, Limitations, and Uncertainties
5. Conclusions
Supplementary Materials
Author Contributions
Funding
Institutional Review Board Statement
Informed Consent Statement
Data Availability Statement
Conflicts of Interest
References
- Ellison, D.; Morris, C.E.; Locatelli, B.; Sheil, D.; Cohen, J.; Murdiyarso, D.; Sullivan, C.A. Trees, forests and water: Cool insights for a hot world. Glob. Environ. Chang. 2017, 43, 51–61. [Google Scholar] [CrossRef]
- Sun, G.; Hallema, D.; Asbjornsen, H. Ecohydrological processes and ecosystem services in the Anthropocene: A review. Ecol. Process. 2017, 6, 35. [Google Scholar] [CrossRef]
- Manzoni, S.; Porporato, A. Common hydrologic and biogeochemical controls along the soil-stream continuum. Hydrol. Process. 2011, 25, 1355–1360. [Google Scholar] [CrossRef]
- Gao, Y.; Yu, G.; He, N. Equilibration of the terrestrial water, nitrogen, and carbon cycles: 959 advocating a health threshold for carbon storage. Ecol. Eng. 2013, 57, 366–374. 960. [Google Scholar] [CrossRef]
- Pereira, P. Ecosystem services in a changing environment. Sci. Total Environ. 2020, 702, 135008. [Google Scholar] [CrossRef]
- Yohannes, H.; Soromessa, T.; Argaw, M.; Dewan, A. Impact of landscape pattern changes on hydrological ecosystem services in the Beressa watershed of the Blue Nile Basin in Ethiopia. Sci. Total Environ. 2021, 793, 148559. [Google Scholar] [CrossRef]
- Hu, J.; Wu, Y.; Wang, L.; Sun, P.; Zhao, F.; Jin, Z.; Lian, Y. Impacts of land-use conversions on the water cycle in a typical watershed in the southern Chinese Loess Plateau. J. Hydrol. 2021, 593, 125741. [Google Scholar] [CrossRef]
- Daneshi, A.; Brouwer, R.; Najafinejad, A.; Panahi, M.; Zarandian, A.; Maghsood, F.F. Modelling the impacts of climate and land use change on water security in a semi-arid forested watershed using InVEST. J. Hydrol. 2021, 593, 125621. [Google Scholar] [CrossRef]
- Guo, Q.; Yu, C.; Xu, Z.; Yang, Y.; Wang, X. Impacts of climate and land-use changes on water yields: Similarities and differences among typical watersheds distributed throughout China. J. Hydrol. Reg. Stud. 2023, 45, 101294. [Google Scholar] [CrossRef]
- Wang, Z.; Li, Q.; Liu, L.; Zhao, H.; Ru, H.; Wu, J.; Deng, Y. Spatiotemporal Evolution and Attribution Analysis of Water Yield in the Xiangjiang River Basin (XRB) Based on the InVEST Model. Water 2023, 15, 514. [Google Scholar] [CrossRef]
- Uwimana, A.; van Dam, A.A.; Gettel, G.M.; Irvine, K. Effects of agricultural land use on sediment and nutrient retention in valley-bottom wetlands of Migina catchment, southern Rwanda. J. Environ. Manag. 2018, 219, 103–114. [Google Scholar] [CrossRef] [PubMed]
- Yang, S.; Zhao, W.; Liu, Y.; Wang, S.; Wang, J.; Zhai, R. Influence of land use change on the ecosystem service trade-offs in the ecological restoration area: Dynamics and scenarios in the Yanhe watershed, China. Sci. Total Environ. 2018, 644, 556–566. [Google Scholar] [CrossRef] [PubMed]
- Lei, J.C.; Wang, S.; Wu, J.; Wang, J.W.; Xiong, X. Land-use configuration has significant impacts on water-related ecosystem services. Ecol. Eng. 2021, 160, 106133. [Google Scholar] [CrossRef]
- Bendito, B.P.C.; Chaves, H.M.L.; Scariot, A. Erosion and Sedimentation Processes in a Semi-Arid Basin of the Brazilian Savanna under Different Land Use, Climate Change, and Conservation Scenarios. Water 2023, 15, 563. [Google Scholar] [CrossRef]
- Brauman, K.A.; Daily, G.C.; Duarte, T.K.E.; Mooney, H.A. The Nature and Value of Ecosystem Services: An Overview High-Lighting Hydrologic Services. Annu. Rev. Environ. Resour. 2007, 32, 67–98. [Google Scholar] [CrossRef]
- Grizzetti, B.; Lanzanova, D.; Liquete, C.; Reynaud, A.; Cardoso, A.C. Assessing water ecosystem services for water resource management. Environ. Sci. Policy 2016, 61, 194–203. [Google Scholar] [CrossRef]
- Benayas, J.M.R.; Newton, A.C.; Diaz, A.; Bullock, J.M. Enhancement of biodiversity and ecosystem services by ecological restoration: A meta-analysis. Science 2009, 325, 1121–1124. [Google Scholar] [CrossRef]
- Shimamoto, C.Y.; Padial, A.A.; da Rosa, C.M.; Marques, M.C. Restoration of ecosystem services in tropical forests: A global meta-analysis. PLoS ONE 2018, 13, e0208523. [Google Scholar] [CrossRef] [PubMed]
- Fiedler, S.; Monteiro, J.A.; Hulvey, K.B.; Standish, R.J.; Perring, M.P.; Tietjen, B. Global change shifts trade-offs among ecosystem functions in woodlands restored for multifunctionality. J. Appl. Ecol. 2021, 58, 1705–1717. [Google Scholar] [CrossRef]
- Cardoso, F.C.; Capellesso, E.S.; de Britez, R.M.; Inague, G.; Marques, M.C. Landscape conservation as a strategy for recovering biodiversity: Lessons from a long-term program of pasture restoration in the southern Atlantic Forest. J. Appl. Ecol. 2022, 59, 2309–2321. [Google Scholar] [CrossRef]
- Li, C.; Gao, Z.; Sun, B.; Wu, J.; Wang, H.; Ding, X. Ecological restoration effects of the Beijing–Tianjin Sandstorm Source Control Project in China since 2000. Ecol. Indic. 2023, 146, 109782. [Google Scholar] [CrossRef]
- Dave, R.; Saint-Laurent, C.; Murray, L.; Daldegan, G.A.; Brouwer, R.; Scaramuzza, C.A.M.; Raes, L.; Simonit, S.; Catapan, M.; Contreras, G.G.G.; et al. Second Bonn Challenge Progress Report; IUCN: Gland, Switzerland, 2019; 80p. [Google Scholar]
- Tambosi, L.R.; Vidal, M.M.; Ferraz, S.F.D.B.; Metzger, J.P. Funções eco-hidrológicas das 1229 florestas nativas e o Código Florestal. Estud. Avançados 2015, 29, e00571. [Google Scholar]
- Calder, I.R.; Aylward, B. Forest and floods: Moving to an evidence-based approach to watershed and integrated flood management. Water Int. 2006, 31, 87–99. [Google Scholar] [CrossRef]
- Lara, A.; Jones, J.; Little, C.; Vergara, N. Streamflow response to native forest restoration in former Eucalyptus plantations in south central Chile. Hydrol. Process. 2021, 35, e14270. [Google Scholar] [CrossRef]
- Serra-Llobet, A.; Jähnig, S.C.; Geist, J.; Kondolf, G.M.; Damm, C.; Scholz, M.; Schmitt, R. Restoring rivers and floodplains for habitat and flood risk reduction: Experiences in multi-benefit floodplain management from California and Germany. Front. Environ. Sci. 2022, 9, 778568. [Google Scholar] [CrossRef]
- Feld, C.K.; Fernandes, M.R.; Ferreira, M.T.; Hering, D.; Ormerod, S.J.; Venohr, M.; Gutiérrez-Cánovas, C. Evaluating riparian solutions to multiple stressor problems in river ecosystems—A conceptual study. Water Res. 2018, 139, 381–394. [Google Scholar] [CrossRef] [PubMed]
- Qi, W.; Li, H.; Zhang, Q.; Zhang, K. Forest restoration efforts drive changes in land-use/land-cover and water-related ecosystem services in China’s Han River basin. Ecol. Eng. 2019, 126, 64–73. [Google Scholar] [CrossRef]
- Duarte, G.T.; Ribeiro, M.C.; Paglia, A.P. Ecosystem services modeling as a tool for defining priority areas for conservation. PLoS ONE 2016, 11, e0154573. [Google Scholar] [CrossRef] [PubMed]
- Valente, R.A.; de Mello, K.; Metedieri, J.F.; Americo, C. A multicriteria evaluation approach to set forest restoration priorities based on water ecosystem services. J. Environ. Manag. 2021, 285, 112049. [Google Scholar] [CrossRef]
- Zhu, Z.; Wang, K.; Lei, M.; Li, X.; Li, X.; Jiang, L.; Liang, J. Identification of priority areas for water ecosystem services by a techno-economic, social and climate change modeling framework. Water Res. 2022, 221, 118766. [Google Scholar] [CrossRef]
- Santos, A.R.; da Silva Anjinho, P.; Neves, G.L.; Barbosa, M.A.G.A.; de Assis, L.C.; Mauad, F.F. Dynamics of environmental conservation: Evaluating the past for a sustainable future. Int. J. Appl. Earth Obs. Geoinf. 2021, 102, 102452. [Google Scholar] [CrossRef]
- Anjinho, P.S.; Takaku, L.Y.R.B.; Barbosa, C.C.; Periotto, N.A.; Hanai, F.Y.; Mauad, F.F. Analysis of Susceptibility to Degradation of Water Ecosystem Services as a Tool for Land Use Planning: A Case Study in a Small Brazilian Watershed. Environ. Manag. 2022, 70, 990–1003. [Google Scholar] [CrossRef] [PubMed]
- Costa, T.L.D.S.R.; Mazzochini, G.G.; Oliveira-Filho, A.T.; Ganade, G.; Carvalho, A.R.; Manhães, A.P. Priority areas for restoring ecosystem services to enhance human well-being in a dry forest. Restor. Ecol. 2021, 29, e13426. [Google Scholar] [CrossRef]
- Silva, E.; Naji, W.; Salvaneschi, P.; Climent-Gil, E.; Derak, M.; López, G.; Cortina-Segarra, J. Prioritizing areas for ecological restoration: A participatory approach based on cost-effectiveness. J. Appl. Ecol. 2023, 60, 1194–1205. [Google Scholar] [CrossRef]
- Zhou, G.; Huan, Y.; Wang, L.; Lan, Y.; Liang, T.; Shi, B.; Zhang, Q. Linking ecosystem services and circuit theory to identify priority conservation and restoration areas from an ecological network perspective. Sci. Total Environ. 2023, 873, 162261. [Google Scholar] [CrossRef]
- Peng, J.; Wang, A.; Luo, L.; Liu, Y.; Li, H.; Hu, Y.N.; Wu, J. Spatial identification of conservation priority areas for urban ecological land: An approach based on water ecosystem services. Land Degrad. Dev. 2019, 30, 683–694. [Google Scholar] [CrossRef]
- Fan, M.; Shi, M.; Liu, Y.; Chen, W.; Deng, Y.; Wang, M. Implications of spatial priority areas for hydrological ecosystem services through coupling hydrology model and Zonation model under different economic costs of water utilizations in northernmost of Japan. Mitig. Adapt. Strateg. Glob. Chang. 2022, 27, 1–35. [Google Scholar] [CrossRef]
- Possantti, I.; Barbedo, R.; Kronbauer, M.; Collischonn, W.; Marques, G. A comprehensive strategy for modeling watershed restoration priority areas under epistemic uncertainty: A case study in the Atlantic Forest, Brazil. J. Hydrol. 2023, 617, 129003. [Google Scholar] [CrossRef]
- Wang, S.; Wang, Y.; Wang, Y.; Wang, Z. Assessment of influencing factors on non-point source pollution critical source areas in an agricultural watershed. Ecol. Indic. 2022, 141, 109084. [Google Scholar] [CrossRef]
- Capon, S.J.; Chambers, L.E.; Mac Nally, R.; Naiman, R.J.; Davies, P.; Marshall, N.; Catford, J. Riparian ecosystems in the 21st century: Hotspots for climate change adaptation? Ecosystems 2013, 16, 359–381. [Google Scholar] [CrossRef]
- Melillo, J.M.; Lu, X.; Kicklighter, D.W.; Reilly, J.M.; Cai, Y.; Sokolov, A.P. Protected areas’ role in climate-change mitigation. Ambio 2016, 45, 133–145. [Google Scholar] [CrossRef] [PubMed]
- Ferraz, S.F.; Ferraz, K.M.; Cassiano, C.C.; Brancalion, P.H.; da Luz, D.T.; Azevedo, T.N.; Tambosi, L.R.; Metzger, J.P. How good are tropical forest patches for ecosystem services provisioning? Landsc. Ecol. 2014, 29, 187–200. [Google Scholar] [CrossRef]
- Cunha, D.G.F.; Magri, R.A.F.; Tromboni, F.; Ranieri, V.E.L.; Fendrich, A.N.; Campanhão, L.M.B.; Velázquez, J.A. Landscape patterns influence nutrient concentrations in aquatic systems: Citizen science data from Brazil and Mexico. Freshw. Sci. 2019, 38, 365–378. [Google Scholar] [CrossRef]
- Campanhão, L.M.B. Influence of Landscape Pattern on Water Quality: Contributions to the Conservation of Watershedservices. Ph.D. Thesis, University of São Paulo, Sao Paulo, Brazil, 2022. [Google Scholar]
- MapBiomas. Brazil Land Use Data Series. Collection 5, Brazil. 2021. Available online: https://mapbiomas.org/colecoes-mapbiomas-1?cama_set_language=pt-BR (accessed on 13 July 2021).
- Natural Capital Project. InVEST Model. 2022. Available online: https://naturalcapitalproject.stanford.edu/software/invest (accessed on 15 September 2023).
- CBH-TJ. Tietê Jacaré River Hydrographic Basin Committee. UGRHI 13 River Basin Plan; Technical Document: São Paulo, Brazil, 2016. [Google Scholar]
- Anjinho, P.S.; Barbosa, M.A.G.A.; Mauad, F.F. Evaluation of InVEST’s water ecosystem service models in a Brazilian Subtropical Basin. Water 2022, 14, 1559. [Google Scholar] [CrossRef]
- Rossi, M.; Kanashiro, M.M. Pedological Map of the State of São Paulo: Revised and Expanded. São Paulo: Instituto Florestal, 2017. V.1. 118p. 2017. Available online: https://www.infraestruturameioambiente.sp.gov.br/institutoflorestal/wp-content/uploads/sites/234/2017/11/Livro_Solos1.pdf (accessed on 22 July 2021).
- Peel, M.C.; Finlayson, B.L.; McMahon, T.A. Updated World Map of the Köppen-Geiger Climate Classification. Hydrol. Earth Syst. Sci. 2007, 11, 1633–1644. [Google Scholar] [CrossRef]
- IF. Instituto Florestal do Estado de São Paulo. Plano de Manejo Integrado das Estações Ecológica e Experimetnal de Itirapina/SP. 2006. Available online: https://smastr16.blob.core.windows.net/iflorestal/2013/03/Plano_de_Manejo_EEc_Itirapina.pdf (accessed on 13 July 2021).
- Santos, A.R.; Barbosa, M.A.; Bolleli, T.; Anjinho, P.S.; Roque, R.; Mauad, F.F. Assessment of Water Ecosystem Integrity (WEI) in a Transitional Brazilian Cerrado–Atlantic Forest Interface. Water 2023, 15, 775. [Google Scholar] [CrossRef]
- Trevisan, D.P.; Bispo, P.D.C.; Gou, Y.; Fogaça de Souza, B.; Liesenberg, V.; Harris, A.; Moschini, L.E. Analysis of a Landscape Intensely Modified by Agriculture in the Tietê–Jacaré Watershed, Brazil. Sustainability 2021, 13, 9304. [Google Scholar] [CrossRef]
- Santos, F.M.D. Parsimonious and Physically-Based Models to Evaluate Streamflows, Soil Loss, and Pollution in Watershed in the Interior of Sao Paulo. Ph.D. Thesis, Universidade de São Paulo, São Paulo, Brazil, 2018; 192p. [Google Scholar]
- Anache, J.A.; Wendland, E.; Rosalem, L.M.; Youlton, C.; Oliveira, P.T. Hydrological trade-offs due to different land covers and land uses in the Brazilian Cerrado. Hydrol. Earth Syst. Sci. 2019, 23, 1263–1279. [Google Scholar] [CrossRef]
- Anjinho, P.S.; Barbosa, M.A.G.A.; Neves, G.L.; Dos Santos, A.R.; Mauad, F.F. Integrated empirical models to assess nutrient concentration in water resources: Case study of a small basin in southeastern Brazil. Environ. Sci. Pollut. Res. 2021, 28, 23349–23367. [Google Scholar] [CrossRef]
- Costa, C.W.; Lorandi, R.; Lollo, J.A.; Santos, V.S. Potential for aquifer contamination of anthropogenic activity in the recharge area of the Guarani Aquifer System, southeast of Brazil. Groundw. Sustain. Dev. 2019, 8, 10–23. [Google Scholar] [CrossRef]
- Camargo, Â.P.D.; Marin, F.R.; Sentelhas, P.C.; Picini, A.G. Ajuste da equação de Thornthwaite para estimar evapotranspiração potencial em climas áridos e superúmidos, com base na ampliturde térmica diária. Rev. Bras. De Agrometeorol. 1999, 7, 251–257. [Google Scholar]
- SMA. Secretariat for the Environment of the State of São Paulo; Elaboração do Plano de Desenvolvimento e Proteção Ambiental da Bacia Hidrográfica do Reservatório Billings: São Paulo, Brazil, 2010. [Google Scholar]
- Marro, A.A.; Souza, A.D.C.; Cavalcante, E.D.S.; Bezerra, G.S.; Nunes, R.O. Lógica Fuzzy: Conceitos e Aplicações; Universidade Federal do Rio Grande do Norte (UFRN): Natal, Brazil, 2010; Volume 2. [Google Scholar]
- Le Moal, M.; Gascuel-Odoux, C.; Ménesguen, A.; Souchon, Y.; Étrillard, C.; Levain, A.; Pinay, G. Eutrophication: A new wine in an old bottle? Sci. Total Environ. 2019, 651, 1–11. [Google Scholar] [CrossRef] [PubMed]
- Vries, W. Impacts of nitrogen emissions on ecosystems and human health: A mini review. Curr. Opin. Environ. Sci. Health 2021, 21, 100249. [Google Scholar] [CrossRef]
- Miranda, R.B.; Mauad, F.F. Influence of sedimentation on hydroelectric power generation: Case study of a Brazilian reservoir. J. Energy Eng. 2015, 141, 04014016. [Google Scholar] [CrossRef]
- Estigoni, M.V.; Miranda, R.B.; Mauad, F.F. Hydropower reservoir sediment and water quality assessment. Manag. Environ. Qual. Int. J. 2017, 28, 43–56. [Google Scholar] [CrossRef]
- Martinez, A.E.J.; Galoski, C.E.; Figueira, R.C.L.; de Lima Ferreira, P.A.; Froehner, S. 136 Years of variation of sediment-associated metals in a subtropical reservoir in southern Brazil: Implications for the environmental change. Catena 2023, 231, 107315. [Google Scholar] [CrossRef]
- Das, S. Geospatial mapping of flood susceptibility and hydro-geomorphic response to the floods in Ulhas basin, India. Remote Sens. Appl. Soc. Environ. 2019, 14, 60–74. [Google Scholar] [CrossRef]
- Du, X.; Jian, J.; Du, C.; Stewart, R.D. Conservation management decreases surface runoff and soil erosion. Int. Soil Water Conserv. Res. 2022, 10, 188–196. [Google Scholar] [CrossRef]
- IEA. Instituto de Economia Agrícola. Valor da Produção Agropecuária do Estado de São Paulo: Resultado Preliminar de 2018; 2018; 13, 6p. Available online: http://www.iea.sp.gov.br/ftpiea/aia/AIA-74-2018.pdf (accessed on 15 August 2021).
- Cherubin, M.R.; Carvalho, J.L.N.; Cerri, C.E.P.; Nogueira, L.A.H.; Souza, G.M.; Cantarella, H. Land use and management effects on sustainable sugarcane-derived bioenergy. Land 2021, 10, 72. [Google Scholar] [CrossRef]
- Bueno, L.O.; Anjinho, P.D.S.; Bolleli, T.D.M.; Barbosa, M.A.G.A.; Mauad, F.F. Erosion susceptibility mapping in the Central-Eastern Region of São Paulo in the last few decades. Environ. Monit. Assess. 2022, 194, 927. [Google Scholar] [CrossRef] [PubMed]
- Ogura, A.P.; da Silva, A.C.; Castro, G.B.; Espíndola, E.L.G.; Da Silva, A.L. An overview of the sugarcane expansion in the state of São Paulo (Brazil) over the last two decades and its environmental impacts. Sustain. Prod. Consum. 2022, 32, 66–75. [Google Scholar] [CrossRef]
- Hunke, P.; Mueller, E.N.; Schröder, B.; Zeilhofer, P. The Brazilian Cerrado: Assessment of water and soil degradation in catchments under intensive agricultural use. Ecohydrology 2015, 8, 1154–1180. [Google Scholar] [CrossRef]
- Moraes, M.C.P.; de Mello, K.; Toppa, R.H. Protected areas and agricultural expansion: Biodiversity conservation versus economic growth in the Southeast of Brazil. J. Environ. Manag. 2017, 188, 73–84. [Google Scholar] [CrossRef] [PubMed]
- Couto-Júnior, A.A.; da Conceição, F.T.; Fernandes, A.M.; Junior, E.P.S.; Lupinacci, C.M.; Moruzzi, R.B. Land use changes associated with the expansion of sugar cane crops and their influences on soil removal in a tropical watershed in São Paulo State (Brazil). Catena 2019, 172, 313–323. [Google Scholar] [CrossRef]
- Durán, A.P.; Green, J.M.; West, C.D.; Visconti, P.; Burgess, N.D.; Virah-Sawmy, M.; Balmford, A. A practical approach to measuring the biodiversity impacts of land conversion. Methods Ecol. Evol. 2020, 11, 910–921. [Google Scholar] [CrossRef]
- Taniwaki, R.H.; Cassiano, C.C.; Filoso, S.; de Barros Ferraz, S.F.; de Camargo, P.B.; Martinelli, L.A. Impacts of converting low-intensity pastureland to high-intensity bioenergy cropland on the water quality of tropical streams in Brazil. Sci. Total Environ. 2017, 584, 339–347. [Google Scholar] [CrossRef] [PubMed]
- Santos, F.M.; Oliveira, R.P.; Lollo, J.G. Effects of land use changes on streamflow and sediment yield in Atibaia River Basin—SP, Brazil. Water 2020, 12, 1711. [Google Scholar] [CrossRef]
- Youlton, C.; Wendland, E.; Anache, J.A.A.; Poblete-Echeverría, C.; Dabney, S. Changes in erosion and runoff due to replacement of pasture land with sugarcane crops. Sustainability 2016, 8, 685. [Google Scholar] [CrossRef]
- Anjinho, P.S.; Barbosa, M.A.G.A.; Costa, C.W.; Mauad, F.F. Environmental fragility analysis in reservoir drainage basin land use planning: A Brazilian basin case study. Land Use Policy 2016, 100, 104946. [Google Scholar] [CrossRef]
- Lima, F.P.; de Souza Almeida, F.P.; Mendonça Filho, S.F.; de Melo Murta, J.R.; de Brito, G.Q.; Salemi, L.F. Water infiltration in the Brazilian tropical savanna: The case of Cerrado típico. J. Biotechnol. Biodivers. 2020, 8, 165–171. [Google Scholar] [CrossRef]
- Mei, Y.; Kong, X.; Ke, X.; Yang, B. The impact of cropland balance policy on ecosystem service of water purification—A case study of Wuhan, China. Water 2017, 9, 620. [Google Scholar] [CrossRef]
- Schirpke, U.; Kohler, M.; Leitinger, G.; Fontana, V.; Tasser, E.; Tappeiner, U. Future impacts of changing land-use and climate on ecosystem services of mountain grassland and their resilience. Ecosyst. Serv. 2017, 26, 79–94. [Google Scholar] [CrossRef] [PubMed]
- Decsi, B.; Vári, Á.; Kozma, Z. The effect of future land use changes on hydrologic ecosystem services: A case study from the Zala catchment, Hungary. Biol. Futur. 2020, 71, 405–418. [Google Scholar] [CrossRef] [PubMed]
- Fang, Z.; Ding, T.; Chen, J.; Xue, S.; Zhou, Q.; Wang, Y.; Yang, S. Impacts of land use/land cover changes on ecosystem services in ecologically fragile regions. Sci. Total Environ. 2022, 831, 154967. [Google Scholar] [CrossRef] [PubMed]
- Riis, T.; Kelly-Quinn, M.; Aguiar, F.C.; Manolaki, P.; Bruno, D.; Bejarano, M.D.; Dufour, S. Global overview of ecosystem services provided by riparian vegetation. BioScience 2020, 70, 501–514. [Google Scholar] [CrossRef]
- Resende, F.M.; Cimon-Morin, J.; Poulin, M.; Meyer, L.; Joner, D.C.; Loyola, R. The importance of protected areas and Indigenous lands in securing ecosystem services and biodiversity in the Cerrado. Ecosyst. Serv. 2021, 49, 101282. [Google Scholar] [CrossRef]
- Ferreira, P.; van Soesbergen, A.; Mulligan, M.; Freitas, M.; Vale, M.M. Can forests buffer negative impacts of land-use and climate changes on water ecosystem services? The case of a Brazilian megalopolis. Sci. Total Environ. 2019, 685, 248–258. [Google Scholar] [CrossRef] [PubMed]
- Dufour, S.; Rodríguez-González, P.M.; Laslier, M. Tracing the scientific trajectory of riparian vegetation studies: Main topics, approaches and needs in a globally changing world. Sci. Total Environ. 2019, 653, 1168–1185. [Google Scholar] [CrossRef]
- Luke, S.H.; Slade, E.M.; Gray, C.L.; Annammala, K.V.; Drewer, J.; Williamson, J.; Struebig, M.J. Riparian buffers in tropical agriculture: Scientific support, effectiveness and directions for policy. J. Appl. Ecol. 2019, 56, 85–92. [Google Scholar] [CrossRef]
- Huerta-Rodríguez, J.O.; Rosas-Rosas, O.C.; López-Mata, L.; Alcántara-Carbajal, J.L.; Tarango-Arámbula, L.A. Camera traps reveal the natural corridors used by mammalian species in eastern Mexico. Ecol. Process. 2022, 11, 51. [Google Scholar] [CrossRef]
- Siqueira, P.P.; Oliveira, P.T.S.; Bressiani, D.; Neto, A.A.M.; Rodrigues, D.B. Effects of climate and land cover changes on water availability in a Brazilian Cerrado basin. J. Hydrol. Reg. Stud. 2021, 37, 100931. [Google Scholar] [CrossRef]
- Tarigan, S.; Wiegand, K.; Slamet, B. Minimum forest cover required for sustainable water flow regulation of a watershed: A case study in Jambi Province, Indonesia. Hydrol. Earth Syst. Sci. 2018, 22, 581–594. [Google Scholar] [CrossRef]
- Neves, G.L.; Guimarães, T.T.; Anjinho, P.S.; Barbosa, M.A.; SANTOS, A.R.; Virgens Filho, J.S.; Mauad, F.F. Spatial and Seasonal Assessment of Water Quality in the Lobo Stream River Basin, Brazil Using Multivariate Statistical Techniques. An. Da Acad. Bras. De Ciências 2021, 93, 1–20. [Google Scholar] [CrossRef] [PubMed]
- Orsi, F.; Ciolli, M.; Primmer, E.; Varumo, L.; Geneletti, D. Mapping hotspots and bundles of forest ecosystem services across the European Union. Land Use Policy 2020, 99, 104840. [Google Scholar] [CrossRef]
- Ren, Y.; Lü, Y.; Fu, B.; Zhang, K. Biodiversity and ecosystem functional enhancement by forest restoration: A meta-analysis in China. Land Degrad. Dev. 2017, 28, 2062–2073. [Google Scholar] [CrossRef]


| Potential Degradation Levels | Land Use and Land Cover | Environmental Zoning |
|---|---|---|
| High | Anthropic use | Priority areas for restoration |
| Low and medium | Anthropic use | Anthropic use zone |
| Any potential degradation levels | Urban areas | Consolidated zone |
| Any potential degradation levels | Natural vegetation | Environmental conservation zone |
| Land Use and Land Cover | Quickflow (mm/yr) | Sediment Export (t/yr) | Total Nitrogen Export (kg/yr) | Total Phosphorus Export (kg/yr) | ||||||||
|---|---|---|---|---|---|---|---|---|---|---|---|---|
| 1985 | 2019 | Changes | 1985 | 2019 | Changes | 1985 | 2019 | Changes | 1985 | 2019 | Changes | |
| (%) | (%) | (%) | (%) | |||||||||
| Agriculture | 64 | 54 | −16 | 10,768 | 27,524 | 156 | 225,573 | 399,446 | 77 | 36,811 | 73,270 | 99 |
| Water | 1154 | 1155 | 0 | 0 | 1 | 45 | 63 | 76 | 19 | 4 | 4 | 5 |
| Urban area | 1011 | 1004 | −1 | 3 | 66 | 2114 | 2899 | 12,525 | 332 | 134 | 535 | 300 |
| Natural vegetation | 169 | 218 | 29 | 575 | 627 | 9 | 62,030 | 62,815 | 1.26 | 4683 | 4019 | −14 |
| Forest Plantation | 26 | 28 | 7 | 353 | 1586 | 349 | 2615 | 7505 | 187 | 350 | 1023 | 192 |
| Pasture | 110 | 172 | 56 | 14,220 | 9284 | −35 | 178,233 | 89,523 | −50 | 13,257 | 5839 | −56 |
| JGRB | 128 | 154 | 20 | 25,920 | 39,087 | 51 | 471,413 | 571,889 | 21 | 55,239 | 84,690 | 53 |
| Land use and land cover | Baseflow (mm/yr) | Sediment retention (t/yr) | Total nitrogen retention (kg/yr) | Total phosphorus retention (kg/yr) | ||||||||
| 1985 | 2019 | Changes (%) | 1985 | 2019 | Changes (%) | 1985 | 2019 | Changes (%) | 1985 | 2019 | Changes (%) | |
| Agriculture | 141 | 138 | −3 | 1,805,134 | 4,519,504 | 150 | 166,773 | 361,429 | 117 | 34,290 | 77,523 | 126 |
| Water | 12 | 13 | 3 | 28,185 | 57,884 | 105 | 204 | 285 | 40 | 27 | 37 | 40 |
| Urban area | 195 | 192 | −1 | 590 | 53,915 | 9038 | 1732 | 6799 | 292 | 156 | 533 | 241 |
| Natural vegetation | 219 | 199 | −9 | 1,893,772 | 3,004,434 | 59 | 354,960 | 350,281 | −1 | 58,633 | 47,882 | −18 |
| Forest Plantation | 253 | 252 | −0 | 123,829 | 503,007 | 306 | 20,259 | 51,429 | 154 | 5616 | 13,840 | 146 |
| Pasture | 373 | 345 | −7 | 5,174,698 | 4,031,867 | −22 | 745,857 | 389,850 | −48 | 140,843 | 61,892 | −56 |
| JGRB | 279 | 202 | −27 | 9,026,207 | 12,170,611 | 35 | 1,289,786 | 1,160,074 | −10 | 239,565 | 201,707 | −16 |
Disclaimer/Publisher’s Note: The statements, opinions and data contained in all publications are solely those of the individual author(s) and contributor(s) and not of MDPI and/or the editor(s). MDPI and/or the editor(s) disclaim responsibility for any injury to people or property resulting from any ideas, methods, instructions or products referred to in the content. |
© 2024 by the authors. Licensee MDPI, Basel, Switzerland. This article is an open access article distributed under the terms and conditions of the Creative Commons Attribution (CC BY) license (https://creativecommons.org/licenses/by/4.0/).
Share and Cite
Anjinho, P.d.S.; Barbosa, M.A.G.A.; Peponi, A.; Duarte, G.; Branco, P.; Ferreira, M.T.; Mauad, F.F. Enhancing Water Ecosystem Services Using Environmental Zoning in Land Use Planning. Sustainability 2024, 16, 4803. https://doi.org/10.3390/su16114803
Anjinho PdS, Barbosa MAGA, Peponi A, Duarte G, Branco P, Ferreira MT, Mauad FF. Enhancing Water Ecosystem Services Using Environmental Zoning in Land Use Planning. Sustainability. 2024; 16(11):4803. https://doi.org/10.3390/su16114803
Chicago/Turabian StyleAnjinho, Phelipe da Silva, Mariana Abibi Guimarães Araujo Barbosa, Angeliki Peponi, Gonçalo Duarte, Paulo Branco, Maria Teresa Ferreira, and Frederico Fábio Mauad. 2024. "Enhancing Water Ecosystem Services Using Environmental Zoning in Land Use Planning" Sustainability 16, no. 11: 4803. https://doi.org/10.3390/su16114803
APA StyleAnjinho, P. d. S., Barbosa, M. A. G. A., Peponi, A., Duarte, G., Branco, P., Ferreira, M. T., & Mauad, F. F. (2024). Enhancing Water Ecosystem Services Using Environmental Zoning in Land Use Planning. Sustainability, 16(11), 4803. https://doi.org/10.3390/su16114803