Article

Urban Flood Modeling for Sustainability Management: Role of Design Rainfall and Land Use

by
Dariusz Młyński
1,*,
Wiktor Halecki
2 and
Karolina Surowiec
3
1
Department of Sanitary Engineering and Water Management, University of Agriculture in Krakow, Mickiewicza 21, 31-120 Krakow, Poland
2
Institute of Technology and Life Sciences-National Research Institute, Falenty, Hrabska 3, 05-090 Raszyn, Poland
3
Antea Poland S.A. Company, Dulęby 5, 40-833 Katowice, Poland
*
Author to whom correspondence should be addressed.
Sustainability 2024, 16(11), 4805; https://doi.org/10.3390/su16114805
Submission received: 26 March 2024 / Revised: 15 May 2024 / Accepted: 31 May 2024 / Published: 5 June 2024

Abstract

:
This study aimed to evaluate how different methods of determining design rainfall levels and land usage affect flood hydrographs in an urban catchment; specifically, the catchment in southern Poland. The data included daily precipitation records from 1981 to 2020 and land cover information from Corine Land Cover and Urban Atlas databases for 2006 and 2018. The analysis involved examining precipitation data, determining design rainfall levels, analyzing land usage databases, exploring the influence of design rainfall levels on hydrograph characteristics, and investigating the database’s impact on these characteristics. No discernible trend in precipitation was found. The highest design rainfall values followed the GEV distribution, while the lowest followed the Gumbel distribution. Both land usage databases indicated an increasing human influence from 2006 to 2018. This study conclusively showed that the method used for estimating design rainfall and the choice of the land usage database significantly affected hydrograph characteristics. Multivariate analyses are recommended for design rainfall assessments, while the Urban Atlas database is preferred for urban catchment land usage determinations due to its detailed information.

1. Introduction

In recent decades, there has been an increase in the risk of flooding in urban catchments. These areas are complex systems with varying development rates, depending on the region. The ongoing process of urbanization disrupts the natural water cycle in urban watersheds. Consequently, understanding and managing hydrology in these areas is highly challenging, partly due to the use of technical infrastructure networks, such as stormwater drainage systems [1]. These systems interfere with the natural hydrological patterns of rivers, which serve as receptors for rainfall runoff. Numerous studies indicate that stormwater drainage systems contribute to increased runoff and decreased groundwater levels, ultimately raising the vulnerability of urban watersheds to hydrometeorological extremes like droughts and floods [2,3]. For instance, Zope et al. [4] stated that urbanization and the expansion of impermeable surfaces result in higher volumes of stormwater runoff, exacerbating flood risks in urban areas. Yang et al. [5] examined the role of urban spatial development on the hydrologic response at both catchment and river basins. They demonstrated that flood peaks arrive earlier with urbanization. Early flood peaks in urban areas pose significant threats. They can lead to loss of life, infrastructure damage, financial losses, and environmental contamination. Intense floods can also disrupt the economy through supply interruptions and job losses. Therefore, it is necessary to develop flood risk management strategies and invest in resilient urban infrastructure. Additionally, research conducted by Minning et al. [6] indicated a strong correlation between groundwater recharge rates and the extent of the urban area. They demonstrated that the transformation of natural landscapes into impervious areas leads to an increase in groundwater recharge rates due to the reduction of evapotranspiration which more than compensates for the increase in runoff. Furthermore, the study of O’Driscoll et al. [7] showed the relationships between urbanization and the expansion of a catchment impervious area and catchment hydrology, groundwater recharge, stream geomorphology, climate, biogeochemistry, and stream ecology These findings underscore the critical need for sustainable stormwater management practices to mitigate the adverse effects of urbanization on hydrological systems.
One particularly perilous type of flood in urbanized watersheds is known as urban flooding. These events often occur without the involvement of traditional hydrographic elements. The primary causes of urban flooding are sudden heavy rainfall and the ongoing sealing of urban areas, which results in a greater proportion of impermeable surfaces within cities. In extreme cases, the increase in peak flows caused by urbanization can be as much as 15 to 20 times higher. Urban floods are characterized by a shortened time to reach the peak flow and an increase in their volume compared to natural watersheds. The continuous processes of catchment sealing and accompanying climate changes lead to a more frequent occurrence of urban flooding. For many years, urban flooding has been considered a serious threat and poses significant risks to many cities. Therefore, it is imperative to take proactive flood protection measures [8,9,10].
The implementation of effective response measures is crucial for cities to address the increasingly complex challenges of water management and storage while promoting sustainable living spaces. Nature-based solutions, such as blue–green infrastructure, offer promising options in this endeavor [11]. Enhancing city sustainability through the water modeling of hydraulic structures involves leveraging advanced computational techniques to optimize water management within urban areas. This ensures long-term ecological and socio-economic well-being while mitigating risks such as floods and water pollution. This urgency is further underscored by the growing unpredictability of rainfall attributed to climate change [12]. With urban flooding projected to escalate due to climate changes, innovative methods are becoming increasingly indispensable [13].
Current flood risk assessment methods often lack comprehensive coverage, focusing narrowly on specific cities and overlooking broader risk perspectives. Additionally, analyzing structural displacements, including those of concrete dams and water-damming weirs, is crucial. Practical recommendations for altering city land use can significantly enhance sustainable water management strategies in urban areas [14]. Within the European Union’s sustainability initiative, the exploration of functional urban areas (FUA) offers insights into the degree of soil sealing. A viable approach to data assessment involves harnessing the Georeferenced Database of Topographic Objects from the Polish government database to precisely identify impermeability levels [15].
In the case of flood protection, theoretical hydrographs, known as “design hydrographs”, play a crucial role. These represent theoretical flood wave profiles that depict the flow characteristics that can occur under specific conditions, at a chosen location, for a given maximum flow rate [16]. Design hydrographs are vital in water management because, in addition to conveying information about relevant flow rates, they provide additional details about the flood wave, such as its duration, time to reach the peak, and total volume. With this information, transformations of the flood into the watercourse or through a retention reservoir can be implemented. The methods for determining the shape of theoretical hydrographs can be categorized as those applied in controlled and uncontrolled watersheds. In controlled watersheds, they are typically determined based an average determined from several observed hydrographs [17]. In the case of uncontrolled watersheds, design hydrographs are usually established using rainfall-runoff models. Constructing such models involves various steps, including determining the relevant rainfall magnitude, establishing the rainfall hyetograph, determining effective rainfall, transforming rainfall into runoff, and deriving the total runoff hydrograph.
In hydrological practice, various techniques supporting hydrological modeling are used, in light of the sustainable development of urban areas. The fusion of deep learning techniques with gradient boosting in rainfall-runoff simulations presents a promising strategy [18]. Utilizing data-driven techniques such as airborne laser scanning (ALS), a Digital Surface Model (DSM), and a Digital Terrain Model (DTM) in urban areas [19], along with defined mathematical equations for risk assessments, significantly contributes to ensuring city sustainability. Numerical modeling, including two-dimensional (2-D) depth-averaged shallow-water models, is essential for accurately predicting flash-flood propagation in urban areas following excessive rainfall events [20]. Addressing backwater effects and sudden flow regime changes through detailed river models further emphasizes the importance of employing 2-D models [21]. Integrating hydrological and flood models to estimate surface and peak flow rates from precipitation storm events, especially in areas with high annual precipitation levels, is indispensable. For instance, modeling water pollution emergencies in urban rivers using methods like the autoregressive integrated moving average (ARIMA) and the Coupled River Basin–Urban Hydrological Model (DRIVE-Urban) underscores the importance of integrated hydrological and hydraulic modeling [22,23]. Models such as the Catchment Modeling System and TuFlow, which combine a one-dimensional river flow with two-dimensional surface flow models, are instrumental in effectively delineating flood risks [24]. Furthermore, the deployment of hydrologic software such as a Hydrologic Engineering Center–Hydrological Model System (HEC-HMS) and hydraulic software like a Hydrologic Engineering Center–River Analysis System (HEC-RAS) is vital for effectively managing man-made drainage systems prone to damage during intense rainfall [25].
The input signal for rainfall-runoff models is the so-called design rainfall. Design rainfalls can be estimated using various theoretical probability distribution functions [26]. In many cases, statistical distributions for calculating design rainfall are chosen arbitrarily, and the resulting rainfall depths can vary significantly, even for the same return period. This is a significant practical problem when applying rainfall-runoff models because different magnitudes of design rainfall can significantly affect the shape of the design hydrograph.
Apart from the magnitude of the design rainfall, another key piece of information used in hydrological modeling is land cover and land use in the catchment. Such data can be obtained from various information sources, and they differ primarily in terms of resolution and processing methods. An essential aspect is accounting for the temporal variability of land cover and the systematic updating of the database. Information from high-resolution sources becomes outdated more quickly than data from lower-resolution databases. Therefore, more frequent updates are necessary [27].
Currently, there are many methods available for determining design rainfall depths and defining the land use structure of catchments. As a result, the shape of design hydrographs can differ even within the same watersheds, depending on the chosen calculation methodology. Therefore, the aim of this study was to determine the influence of selecting methods for estimating design rainfall and defining land use on the shape of design hydrographs in a selected urban catchment. In the presented research, the question of how design rainfall heights, obtained from various distributions, affect the characteristics of design hydrographs was addressed. Additionally, the possibility of using the Urban Atlas to determine the land use structure of the catchment was investigated. This database has not been previously utilized in similar hydrological analyses, which constitutes a novelty in the conducted research.

2. Materials and Methods
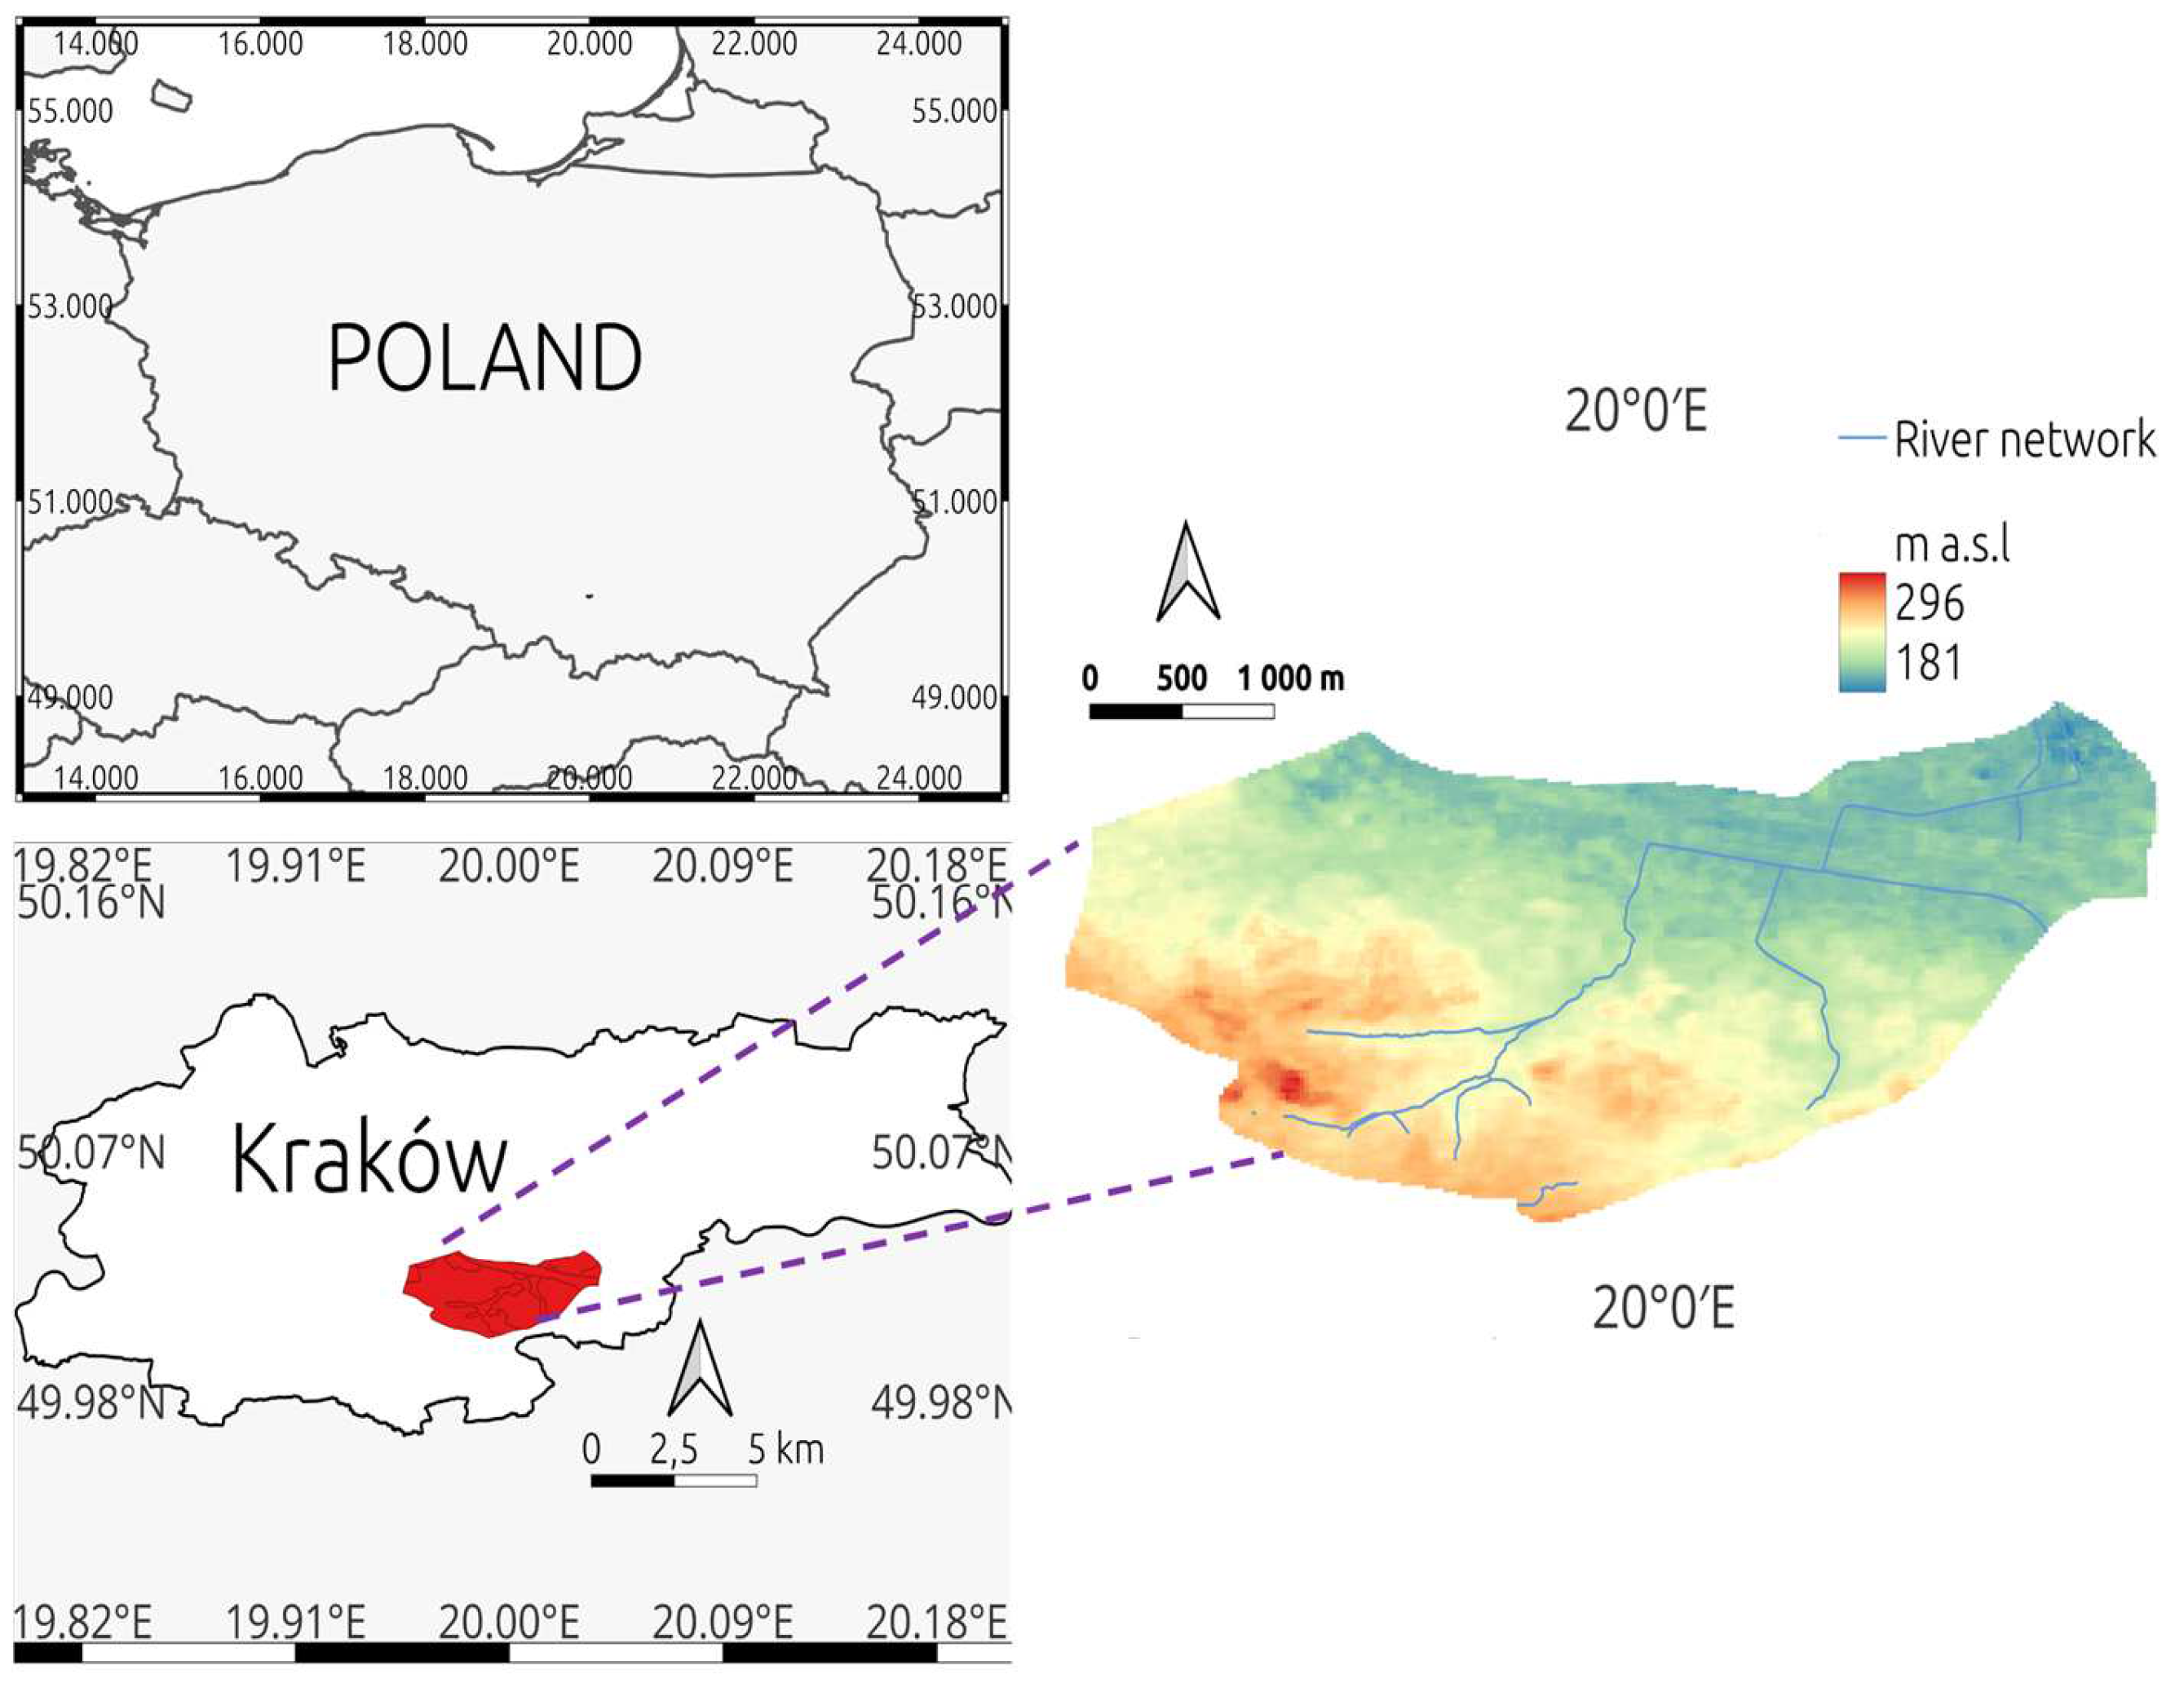
This study was conducted following these stages: determining design rainfall depths using selected probability distributions, analyzing land use and land cover within the catchment based on the Corine Land Cover and Urban Atlas databases, analyzing the depth of effective rainfall calculated from design rainfall and land use/land cover data, and analyzing the characteristics of design hydrographs concerning the method used for estimating design rainfall and the databases employed for land use and land cover delineation within the catchment.

2.1. Study Area

The research was conducted within the Drwinka River catchment. This catchment is located exclusively in the city of Kraków, Poland (Figure 1). The choice of the Driwnka catchment is justified for significant reasons. Firstly, the Driwnka catchment is characterized by high human pressure, mainly due to the intense urbanization of the area. This means that this area is particularly vulnerable to changes in the circulation of surface and groundwater, increasing the risk of urban floods. The strong sealing of the catchment leads to increased surface runoff and the reduced infiltration of water into the ground. Therefore, a sharp increase in flows is observed there after heavy rainfall events. Additionally, in recent years, Driwnka has experienced many urban floods, making it an area of particular importance for the analysis and understanding of mechanisms influencing this type of extreme events.
The catchment covers a total surface area of 13.57 km2. The primary stream within the catchment extends for 5.97 km and has a gradient of 9‰. There is an elevation difference of 115 m within the catchment, resulting in an overall gradient of 31‰. The Drwinka River catchment is classified as urban, with nearly 90% of the area being urbanized. The remaining portion consists of agricultural land and green areas. In the catchment, soils belonging to the hydrological soil group C predominate. They are characterized by below-average permeability, with infiltration coefficients ranging from 3.8 to 7.6 mm·h−1. These are primarily stratified soils with poorly permeable layers, clayey silts, shallow sandy clays, soils with low organic matter contents, and soils with high proportions of clay particles. The average annual precipitation in the catchment is 835 mm, with an average annual temperature of 9 °C.

2.2. Materials

The research was primarily based on time series data of maximum daily rainfall (Pmax) spanning the years 1981–2020. These data were obtained from the Institute of Meteorology and Water Management, National Research Institute in Warsaw. Spatial analyses were conducted using Geographic Information System (GIS) techniques, relying on a hydrographic division map of Poland. The soil substrate characteristics were determined based on a hydrological soil classification map. Land use and land cover within the catchment were defined using the Corine Land Cover (CLC) and Urban Atlas (UA) databases. The research was carried out in the following stages: determination of design rainfall levels, analysis of land use changes, calculation of effective rainfall, and the estimation of design hydrographs.

2.3. Determination of Design Rainfall

The basis for determining design rainfall levels was a time series of the maximum annual daily rainfall for the Drwinka catchment, covering the period from 1980 to 2020. The data underwent an initial analysis, which included calculating descriptive statistics. Subsequently, a trend verification was carried out using a modified Mann–Kendall test (MMK). The analysis was conducted at a significance level of α = 0.05. The statistic S of the MMK test is described by the following equation [28,29]:
S = k = 1 n 1 j = k + 1 n sgn ( x j x k )
sgn x j x k =     1   f o r x j x k > 0     0   f o r x j x k = 0 1   f o r x j x k < 0
where:
n is the number of elements in the time series.
The normalized statistic Z was calculated according to the equation:
Z = S sgn ( S ) Var ( S ) 1 / 2
where:
Var(S) is the variance of S, determined from the equation:
Var ( S ) = 1 18 · ( n · ( n 1 ) · ( 2 · n + 5 ) )
The main assumption of the MMK test being used is the absence of autocorrelation in the data series. In the case of analyzing the maximum annual daily rainfall, such dependencies can occur, leading to an underestimation of the variance value Var(S). Therefore, a correction for variance, calculated only for data with significant partial autocorrelation, has been taken into account:
Var × ( S ) = Var ( S ) · n n s *
where:
n n s * is the effective number of observations, calculated as:
n n s * = 1 + 2 n ( n 1 ) ( n 2 ) · k = 1 n 1 ( n k ) ( n k 1 ) ( n k 2 ) ρ k
where k is lag and ρk is the value of the next significant autocorrelation coefficient.
After verifying the precipitation data, the design rainfall values (PT) were determined. The following probability distributions were utilized for this purpose: Pearson Type III (PIII), Weibull, logarithmic-normal, generalized extreme value (GEV), and Gumbel. The rainfall depths were determined according to the following relationships [30]:
Pearson’s type III distribution:
P T = ε + t ( λ ) α
Weilbull’s distribution:
P T = ε + 1 α · [ ln ( 1 p ) ] 1 / β
Log-normal distribution:
PT = ε + exp(μ + σ·up)
Generalized extreme value (GEV) distribution:
P T = ξ + ( α κ ) · [ 1 ( ln ( p ) ) ] κ   when κ   0 ξ α · l n ln p   when κ = 0
Gumbel’s distribution:
P T = μ 1 α · ln ( ln 1 1 p )
where:
ε—lower limit of the series;
κ, λ, β—shape parameters;
α—scale parameter;
ξ—location parameter;
μ, σ—parameters of log-normal and Gumbel’s distribution;
p—probability of exceedance;
up—quantile of p order.
The distribution parameters were estimated by means of the maximum likelihood method. The consistency of the theoretical distribution with the empirical distribution was verified with the Kolmogorov–Smirnov test [31]. For further analysis, design rainfall with a return period of 100 years was adopted. The assessment of the best-fitting distribution was conducted using the root mean square error (RMSE) criterion. The design rainfall distribution over time (rainfall hyetograph) was determined using the beta method. The procedure for calculating the design rainfall hyetograph using this method was described by Młyński [32].

2.4. Exploring Changes in Catchment Land Use

The data were collected for the years 2006 and 2018, and sourced from both the Corine Land Cover (CLC) and the Urban Atlas (UA) dataset. Urban Atlas focuses on urban areas with populations exceeding 100,000 residents across all European Union countries, and it was developed as part of the Copernicus program. The land cover classification in the CLC database encompasses all types of land cover present on the European continent. It serves as the sole periodically updated database that displays the entire country and adheres to standardized principles. Vector layers were converted to match the boundaries of the Drwinka River catchment, followed by land area computations and visualizations using QGIS-“Firenze” software version 3.21.

2.5. Determining the Amount of Effective Precipitation

Effective rainfall (Pnet) was determined using the SCS-CN method. In this method, the rainfall depth is dependent on the infiltration capacity of the soil substrate, land use within the catchment, and the moisture conditions in the catchment. The infiltration capacity of soils is determined based on the hydrological soil classification, assigning them to groups A, B, C, or D. The moisture conditions in the catchment are described using the AMC parameter and can assume three states: dry (AMC I), moderate (AMC II), and wet (AMC III). The depth of effective rainfall is determined according to the following relationships [32,33]:
P net = ( P 0.2 S ) 2 P + 0.8 S   when   P 0.2 S 0   when   P < 0.2 S
where:
Pnet—effective rainfall depth (mm);
P—total rainfall depth [mm];
S—maximum potential retention of the catchment (mm).
The maximum potential retention of the catchment, S, is directly related to the CN parameter. The value of retention S is determined according to the following relationship:
S = 25.4 ( 1000 CN 10 )
The depth of effective rainfall was calculated for rainfall events with return periods of 1000, 100, 50, 20, and 10 years. The key parameter for determining the effective rainfall depth is the CN (Curve Number) parameter, which describes the retention capabilities of watersheds. This parameter depends on several factors such as initial soil moisture, soil type, and land use in the catchment. CN parameter values range from 0 to 100, where higher values indicate limited retention capabilities of the catchment and favorable conditions for surface runoff formation. The unit values of the CN parameter were determined based on Maidment’s work [34]. Since the analyzed catchment exhibits diverse land use, the CN parameter value for this catchment was determined as a weighted average, as described in Tailor and Shrimali’s work [35].
CN w = C N i · A i A
where:
CNw—weighted curve number (-);
CNi—curve number for particular land use (-);
Ai—area with curve number CNi (km2);
A—catchment area (km2).

2.6. Determining the Course of Design Hydrographs

The design hydrographs were determined using the Nash model. In the Nash model, the catchment is conceptualized as a cascade of N linear reservoirs, each with its retention parameter, k. The Nash model relies on the concept of the instantaneous unit hydrograph (IUH), which represents the catchment’s response to the instantaneous net rainfall. The IUH is characterized by a two-parameter gamma function, as described by [36]:
u ( t ) = 1 k · Γ ( N ) · ( t k ) N 1 e x p ( t k )
where:
u(t)—ordinates of IUH (h−1);
t—time from the beginning of coordinate system (h);
N—number of linear reservoirs (-);
k—retention parameter of each reservoir (h);
Γ(N)—gamma function (-).
The characteristic values of an IUH hydrograph are the peak (up), time to peak (tp), and lag-time (LAG). The characteristics are connected with model parameters N and k as:
tp = (N − 1)·k
LAG = (N − 1)·k
u p = 1 k · Γ ( N ) · ( N 1 ) exp ( N 1 ) N 1
where:
  • N is the number of linear reservoirs (–);
  • k is the retention parameter of each reservoir (h).
In this study, design hydrographs were determined based on the specified theoretical probability distributions for design rainfall. Effective rainfall depths were calculated using the design rainfall data and land use information from CLC and UA databases. After obtaining the design hydrographs, their characteristics were determined, including maximum flows, volumes, and time to peak. Subsequently, a comparison was made between these characteristics, considering the method of estimating design rainfall and the database used to define land use within the catchment.

3. Results and Discussion

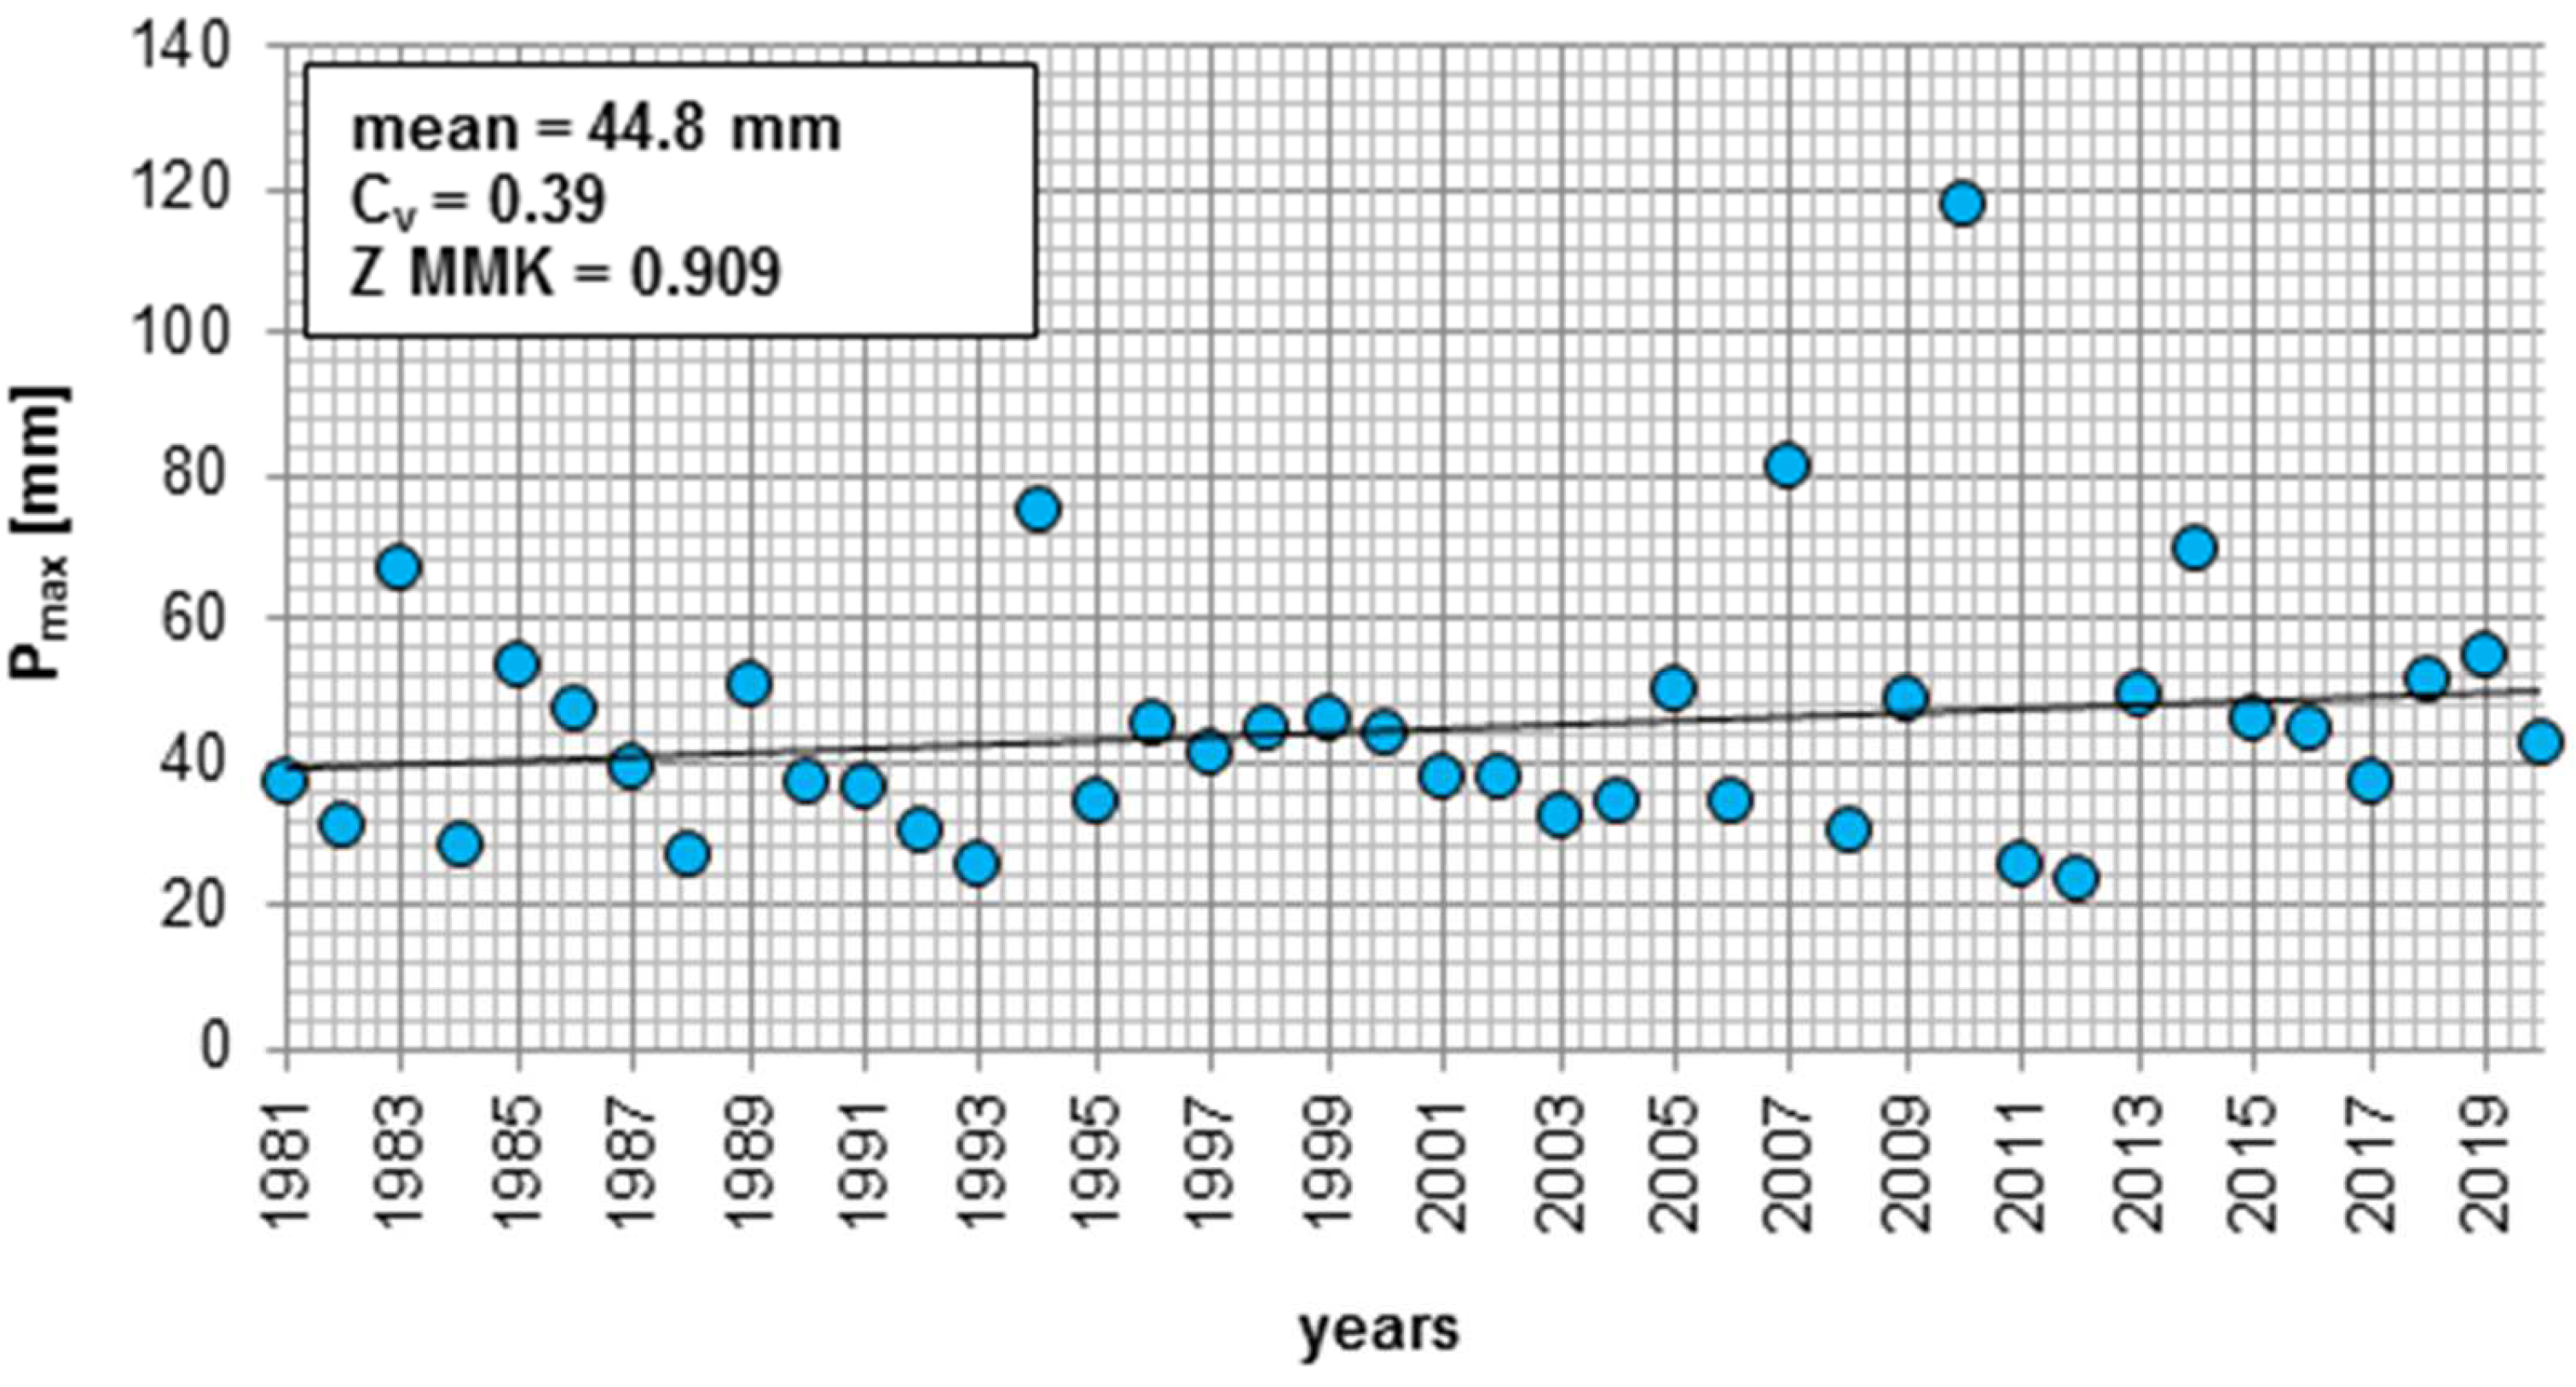
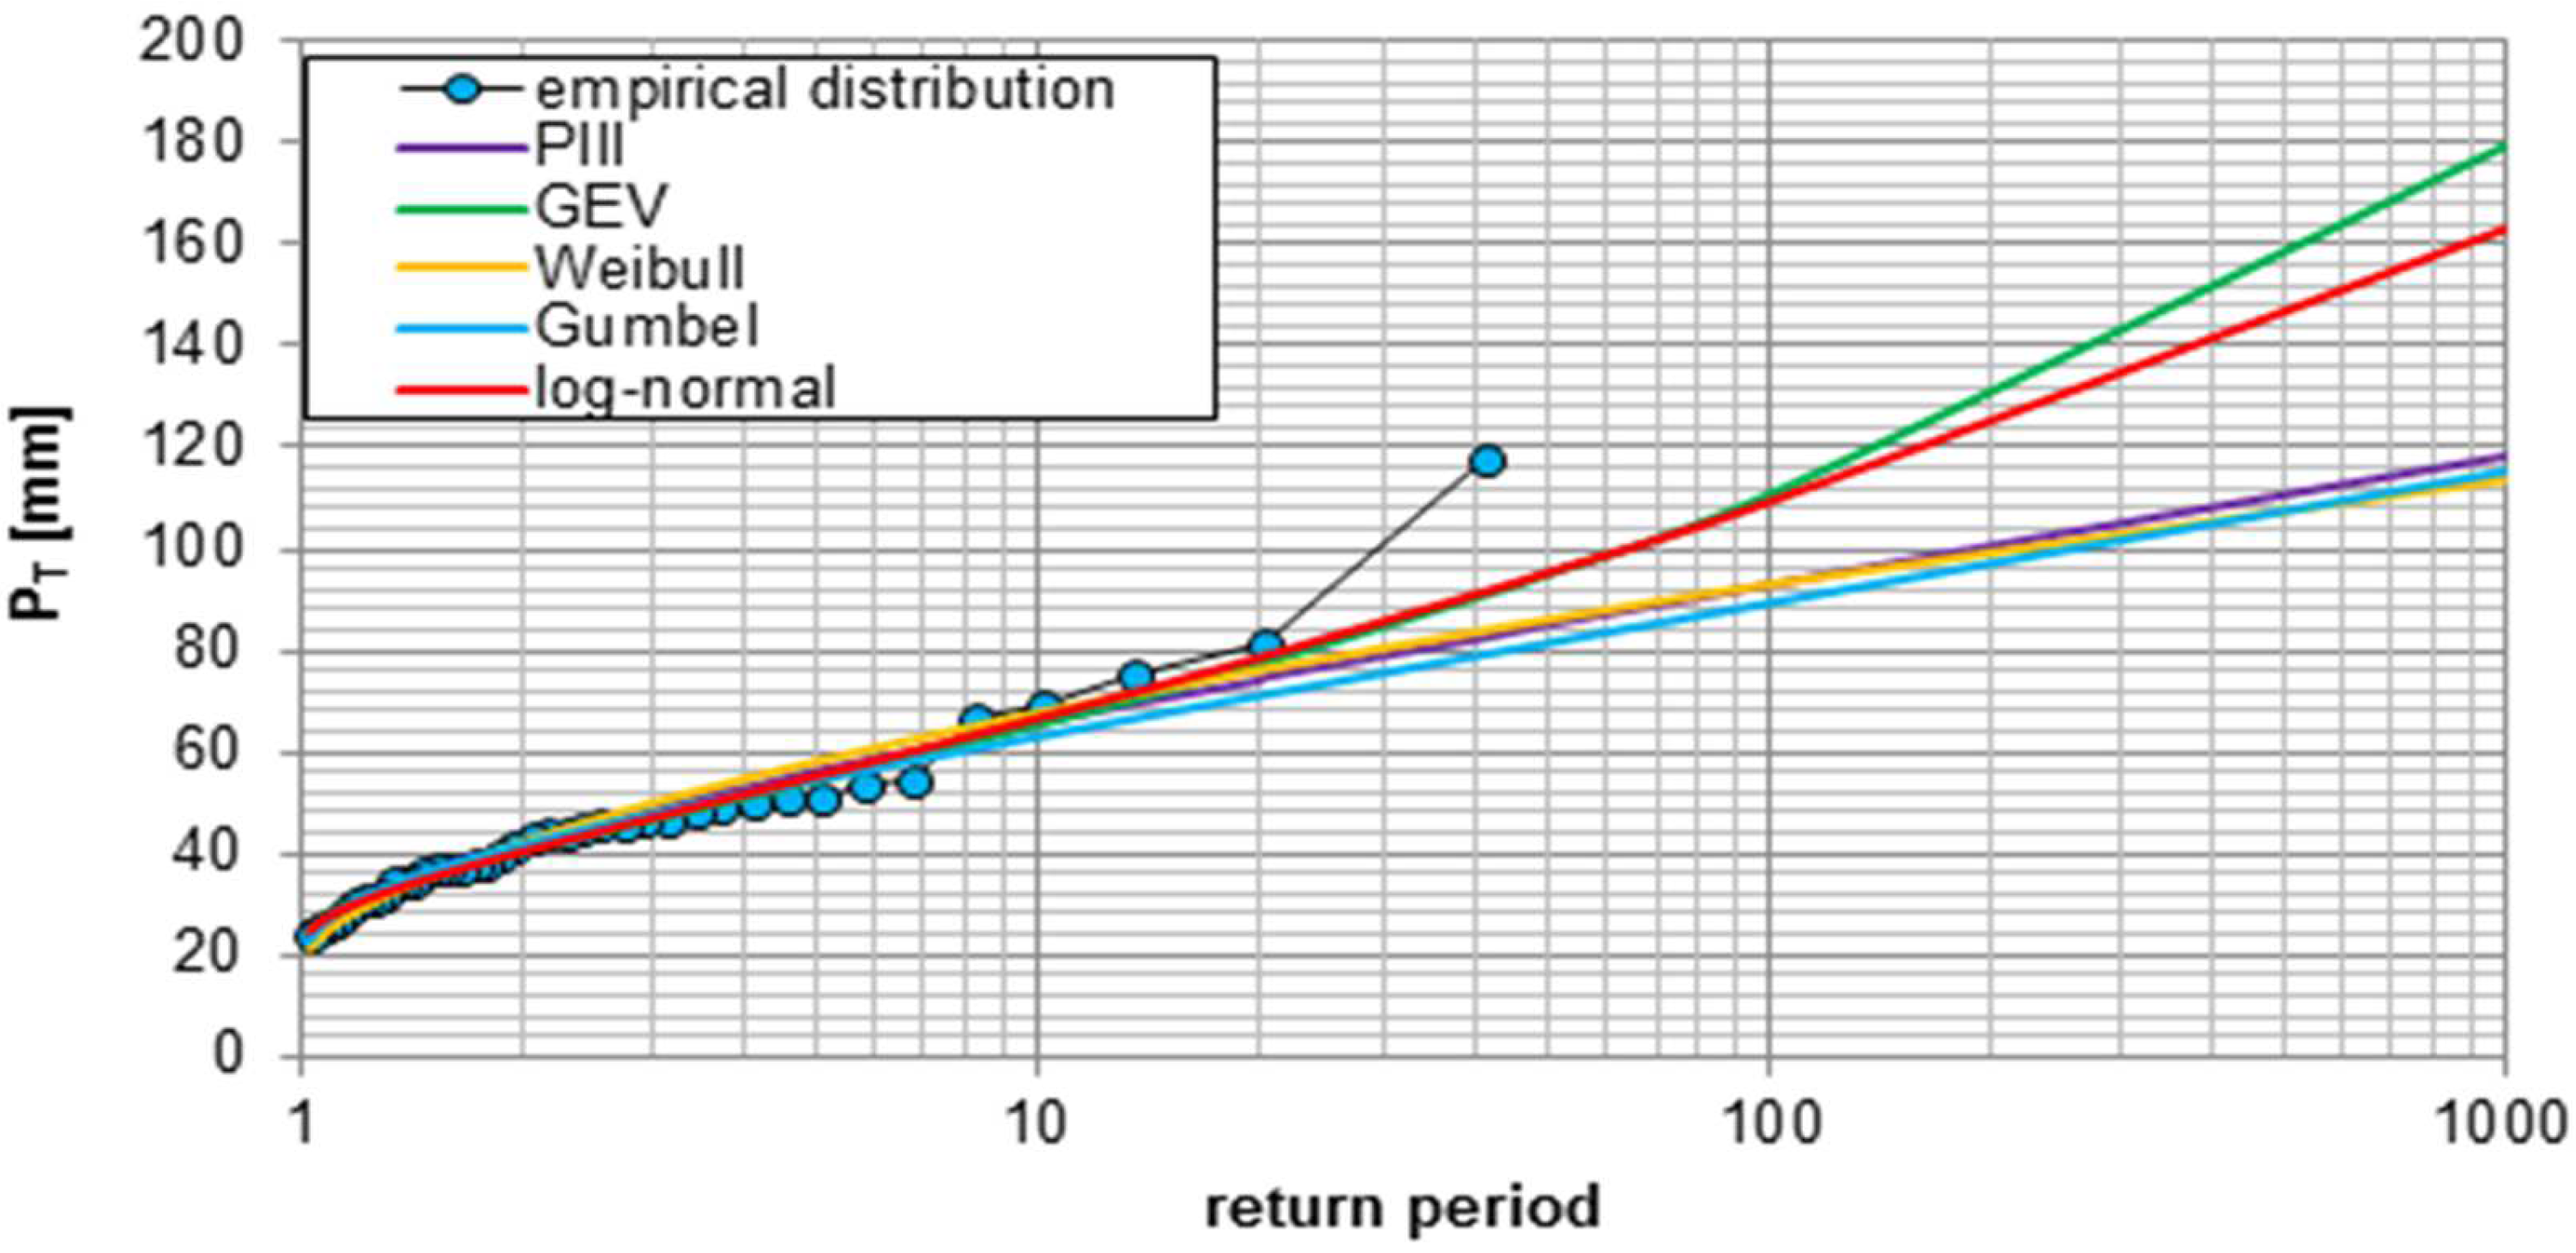
3.1. Design Rainfall Analysis

Design rainfall was determined based on a time series of the maximum annual daily rainfall for the period 1981–2020. Descriptive statistics were computed for the analyzed data series, and its verification was conducted using the Mann–Kendall test (MMK). The results of this analysis are presented in Figure 2. The Pmax is the annual daily maximum precipitation, Cv is the coefficient of variation, and Z MMK is the statistic of the modified Mann–Kendall test.
Based on the values presented in Figure 3, it was observed that the lowest Pmax rainfall occurred in 2012, while the highest was in 2010. The maximum value was almost five times higher than the minimum. The average Pmax rainfall for the period 1981–2020 was just under 45 mm. Research conducted by Jarosińska and Bodziony [37] indicated that the average annual rainfall for the city of Krakow, determined based on a time series from the period 1951–2018, was 684 mm. Therefore, the Pmax rainfall values represented 3% to 17% of the annual rainfall, with the average Pmax value corresponding to 7% of the annual rainfall in Krakow. These results may indicate a rapid onset of the analyzed events. This is due to the location of the catchment, which is situated in the southern region of Poland characterized by complex physiographic and meteorological conditions. Mountain ranges in the area intensify rainfall. Additionally, the region frequently experiences the convergence of different types of atmospheric precipitation, leading to extremely intense and high-impact episodes resulting in catastrophic floods and landslides [38].
Analyzing the coefficient of variation (Cv), it was noted that its value was less than 40%. This indicates moderate variability in the Pmax rainfall values during the study period. The Z-statistic from the Mann–Kendall test was lower than the critical value, which is 1.96 for a significance level of α = 0.05. Therefore, it was concluded that there was no significant trend in the analyzed time series. In general, the verification of the rainfall trend plays a significant role in hydrograph modeling. The trend in rainfall data can influence the hydrological characteristics of watersheds. If the trend is not accounted for, modeling results may be biased. Additionally, the rainfall trend can affect flood risk. Increasing the rainfall intensity can lead to a higher frequency and intensity of floods. This is confirmed by research findings conducted by Wasko and Nathan [39], who demonstrated that such a relationship, especially in the case of flash floods, is characteristic of urbanized areas. The verification of the rainfall trend allows for a better understanding of changes in flood risk. Moreover, hydrological forecasts are used in the design of water infrastructure. The trend in rainfall significantly impacts the required capacities and performances of these structures. The verification of the rainfall trend enables the proper scaling of water infrastructure, thereby minimizing flood risk The obtained coefficient of variation values and the lack of a significant trend align with the research conducted by Młyński et al. [40]. Their analysis showed that the southern region of Poland exhibits moderate variability in maximum rainfall. Moreover, long-term trends in maximum rainfall are typically not observed here, only localized fluctuations driven by local meteorological conditions. Based on the Pmax rainfall data series, design rainfall values (PT) were determined using the following probability distributions: Pearson Type III, GEV, Weibull, Gumbel, and log-normal. The results of this analysis are presented in Figure 3.
The analyzed probability distributions find widespread application in estimating design rainfall values. Through the calculations, significant discrepancies were evident in the design rainfall values for a return period of 100 years. Specifically, these values were 110.9, 93.2, 93.1, 89.4, and 109.4, corresponding to the GEV, PIII, Weibull, Gumbel, and log-normal distributions, respectively. This resulted in a 15% difference between the lowest value (Gumbel) and the highest value (GEV). To determine the best-fitting theoretical distribution to the empirical distribution of random variables, the RMSE criterion was employed. The results are presented in Table 1.
Upon analyzing the RMSE criterion values, it was determined that the log-normal distribution is the best-fitting distribution for calculating design rainfall. Conversely, the Gumbel distribution exhibits the weakest fit. Consequently, the log-normal distribution, as the best-fitting one, was employed for further analyses aimed at assessing the impact of the land use database selection on the determination of design hydrograph shapes. In the modeling of rainfall-runoff processes, it is common to assume that the return period for rainfall matches that for the peak runoff. The critical challenge lies in defining the best distributions for calculating design rainfall (PT), as meteorological data often support hypotheses that their empirical distributions align with one theoretical distribution rather than multiple. This presents a significant issue for designers, as these rainfall inputs serve as the foundational signal for rainfall-runoff models. Utilizing rainfall from different distributions can lead to varying values of design hydrograph characteristics, even within the same catchment. Studies on the multi-distribution nature of design rainfall have been conducted, including research by Moccia et al. [41]. These studies have demonstrated that typically, the best-fitting distributions for estimating characteristics are right-skewed, heavy-tailed distributions, such as GEV or log-normal.

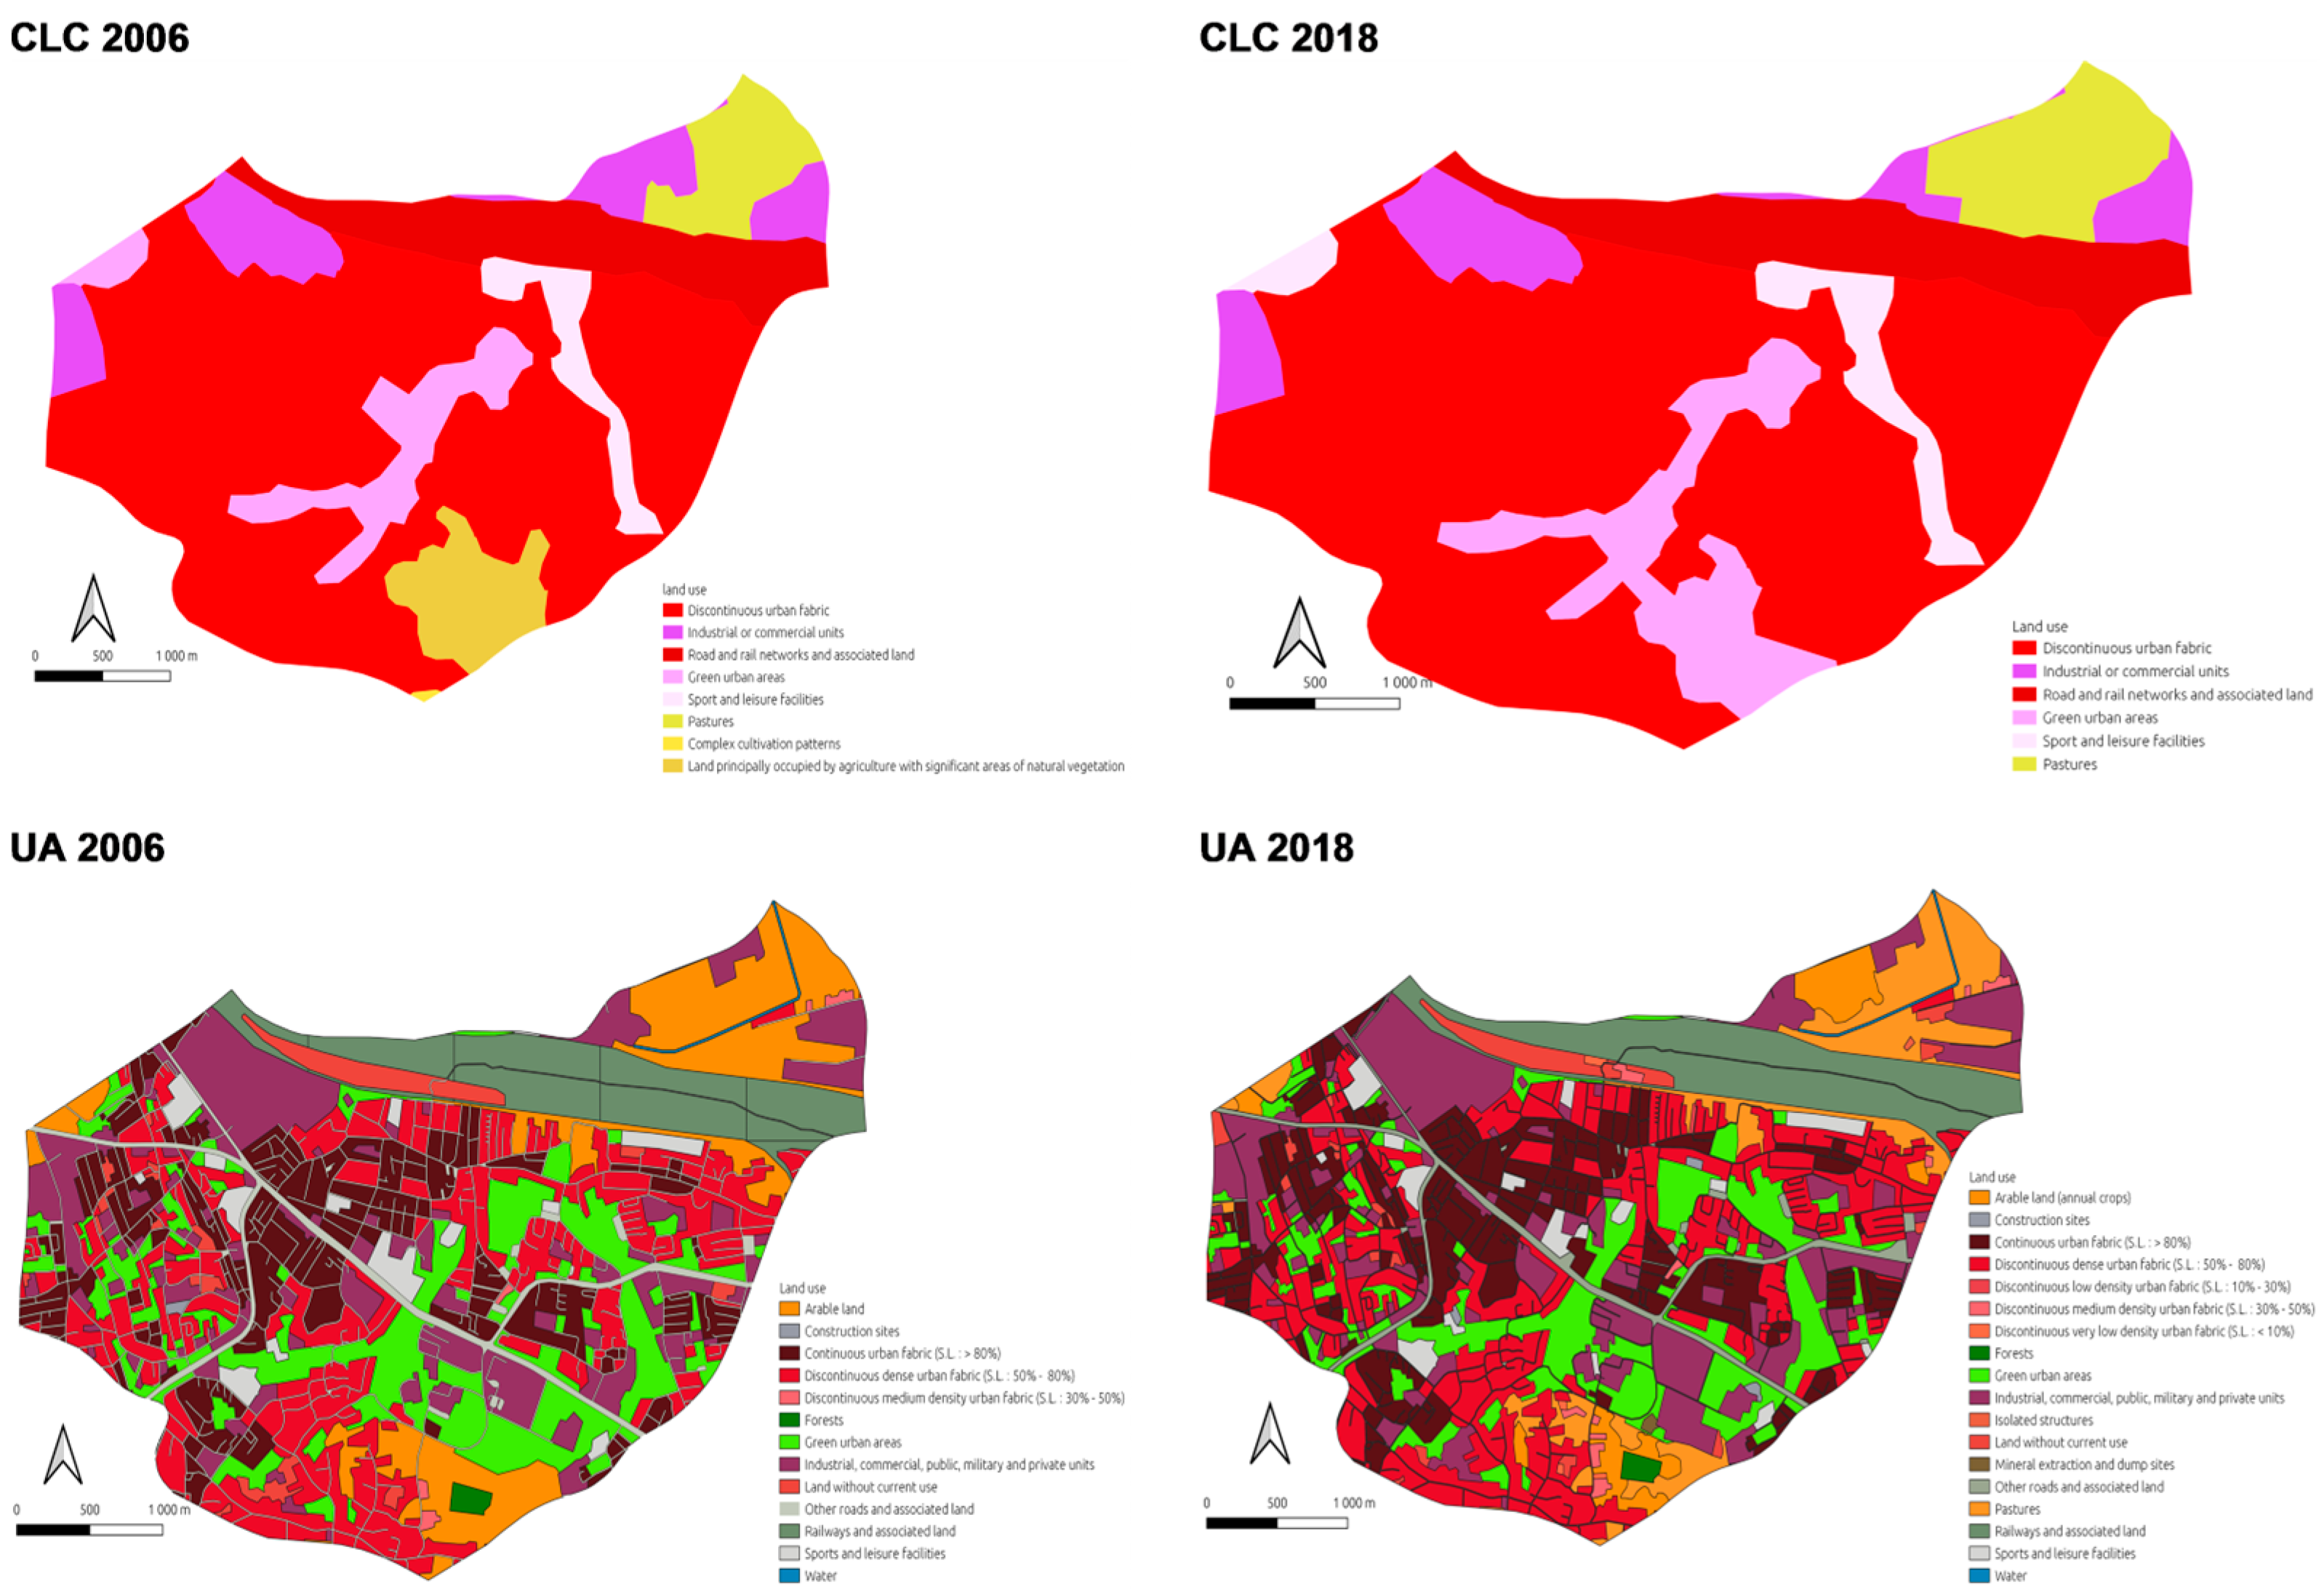
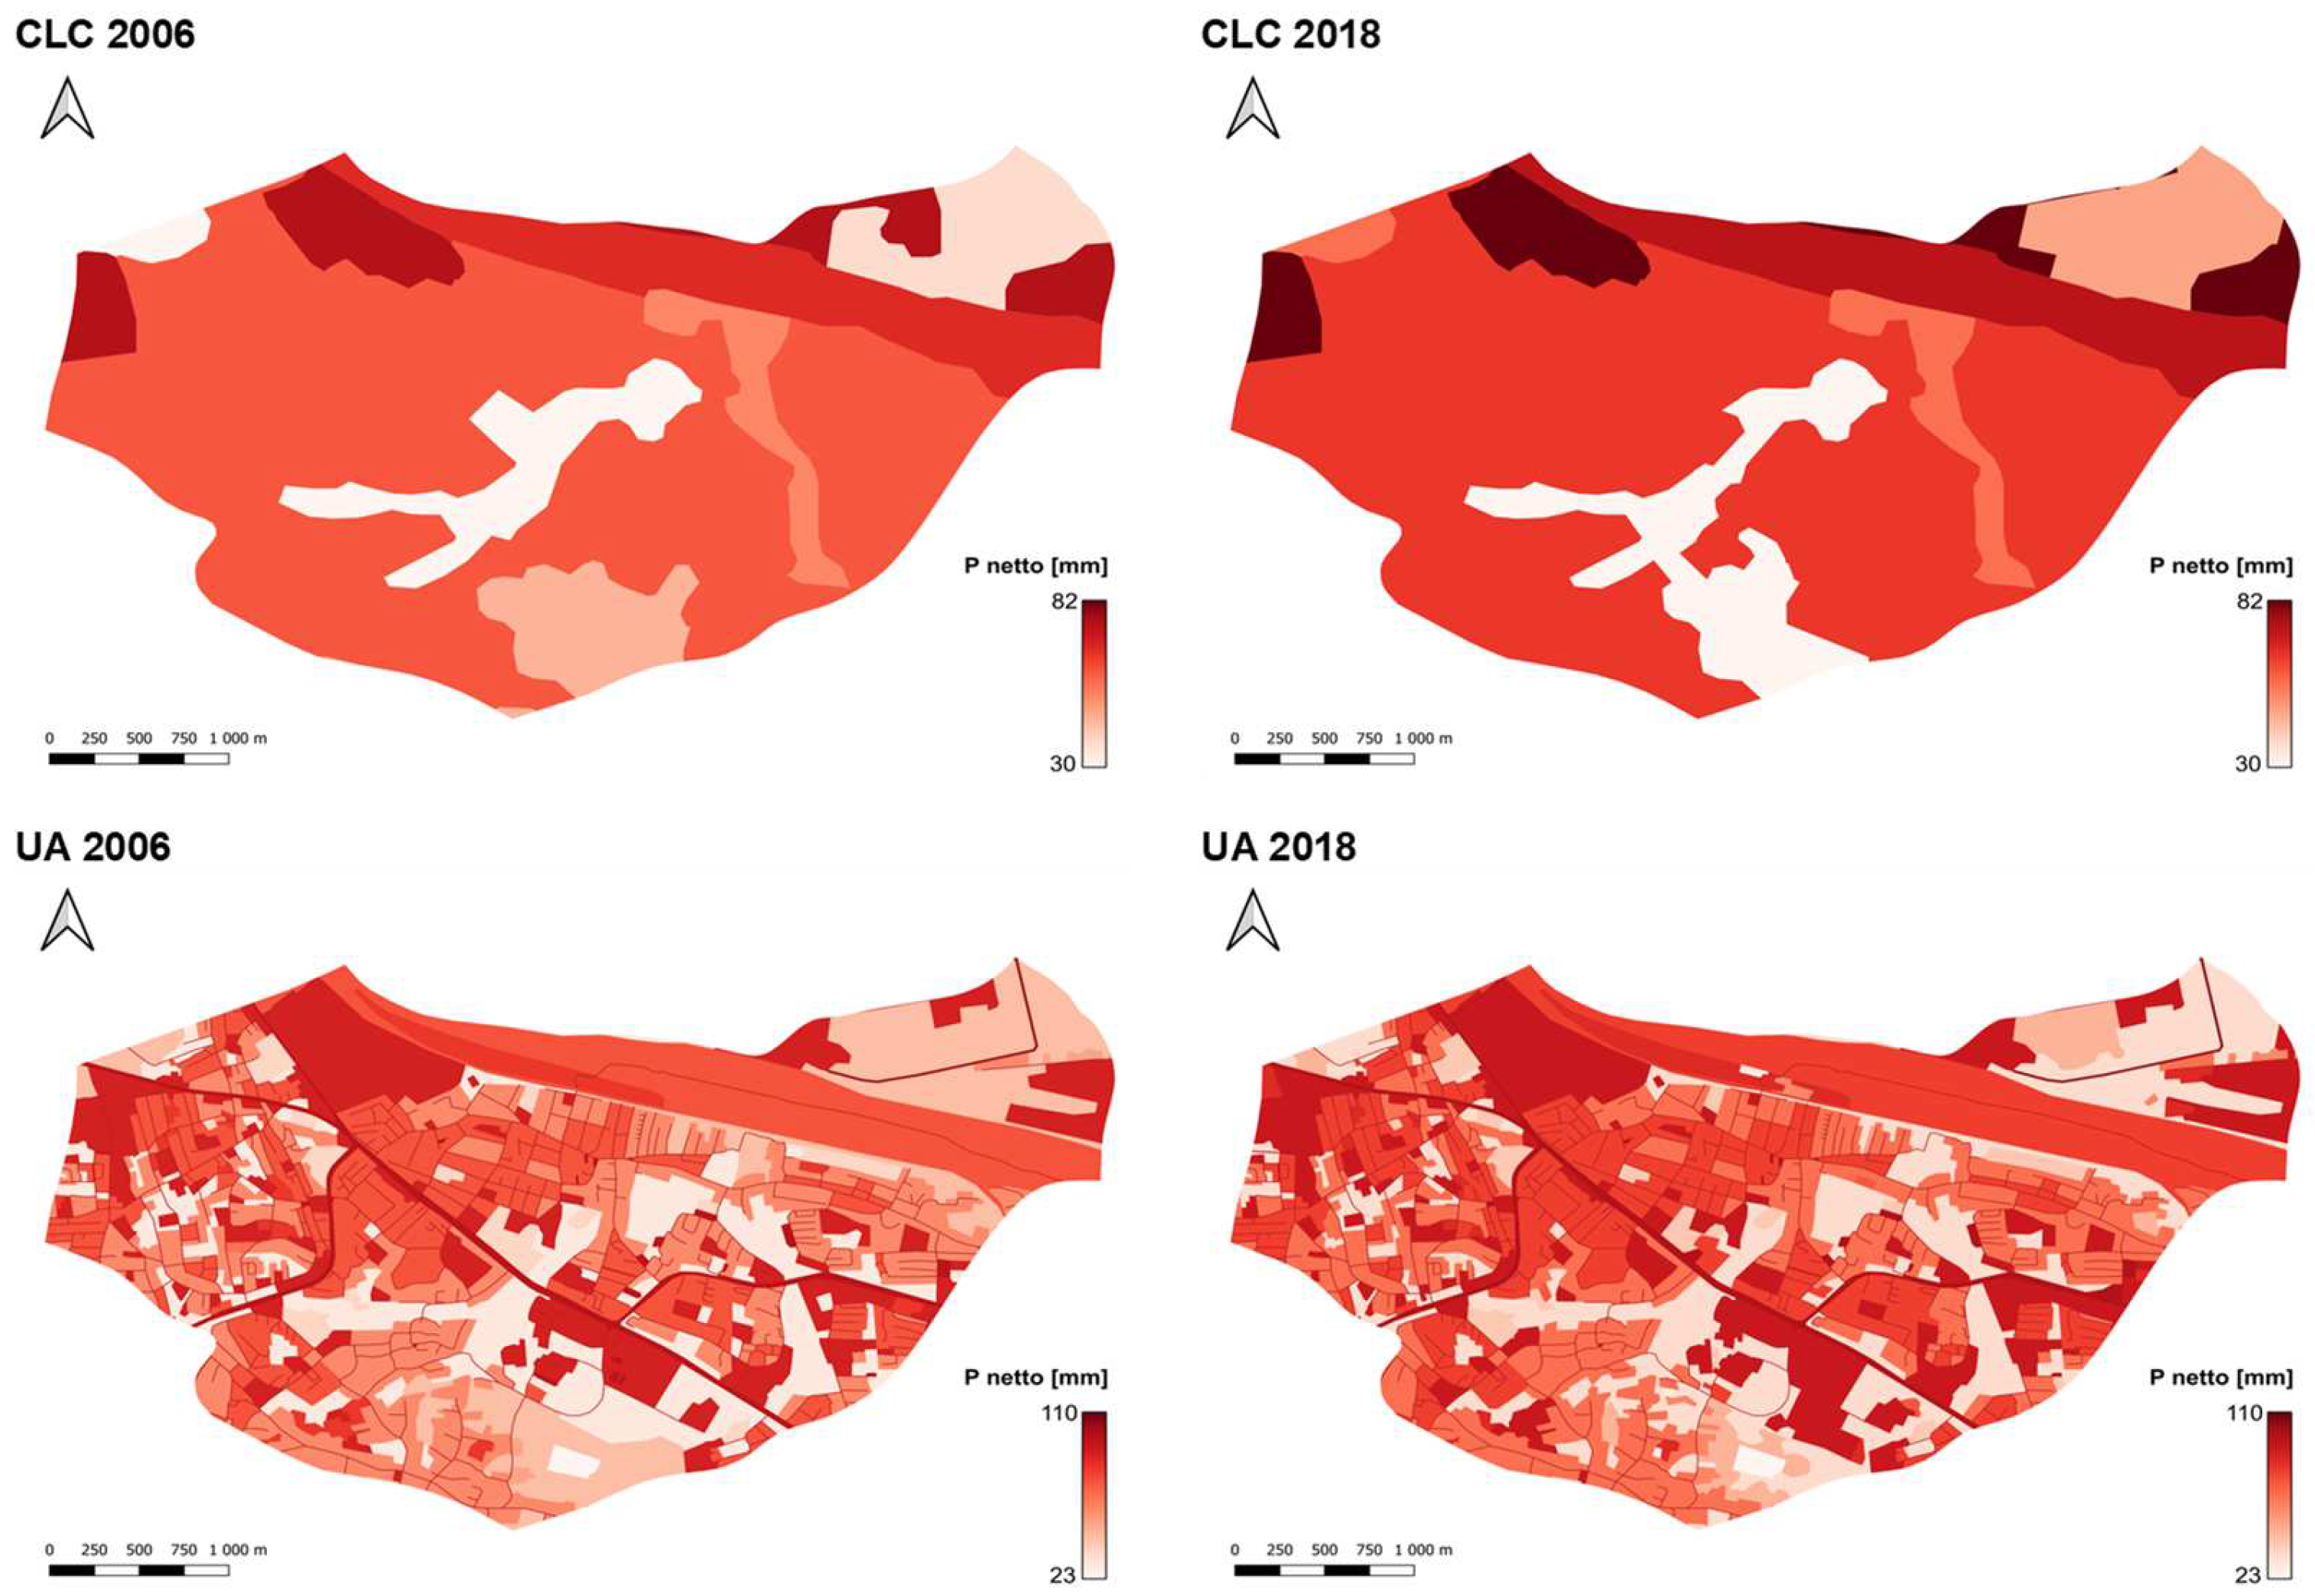
3.2. Analysis of the Catchment’s Land Use

In the subsequent phase of the study, a comparison was made between the land use structures within the catchment as represented by two databases: Corine Land Cover (CLC) and Urban Atlas (UA). The analysis was conducted using information gathered from the years 2006 and 2018. Figure 4 illustrates the spatial differentiation of various land use categories. Table 2 and Table 3 provide an overview of land use within the catchment for the years 2006 and 2018, based on the CLC and UA databases, respectively. Upon examining the values presented in Table 2 and Table 3, it is evident that the UA database provides significantly more detailed information regarding land use forms within the catchment. According to the UA database, the dominant land use category in the catchment is “Discontinuous dense urban fabric” (S.L.: 50–80%), which currently covers just under 22% of the total catchment area. Analyzing the changes in the land use structure between 2006 and 2018 revealed a reduction in the areas of land use categories such as agricultural land, semi-natural areas, wetlands, green urban areas, land without current use, and sports and leisure facilities. Conversely, an increase in the land area was observed for categories including continuous urban fabric (S.L.: >80%), discontinuous dense urban fabric (S.L.: 50–80%), discontinuous medium-density urban fabric (S.L.: 30–50%), discontinuous very-low-density urban fabric (S.L.: <10%), industrial, commercial, public, military, and private units, mineral extraction and dump sites, other roads and associated land, and pastures. The S.L. is the sealing layer [42]. The most substantial reduction in land area occurred in the categories of agricultural land, semi-natural areas, and wetlands, which accounted for 12% of the total catchment area in 2006, but dropped to just under 3% in 2018. The transformation of land use in the catchment area from 2006 to 2018 has revealed some remarkable trends, with pastures emerging as the most noteworthy addition. In 2006, pastures were entirely absent from the landscape, but by 2018, they had burgeoned to occupy a substantial 8% of the entire catchment area. This significant shift in land use is just one of the intriguing findings unearthed through a comprehensive analysis of the Corine Land Cover (CLC) database.
At the broadest level of land use categorization, as defined by CLC’s level 1 classification, we encounter two prominent categories: “artificial surfaces” and “agricultural areas”. What sets CLC apart from other databases, such as the Urban Atlas (UA), is its omission of a separate category for forests. Instead, it consolidates forested regions under various other land use designations, making the assessment of forested areas more intricate. Intriguingly, according to CLC’s data, the predominant form of land use in the region is categorized as “continuous urban fabric”. This label encompasses just under 63% of the entire catchment area. This finding underscores the pervasive and extensive urbanization that has taken place over the years, highlighting the transformation of the landscape into a seamless fabric of urban development. In summary, the expansion of pastures, the unique categorization approach of CLC, and the dominance of “continuous urban fabric” as the prevailing land use highlight the dynamic shifts and complexities in the land use patterns within the catchment area over the analyzed timeframe. When we delve into the changes in the land use patterns, a decrease in the land area has been noted in categories such as “industrial or commercial units”, “non-irrigated arable land”, and “complex cultivation patterns”. Conversely, there has been an expansion in land area for “continuous urban fabric”, “green urban areas”, “sports and leisure facilities”, and “pastures”. However, it is crucial to recognize that these disparities exhibit the same dynamism as observed in the UA database. According to the CLC database, the most notable decline has taken place in the category of “non-irrigated arable land”, which accounted for nearly 5% of the catchment area in 2006, but is no longer discernible in the 2018 dataset. Conversely, the most substantial expansion has occurred in “green urban areas”, with a land area increase of nearly 3% in 2018 compared to 2006.
As the catchment contains only soils with above-average permeability, categorized as group B according to the hydrological soil classification, the only differentiating factor for the CN parameter in calculating the effective rainfall depth is the area covered by various land uses. Table 4 presents the average CN parameter values determined for the years 2006 and 2018 based on the analyzed land use databases within the catchment.
The examination of the CN parameter values, as outlined in Table 4, reveals a noteworthy contrast when computed based on the CLC database versus the UA database. It is essential to highlight that the CN value is significantly higher when derived from the UA database for the year 2018. In contrast, the CN parameter exhibits consistency when calculated using the CLC database. This variation can be attributed to the diminished precision of the CLC database relative to the UA database, which manifests in the extent of alterations observed across diverse land use categories within the Drwinka catchment. In a broader contextual perspective, an overarching trend emerges when scrutinizing shifts in land utilization within the catchment between the years 2006 and 2018. This overarching trend underscores the escalating urbanization of the catchment alongside a concurrent reduction in agricultural land. These findings validate the outcomes of investigations conducted by Cegielska et al. [43], who identified a pronounced and statistically significant trend prevailing in the southern regions of Poland characterized by the gradual contraction of agricultural territories in favor of burgeoning urbanized zones. This trend is chiefly propelled by socio-economic transformations and novel economic paradigms ushered in by the political metamorphosis that took place in Poland post-1989. Additionally, the expansive development of transportation networks, exemplified by the proliferation of high-speed road infrastructure, has played a pivotal role in catalyzing urbanization. It is noteworthy that the number of such high-speed roads in Poland doubled between 2011 and 2016, resulting in the concomitant disappearance of extensive swathes of agricultural and forested landscapes [44].
It is imperative to underscore that the burgeoning urbanized areas exert a substantial influence on the sphere of water resources and water management [45]. Extensive research conducted by Wojkowski et al. [46] serves to underscore that the trajectory of urbanization continues its inexorable ascent in the southern regions of Poland, even as agricultural expanses dwindle. These transformative changes have a direct bearing on the creation of what is termed the “hydrological potential” of these watersheds. However, it is pivotal to note that such changes occur at a gradual pace and do not necessarily herald alterations to the hydrological regimes of rivers. Conversely, empirical investigations conducted by Lepeška et al. [29] cogently illustrate that the ongoing process of urbanization invariably leads to the outflow of water at diverse levels within watersheds. While some of these effluxes may be comparatively minor, others can exert a pronounced and far-reaching impact on the overall catchment, including precipitating episodes of soil drought, primarily as a result of the erosion of the infiltration capacity.

3.3. The Impact of the Selected Method for Estimating Design Rainfall on the Course of Design Hydrographs

Subsequently, this study has delved into analyzing the impact of selecting different methods for estimating design rainfall on the configuration of design hydrograph characteristics. The effective rainfall depth was computed using the SCS-CN method, with the CN parameter values derived from the detailed land use representation provided by the UA 2018 dataset. The design hydrograph profiles were established utilizing the Nash model. Figure 5 visually depicts the design hydrograph profiles, offering insights into their temporal dynamics. Table 5 provides a comprehensive compilation of key characteristics associated with these design hydrographs, facilitating a quantitative assessment of their properties. Figure 5 further elucidates the intricate interplay between the magnitude of design rainfall and the ensuing characteristics of flood waves. This graphical representation underscores the correlation between the design rainfall depth and the corresponding attributes of flood hydrographs, offering valuable insights into the hydrological response of the Drwinka catchment under varying precipitation scenarios.
The presented results reveal the lowest values of flood volumes (V) and peak flows (Qmax) when employing the Gumbel distribution for the design rainfall estimation, while the highest values are obtained with the Generalized Extreme Value (GEV) distribution. These findings correspond to the design rainfall depth (P) selected for each distribution. Specifically, the difference between the flood volumes and peak flows computed using the GEV and Gumbel distributions amounted to 237,268 m3 and 7745 m3·s−1, respectively. These results underscore the impact of a 1 mm increase in design rainfall, leading to a 0.363 m3·s−1 rise in the peak flow and an increment of over 11,000 m3 in the flood volume. This highlights that the choice of the design rainfall distribution can significantly influence the characteristics of design hydrographs generated by the Nash model in urbanized watersheds. It is crucial to emphasize that the selection of a suitable model for computing design hydrographs is a pertinent issue for engineering applications. Models used in urbanized watersheds should ideally require minimal input data and parameters, contingent upon data availability. The Nash model fulfills this criterion, making it a suitable choice for ungauged watersheds as well. The studies conducted by Barszcz [47] have indicated an average relative error of approximately −10% for flow predictions made by the Nash model in small urbanized watersheds, further endorsing its applicability in ungauged watersheds.
Statistical methods are commonly employed tools for estimating design rainfall. These methods, above all, consider the intricate and variable nature of rainfall patterns in a given region, making it possible to account for precipitation patterns that occur in various regions or seasons. This has been substantiated by the analyses conducted by Yonus et al. [48] and Lavanya et al. [49]. Furthermore, these methods incorporate the local climatic conditions and physiographic characteristics of the areas for which design rainfall is calculated. An example of such consideration can be found in the analyses by Villarini et al. [50], which demonstrated significant relationships between the parameters of the investigated rainfall distributions and the elevation of meteorological stations, which serve as data sources. Moreover, many hydroengineering standards and guidelines are based on statistical distributions. This is particularly crucial in the context of urbanized watersheds, where the sizing of various engineering solutions relies on these methods. Differences stemming from the selection of a specific method for estimating design rainfall can be substantial, ranging from 10% for a 10-year return period to as much as 50% for longer return periods [51]. Thus, the choice of the method for determining design rainfall plays a pivotal role in engineering hydrology.

3.4. The Impact of Land Use Database Selection on Design Hydrographs

In the subsequent phase of the research, an analysis was conducted to examine the impact of selecting the land use database on the shaping of runoff hydrographs. The design rainfall depth was assumed to follow a log-normal distribution, which was the best fit according to the RMSE criterion. Figure 6 illustrates the distribution of effective rainfall depths determined using the SCS-CN method, contingent upon the chosen land use database.
Analyzing the results presented in Figure 6, it is evident that the UA database exhibits significantly greater variability in the distribution of effective rainfall within the catchment. This variability is attributed to the higher level of detail in representing land use. In contrast, the CLC database shows a more aggregated pattern of effective rainfall depths. The depths range from just under 31 mm for green urban areas to nearly 82 mm for industrial or commercial units. The weighted average effective rainfall depth for the years 2006 and 2018 in the CLC dataset was almost 70 mm. Conversely, the UA dataset displays a greater range of effective rainfall depths, ranging from 23 mm for forests to almost 110 mm for water. Given the small difference in CN values between UA and CLC (0.3), the weighted average effective rainfall depth remains at a similar level for both datasets, approximately 54 mm for the analyzed years. These findings highlight that the average effective rainfall depth for CLC is 30% lower than that for UA. These differences stem from the spatial data generalization performed by CLC. The studies conducted by Wałęga and Salata [52] emphasized the need for caution when using the CLC database to estimate the effective rainfall depth, as utilizing this database carries the risk of excessive data generalization. As the research area decreases in size, differences may become more pronounced. Therefore, researchers, planners, and decision makers should exercise caution when using this source, particularly for local-scale considerations. Figure 7 presents the hydrograph profiles for individual years alongside the determined effective rainfall depths, while Table 6 compiles the characteristics of the design hydrographs.
The results presented in Figure 7 and Table 6 clearly indicate differences in the characteristics of the design hydrographs depending on the chosen land use databases. Moreover, differences can also be observed between the years 2006 and 2018 within the same land use databases. When analyzing the CLC data, it is evident that despite having the same effective rainfall depths for 2006 and 2018, there is a difference in Qmax of 0.046 m3·s−1. This discrepancy arises from one of the Nash model parameters for modeling runoff from urbanized watersheds: the catchment’s degree of sealing. For the CLC database, this parameter was determined to be 79% and 81% for the years 2006 and 2018, respectively. The degree of sealing influences the shape of the hydrograph’s peak. Since the flood volume is determined by the effective rainfall depth, which remained the same for 2006 and 2018 according to the CLC data, the flood volume does not change. Analyzing the characteristics for the UA database reveals more significant differences. For the peak flow (Qmax), it was 0.427 m3·s−1, and for the flood volume (V), it was 10,184 m3. These differences are due to variations in the degree of the sealing of the catchment, which were 59% and 63% for 2006 and 2018, respectively, as well as differences in the effective rainfall depth. These results highlight a general trend of an increased peak flow and design hydrograph volume attributed to catchment sealing. Urbanization leads to a higher proportion of impermeable surfaces, significantly shortening the catchment’s response time to rainfall and thereby increasing the flood risk. The studies conducted by Feng et al. [25] have clearly demonstrated that increasing human pressure results in a higher surface runoff intensity and shortened time to peak flow attainment. Additionally, it was emphasized that, apart from the percentage of urbanized areas within the catchment, the spatial distribution of urban areas also significantly affects flood characteristics. One limitation of the CLC database is that it provides information solely on land use types, but does not include details on the distribution of built-up areas [53]. Research by Zimmermann et al. [54] has shown that future flood risk may increase by up to fourfold, depending on the assumed scenarios of human pressure. Therefore, it is essential to incorporate elements of green infrastructure, such as green roofs, parks, and urban greenery, into future urban planning. Examining the differences between the land use databases, it is clear that significant disparities exist for peak flows (Qmax) and hydrograph volumes (V) for the years 2006 and 2018. The characteristics’ values are notably higher for CLC than for UA. In the case of 2006, the peak flows (Qmax) and volumes (V) for CLC were 20% and 23% higher, respectively, than the values for UA. For the year 2018, these disparities were 21% and 19% for Qmax and V, respectively. These results emphasize that the choice of land use database can significantly impact the quality of the results obtained from rainfall-runoff models. The reason for these disparities lies in the level of detail in representing land use within the catchment. In the case of the UA database, it was represented with great detail, including land cover forms such as forests, which were not accounted for in CLC. This study has unequivocally demonstrated that both the method used to estimate design rainfall depths and the choice of land use databases have substantial effects on the characteristics of design hydrographs. The determination of these hydrograph profiles is a critical step in the design of urban hydraulic infrastructure, such as urban drainage, channels, retention basins, and flood protection structures. The safety and functionality of these elements are directly linked to accurately defining the shape of design hydrographs [55].
The use of hydrological models itself presents certain limitations, such as model specification and parameter identification issues. Sikorska and Banasik [56] demonstrated that choosing different methods to estimate Nash model parameters affects the quality of the results. Problems also arise when calibrating models in ungauged watersheds and in cases requiring numerous parameters [57]. Models should be designed to be as straightforward as possible for practical use. Thus, new approaches for urban watersheds are continuously being developed. The challenges related to the determination of design hydrographs also extend to the ongoing urbanization and climate change. These factors disrupt the stationary assumptions of hydrometeorological events. If design hydrographs based on stationary assumptions are used for engineering purposes, it may increase the risk of damage or the failure of the designed structure. Therefore, an increasing emphasis is placed on adjusting models for climate change and the growing human pressure on watersheds [58].
In summary, the analyses conducted unequivocally indicate that the selection of the design rainfall estimation method is a significant factor influencing the reliability of projected hydrographs, which are key outcomes of hydrological modeling. Research conducted by Ghazavi et al. [59] demonstrated that differences in the results of hydrological models, resulting from the use of different design rainfall methods, can be significant, especially in the case of extreme event analyses, particularly peak flows. It should be emphasized that such differences can be crucial for urban infrastructure design and the delineation of flood zones. The studies by Wałęga et al. [60] unequivocally showed that for urban catchments, the extent of flooding can vary significantly depending on the adopted methodology for calculating design rainfall. The issue of design rainfall also encompasses considerations regarding duration times. Due to data availability, such rainfall is often estimated based on daily information, leading to inflated characteristics of projected hydrographs. For urban infrastructure, information on short-duration heavy rainfall is necessary. Such information can be generated using various models, such as STORAGE. The research conducted by Petroselli et al. [61] showed that such a model can be successfully applied to simulate short-duration design rainfall, which serves as the input signal for modeling projected hydrographs in urban catchments. Furthermore, research by Löwe [62] underscores the need to consider uncertainties associated with future rainfall projections for projected hydrographs, especially in the context of identifying potential flood hazards and damages. An important aspect of hydrological analysis is also the accurate delineation of land use bases. Differences in land use classes can significantly affect surface runoff and infiltration characteristics, which in turn are crucial for generating reliable projected hydrographs. The research by Banjara et al. [63] demonstrated that future projections of land use changes show a continuous increase in sealing, which enhances the surface runoff. However, these projections vary depending on the databases used. Despite numerous limitations, CLC databases are commonly used for land use identification in various fields, including hydrological modeling [64]. However, many studies have shown that the results of CLC applications regarding land cover should be interpreted with caution and awareness of methodological limitations. Jansen and DiGregorio [65] point out the inconsistency in the land cover or land use delimitation criteria. Additionally, it has been shown that land cover change maps are susceptible to errors at the local scale or unsuitable for detailed landscape analysis [66]. In conclusion, the selection of an appropriate design rainfall method and the precise definition of land use bases are crucial aspects of hydrological modeling, significantly influencing the accuracy and reliability of generated projected hydrographs. Therefore, it is necessary to consider not only the differences between rainfall estimation methods, but also changes in land use to ensure accurate forecasts of hydrological events.

4. Conclusions

The research aimed to analyze how the selection of rainfall estimation methods and land use databases impacts the characteristics of project hydrographs in the Drwinka catchment. The conducted study yielded the following conclusions:
  • The dynamics of maximum rainfall changes in the catchment for the period 1981–2020 remained relatively stable. The observed series of these maximum rainfall events showed no discernible trend.
  • Among the various statistical distributions examined for estimating project rainfall, the Generalized Extreme Value (GEV) distribution consistently yielded the highest values, whereas the Gumbel distribution produced the lowest values. The log-normal distribution proved to be the most fitting choice.
  • The analysis of land use databases in the catchment revealed a significant difference in the level of detail in representing various land use forms. The Urban Atlas database offered greater detail compared to the Corine Land Cover (CLC) database. However, both databases indicated a noticeable trend of urbanization in the catchment between 2006 and 2018.
  • The calculations conducted demonstrated that the selected method for estimating project rainfall significantly influences the characteristics of project hydrographs. A 1 mm increase in rainfall resulted in a corresponding increase in the peak flow by 0.363 m3/s and an overall volume increase of 11,000 m3.
It was evident that higher values of project hydrograph characteristics were obtained when using the CLC database, directly linked to the estimated CN parameter.
The findings of this research unequivocally underscore that the choice of rainfall estimation method and land use database plays a substantial role in shaping the trajectory of project hydrographs. Consequently, in cases where local legal requirements or recommendations for estimating project rainfall are absent, the determination should be based on a multi-distribution analysis and the selection of the most appropriate function. Regarding land use databases, it is advisable to opt for the Urban Atlas database due to its superior level of detail.

Author Contributions

Conceptualization, D.M. and K.S.; methodology, D.M. and W.H.; software, D.M.; validation, D.M.; formal analysis, D.M.; investigation, D.M. and W.H; resources, D.M.; data curation, D.M.; writing—original draft preparation, D.M., W.H. and K.S.; writing—review and editing, D.M., W.H. and K.S.; visualization, D.M. and W.H.; supervision, D.M.; project administration, D.M.; funding acquisition, D.M. All authors have read and agreed to the published version of the manuscript.

Funding

This research received no external funding.

Institutional Review Board Statement

Not applicable.

Informed Consent Statement

Not applicable.

Data Availability Statement

Dataset available on request from the authors.

Conflicts of Interest

Auhor Karolina Surowiec was employed by the Antea Poland S.A. Company. The remaining authors declare that the research was conducted in the absence of any commercial or financial relationships that could be construed as a potential conflict of interest.

References

  1. Westra, S.; Fowler, H.J.; Evans, J.P.; Alexander, L.V.; Berg, P.; Johnson, F.; Kendon, E.J.; Lenderink, G.; Roberts, N.M. Future changes to the intensity and frequency of short duration extreme rainfall. Rev. Geophys. 2014, 52, 522–555. [Google Scholar] [CrossRef]
  2. Fletcher, T.D.; Andrieu, H.; Hamel, P. Understanding, management and modelling of urban hydrology and its consequences for receiving waters; a state of the art. Adv. Water Resour. 2013, 51, 261–279. [Google Scholar] [CrossRef]
  3. Braud, I.; Fletcher, T.D.; Andrieu, H. Hydrology of peri-urban catchments: Processes and modelling. J. Hydrol. 2013, 485, 1–4. [Google Scholar] [CrossRef]
  4. Zope, P.E.; Eldho, T.I.; Jothiprakas, V. Impacts of urbanization on flooding of a coastal urban catchment: A case study of Mumbai City, India. Nat. Hazards. 2014, 75, 887–908. [Google Scholar] [CrossRef]
  5. Yang, X.; Bowling, L.C.; Cherkauer, K.A.; Pijanowski, B.C. The impact of urban development on hydrologic regime from catchment to basin scales. Landsc. Urban Plan. 2011, 103, 237–247. [Google Scholar] [CrossRef]
  6. Minning, M.; Moeck, C.; Radny, D.; Schrimer, M. Impact of urbanization on groundwater recharge rates in Dübendorf, Switzerland. J. Hydrol. 2018, 563, 1135–1146. [Google Scholar] [CrossRef]
  7. O’Driscoll, M.; Clinton, S.; Jefferson, A.; Manda, A.; McMillan, S. Urbanization Effects on Watershed Hydrology and In-Stream Processes in the Southern United States. Water 2010, 2, 605–648. [Google Scholar] [CrossRef]
  8. Rangari, V.A.; Gonugunta, R.; Umamahesh, N.V.; Patel, A.K.; Bhatt, C.M. 1D–2D modeling of urban floods and risk map generation for the part of Hyderabad city. Int. Arch. Photogramm. Remote Sens. Spatial Inf. Sci. 2018, 5, 445–450. [Google Scholar] [CrossRef]
  9. Bulti, D.T.; Abebe, B.G. A review of flood modeling methods for urban pluvial flood application. Model. Earth Syst. Environ. 2020, 6, 1293–1302. [Google Scholar] [CrossRef]
  10. Szeląg, B.; Suligowski, R.; De Paola, F.; Siwicki, P.; Majerek, D.; Łagód, G. Influence of urban catchment characteristics and rainfall origins on the phenomenon of stormwater flooding: Case study. Environ. Modell. Softw. 2022, 150, 105335. [Google Scholar] [CrossRef]
  11. Czyża, S.; Kowalczyk, A.M. GIS and geodata contribution to the cartographic modelling of blue-green infrastructure in urbanised areas. J. Water Land Develop. 2023, 59, 183–194. [Google Scholar] [CrossRef]
  12. Gooré Bi, E.; Gachon, P.; Vrac, M.; Monette, F. Which downscaled rainfall data for climate change impact studies in urban areas? Review of current approaches and trends. Theor. Appl. Climatol. 2017, 127, 685–699. [Google Scholar] [CrossRef]
  13. Peixoto, J.P.J.; Costa, D.G.; Portugal, P.; Vasques, F. Flood-Resilient Smart Cities: A Data-Driven Risk Assessment Approach Based on Geographical Risks and Emergency Response Infrastructure. Smart Cities 2024, 7, 662–679. [Google Scholar] [CrossRef]
  14. Zaczek-Peplinska, J.; Saloni, L. Modernising the control network for determining displacements in hydraulic structures using automatic measurement techniques. J. Water Land Develop. 2023, 59, 66–75. [Google Scholar] [CrossRef]
  15. Kudas, D.; Wnęk, A.; Zając, E. Soil sealing changes in selected functional urban areas in Poland in 2012–2018. J. Water Land Develop. 2024, 59, 219–227. [Google Scholar] [CrossRef]
  16. Gądek, W. Determination of theoretical swells in gauged catchments using Warsaw University of Technology method and Cracow University of Technology method. Part II, Method’s evaluation. Tech. Trans. Environ. Eng. 2012, 23, 95–104. [Google Scholar]
  17. Gądek, W. Typical discharge hydrograph for determining design floods. Water Environ. Rural Areas 2015, 15, 5–18. [Google Scholar]
  18. Abdulaleva, B.S. Enhancing the performance of deep learning technique by combining with gradient boosting in rainfall-runoff simulation. J. Water Land Develop. 2023, 59, 216–223. [Google Scholar] [CrossRef]
  19. Piech, I.; Policht-Latawiec, A.; Lackóová, L.; Inglot, P. The assessment of elevation data consistency. A case study using the ALS and georeference database in the City of Kraków. J. Water Land Develop. 2023, 59, 135–144. [Google Scholar] [CrossRef]
  20. El Kadi Abderrezzak, K.; Paquier, A.; Mignot, E. Modelling flash flood propagation in urban areas using a two-dimensional numerical model. Nat. Hazards 2009, 50, 433–460. [Google Scholar] [CrossRef]
  21. Costabile, P.; Macchione, F. Enhancing river model set-up for 2-D dynamic flood modelling. Environ. Model. Soft. 2015, 67, 89–107. [Google Scholar] [CrossRef]
  22. Liu, Y.; Wu, X.; Qi, W. Assessing the water quality in urban river considering the influence of rainstorm flood: A case study of Handan city, China. Ecol. Indic. 2024, 160, 111941. [Google Scholar] [CrossRef]
  23. Chen, W.; Wu, H.; Kimball, J.S.; Alfieri, L.; Nanding, N.; Li, X.; Jiang, L.; Wu, W.; Tao, Y.; Zhao, S.; et al. A coupled river Basin-Urban hydrological model (DRIVE-Urban) for real-time urban flood modeling. Water Resour. Res. 2022, 58, e2021WR031709. [Google Scholar] [CrossRef]
  24. Şen, O.; Kahya, E. Determination of flood risk: A case study in the rainiest city of Turkey. Environ. Model. Soft. 2017, 93, 296–309. [Google Scholar] [CrossRef]
  25. Feng, B.; Zhang, Y.; Bourke, R. Urbanization impacts on flood risks based on urban growth data and coupled flood models. Nat. Hazards 2021, 106, 613–627. [Google Scholar] [CrossRef]
  26. Alam, M.A.; Emura, K.; Farnham, C.; Yuan, J. Best-Fit Probability Distributions and Return Periods for Maximum Monthly Rainfall in Bangladesh. Climate 2018, 6, 9. [Google Scholar] [CrossRef]
  27. Siejka, M.; Mika, M.; Salata, T.; Leń, P. Algorithm of land cover spatial data processing for the local flood risk mapping. Survey Rev. 2017, 2, 397–403. [Google Scholar] [CrossRef]
  28. Młyński, D.; Wałęga, A.; Bugajski, P.; Operacz, A.; Kurek, K. Verfication of empirical formuals for calculating mean low flow in reflect to affecting on disposable water resources. Acta Sci. Pol. Form. Circumiectus 2019, 18, 83–92. [Google Scholar] [CrossRef]
  29. Lepeška, T.; Wojkowski, J.; Wałęga, A.; Młyński, D.; Radecki-Pawlik, A.; Olah, B. Urbanization—Its Hidden Impact on Water Losses: Prądnik River Basin, Lesser Poland. Water 2020, 12, 1958. [Google Scholar] [CrossRef]
  30. Młyński, D.; Wałęga, A.; Petroselli, A.; Tauro, F.; Cebulska, M. Estimating Maximum Daily Precipitation in the Upper Vistula Basin, Poland. Atmosphere 2019, 10, 43. [Google Scholar] [CrossRef]
  31. Zeng, X.; Wang, D.; Wu, J. Evaluating the Three Methods of Goodness of Fit Test for Frequency Analysis. J. Risk Anal. Crisis Responses 2015, 5, 178–187. [Google Scholar] [CrossRef]
  32. Młyński, D. Analysis of Problems Related to the Calculation of Flood Frequency Using Rainfall-Runoff Models: A Case Study in Poland. Sustainability 2020, 12, 7187. [Google Scholar] [CrossRef]
  33. Xiao, B.; Wang, Q.; Fan, J.; Han, F.; Dai, Q. Application of the SCS-CN Model to Runoff Estimation in a Small Watershed with High Spatial Heterogeneity. Pedosphere 2018, 26, 738–749. [Google Scholar] [CrossRef]
  34. Maidment, D.R. Handbook of Hydrology; McGraw-Hill Professional: New York, NY, USA, 1993. [Google Scholar]
  35. Tailor, D.; Shrimali, N.J. Surface runoff estimation by SCS curve number method using GIS for Rupen-Khan watershed, Mehsana district, Gujarat. J. Indian Water Resour. Soc. 2016, 36, 1437. [Google Scholar]
  36. Petroselli, A.; Wałęga, A.; Młyński, D.; Radecki-Pawlik, A.; Cupak, A.; Hathaway, J. Rainfall-runoff modeling: A modification of the EBA4SUB framework for ungauged and highly impervious urban catchments. J. Hydrol. 2022, 606, 127371. [Google Scholar] [CrossRef]
  37. Jarosińska, E.; Bodziony, M. Temporal and spatial rainfall variability in the urbanized area of Cracow. Acta Sci. Pol. Form. Circumiectus 2019, 18, 43–55. [Google Scholar] [CrossRef]
  38. Wałęga, A.; Michalec, B. Characteristics of extreme heavy precipitation events occurring in the area of Cracow (Poland). Soil Water Res. 2014, 9, 182–191. [Google Scholar] [CrossRef]
  39. Wasko, C.; Nathan, R. Influence of changes in rainfall and soil moisture on trends in flooding. J. Hydrol. 2019, 575, 432–441. [Google Scholar] [CrossRef]
  40. Młyński, D.; Cebulska, M.; Wałęga, A. Trends, Variability, and Seasonality of Maximum Annual Daily Precipitation in the Upper Vistula Basin, Poland. Atmosphere 2018, 9, 313. [Google Scholar] [CrossRef]
  41. Moccia, B.; Mineo, C.; Ridolfi, E.; Russo, F.; Napolitano, F. Probability distributions of daily rainfall extremes in Lazio and Sicily, Italy, and design rainfall inferences. J. Hydrol. Reg. Stud. 2021, 33, 100771. [Google Scholar] [CrossRef]
  42. Horvat, B.; Krvavica, N. Disaggregation of the Copernicus Land Use/Land Cover (LULC) and Population Density Data to Fit Mesoscale Flood Risk Assessment Requirements in Partially Urbanized Catchments in Croatia. Land 2023, 12, 2014. [Google Scholar] [CrossRef]
  43. Cegielska, K.; Noszczyk, T.; Kukulska, A.; Szylar, M.; Hernik, J.; Dixon-Gough, R.; Jombach, S.; Valánszki, I.; Kovács, K.F. Land use and land cover changes in post-socialist countries: Some observations from Hungary and Poland. Land Use Policy 2018, 78, 1–18. [Google Scholar] [CrossRef]
  44. Fiedeń, Ł. Changes in land use in the communes crossed by the A4 motorway in Poland. Land Use Policy 2019, 85, 397–406. [Google Scholar] [CrossRef]
  45. Toure, S.I.; Stow, D.A.; Shih, H.; Weeks, J.; Lopez-Carr, D. Land cover and land-use change analysis using multi-spatial resolution data and object-based image analysis. Remote Sens. Environ. 2018, 210, 259–268. [Google Scholar] [CrossRef]
  46. Wojkowski, J.; Wałęga, A.; Radecki-Pawlik, A.; Młyński, D.; Lepeška, T. The influence of land cover changes on landscape hydric potential and river flows: Upper Vistula, Western Carpathians. Catena 2022, 210, 105878. [Google Scholar] [CrossRef]
  47. Barszcz, M. Evaluation of suitability of the conceptual Nash model for the simulation a flow hydrograph in a urbanized catchment considering rainfall depth scenarios. Sci. Rev. Eng. Environ. Sci. 2014, 64, 113–123. [Google Scholar]
  48. Yonus, M.; Jan, B.; Khan, H.; Nawaz, F.; Ali, M. Study the seasonal trend analysis and probability distribution functions of rainfall for atmospheric region of Pakistan. MethodsX 2023, 10, 102068. [Google Scholar] [CrossRef]
  49. Lavanya, S.; Radha, M.; Arulanandu, U. Statistical Distribution of Seasonal Rainfall Data for Rainfall Pattern in TNAU1 Station Coimbatore, Tamil Nadu, India. Int. J. Current Microbiol. Appl. Sci. 2018, 7, 3053–3062. [Google Scholar] [CrossRef]
  50. Villarini, G.; Smith, J.A.; Ntelekos, A.A.; Schwarz, U. Annual maximum and peaks-over-threshold analyses of daily rainfall accumulations for Austria. J. Geo. Res. Atmos. 2011, 116, D05103. [Google Scholar] [CrossRef]
  51. Bezak, N.; Šraj, M.; Mikoš, M. Design Rainfall in Engineering Applications with Focus on the Design Discharge. In Engineering and Mathematical Topics in Rainfall; Hromadka, T.V., Rao, P., Eds.; IntechOpen: London, UK, 2017; p. 196. [Google Scholar]
  52. Wałęga, A.; Salata, T. Influence of land cover data sources on estimation of direct runoff according to SCS-CN and modified SME methods. Catena 2019, 172, 232–242. [Google Scholar] [CrossRef]
  53. Jacqueminet, C.; Kermadi, S.; Michel, K.; Béal, D.; Gagnage, M.; Branger, F.; Jankowfsky, S.; Braud, I. Land cover mapping using aerial and VHR satellite images for distributed hydrological modelling of periurban catchments: Application to the Yzeron catchment (Lyon, France). J. Hydrol. 2013, 485, 68–83. [Google Scholar] [CrossRef]
  54. Zimmermann, E.; Bracalenti, L.; Piacentini, R.; Inostroza, L. Urban Flood Risk Reduction by Increasing Green Areas for Adaptation to Climate Change. Procedia Eng. 2016, 161, 2241–2246. [Google Scholar] [CrossRef]
  55. Brunner, M.I.; Viviroli, D.; Sikorska, A.E.; Vannier, O.; Favre, A.C.; Seibert, J. Flood type specific construction of synthetic design hydrographs. Water Resour. Res. 2017, 53, 1390–1406. [Google Scholar] [CrossRef]
  56. Sikorska, A.; Banasik, K. Parameter identification of a conceptual rainfall-runoff model for a small urban catchment. Annals Warsaw Univ. Life Sci. 2010, 42, 279–293. [Google Scholar] [CrossRef]
  57. Alizadeh, Z.; Yazdi, J. Calibration of hydrological models for ungauged catchments by automatic clustering using a differential evolution algorithm: The Gorganrood river basin case study. J. Hydroinf. 2023, 25, 645–662. [Google Scholar] [CrossRef]
  58. Jijang, C.; Xiong, L.; Yan, L.; Dong, F.; Xu, C.Y. Multivariate hydrologic design methods under nonstationary conditions and application to engineering practice. Hydrol. Earth Syst. Sci. 2019, 23, 1683–1704. [Google Scholar] [CrossRef]
  59. Ghazavi, R.; Rabori, A.M.; Reveshty, M.A. Effects of Rainfall Intensity-Duration-Frequency Curves Reformation on Urban Flood Characteristics in Semiarid Environment. Ecopersia 2017, 5, 1799–1813. [Google Scholar]
  60. Wałęga, A.; Młyński, D.; Petroselli, A.; De Luca, D.L.; Appolonio, C.; Pancewicz, M. Possibility of using the STORAGE rainfall generator model in the flood analyses in urban areas. Water. Res. 2024, 251, 121135. [Google Scholar] [CrossRef]
  61. Petroselli, A.; De Luca, D.L.; Młyński, D.; Wałęga, A. Modelling annual maximum daily rainfall with the STORAGE (STOchastic RAinfall GEnerator) model. Hydrol. Res. 2022, 53, 547–561. [Google Scholar] [CrossRef]
  62. Löwe, R.; Urich, C.; Kulahci, M.; Radhakrishnan, M.; Deletic, A.; Arnbjerg-Nielsen, K. Simulating flood risk under non-stationary climate and urban development conditions—Experimental setup for multiple hazards and a variety of scenarios. Environ. Model. Soft. 2018, 102, 155–171. [Google Scholar] [CrossRef]
  63. Banjara, M.; Bhusal, A.; Ghimire, A.B.; Kalra, A. Impact of Land Use and Land Cover Change on Hydrological Processes in Urban Watersheds: Analysis and Forecasting for Flood Risk Management. Geosciences 2024, 14, 40. [Google Scholar] [CrossRef]
  64. Bielecka, E.; Jenerowicz, A. Intellectual Structure of CORINE Land Cover Research Applications in Web of Science: A Europe-Wide Review. Remote Sens. 2019, 11, 2017. [Google Scholar] [CrossRef]
  65. Jansen, L.J.M.; Di Gregorio, A. Parametric land cover and land-use classifications as tools for environmental change detection. Agric. Ecosyst. Environ. 2002, 91, 89–100. [Google Scholar] [CrossRef]
  66. Diaz-Pacheco, J.; Gutiérrez, J. Exploring the limitations of CORINE Land Cover for monitoring urban land-use dynamics in metropolitan areas. J. Land Use Sci. 2014, 9, 243–259. [Google Scholar] [CrossRef]
Figure 1. Location of the Drwinka catchment area.
Sustainability 16 04805 g001
Figure 2. Pmax rainfall pattern for the Drwinka catchment.
Sustainability 16 04805 g002
Figure 3. Theoretical design rainfall distribution curves.
Sustainability 16 04805 g003
Figure 4. Spatial diversity of the Drwinka catchment in 2006 and 2018 according to CLC and UA.
Sustainability 16 04805 g004
Figure 5. Design hydrograph courses for design rainfall determined using the analyzed probability distributions.
Sustainability 16 04805 g005
Figure 6. The distribution of effective rainfall heights in the Drwinka catchment according to different land use databases.
Sustainability 16 04805 g006
Figure 7. Hydrograph profiles for particular land use databases.
Sustainability 16 04805 g007
Table 1. Values of the RMSE criterion for the analyzed probability distributions.
DistributionRMSE
GEV4.7
PIII6.1
Weibull6.1
Gumbel6.7
log-normal4.6
Table 2. Use of the Drwinka catchment in 2006 and 2018 according to the CLC database.
Level 1Level 2Level 3Area [km2]
20062018
Artificial surfacesUrban fabricContinuous urban fabric8.2868.526
Industrial, commercial, and transport unitsIndustrial or commercial units1.0771.001
Road and rail networks and associated land1.4131.413
Artificial, non-agricultural vegetated areasGreen urban areas0.9111.231
Sport and leisure facilities0.4480.559
Agricultural areasArable landNon-irrigated arable land0.6620.000
PasturesPastures0.7720.848
Heterogeneous
agricultural areas
Complex cultivation patterns0.0090.000
Table 3. Use of the Drwinka catchment in 2006 and 2018 according to the UA database.
Land UseArea [km2]
20062018
Agricultural, semi-natural areas, wetlands1.6290.381
Construction sites0.0090.019
Continuous urban fabric (S.L.: >80%)1.9892.073
Discontinuous dense urban fabric (S.L.: 50–80%)2.8782.960
Discontinuous low-density urban fabric (S.L.: 10–30%)0.0000.005
Discontinuous medium-density urban fabric (S.L.: 30–50%)0.0370.072
Discontinuous very-low-density urban fabric (S.L.: <10%)0.0000.016
Forests0.0380.038
Green urban areas1.9541.710
Industrial, commercial, public, military, and private units2.1402.369
Isolated structures0.0000.003
Land without current use0.3340.286
Mineral extraction and dump sites0.0000.009
Other roads and associated land0.9420.947
Pastures0.0001.089
Railways and associated land1.2661.264
Sports and leisure facilities0.3350.310
Water0.0270.027
Table 4. The value of the CN parameter for the research catchment.
Database20062018
CLC85.085.0
UA79.179.4
Table 5. Values of hydrograph characteristics for the specified design rainfall depths.
DistributionP [mm]Pnet [mm]V [m3]Qmax [m3·s−1]
GEV110.958.4791,97826.385
PIII93.243.9595,47819.923
Weibull93.143.8594,39819.887
Gumbel89.440.9554,71018.640
log-normal109.457.1774,95625.834
P—design rainfall; Pnet—effective rainfall; V—flood volume; Qmax—maximum flow during a flood.
Table 6. Values of hydrograph characteristics for individual land use databases.
Land Use BaseV [m3]Qmax [m3·s−1]
CLC 2006942,34530.638
CLC 2018942,34530.684
UA 2006765,80825.437
UA 2018775,99225.864
Disclaimer/Publisher’s Note: The statements, opinions and data contained in all publications are solely those of the individual author(s) and contributor(s) and not of MDPI and/or the editor(s). MDPI and/or the editor(s) disclaim responsibility for any injury to people or property resulting from any ideas, methods, instructions or products referred to in the content.

