Article

Bird Species Use of Bioenergy Croplands in Illinois, USA—Can Advanced Switchgrass Cultivars Provide Suitable Habitats for Breeding Grassland Birds?

by
Kirk E. LaGory
1,*,
Jules F. Cacho
1,
Colleen R. Zumpf
1,
DoKyoung Lee
2,
Jeremy Feinstein
1,
Dario Dematties
3,
Leroy J. Walston
1,
Nictor Namoi
2 and
M. Cristina Negri
1
1
Environmental Science Division, Argonne National Laboratory, 9700 S. Cass Ave., Lemont, IL 60439, USA
2
Crop Science Department, University of Illinois Urbana-Champaign, 1102 S. Goodwin Ave., Urbana, IL 61801, USA
3
Mathematics and Computer Science, Argonne National Laboratory, 9700 S. Cass Ave., Lemont, IL 60439, USA
*
Author to whom correspondence should be addressed.
Sustainability 2024, 16(11), 4807; https://doi.org/10.3390/su16114807
Submission received: 22 April 2024 / Revised: 29 May 2024 / Accepted: 3 June 2024 / Published: 5 June 2024

Abstract

:
Grassland birds have sustained significant population declines in the United States through habitat loss, and replacing lost grasslands with bioenergy production areas could benefit these species and the ecological services they provide. Point count surveys and autonomous acoustic monitoring were used at two field sites in Illinois, USA, to determine if an advanced switchgrass cultivar that is being used for bioenergy feedstock production could provide suitable habitats for grassland and other bird species. At the Brighton site, the bird use of switchgrass plots was compared to that of corn plots during the breeding seasons of 2020–2022. At the Urbana site, the bird use of restored prairie, switchgrass, and Miscanthus × giganteus was studied in the 2022 breeding season. At Brighton, Common Yellowthroat, Dickcissel, Grasshopper Sparrow, and Sedge Wren occurred on switchgrass plots more often than on corn; Common Yellowthroat and Dickcissel increased on experimental plots as the perennial switchgrass increased in height and density over the study period; and the other two species declined over the same period. At Urbana, Dickcissel was most frequent in prairie and switchgrass; Common Yellowthroat was most frequent in miscanthus and switchgrass. These findings suggest that advanced switchgrass cultivars could provide suitable habitats for grassland birds, replace lost habitats, and contribute to the recovery of these vulnerable species.

1. Introduction

Finding sustainable alternatives to fossil-based energy and materials is critical to addressing climate change and associated environmental issues. Biomass-based sources are possible alternatives; however, they require the sustainable production and/or collection of biomass from diverse, viable sources (agricultural and forest residues, dedicated energy crops, algae, and municipal solid wastes), as well as mature and economical conversion technologies at the commercial scale. The recently released 2023 Billion-Ton report projected that, under a mature market, the United States has the capacity to produce up to 1.5 billion tons of dry biomass feedstock annually, an increase from the previously estimated 1 billion dry tons [1,2].
Currently, corn-derived ethanol continues to outpace the biofuels produced from cellulosic energy crops [3], with corn (Zea mays L.) biomass (grain and residue) expected to continue to serve as an important resource in the future bioeconomy due to its proven conversion technology among other factors, including potential changes to gasoline blend ratios [4]. This will provide sustained motivation to use farmlands dedicated to corn production for ethanol [5], which from 2010 to 2023 in the United States accounted for approximately 38% of total corn usage [6]. Extensive row crop production has varying impacts on biodiversity. Bird populations, for example, respond differently based upon species type [7,8,9]; however, large-scale monocultural corn production for ethanol can impact nesting birds through a reduction in suitable habitats [3]. A U.S. cropland expansion study observed that the largest proportion of land converted into cropland from 2008 to 2016 (particularly for corn production) was grasslands, which can negatively impact biodiversity (birds, pollinators, and plants) if the land converted was high-quality habitats [10].
An integrated bioenergy landscape (IBL) [11], where targeted croplands are converted into bioenergy crops, could provide benefits to biodiversity along with other ecosystem services and help decarbonize row crop agriculture [12,13,14,15]. An IBL is an application of landscape design, which focuses on strategic, diversified, and multifunctional landscapes in order to meet economic, environmental, and social goals [16]. Some agricultural areas are of marginal value for corn and soybean production [17] and are often susceptible to environmental quality degradation (e.g., soil erosion and nitrate as well as pesticide leaching) [18], resulting in lost revenue for farmers [19]. Under an IBL, row crops would be sustainably coproduced with perennial bioenergy crops, where the former will be grown on fertile areas of the landscape and the latter will be strategically placed on marginal croplands. An IBL can boost the sustainable supply of cellulosic biomass with minimum impacts on prime food croplands, thereby minimizing indirect land-use change, an important consideration for large-scale bioenergy crop production.
IBL design considerations, such as placement, arrangement, and production scale, can target specific ecosystem services or management goals, such as minimizing nutrient and soil losses, management inputs, and greenhouse gas emissions or providing habitats for wildlife and species of concern or of cultural significance [11,12,20,21]. Including areas of perennial grasses and short-rotation woody crops in suboptimal or marginal areas within corn and soybean fields diversifies a monocultural commodity crop landscape and could benefit native grassland birds as well as other species [12]. Evidence suggests that landscape composition and structure drive the abundance and occurrences of birds [22,23,24]. Geospatial modeling analysis indicates that utilizing marginal cropland areas within the U.S. Midwest has the potential to increase bird species richness [25].
This paper summarizes the results of one aspect of the biodiversity assessment conducted as part of the U.S. Department of Energy Bioenergy Technologies Office’s Advanced and Sustainable Energy Crops (ASEC)—Switchgrass Project. The overall project goals were to evaluate the production potential and environmental performance of advanced switchgrass (Panicum virgatum L.) cultivars (i.e., cultivars that can produce >15% more biomass compared to predecessor cultivars) for bioenergy feedstock production on marginal croplands of the U.S. Midwest relative to continuous corn production. This portion of the assessment evaluated the bird use of bioenergy crops (including corn, switchgrass, miscanthus [Miscanthus × giganteus], and prairie) during the breeding season (June–September) at two study sites in Southern and Central Illinois to determine if crop types differed in the bird populations they supported.
There is an urgent need to identify solutions that will aid in the conservation of birds, including approaches such as the restoration of degraded habitats and the creation of new suitable habitats. A landmark study, published in 2019, concluded that widespread population declines in birds in North America had resulted in an overall decline of 2.9 billion birds since 1970—a cumulative loss of 29% of the 1970 abundance [26]. Of all bird groups considered, grassland birds had the largest total population decline over this period (>700 million breeding individuals among 31 species) and the largest proportional loss (53%). Seventy-four percent of grassland bird species are declining.
Grassland habitat loss has occurred through the conversion of pasture and hayfields into row crops; the earlier and more frequent cutting of hayfields; wetland drainage; the natural succession of grasslands into other habitat types; and the conversion into other land uses. A recent review of research papers found that agricultural practices were the single greatest threat to grassland birds worldwide [27]. Another study concluded that the remaining large grasslands in North America may not be enough to prevent the continued decline in grassland birds [28], thus emphasizing the importance of restoring or creating suitable grassland habitat areas to the extent possible. The potential for larger-scale bioenergy production areas using perennial grasses that offset some of this habitat loss and halt or reverse population losses is of great interest and the focus of this paper. Incorporating crops such as perennial switchgrass, which incorporates as a best-management practice a single harvest at the end of the season after crop senescence or a killing frost, would further reduce impacts on breeding birds. Although we were interested in determining the extent to which different bird species used each crop type during the breeding season, we were particularly interested in determining use by grassland species.

2. Materials and Methods
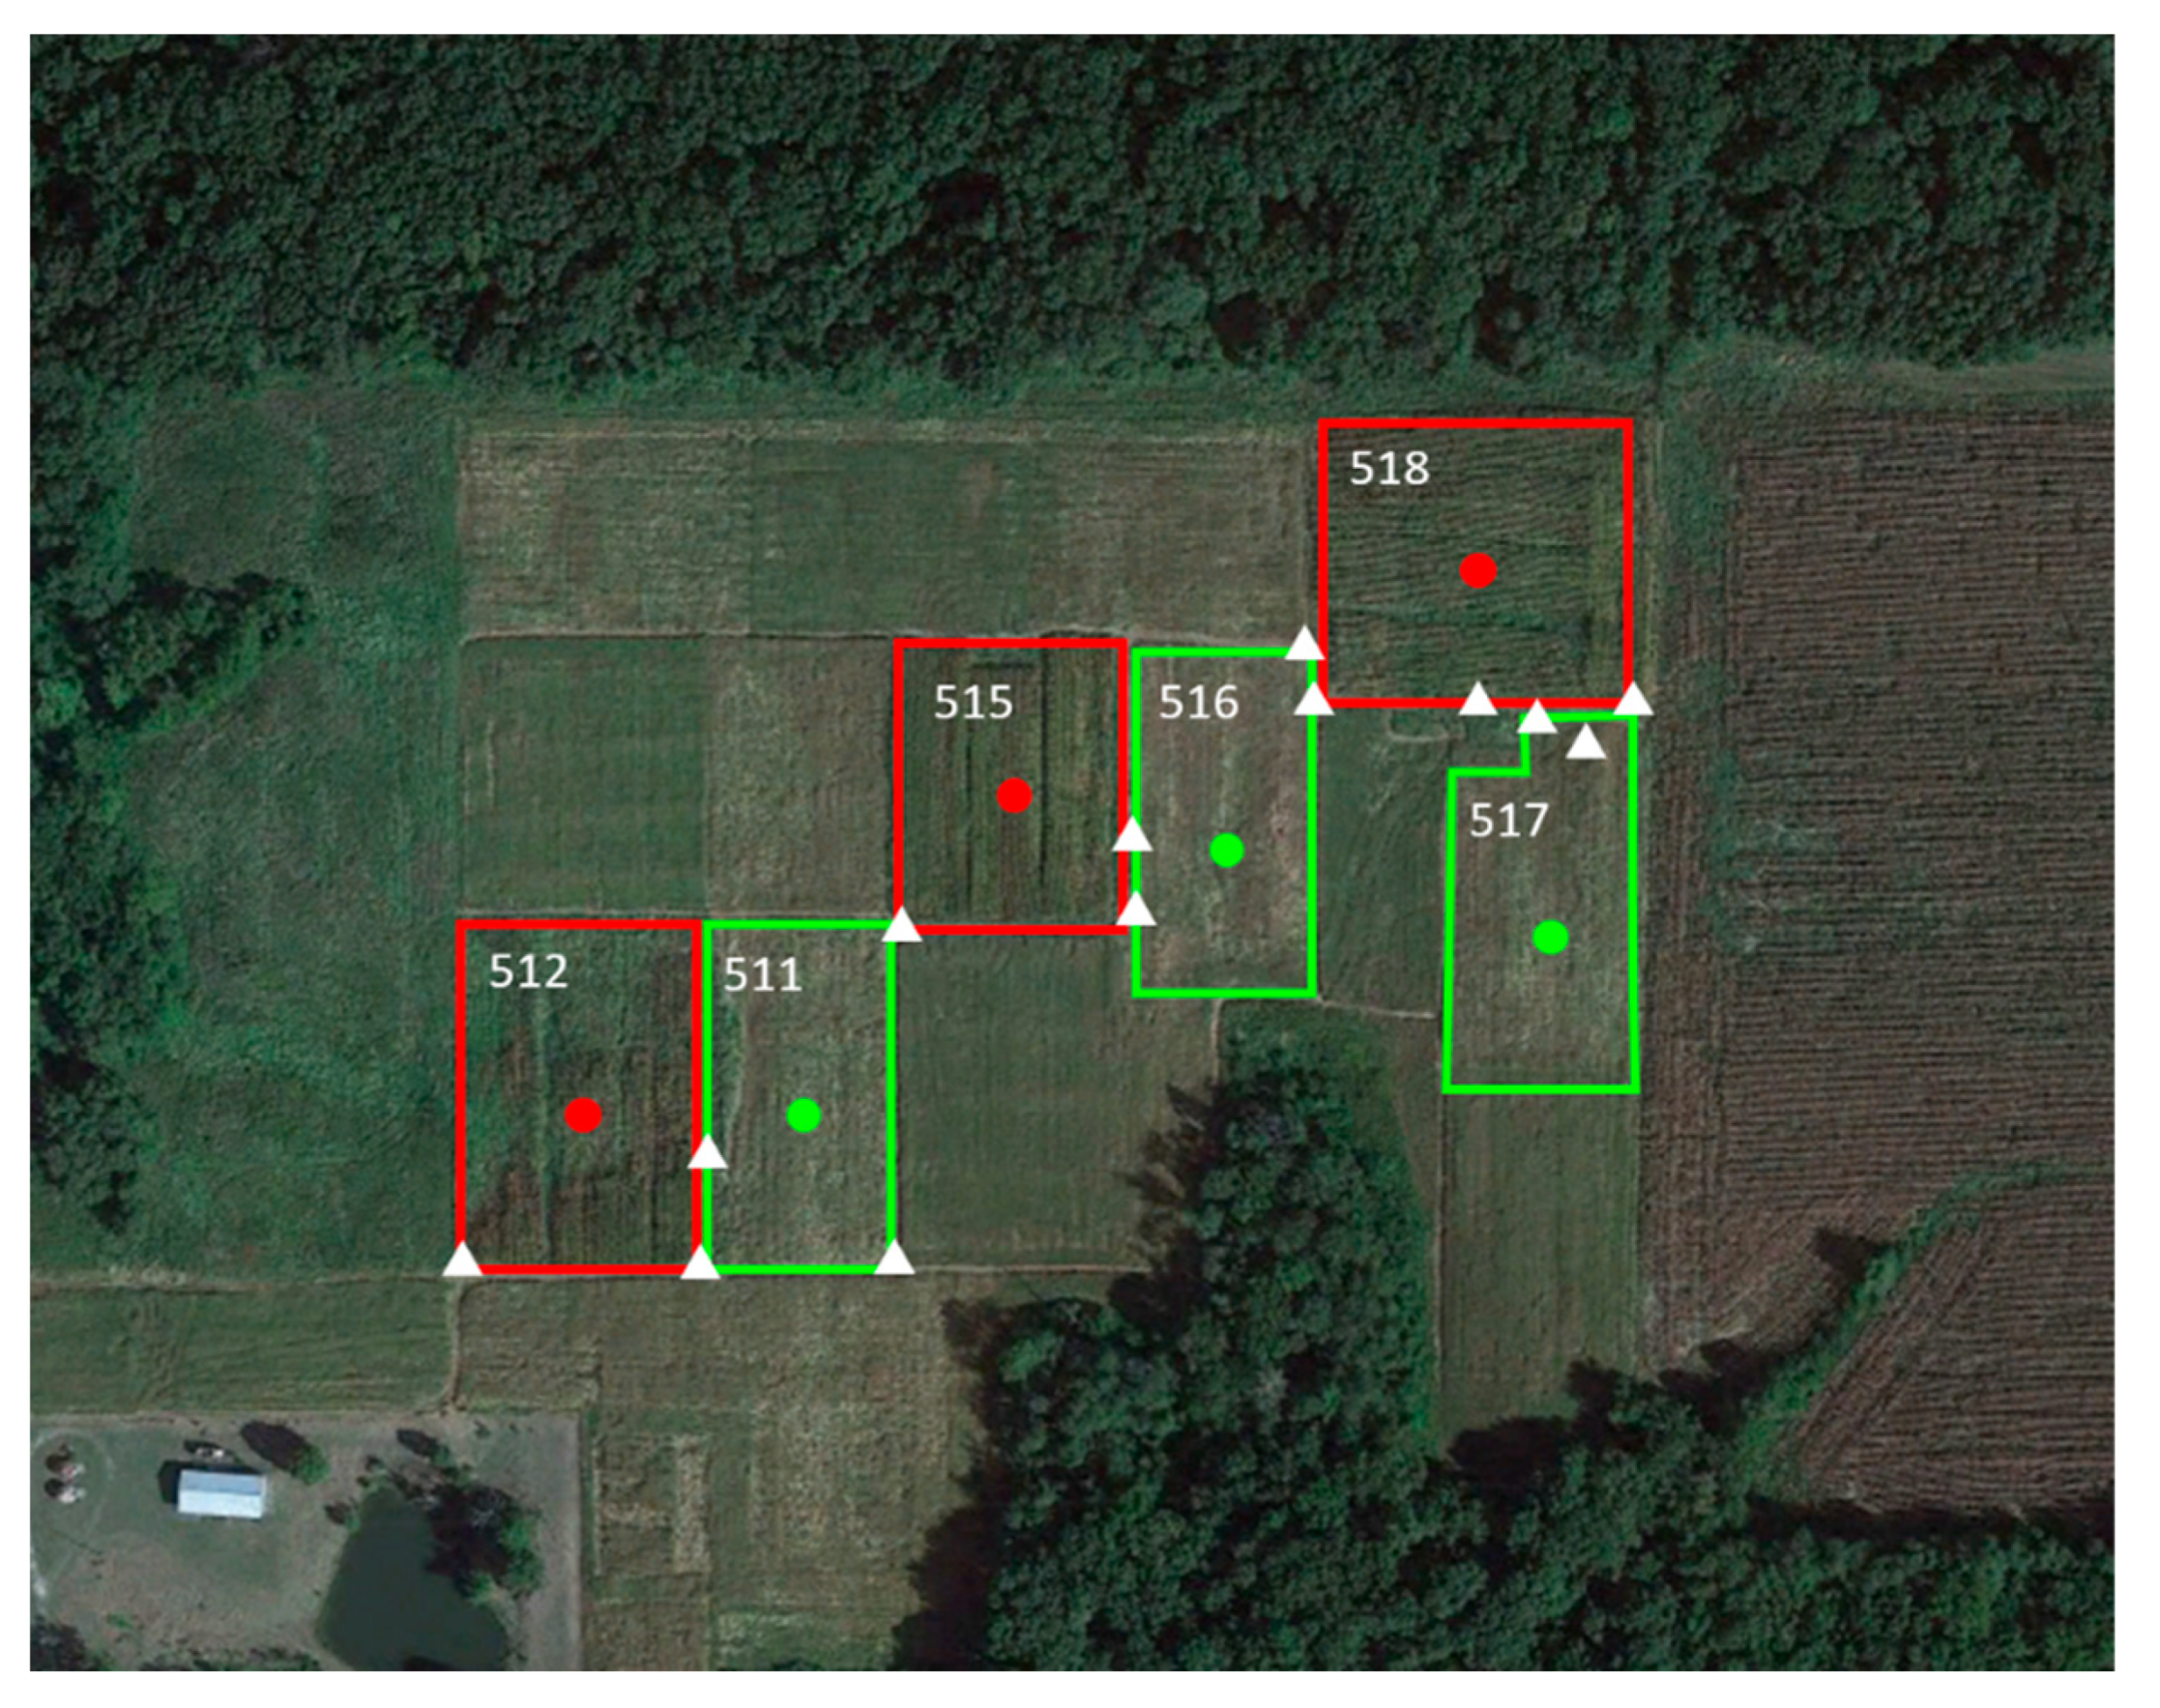
2.1. Study Sites

Two study sites, Brighton and Urbana, were evaluated during the bird breeding season (June–September) in Illinois, USA. The Brighton site (39.0565° N, 90.1855° W) was evaluated for three years (2020–2022) and was located about 4 km northwest of Brighton, Illinois, in Jersey County on a privately owned farm. The study site (approximately 6.5 ha in size) has extensive areas of woodland to the north, south, and west of the site, and agricultural lands to the east (Figure 1). These surroundings influence the species of birds that are available to colonize and use the site. The Urbana site (40.0637° N, 88.1973° W) was only evaluated in 2022 and was located at the Energy Farm at the University of Illinois Urbana-Champaign campus in Champaign County, an experimental facility used to evaluate the production and environmental impacts of bioenergy crops. The study plots were surrounded by other bioenergy crops and research plots (Figure 2).
Each study site was divided into a series of experimental plots containing different bioenergy crops. The Brighton site was planted in corn and several switchgrass cultivars (two bioenergy types: “Independence” [29] and “Liberty” [30] and one forage type: “Shawnee” [31]). Plots were generally rectangular in shape and approximately 0.4 ha in size. We evaluated three plots planted annually with feed corn and three plots planted in May 2019 with Independence switchgrass (Figure 1). On the Urbana site (Figure 2), we evaluated a single plot of switchgrass (Independence), miscanthus, and prairie. The prairie plot was planted with a variety of native plant species, including compass plant (Silphium laciniatum), prairie dock (S. terebinthenacium), prairie rosinweed (S. integrifolium), cup plant (S. perfoliatum), foxglove beard tongue (Penstemon digitalis), tall coreopsis (Coreopsis tripteris), and stiff-leaved goldenrod (Solidago rigidum). Plots at the Urbana site were approximately 3.6 ha each. The prairie, miscanthus, and switchgrass plots were planted in 2008, 2009, and 2021, respectively, and all plots were well established with no areas larger than 0.1 m2 without vegetation.
Surveys were conducted by the senior author via the use of point counts and autonomous acoustic monitoring. The two methods provided independent assessments of the bird use of experimental plots. Point counts provided an estimate of the number of individuals of each species using plots at the time of the survey. Autonomous acoustic monitoring provided an estimate of the number of vocalizations of different species detected from the center of plots and served as a measurement of use throughout the survey period. Because the detection range of recorders went well beyond plot boundaries, detections—although more likely to represent birds using the plot—included other species as well. Point count surveys enabled a determination of whether birds that were seen or heard during surveys were using plots. This enabled the validation of the acoustic monitoring and filtering of species that could be heard during surveys but that were not using experimental plots. Darras et al. [32] conducted a meta-analysis of 28 published studies that used point count surveys and acoustic monitoring and found that the two methods yielded similar results when detection distances could be adjusted to be comparable between the two methods.

2.2. Point Counts

The point count survey method [33] has become widely used as a preferred method of monitoring birds because it provides consistent, statistically robust data. Using this approach, an observer stands at a location and records all of the birds seen or heard at either a fixed or unlimited distance.
At the Brighton site, data were collected daily during three survey periods each year (9–12 June, 21–23 July, and 17–18 September 2020; 8–10 June, 13–15 July, and 15–17 September 2021; and 7–9 June, 26–28 July, and 23–25 August 2022) at point count stations located at the edge of the six experimental plots. Point count station locations were consistent within a survey period but varied among periods to accommodate changes in visibility due to sun location and vegetation height (Figure 1).
During each survey period, six 10 min point counts (one at each plot) were conducted each morning between sunrise and 10:00. A pair of 8 × 42 Vortex Razor HD binoculars (Vortex Optics, Barneveld, WI, USA) were used to facilitate identification. High-resolution photographs of birds seen during surveys and at other times of the day were taken using a Canon PowerShotSX50 HS (Canon USA, Inc., Melville, NY, USA) or an Olympus OM-D E-M1X camera with an M.Zuiko Digital ED 100–400 mm F5.0–6.3 IS lens (OM Digital Solutions Americas, Inc., Bethlehem, PA, USA) to document species using plots and to aid in identification. During each count, all birds seen or heard were recorded on a standardized data sheet and placed in one of two categories: (1) on-plot: the bird was seen or heard within the plot or actively foraging over the plot (e.g., swallows or swifts), and (2) off-plot: the bird was heard or seen outside the plot or was flying over the plot but not foraging. These categories separated birds that were using plot resources from those that were not. Birds that were recorded as being off-plot were either using adjacent experimental plots or surrounding habitats or were traveling through the area. Many of the birds recorded as being off-plot (most often only heard) were in adjacent woodland habitats. In addition to birds observed during each count, birds that flushed from the plot as the observer arrived at the survey station were recorded consistently with Ralph et al. [33]. For each point count survey of a plot, an attempt was made to only count an individual once, but the same individual could be counted during other surveys that day or during the study. Thus, each point count survey was a representation of the number of birds detected during that survey from each survey station.
At the Urbana site, one point count survey was conducted at each of the three plots at the beginning of the 2022 study period (10 June 2022) and the end of the study period (25 August 2022) using the same method and criteria as at the Brighton site.

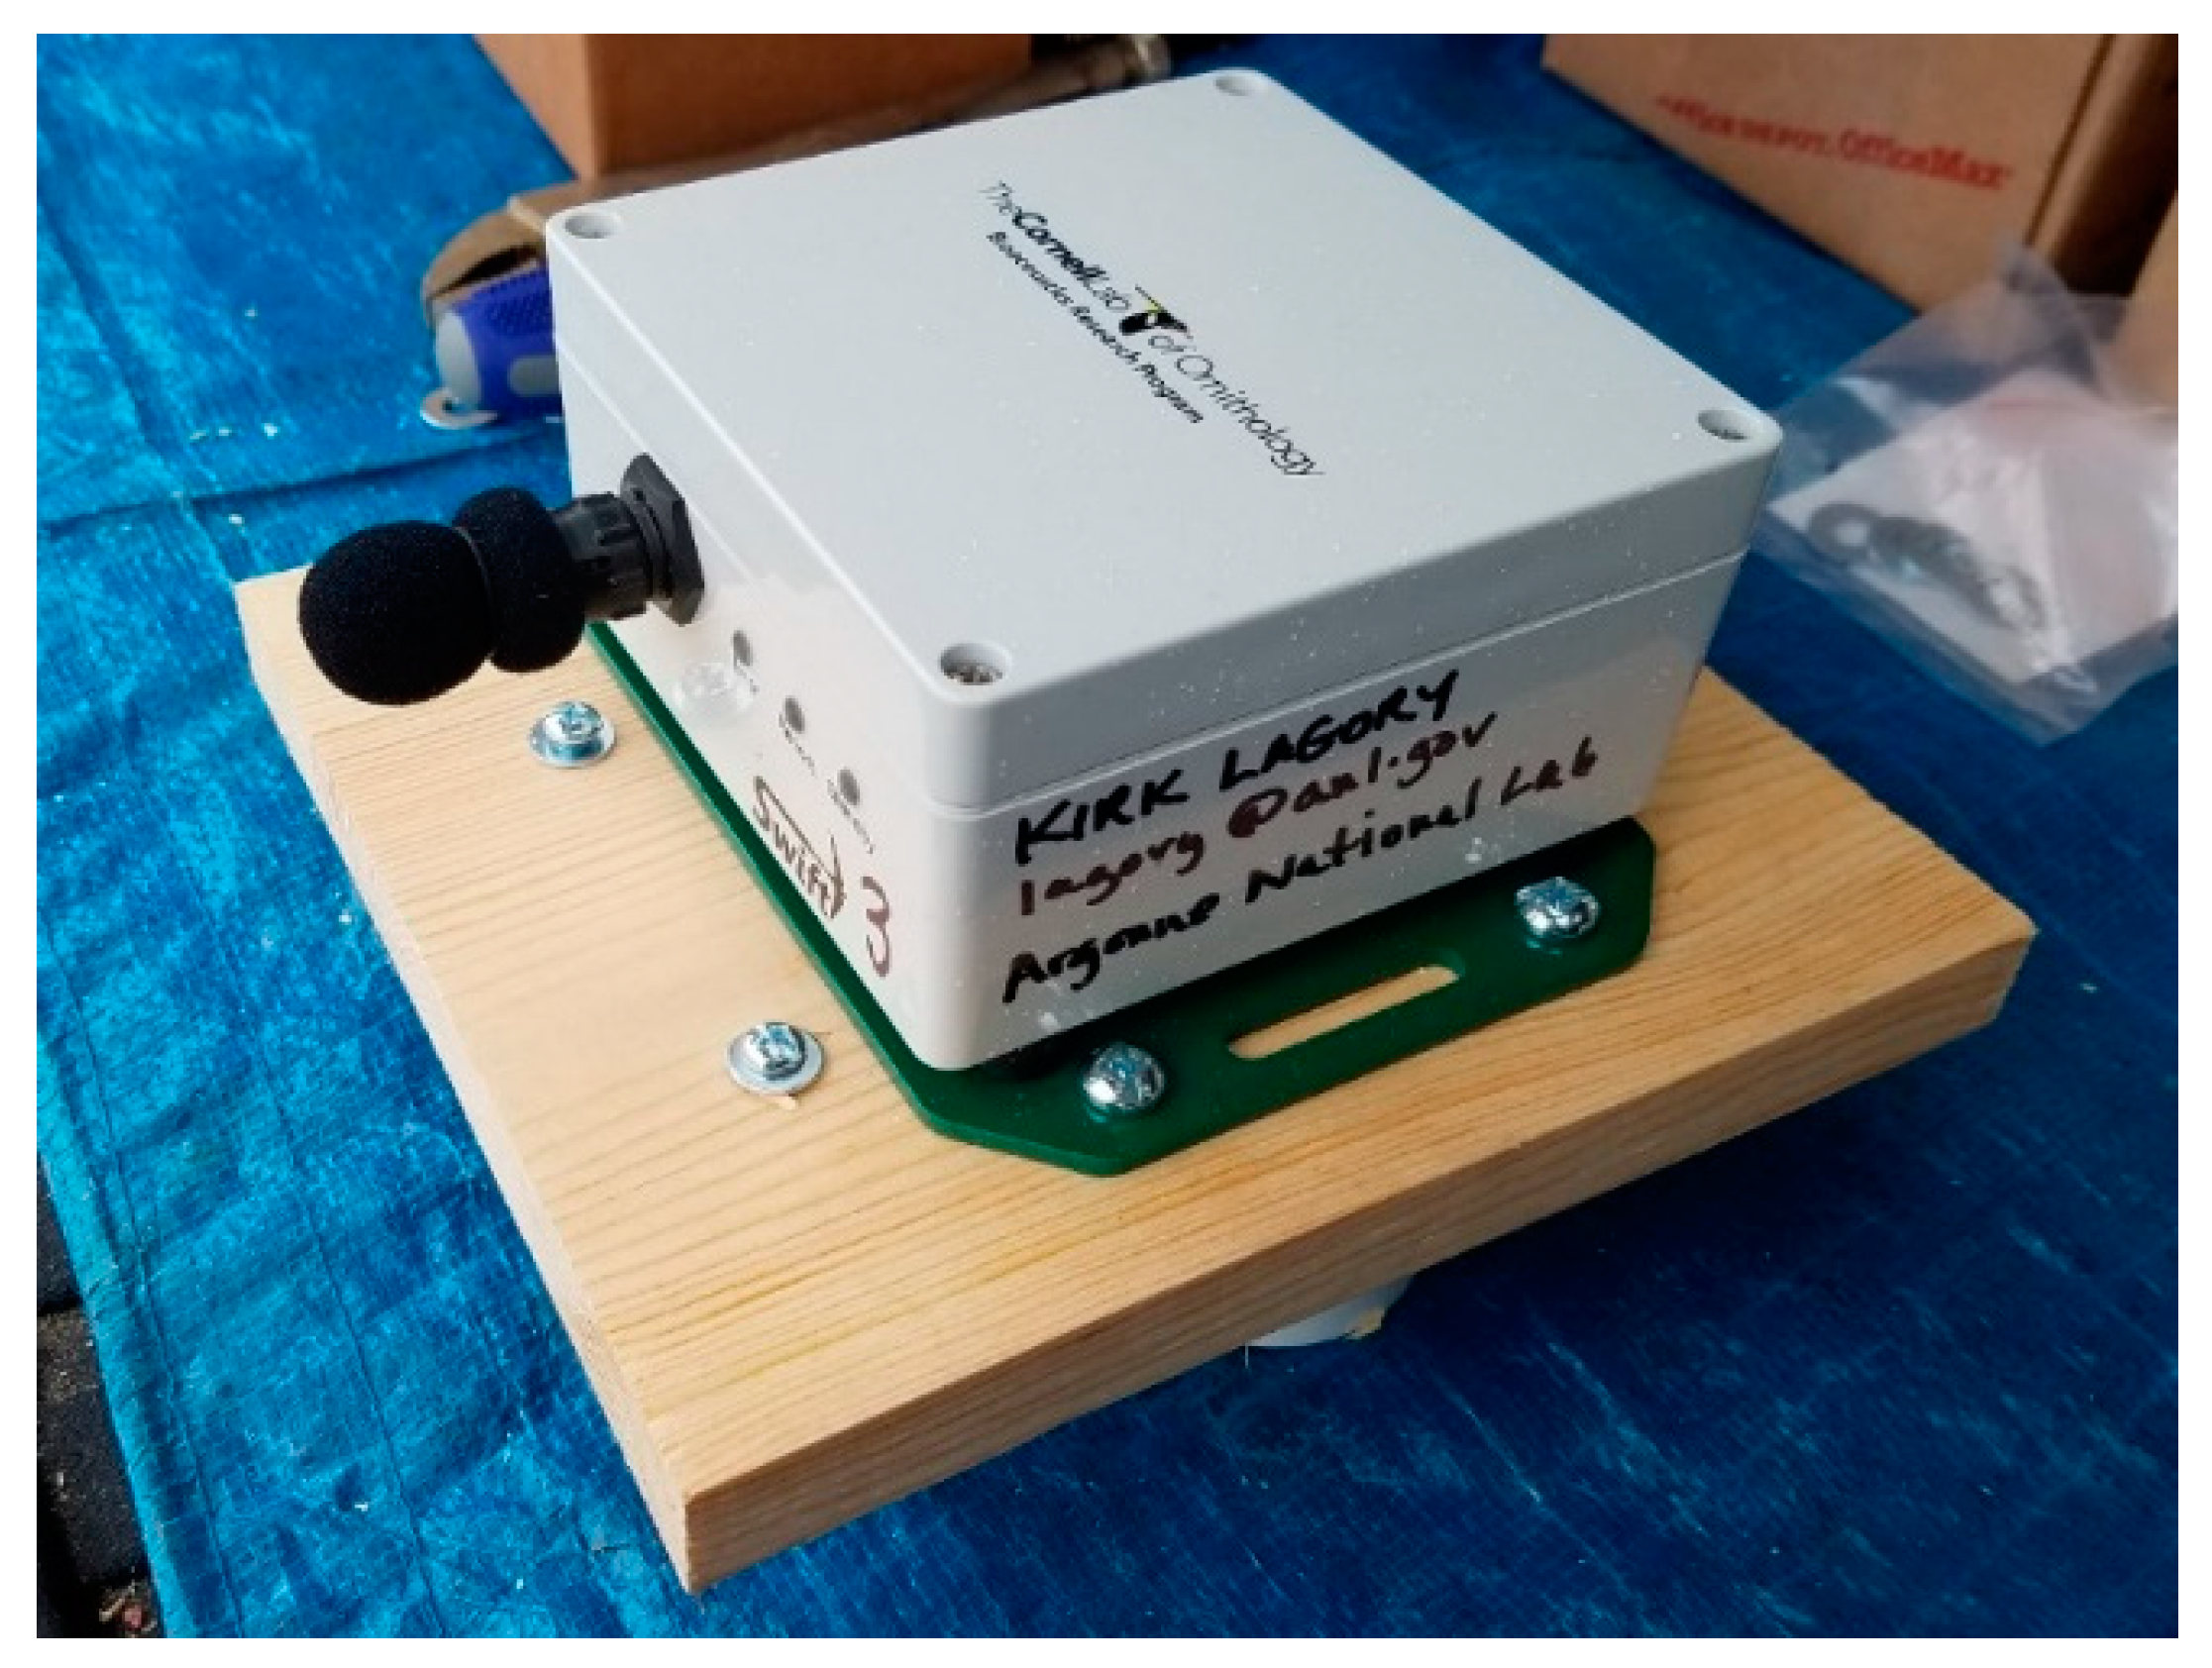
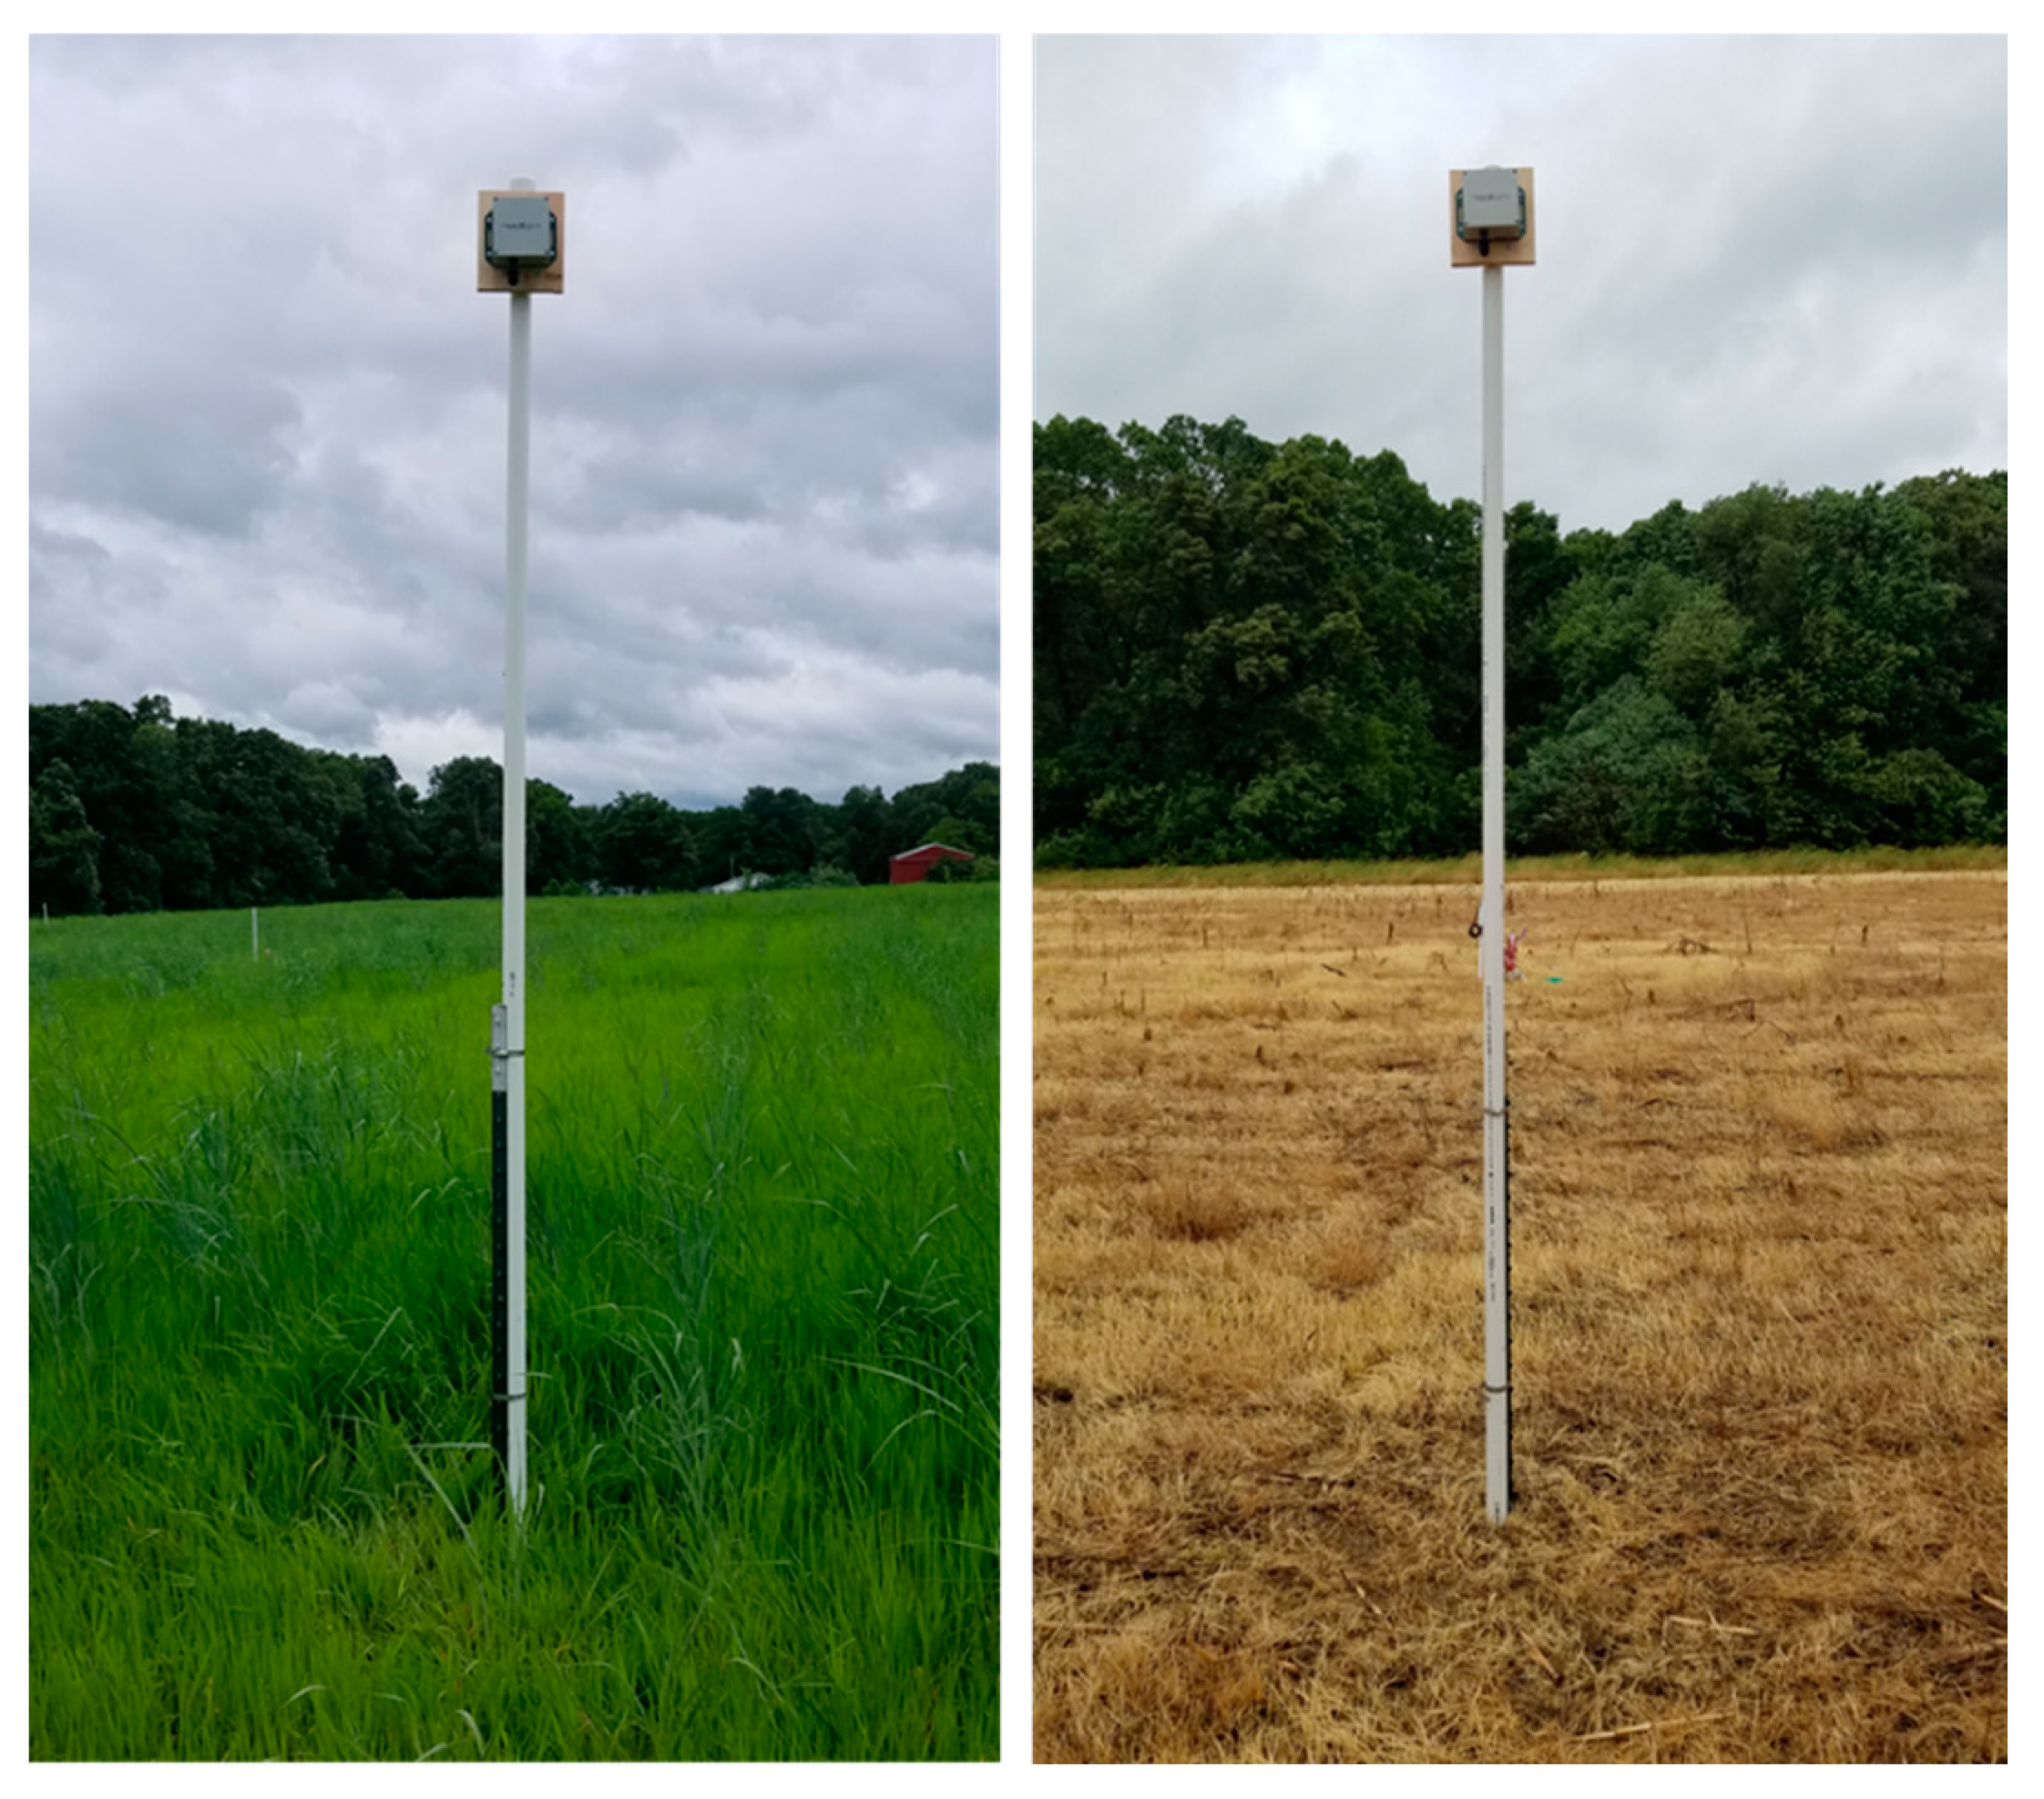
2.3. Acoustic Monitoring

Autonomous sound recorders were used to obtain a near-continuous survey of the bird species by using experimental plots. Swift sound recorders, designed and built by staff of the K. Lisa Yang Center for Conservation Bioacoustics of Cornell University’s Laboratory of Ornithology, were mounted at the top of 3.1 m-tall, 3.8 cm-diameter, and Schedule 40 white PVC pipe clamped to 1.5 m steel fence posts placed in the center of each plot at the Brighton site (Figure 3 and Figure 4). Recorders were mounted at the beginning of study periods and taken down at the end in 2020, 2021, and 2022. At the Urbana site, Swift recorders were only used in 2022, and were mounted on existing air and weather monitoring infrastructure located in the center of each plot.
Swift recorders were configured to record at a 32 kHz sampling rate and microphone gain of 33.0 dB. Recorders recorded bird sounds during daily programmed periods within the entire study period for each year. At the Brighton site, recorders were preprogrammed to record for 4.5 h each day during 8 periods as follows: for an hour near dawn (05:00–06:00) and for 30 min every other hour between 08:00 and 20:30. With 3 D-size batteries and 64 GB SD cards, recorders were able to record bird sounds for about 60 days before batteries and cards needed to be replaced. Because the Swift recorders at the Urbana site were not going to be serviced until the end of the study, they were programmed to record only for 1 h each day from 06:00 to 07:00. For most of the study, monitors were above the canopy of bioenergy crops, but those in corn plots at the Brighton site were often at the canopy level when they were taken down at the end of each study period.
Swift recorders performed well during the study. Only one recorder failed (Plot 512), and this failure apparently resulted from an unintentional impact of the recorder mounting pole with farm equipment on 16 June 2022. The battery connectors and microphone were damaged, and the unit could not be used for the remainder of the study. At the Brighton site, approximately 6840 h of recordings were obtained during the three-year study. At the Urbana site, 238 h of recordings were obtained during the one-year study.
Sound recorders captured all vocalizations within the detection range of recorders, which went well beyond the boundaries of the plots as evidenced by many woodland species being recorded at the Brighton site. Point count surveys were used to identify species that utilized experimental plots and those that were present in adjacent off-plot areas only. This enabled the elimination of off-plot-only species in the analysis, but not individuals that were within range of recorders on adjacent plots. Because the Urbana experimental plots were much bigger (3.6 ha vs. 0.4 ha on the Urbana and Brighton sites, respectively), detections were more likely to only include species that were on the same plot as the recorder. Despite some detections being from birds on adjacent plots, detections of on-plot species should dominate the detections of each recorder and serve as a meaningful index of species use of each plot.

2.4. Data Processing and Statistical Analyses

BirdNET, a deep neural network machine learning algorithm developed by Cornell University’s Yang Center for Conservation Bioacoustics and Chemnitz University [34] was used to identify bird sounds from spectrograms generated from sound recordings collected at the two study sites. The batch processing of files was accomplished using BirdNET-Analyzer version 2.4 (available at https://github.com/kahst/BirdNET-Analyzer, accessed on 18 December 2023) and generated a dataset of the species identified in 3 s segments of recordings. BirdNET-Analyzer was run using default configurations on a single compute node of “Improv”, a high-performance computing cluster operated by the Laboratory Computing Resource Center at Argonne National Laboratory. Brighton spectrograms (1.4 TB) were analyzed by BirdNET-Analyzer in approximately 11 h and generated 7.7 million observations (i.e., total number of species identifications made in 3 s intervals); Urbana spectrograms (48 gigabytes) were analyzed in less than 2 h and generated 163,000 observations.
BirdNET-Analyzer uses bird observation data from eBird, Cornell University’s citizen science program for bird observations [35], to estimate the areal range of bird species and the probability of their occurrence given latitude, longitude, and week of the year [36]. The species range model applies a cut-off threshold and excludes species below this threshold from consideration. Since the Brighton site is relatively remote and away from population centers, very few if any eBird checklists are submitted from this area. This affected the list of species that were included for consideration and eliminated some species that could occur there based on published range maps and observations during point-count surveys, especially when the week of the year was considered. Greater inclusion of species that could occur on the site was achieved by using annual rather than weekly species range models.
BirdNET-Analyzer provided an estimate of the confidence level of each species identification. For this analysis, only detections with confidence levels ≥ 0.75 were used. This confidence level has been recommended as an appropriate threshold with which to minimize false-positive detections [37]. Species detections were included in the analysis if random checks of detections on recordings verified correct identification by BirdNET-Analyzer, and the species had either been detected on plots during surveys or suitable habitats for the species occurred on the plots, and the species could occur on the plot during the months of the survey based on published accounts.
BirdNET-Analyzer output files were processed using R version 4.3.1 [38] and RStudio version 2023.12.0 [39] using the dMod version 1.0.2 [40], stringr version 1.5.1 [41], and dplyr version 1.1.4 [42] packages, and were analyzed using SAS for Windows version 9.4 [43]. Point-count survey data were processed and analyzed with SAS. Analyses of variance were performed on acoustic monitoring and point count data using the general linear model (GLM) procedure of SAS.

3. Results

3.1. Brighton Site

3.1.1. Point Counts

During 162 point count surveys conducted during the study (54 in each year), 2957 observations of individual birds, representing 68 species, were recorded on and off experimental plots. The number of species and individual observations were relatively consistent among years (51, 55, and 50 species and 876, 1059, and 1022 observations in 2020, 2021, and 2022, respectively). Of these observations, 349 birds were recorded on experimental plots during the study (including those foraging over plots), representing 21 bird species (Table 1). The number of species and individual birds varied among years (9, 12, and 17 species and 88, 150, and 111 individual birds in 2020, 2021, and 2022, respectively).
More species and more individual birds were recorded on corn plots than switchgrass plots across the three years (total of 18 vs. 13 species and 207 vs. 142 observations, respectively), but the number of individuals for many species was quite low regardless of crop type (Table 1).
The most frequently observed species on experimental plots were Indigo Bunting (119 birds), Brown-headed Cowbird (74 birds), Barn Swallow (46 birds), Purple Martin (38 birds), Field Sparrow (15 birds), and Common Yellowthroat (9 birds). Brown-headed Cowbird was the only species seen most consistently on corn plots, feeding on waste corn in the spring just after planting. Indigo Bunting occurrence on different plot types varied among years, with no difference in 2020, higher occurrence on corn in 2021, and higher occurrence on switchgrass in 2022. Species more frequently observed on switchgrass than corn were Barn Swallow, Purple Martin, and Common Yellowthroat.
A three-factor analysis of variance of the six most frequently observed species was performed using species, crop, and year as independent variables and mean counts per plot per day as the dependent variable. This analysis indicated that the main effects of year (p = 0.10) and crop (p = 0.09), and the interaction of year × crop (p = 0.07) were not significant, but the main effect of species (p < 0.001) and the interactions of year × species (p = 0.003), crop × species (p < 0.001), and year × crop × species (p = 0.01) were significant. These significant differences can be seen in Table 1; some species (Indigo Bunting and Brown-headed Cowbird) were more frequently observed than others (species main effect); some species were more frequently observed in corn (Brown-headed Cowbird) or in switchgrass (Barn Swallow, Purple Martin, and Common Yellowthroat; crop × species interaction); and some species had differences in frequency of observation in some years while not others or appeared to switch use of different crops in different years (e.g., Indigo Bunting; year × crop × species interaction).

3.1.2. Acoustic Monitoring

It was apparent when reviewing spectrograms of recordings that each recorder picked up bird sounds from surrounding habitats. Many of the species recorded were never observed on plots during point count surveys and were consistent with those identified as off-plot during point counts. It follows that recorders picked up bird sounds from adjacent plots as well. The detection of off-plot bird sounds makes it difficult to determine what birds are present on a specific plot using data from a plot’s sound recorder. Bird calls varied greatly in terms of amplitude, which was based on species-specific differences in vocalization amplitude but also distance from the sound recorder.
One hundred fifty species were identified from sound recordings at the Brighton site using the BirdNET-Analyzer. Of these, 109 species were eliminated from further consideration because the species is either not known to occur in the area during the breeding season (14 species) or does not typically utilize open habitats (95 species). Some species in the latter group were either seen or heard during point counts but only off-plot or flying over plots (44 species).
Nine species that each had >3000 detections were selected for a detailed analysis (Table 2). Of these, Henslow’s Sparrow and Vesper Sparrow were not detected during point count surveys. Results from a three-factor analysis of variance found all three main effects (species, crop, year), two-way interactions (species × crop, species × year, crop × year), and the three-way interaction (species × crop × year) to be highly significant (p < 0.001).
The most frequently detected species was Indigo Bunting. This species was detected regularly in both plot types, but most frequently on corn plots in all three years. Similarly, Brown-headed Cowbird was more frequently detected on corn plots during all three years. The number of detections of other species were more variable across years. Common Yellowthroat, Dickcissel, and Sedge Wren had more detections on switchgrass plots than on corn plots. Common Yellowthroat detections increased from 2020 to 2022, with detections increasing most on switchgrass plots. Very few Dickcissel detections were made in 2020 and 2021, but detections were frequent in 2022. Purple Martin detections were highest in 2021 and Sedge Wren detections were high only in 2020 and 2021. Most Henslow’s Sparrow detections occurred in 2020 and were on corn plots. Vesper Sparrow detections were relatively low in all years, with no difference between crop types. Field Sparrows were frequently detected in all three years on both corn and switchgrass plots; relatively more detections were made on corn plots in 2020, with other years showing little difference in the number of detections between the two crop types.
Although not included in the analysis discussed previously because of the low sample size (observed twice outside of point count surveys and detected 227 times by sound recorders), Grasshopper Sparrow was of interest because of its status as a grassland-obligate species in decline. Both observations and most detections were on switchgrass plots (76% vs. 24% on corn), and all but three detections were in June 2020.

3.2. Urbana Site

At the Urbana site, a single point count survey was conducted at each experimental plot at the beginning (9 June 2022) and the end of the study period (25 August 2022). Seven species were observed using the plots (Table 3); an additional six species were observed off-plot only. More species were observed on prairie (six) than either switchgrass (three) or miscanthus (four). More individual birds were observed on prairie (29) than switchgrass (7) or miscanthus (7). The most frequently observed species was Red-winged Blackbird (23), which was most frequently observed on prairie.
Five species that each had > 1000 acoustic monitoring detections were selected for the detailed analysis (Table 4). All species detected with sound recorders were also observed during point count surveys. A two-factor analysis of variance using species and crop as independent variables and mean detections per day as the dependent variable was performed. The main effect of species was significant (p < 0.001), but not the effect of crop (p = 0.18); however, the interaction of species × crop was significant (p < 0.001), indicating that species differed in their occurrence in different crop types.
The most frequently detected species was Dickcissel, and it was most often detected in prairie and switchgrass plots. The number of detections of Common Yellowthroat and Red-winged Blackbird were relatively similar in all three plot types. Barn Swallow and Song Sparrow were most frequently detected in miscanthus plots.

4. Discussion

The combination of point count surveys and autonomous acoustic monitoring provided a robust assessment of birds using experimental bioenergy plots. The ground truthing provided by the regular but sparse dataset of point count surveys allowed for an estimation of the species and number of individuals that used plots vs. those seen or heard outside of plot boundaries to better interpret the acoustic monitoring results, which included vocalizations of birds on adjacent plots and surrounding habitats. Limiting species detections to only those with confidence values ≥ 0.75 likely reduced the number of detections of birds that were not on the same plot as the sensor. The general agreement of the point count survey and acoustic monitoring results at the Brighton site supports the validity of using the more comprehensive dataset of species detection rates from autonomous sound recorders as an estimate of the relative abundance of birds on different crops.
Despite the ground truthing value and independent assessment provided by point-count surveys, these data alone did not give nearly as complete of an assessment of bird use of bioenergy croplands as did the near-continuous monitoring provided by autonomous sound recorders. Acoustic monitoring provided a more robust dataset that included species either not detected by point counts (Grasshopper Sparrow, Henslow’s Sparrow, and Vesper Sparrow) or detected too infrequently on plots during point count surveys to analyze (Common Yellowthroat, Dickcissel, and Sedge Wren). The acoustic data enabled the detection of differences in use among years, including insight into the potential influence of switchgrass maturity on bird use (Common Yellowthroat, Dickcissel, Grasshopper Sparrow, and Sedge Wren). Henslow’s Sparrow and Sedge Wren were detected during times when point counts were not conducted, indicating that it was the continuity of monitoring rather than the detection capability of autonomous sound recorders that produced this result. Vesper Sparrow vocalizations were detected in all months, including during point count survey periods, but all recorded vocalizations were extremely faint and either may have been missed during point counts or the recorded birds were off-plot.
Several species on the Brighton site were observed or detected most frequently on switchgrass plots, indicating the potential for switchgrass bioenergy production to provide a greater benefit to these species compared to traditional bioenergy crops like corn. Species that occurred most frequently on switchgrass plots included grassland specialists (Dickcissel, Grasshopper Sparrow, and Sedge Wren) and the Common Yellowthroat, which is not a grassland specialist, but occurs in a variety of habitats, including grassland [44]. Henslow’s Sparrow occurrence in 2020 on mostly corn plots seems anomalous, because its preferred habitat is usually dominated by tall, dense grasses with scattered forbs [45]. About 85% of Henslow’s Sparrow detections were in Plot 512, and it is possible that detections were of birds on adjacent grassland and old field habitats to the west of Plot 512 (Figure 1), or that Henslow’s Sparrows used adjacent corn plants for singing perches. It is not clear why this species was not detected more frequently on switchgrass plots in 2020 or on any plots in subsequent years.
The corn plots at Brighton in all three years had numerous patches of weeds that comprised up to 25% of the cover on these plots. The Brighton site was chosen for an evaluation of perennial bioenergy crops because of its lower yield potential for traditional row crops. Prior to the study, average yields of corn were 7.7 Mg ha−1 [46]. High weed pressure and marginal soils resulted in lower corn yields during the study period, with at least one stand failure. The presence of other plant species within the corn plots and poorer crop stand resulted in different habitat conditions than a typical monocrop stand and actually may have improved habitat conditions for birds in these plots.
Switchgrass density and height at the Brighton site changed considerably over the course of the study after the plots were planted in 2019. There was a noticeable increase in the density and height of switchgrass in 2021 and some additional increase in 2022 as the perennial switchgrass became established. With this increase in switchgrass density, there was a reduction in the number of patches of foxtail (Setaria sp.), timothy (Phleum pratense), and other weedy species that provided small openings in switchgrass cover in 2020. By September 2021 and in all of 2022, switchgrass was so dense that it became very difficult to walk through. Because corn is annual, conditions on corn plots changed little from year to year.
Changes in the density of switchgrass over the study period may have contributed to the changes in the use of switchgrass plots over time by some species (e.g., Common Yellowthroat, Dickcissel, Sedge Wren, and Grasshopper Sparrow). Detections for both Common Yellowthroat and Dickcissel increased on switchgrass plots over the course of the study period, starting in 2021 for Common Yellowthroat and 2022 for Dickcissel. In contrast, Sedge Wren detections decreased over the period. These differences may be due to changes in local population size or habitat conditions. Sedge Wrens prefer dense, tall sedges and grasses in wet meadows, hayfields, and retired croplands [47], and the decrease in 2022 is not easily explained. Grasshopper Sparrows were detected almost entirely in early June 2020 (9–28 June), indicating that this species was probably migrating through the area. Grasshopper Sparrows generally prefer moderately open grasslands and prairies with patchy bare ground [48], and the dense mature switchgrass in 2021 and 2022 may not have provided suitable habitats.
At the Urbana site, there were more Common Yellowthroat detections on switchgrass and miscanthus than prairie, but more Dickcissel detections on prairie than switchgrass with very few on miscanthus. These findings are consistent with those at the Brighton site, but indicate that prairie might provide Dickcissels a greater benefit than switchgrass. Dickcissels prefer grasslands with a high percentage of forbs (such as on the Urbana site prairie) because they provide song perches, nesting cover, nest support, and an increased abundance of invertebrate prey [49].
Switchgrass plots and the birds using those plots may continue to change over time as the perennial switchgrass becomes established and increases in density as well as height. Advanced switchgrass cultivars can reach peak biomass and maturity in as little as two years; however, the Brighton site was slower to establish due to initial weed pressure, which required reseeding in 2021; average harvested yields in 2020, 2021, and 2022 were 2.8, 6.4 and 6.6 Mg ha−1, respectively. This site was considered to have reached peak biomass yield potential by 2022. Although the switchgrass plot at the Urbana site was established in 2021, good management practices resulted in a robust stand in the establishment year. This stand reached peak yield potential by 2022, when harvested yield was around 11.2 Mg ha−1 at the end of the season. Both the prairie and miscanthus stands at the Urbana site were considered mature.
Experimental plots at the Brighton site and Urbana site were small (approximately 0.4 ha and 3.6 ha, respectively) and not representative of the expected size of actual bioenergy production sites (10 s or 100 s of hectares). The size of the plots on the Brighton site is approximately equivalent to the size of the home range (i.e., area used by an individual bird or pair during a season) of many of the species recorded on the site (e.g., Common Yellowthroat, 0.2–2.9 ha [44]; Dickcissel, 0.3 to 1.1 ha [49]; Grasshopper Sparrow, 0.2–0.9 ha [48]; Henslow’s Sparrow, 0.2–0.7 ha [45]; and Sedge Wren, 0.1–0.4 ha [47]), and would be large enough to support only one breeding pair of each species; however, birds generally select areas for occupation that are larger than their home range and based on the mix of habitats available. Birds on both sites likely responded not just to plot conditions, but also to conditions in surrounding plots and habitats.
Bioenergy production areas much larger than the experimental plots on the Brighton and Urbana sites, which were both at the precommercial scale, are expected to be more favorable to grassland birds and support a greater diversity of these species. Breeding Grasshopper Sparrows are more likely to occupy large tracts of grassland habitat rather than small fragments, and the minimum area requirement in Illinois was determined to be about 30 ha [48]. Henslow’s Sparrow also prefers large habitat areas for breeding [45]. Bird diversity was positively correlated with patch size on switchgrass and prairie plots in Michigan, USA [8,50].
The Indigo Bunting, common on both crop types on the Brighton site but not found on the Urbana site, may not be present in large monoculture bioenergy production areas except in areas adjacent to mid-succession or woodland habitats such as at Brighton [51]. Although they do not typically use intensely cultivated areas, the proximity of plots to adjacent woodland and edge habitats at the Brighton site created suitable conditions for this species. In contrast, grassland specialists are less likely to use grassland plots adjacent to forested areas [50].
Three of the four grassland species detected on our study plots have experienced significant population declines that have been largely driven by the conversion of native grasslands into row crops. A recent study has determined that the impact on grassland birds of row crop conversion appears to be significantly higher than the impact of oil and gas development [52]. Dickcissel populations declined steeply from 1966 to 1978, and then stabilized from 1979 to 2014 at about two-thirds of the 1966 level [49]. There has been a slight increase in numbers since 2015, but populations are still well below historic levels. Henslow’s Sparrows declined by 1.5% annually from 1966 to 2015 [45]. Grasshopper Sparrows in Illinois declined by 85% since the late 1960s due to the conversion of pasture into row crop. Sedge Wren population trends were generally positive in North America from 1966 to 1996, but certain regions, especially the Eastern U.S., have seen decreases [47].
Agricultural land-use types, such as small grains, hayfields, old fields, lightly grazed pastures, fallow fields, no-till crop fields, and linear strips of grassy habitat, such as fencerows and areas along streams and roads, are readily used by many grassland bird species [45,49]. The conversion of row crops into permanent grass cover through the U.S. Department of Agriculture’s Conservation Reserve Program has been very successful in creating new habitats for these and other grassland birds, and has resulted in population increases [45,47,49,53]. Based on our results, grassland birds might also benefit from the habitat created by large-scale bioenergy production areas that use advanced switchgrass cultivars, especially if interspersed with forb-rich habitats such as prairie or early succession habitats. Future research should evaluate the effects on grassland and other bird species of bioenergy production area characteristics (e.g., bioenergy crop species, production area size, plant species composition of sites and surrounding areas, and insect biomass) and consider how these effects would change under future climate conditions.

5. Conclusions

This study provided promising results that suggest that the establishment of large tracts of advanced switchgrass cultivars for bioenergy production, especially if interspersed with forb-rich habitats such as prairie or early succession habitats, could contribute to increases in and the stabilization of vulnerable grassland bird populations. The fact that several grassland bird species used relatively small switchgrass plots on our study sites is encouraging and even more species would be expected to use larger sites. Additional research is needed to address the effects on grassland and other bird species of bioenergy production area characteristics (e.g., bioenergy crop species, size of production sites, plant species composition of sites and surrounding areas, and insect biomass on production sites) and consider how these effects would change under future climate conditions. Related research, funded by the U.S. Department of Energy Bioenergy Technologies Office, is being conducted by our research group in collaboration with others and may address some of these questions.

Author Contributions

Conceptualization, K.E.L., J.F.C., C.R.Z., L.J.W. and D.L.; methodology, K.E.L., J.F.C., J.F., D.D. and L.J.W.; formal analysis, K.E.L., J.F., D.D. and L.J.W.; investigation, K.E.L.; data curation, K.E.L., J.F.C., J.F., D.D., N.N. and L.J.W.; writing—original draft preparation, K.E.L., J.F.C., C.R.Z. and L.J.W.; writing—review and editing, D.L., J.F., D.D., N.N. and M.C.N.; visualization, K.E.L.; project administration, J.F.C.; funding acquisition, M.C.N., J.F.C. and D.L. All authors have read and agreed to the published version of the manuscript.

Funding

This research was funded by the U.S. Department of Energy, Energy Efficiency and Renewable Energy, Bioenergy Technologies Office, grant number DE-EE0008521. The views expressed in this article do not necessarily represent the views of the DOE or the US Government. This manuscript has been created by UChicago Argonne, LLC, Operator of Argonne National Laboratory (“Argonne”). Argonne, a U.S. Department of Energy (DOE) Office of Science laboratory, is operated under contract no. DE-AC02-06CH11357. The U.S. Government retains for itself, and others acting on its behalf, a paid-up nonexclusive, irrevocable worldwide license in said article to reproduce, prepare derivative works, distribute copies to the public, and perform publicly and display publicly, by or on behalf of the Government.

Institutional Review Board Statement

Not applicable.

Informed Consent Statement

Not applicable.

Data Availability Statement

Data can be available upon request.

Acknowledgments

The authors would like to thank the staff, students, and site managers/landowners who assisted with crop and site management and coordination for data collection. We gratefully acknowledge the computing resources provided on Improv, a high-performance computing cluster operated by the Laboratory Computing Resource Center at Argonne National Laboratory.

Conflicts of Interest

The authors declare no conflicts of interest.

References

  1. Langholtz, M.H.; Stokes, B.J.; Eaton, L.M. Billion-Ton Report: Advancing Domestic Resources for a Thriving Bioeconomy; U.S. DOE Energy Efficiency and Renewable Energy Bioenergies Technologies Office: Washington, DC, USA; Oak Ridge National Laboratory: Oak Ridge, TN, USA, 2016; pp. 1–411.
  2. U.S. Department of Energy. 2023 Billion-Ton Report: An Assessment of U.S. Renewable Carbon Resources; Oak Ridge National Laboratory: Oak Ridge, TN, USA, 2024; ORNL/SPR-2024/3103. [CrossRef]
  3. Fargione, J.E.; Cooper, T.R.; Flaspohler, D.J.; Hill, J.; Lehman, C.; Tilman, D.; McCoy, T.; McLeod, S.; Nelson, E.J.; Oberhauser, K.S. Bioenergy and wildlife: Threats and opportunities for grassland conservation. BioScience 2009, 59, 767–777. [Google Scholar] [CrossRef]
  4. Hoekman, S.K.; Broch, A.; Liu, X.V. Environmental implications of higher ethanol production and use in the US: A literature review. Part I–Impacts on water, soil, and air quality. Renew. Sustain. Energy Rev. 2018, 81, 3140–3158. [Google Scholar] [CrossRef]
  5. Mumm, R.H.; Goldsmith, P.D.; Rausch, K.D.; Stein, H.H. Land usage attributed to corn ethanol production in the United States: Sensitivity to technological advances in corn grain yield, ethanol conversion, and co-product utilization. Biotechnol. Biofuels 2014, 7, 61. [Google Scholar] [CrossRef] [PubMed]
  6. United States Department of Agriculture Economic Research Service. Feed Grains: Yearbook Tables. Available online: https://www.ers.usda.gov/data-products/feed-grains-database/feed-grains-yearbook-tables (accessed on 15 February 2024).
  7. Beckmann, M.; Gerstner, K.; Akin-Fajiye, M.; Ceaușu, S.; Kambach, S.; Kinlock, N.L.; Phillips, H.R.; Verhagen, W.; Gurevitch, J.; Klotz, S. Conventional land-use intensification reduces species richness and increases production: A global meta-analysis. Glob. Chang. Biol. 2019, 25, 1941–1956. [Google Scholar] [CrossRef]
  8. Robertson, B.A.; Doran, P.J.; Loomis, E.R.; Robertson, J.R.; Schemske, D.W. Avian use of perennial biomass feedstocks as post-breeding and migratory stopover habitat. PLoS ONE 2011, 6, e16941. [Google Scholar] [CrossRef] [PubMed]
  9. Werling, B.P.; Dickson, T.L.; Isaacs, R.; Gaines, H.; Gratton, C.; Gross, K.L.; Liere, H.; Malmstrom, C.M.; Meehan, T.D.; Ruan, L. Perennial grasslands enhance biodiversity and multiple ecosystem services in bioenergy landscapes. Proc. Natl. Acad. Sci. USA 2014, 111, 1652–1657. [Google Scholar] [CrossRef]
  10. Lark, T.J.; Spawn, S.A.; Bougie, M.; Gibbs, H.K. Cropland expansion in the United States produces marginal yields at high costs to wildlife. Nat. Commun. 2020, 11, 4295. [Google Scholar] [CrossRef]
  11. Ssegane, H.; Negri, M.C.; Quinn, J.; Urgun-Demirtas, M. Multifunctional landscapes: Site characterization and field-scale design to incorporate biomass production into an agricultural system. Biomass Bioenergy 2015, 80, 179–190. [Google Scholar] [CrossRef]
  12. Ferrarini, A.; Serra, P.; Almagro, M.; Trevisan, M.; Amaducci, S. Multiple ecosystem services provision and biomass logistics management in bioenergy buffers: A state-of-the-art review. Renew. Sustain. Energy Rev. 2017, 73, 277–290. [Google Scholar] [CrossRef]
  13. Zumpf, C.; Quinn, J.; Cacho, J.; Grasse, N.; Negri, M.C.; Lee, D. Invertebrate and plant community diversity of an Illinois corn–soybean field with integrated shrub willow bioenergy buffers. Sustainability 2021, 13, 12280. [Google Scholar] [CrossRef]
  14. Mosier, S.; Córdova, S.; Robertson, G.P. Restoring soil fertility on degraded lands to meet food, fuel, and climate security needs via perennialization. Front. Sustain. Food Syst. 2021, 5, 706142. [Google Scholar] [CrossRef]
  15. Staie, B.; Kinzer, A.; Macknick, J.; Wang, Y.; Cortright, R.; Foust, T.; Ghantous, S.; Lamers, P.; Steward, D. Pathways for Agricultural Decarbonization in the United States; National Renewable Energy Laboratory (NREL): Golden, CO, USA, 2024.
  16. Nassauer, J.I.; Opdam, P. Design in science: Extending the landscape ecology paradigm. Landsc. Ecol. 2008, 23, 633–644. [Google Scholar] [CrossRef]
  17. Brandes, E.; McNunn, G.S.; Schulte, L.A.; Bonner, I.J.; Muth, D.J.; Babcock, B.A.; Sharma, B.; Heaton, E.A. Subfield profitability analysis reveals an economic case for cropland diversification. Environ. Res. Lett. 2016, 11, 014009. [Google Scholar] [CrossRef]
  18. Ssegane, H.; Negri, M.C. An integrated landscape designed for commodity and bioenergy crops for a tile-drained agricultural watershed. J. Environ. Qual. 2016, 45, 1588–1596. [Google Scholar] [CrossRef] [PubMed]
  19. Bonner, I.J.; Cafferty, K.G.; Muth, D.J., Jr.; Tomer, M.D.; James, D.E.; Porter, S.A.; Karlen, D.L. Opportunities for energy crop production based on subfield scale distribution of profitability. Energies 2014, 7, 6509–6526. [Google Scholar] [CrossRef]
  20. Cacho, J.; Negri, M.; Zumpf, C.; Campbell, P. Introducing perennial biomass crops into agricultural landscapes to address water quality challenges and provide other environmental services. Wiley Interdiscip. Rev. Energy Environ. 2018, 7, e275. [Google Scholar] [CrossRef]
  21. Wang, M.; Han, J.; Dunn, J.B.; Cai, H.; Elgowainy, A. Well-to-wheels energy use and greenhouse gas emissions of ethanol from corn, sugarcane and cellulosic biomass for U.S. use. Environ. Res. Lett. 2012, 7, 045905. [Google Scholar] [CrossRef]
  22. Brambilla, M.; Gustin, M.; Cento, M.; Ilahiane, L.; Celada, C. Habitat, climate, topography and management differently affect occurrence in declining avian species: Implications for conservation in changing environments. Sci. Total Environ. 2020, 742, 140663. [Google Scholar] [CrossRef]
  23. Fisher, R.J.; Davis, S.K. From Wiens to Robel: A review of grassland-bird habitat selection. J. Wildl. Manag. 2010, 74, 265–273. [Google Scholar] [CrossRef]
  24. Pelosi, C.; Bonthoux, S.; Castellarini, F.; Goulard, M.; Ladet, S.; Balent, G. Is there an optimum scale for predicting bird species’ distribution in agricultural landscapes? J. Environ. Manag. 2014, 136, 54–61. [Google Scholar] [CrossRef]
  25. Kreig, J.A.; Parish, E.; Jager, H.I. Growing grasses in unprofitable areas of U.S. Midwest croplands could increase species richness. Biol. Conserv. 2021, 261, 109289. [Google Scholar] [CrossRef]
  26. Rosenburg, K.V.; Dokter, A.M.; Blancher, P.J.; Sauer, J.R.; Smith, A.C.; Smith, P.A.; Stanton, J.C.; Panjabi, A.; Helft, L.; Parr, M.; et al. Decline of the North American avifauna. Science 2019, 366, 120–124. [Google Scholar] [CrossRef] [PubMed]
  27. Douglass, D.J.T.; Waldinger, J.; Buckmire, Z.; Gibb, K.; Medina, J.P.; Sutcliffe, L.; Beckmann, C.; Collar, N.J.; Jansen, R.; Kamp, J.; et al. A global review identifies agriculture as the main threat to declining grassland birds. Ibis 2023, 165, 1107–1128. [Google Scholar] [CrossRef]
  28. With, K.A.; King, A.W.; Jensen, W.E. Remaining large grasslands may not be sufficient to prevent grassland bird declines. Biol. Conserv. 2008, 141, 3152–3167. [Google Scholar] [CrossRef]
  29. Lee, M.S.; Casler, M.; Lee, D.K. Registration of ‘Independence’ switchgrass. J. Plant Regist. 2024; in press. [Google Scholar] [CrossRef]
  30. Vogel, K.P.; Mitchell, R.; Casler, M.; Sarath, G. Registration of ‘Liberty’ switchgrass. J. Plant Regist. 2014, 8, 242–247. [Google Scholar] [CrossRef]
  31. Vogel, K.P.; Hopkins, A.; Moore, K.; Johnson, K.; Carlson, I. Registration of ‘Shawnee’ switchgrass. Crop Sci. 1996, 36, 1713. [Google Scholar] [CrossRef]
  32. Darras, K.; Batáry, P.; Furnas, B.; Celis-Murillo, A.; Van Wilgenburg, S.L.; Mulyani, Y.A.; Tscharntke, T. Comparing the sampling performance of sound recorders versus point counts in bird surveys: A meta-analysis. J. Appl. Ecol. 2018, 55, 2575–2586. [Google Scholar] [CrossRef]
  33. Ralph, C.J.; Geupel, G.R.; Pyle, P.; Martin, T.E.; DeSante, D.F. Handbook of Field Methods for Monitoring Landbirds; General Technical Report; PSW-GTR-144; Pacific Southwest Research Station, Forest Service, U.S. Department of Agriculture: Albany, CA, USA, 1993.
  34. Kahl, S.; Wood, C.M.; Eibl, M.; Klinck, H. BirdNET: A deep learning solution for avian diversity monitoring. Ecol. Inform. 2021, 61, 101236. [Google Scholar] [CrossRef]
  35. Cornell Laboratory of Ornithology. eBird. Available online: https://ebird.org/home (accessed on 15 March 2024).
  36. Kahl, S. Species Range Model Details. Available online: https://github.com/kahst/BirdNET-Analyzer/discussions/234 (accessed on 15 March 2024).
  37. Pérez-Granados, C. BirdNET: Applications, performance, pitfalls and future opportunities. Ibis 2023, 165, 1068–1075. [Google Scholar] [CrossRef]
  38. R Core Team. R: A Language and Environment for Statistical Computing; R Foundation for Statistical Computing: Vienna, Austria, 2023. [Google Scholar]
  39. Posit Team. RStudio: Integrated Development Environment for R; Posit Software, PBC: Boston, MA, USA, 2023. [Google Scholar]
  40. Kaschek, D. dMod: Dynamic Modeling and Parameter Estimation in ODE Models. Available online: https://cran.r-project.org/web/packages/dMod/index.html (accessed on 15 March 2024).
  41. Wickham, H. Stringr: Simple, Consistent Wrappers for Common String Operations. Available online: https://CRAN.R-project.org/package=stringr (accessed on 15 March 2024).
  42. Wickham, H.; Francois, R.; Henry, L.; Müller, K.; Vaughan, D. Dplyr: A Grammar of Data Manipulation. Available online: https://CRAN.R-project.org/package=dplyr (accessed on 15 March 2024).
  43. SAS Institute. SAS for Windows, 9.4; SAS Institute, Inc.: Cary, NA, USA, 2016. [Google Scholar]
  44. Guzy, M.J.; Ritchison, G. Common Yellowthroat (Geothlypis trichas), Version 1.0. In Birds of the World; Rodewald, P.G., Ed.; Cornell Lab of Ornithology: Ithaca, NY, USA, 2020. [Google Scholar]
  45. Herkert, J.R.; Vickery, P.D.; Kroodsma, D.E. Henslow’s Sparrow (Centronyx henslowii), Version 1.0. In Birds of the World; Rodewald, P.G., Ed.; Cornell Lab of Ornithology: Ithaca, NY, USA, 2020. [Google Scholar]
  46. Namoi, N.; Archer, D.; Rosenstock, T.S.; Jang, C.; Lin, C.H.; Boe, A.; Lee, D. How profitable is switchgrass in Illinois, USA? An Economic Definition of Marginal Land. Grassl. Res. 2022, 1, 111–122. [Google Scholar] [CrossRef]
  47. Herkert, J.R.; Kroodsma, D.E.; Gibbs, J.P. Sedge Wren (Cistothorus stellaris), Version 1.0. In Birds of the World; Poole, A.F., Gill, F.B., Eds.; Cornell Lab of Ornithology: Ithaca, NY, USA, 2021. [Google Scholar]
  48. Vickery, P.D. Grasshopper Sparrow (Ammodramus savannarum), Version 1.0. In Birds of the World; Poole, A.F., Gill, F.B., Eds.; Cornell Lab of Ornithology: Ithaca, NY, USA, 2020. [Google Scholar]
  49. Sousa, B.F.; Temple, S.A.; Basili, G.D. Dickcissel (Spiza americana), Version 2.0. In Birds of the World; Schulenberg, T.S., Keeney, B.K., Eds.; Cornell Lab of Ornithology: Ithaca, NY, USA, 2022. [Google Scholar]
  50. Robertson, B.A.; Doran, P.J.; Loomis, L.R.; Robertson, J.R.; Schemske, D.W. Perennial biomass feedstocks enhance avian diversity. GCB Bioenergy 2011, 3, 235–246. [Google Scholar] [CrossRef]
  51. Payne, R.B. Indigo Bunting (Passerina cyanea), Version 1.0. In Birds of the World; Poole, A.F., Ed.; Cornell Lab of Ornithology: Ithaca, NY, USA, 2020. [Google Scholar]
  52. Post van der Burg, M.; Otto, C.; MacDonald, G. Trending against the grain: Bird population responses to expanding energy portfolios in the U.S. Northern Great Plains. Ecol. Appl. 2023, 33, e2904. [Google Scholar] [CrossRef] [PubMed]
  53. Heard, L.P.; Allen, A.W.; Best, L.B.; Brady, S.J.; Burger, W.; Esser, A.J.; Hackett, E.; Johnson, D.H.; Pederson, R.L.; Reynolds, R.E.; et al. Technical Report: A Comprehensive Review of Farm Bill Contributions to Wildlife Conservation, 1985–2000; USDA/NRCS/WHMI-2000; U.S. Department of Agriculture, Natural Resource Conservation Service, Wildlife Habitat Management Institute: Washington, DC, USA, 2000.
Figure 1. Site layout and survey locations at the Brighton site. Plots with red borders are corn and those with green are switchgrass; the plot number is in the upper left of each plot. Circles mark the approximate locations of sound recorders and white triangles mark the locations of point count stations used during the study. Only one station was used in each daily survey of each plot. Adjacent unmarked plots are planted in different switchgrass varieties (‘Shawnee’ or ‘Liberty’). To the right (east) is a large area planted with corn and soybeans in rotation. Woodland habitats occur to the north, south, and west of the surveyed plots.
Sustainability 16 04807 g001
Figure 2. Site layout and survey locations at the Urbana site. The plot with the yellow border is prairie, that with the green border is switchgrass, and that with the red border is miscanthus. Circles mark the approximate locations of sound recorders and point count stations. Adjacent unmarked plots are planted in different bioenergy crops.
Sustainability 16 04807 g002
Figure 3. Swift sound recorder on wood mounting plate ready for deployment at the Brighton site.
Sustainability 16 04807 g003
Figure 4. Swift sound recorders mounted in the center of plots at the Brighton site in June 2020. Recorders were mounted in the same way and at the same locations in 2021 and 2022. Left: Plot 511 (switchgrass); right: Plot 518 (corn).
Sustainability 16 04807 g004
Table 1. Number of observations for bird species observed on experimental plots during point count surveys at the Brighton site, Illinois, in 2020–2022 a.
Number of On-Plot Observations (Off-Plot Numbers in Parentheses)
202020212022All Years
SpeciesCOSWCOSWCOSWCOSW
Barn Swallow (Hirundo rustica)6 (1)6 (5)9 (2)15 (2)4 (3)6 (1)19 (6)27 (8)
Brown-headed Cowbird (Molothrus ater)42 (30)0 (42)16 (20)4 (32)12 (16)0 (8)70 (66)4 (82)
Common Yellowthroat (Geothlypis trichas)1 (21)0 (20)0 (26)0 (29)0 (27)8 (28)1 (74)8 (77)
Field Sparrow (Spizella pusilla)0 (32)0 (35)1 (18)3 (19)5 (32)6 (27)6 (82)9 (81)
Indigo Bunting (Passerina cyanea)13 (33)14 (32)38 (47)17 (50)13 (63)24 (59)64 (143)55 (141)
Purple Martin (Progne subis)1 (12)0 (13)9 (4)17 (1)5 (48)6 (30)15 (64)23 (44)
Blue Grosbeak (Passerina caerulea)1 (4)0 (8)1 (4)0 (3)3 (8)0 (3)5 (16)0 (14)
Cliff Swallow (Petrochelidon pyrrhonota)1 (0)0 (0)0 (0)0 (0)2 (0)4 (0)3 (0)4 (0)
Dickcissel (Spiza americana) *0 (0)0 (0)0 (0)0 (0)0 (5)1 (3)0 (5)1 (3)
Eastern Phoebe (Sayornis phoebe)0 (4)0 (3)0 (2)0 (2)1 (1)0 (1)1 (7)0 (6)
Eastern Kingbird (Tyrannus tyrannus)0 (2)0 (0)1 (6)0 (3)2 (3)0 (8)3 (11)0 (8)
European Starling (Sturnus vulgaris)0 (0)0 (8)0 (6)0 (7)2 (1)0 (16)2 (7)0 (31)
Eurasian Tree Sparrow (Passer montanus)1 (0)0 (8)2 (0)0 (0)0 (0)0 (0)3 (0)0 (8)
House Sparrow (Passer domesticus)0 (2)0 (0)0 (1)0 (0)0 (4)1 (0)0 (7)1 (0)
Northern Rough-winged Swallow (Stelgidopteryx serripennis)0 (0)0 (0)0 (1)2 (0)0 (0)0 (0)0 (1)2 (0)
Northern Cardinal (Cardinalis cardinalis)0 (15)0 (20)0 (21)0 (22)1 (15)0 (13)1 (51)0 (55)
Red-winged Blackbird (Agelaius phoeniceus)0 (17)0 (10)1 (10)0 (15)1 (13)1 (12)2 (40)1 (37)
Ruby-throated Hummingbird (Archilochus colubris)0 (0)0 (1)1 (3)2 (2)0 (0)0 (0)1 (3)2 (3)
Song Sparrow (Melospiza melodia)0 (11)0 (11)4 (3)0 (5)0 (2)0 (3)4 (16)0 (19)
Tree Swallow (Tachycineta bicolor)2 (5)0 (0)0 (0)0 (0)0 (0)2 (0)2 (5)2 (0)
Willow Flycatcher (Empidonax trailii)0 (0)0 (0)0 (0)0 (0)1 (0)0 (0)1 (0)0 (0)
Unidentified0 (5)0 (9)4 (3)3 (7)0 (0)0 (3)4 (8)3 (16)
Number of species b9 (14)2 (14)11 (16)7 (14)13 (15)10 (14)18 (18)13 (16)
Number of birds68 (194)20 (225)87 (177)63 (199)52 (241)59 (212)207 (612)142 (636)
Number of surveys c2727272727275454
Number of birds per survey2.5 (7.2)0.7 (8.3)3.2 (6.6)2.3 (7.4)1.9 (8.9)2.2 (7.9)3.8 (11.3)2.6 (11.8)
a Observations represent the number of individual birds seen or heard during each survey. CO = corn, SW = switchgrass. Cells with color indicate species with relatively large differences between crop types in each year; darker shades of each color indicate higher values in that crop type. Grassland specialists are indicated with an asterix (*). b Does not include unidentified species. c There were 9 days of survey in 3 plots each of corn and switchgrass in each year.
Table 2. Mean number of detected vocalizations for the most frequently detected species at the Brighton site, Illinois, in 2020–2022 a.
Mean Number of Detected Vocalizations/Plot/Day
202020212022All Years
SpeciesCOSWCOSWCOSWCOSW
Brown-headed Cowbird (Molothrus ater)8.931.028.611.261.690.326.810.91
Common Yellowthroat (Geothlypis trichas)0.920.661.535.521.4234.031.2711.62
Dickcissel (Spiza americana) *0.010.040.070.044.8414.711.374.12
Field Sparrow (Spizella pusilla)13.829.9812.2511.2617.2717.6914.2412.57
Henslow’s Sparrow (Centronyx henslowii) *8.231.480.280.020.010.013.190.57
Indigo Bunting (Passerina cyanea)215.1791.58166.04136.18273.64118.36214.44114.46
Purple Martin (Progne subis)1.411.904.796.550.541.352.343.35
Sedge Wren (Cistothorus stellaris) *1.2421.990.1213.860.000.060.5113.07
Vesper Sparrow (Pooecetes gramineus)3.032.733.112.621.451.032.622.22
a Species with total detections > 3000 were included in the analysis. The number of days evaluated in 2020, 2021, and 2022 equaled 100, 92, and 74, respectively. The number of plots evaluated was three for each crop type in each year except that there were only two plots evaluated for corn in 2022 due to damage sustained by the recorder in one plot at the beginning of the year. CO = corn, SW = switchgrass. Cells with color indicate species with relatively large differences between crop types in each year; darker shades of each color indicate higher values in that crop type. Grassland specialists are indicated with an asterix (*).
Table 3. Number of observations for bird species observed on experimental plots during point count surveys at the Urbana site, Illinois, in 2022.
Number of On-Plot Observations
(Off-Plot Numbers in Parentheses)
Species aMiscanthusPrairieSwitchgrass
Barn Swallow (Hirundo rustica)3 (0)3 (0)5 (0)
Common Yellowthroat (Geothlypis trichas)0 (0)1 (0)0 (0)
Dickcissel (Spiza americana) *0 (0)2 (0)1 (1)
Ring-necked Pheasant (Phasianus colchicus)0 (0)1 (0)0 (0)
Red-winged Blackbird (Agelaius phoeniceus)2 (5)21 (0)0 (8)
Song Sparrow (Melospiza melodia)1 (0)1 (0)0 (0)
Tree Swallow (Tachycineta bicolor)1 (0)0 (0)1 (0)
Number of birds7 (5)29 (0)7 (1)
a Grassland specialists are indicated with an asterix (*).
Table 4. Mean number of detected vocalizations for the most detected species at the Urbana site, Illinois, in 2022 a.
Mean Number of Detections/Day
SpeciesMiscanthusPrairieSwitchgrass
Barn Swallow (Hirundo rustica)26.310.311.56
Common Yellowthroat (Geothlypis trichas)22.1015.9323.10
Dickcissel (Spiza americana) *1.4092.4255.81
Red-winged Blackbird (Agelaius phoeniceus)9.159.7612.32
Song Sparrow (Melospiza melodia)17.940.930.04
a Species with total detections > 1000 were included in the analysis. The number of days evaluated in 2022 was 72. A single plot was evaluated for each crop type. Grassland specialists are indicated with an asterix (*).
Disclaimer/Publisher’s Note: The statements, opinions and data contained in all publications are solely those of the individual author(s) and contributor(s) and not of MDPI and/or the editor(s). MDPI and/or the editor(s) disclaim responsibility for any injury to people or property resulting from any ideas, methods, instructions or products referred to in the content.

