Article

Unveiling Climate Trends and Future Projections in Southeastern Brazil: A Case Study of Brazil’s Historic Agricultural Heritage

by
Lucas da Costa Santos
1,*,
Lucas Santos do Patrocínio Figueiró
1,
Fabiani Denise Bender
2,
Jefferson Vieira José
3,
Adma Viana Santos
1,
Julia Eduarda Araujo
1,
Evandro Luiz Mendonça Machado
1,
Ricardo Siqueira da Silva
1 and
Jéfferson de Oliveira Costa
4
1
Faculty of Agricultural Sciences, Federal University of the Jequitinhonha and Mucuri Valleys, Hwy. MGT 367 km 585, Diamantina 39100-000, MG, Brazil
2
Embrapa Digital Agriculture, Campinas 13083-896, SP, Brazil
3
Multidisciplinary Center Campus Floresta, Federal University of Acre, Canela Fina Road, km 12, Cruzeiro do Sul 69980-000, AC, Brazil
4
Minas Gerais Agricultural Research Agency (EPAMIG), Experimental Field of Gorutuba, Highway MGT 122 km 155, Nova Porteirinha 39525-000, MG, Brazil
*
Author to whom correspondence should be addressed.
Sustainability 2024, 16(11), 4811; https://doi.org/10.3390/su16114811
Submission received: 19 April 2024 / Revised: 31 May 2024 / Accepted: 3 June 2024 / Published: 5 June 2024
(This article belongs to the Section Sustainable Agriculture)

Abstract

:
The intricate relationship between climate and society in a given region demands a profound understanding of climate patterns, especially in agricultural areas like Diamantina, Minas Gerais (MG), recognized by the Food and Agriculture Organization (FAO) as the birthplace of the first Globally Important Agricultural Heritage System (GIAHS) in Brazil, situated in the southwest region of the country. Given the growing concerns about climate change, we conducted a meticulous analysis of the climatic characteristics of Diamantina-MG. To achieve this, we examined historical meteorological data from 1973 to 2022, employing the Mann–Kendall and Sen’s slope tests to analyze trends. Additionally, we utilized three global climate models (GCMs) under different shared socioeconomic pathways (SSPs) to predict future climate scenarios (2021–2100) based on the projections of the sixth phase of the Coupled Model Intercomparison Project (CMIP6). Furthermore, we used Köppen and Thornthwaite climate classification methodologies to characterize both the current and future climate conditions of the region. Our results indicate that, historically, Diamantina-MG has experienced significant increases in minimum temperature, indicating a warmer climate in recent decades. For temperature, the projections show a consensus among models, projecting a continuous increase, potentially reaching up to 5.8 °C above the historical average temperature (19.2 °C) by the end of the century. Regarding rainfall projections, they show greater uncertainty, with discrepancies among models observed until 2060. However, specifically for the second half of the century (2060–2100), the models agree that there will be increases in annual rainfall. Regarding the climatic types of the region, we found that the current Köppen Cwb and Thornthwaite B3rB’3a’ classifications could shift to Aw and B1wA’a’, representing a humid tropical savanna climate with longer periods of water deficiency, considering the impacts resulting from increased air temperature and evapotranspiration. In summary, the study’s results indicate that climate changes are occurring and are likely to intensify in the Jequitinhonha Valley region, MG, in the future. The analysis of these data, from the perspective of the Brazilian GIAHS sustainability, reveals the importance of considering adaptation and mitigation measures to ensure the resilience of agricultural systems and local communities in the region that face these significant environmental changes.

1. Introduction

The intricate interplay between climate dynamics and the socioeconomic context of a region demands a comprehensive understanding of climate patterns, trends, and future projections. This need is particularly pronounced in regions with a rich agricultural heritage, such as Diamantina in Minas Gerais, situated in the landscape of the Upper Jequitinhonha Valley (Southern Espinhaço Range), and the birthplace of Brazil’s first Globally Important Agricultural Heritage System [1]. This GIAHS is characterized by a diverse landscape, where the Cerrado biome (Brazilian savannah) predominates. It plays a very important role in the water supply and conservation of native vegetation, being one of the world’s biodiversity hotspots. Local farmers that form the traditional agricultural communities of this system are called always-vivid collectors, a term used to describe peasants who are usually descended from Africans who constituted centers of resistance to slavery in Brazil, and whose main source of income is the collection of species flowers of species belonging to the Comanthera genre [1,2].
The Upper Jequitinhonha Valley, due to its geographical location and agricultural and historical significance, is uniquely vulnerable to climate variations [3]. Agriculture, a crucial axis of the region’s economy, is intrinsically linked to climate-dependent factors such as rainfall, temperature, and the occurrence of extreme weather phenomena (intense rains and droughts, storms, heatwaves, and cold spells), which are becoming increasingly frequent and intense [4,5,6]. Additionally, aspects related to urban planning also need to be considered, given the interdependence of this sector on water and energy availability, both of which are susceptible to climate change influences [7].
While concerns about climate change are widely acknowledged, it is crucial to transcend theoretical debate and provide concrete evidence of the reality of ongoing climate transformations. As suggested by Hansen et al. [8], it is crucial to ask the following question: is the public truly perceiving and understanding climate change? We have recently observed a significant shift in the perception of local communities regarding climate, evidenced not only by anecdotal reports but also by concrete data indicating changes in weather patterns and occurrences of meteorological extremes. These concerns are more than mere casual observations; they suggest the possibility of a profound transformation in the environmental balance of a region, with potential repercussions for the sustainability and resilience of local communities [9,10,11].
In the specific case of the Upper Jequitinhonha Valley region, climate change has direct and immediate implications for food security, biodiversity, and regional economy. In the Brazilian GIAHS, akin to other systems distributed around the globe, where traditional agricultural and cultural practices need preservation, climate alterations can destabilize the local/regional equilibrium, with likely implications for the sustainability of criteria (social, cultural, biodiversity and landscape management) that led the region to achieve the status of agricultural heritage recognized by the Food and Agriculture Organization of the United Nations (FAO). In this vein, assessing current and future climate changes can underpin the adoption of more resilient and adaptable ecological practices, as well as enhancing awareness-raising actions among future generations of traditional farmers [12].
This study embarks on a meticulous examination of the climatic characteristics of Diamantina-MG, investigating historical data to discern patterns and trends. Beyond mere observation, we aim to provide climate projections based on well-established models in the literature, enhancing our ability to anticipate future climatic scenarios. The implications of this research for sustainability are profound. By providing a detailed analysis of historical and projected climate patterns, this study offers essential insights that can guide the development of sustainable agricultural practices tailored to the specific climatic conditions of the Alto Vale do Jequitinhonha. This understanding is crucial for ensuring food security and maintaining the biodiversity that characterizes this unique region [13]. Moreover, understanding the local impacts of climate change allows for the implementation of resilient and adaptable water and energy management strategies, thereby supporting the overall sustainability of the region’s socioeconomic framework. Effective urban planning, supported by climate projections, can mitigate the adverse effects of climatic extremes on infrastructure and human settlements, enhancing community resilience [14,15,16]. Ultimately, this research contributes to the formulation of public policies that integrate environmental, economic, and social dimensions, promoting a holistic approach to sustainability that is vital for the continued prosperity and well-being of the Brazilian GIAHS. In light of this, our objective is to investigate the climatic characteristics of Diamantina-MG, considering climate classification approaches and trend analysis in both historical and future periods to identify local patterns and trends. The expectation is not only to enhance our scientific understanding but, above all, to support the development of public policies aimed at adaptive strategies in the face of an increasingly challenging climate scenario for various sectors.

2. Materials and Methods

2.1. Study Location

Diamantina is located in the Upper Jequitinhonha Valley, in Minas Gerais (southeast region of Brazil), at coordinates 18°14′ S, 43°36′ W, and an altitude of 1380 m (Figure 1). The region is situated in the Southern Espinhaço Range, acting as a regional orographic barrier and dividing important watersheds, such as the São Francisco River basin to the west, the Doce River basin to the east, and the Jequitinhonha River basin to the northeast [17].

2.2. Meteorological Data

2.2.1. Historical

Daily data on rainfall and air temperature (maximum and minimum) were obtained from the National Institute of Meteorology—INMET and the National Water Agency—ANA, from stations located within the municipality of Diamantina, MG, covering a period of 50 years (1973 to 2022). To fill in the gaps, which are typical in long historical series due to equipment failures or maintenance/calibration issues, we used the database developed by [18], which has a spatial resolution (grid spacing) of 0.1° × 0.1° for the Brazilian territory. Previous studies have demonstrated the ability of the database used here to fill gaps in historical series and its applicability in climate risk studies [19,20].
Data consistency, regarding its homogeneity, was evaluated to identify discontinuity points in the time series (rainfall and temperature). For this purpose, Pettitt’s test [21] and the standard normal homogeneity test [22] were used. These tests were selected based on their different sensitivities in detecting change points and their widespread use in testing homogeneities in climatological series.

2.2.2. Future Projections

Future climate projections were based on global climate models (GCMs) derived from the sixth phase of the Coupled Model Intercomparison Project [23], from the Intergovernmental Panel on Climate Change’s Sixth Assessment Report [24], using the WorldClim database [25]. The data generated by this database are presented with a spatial resolution of 2.5 min (~21 km2 at the Equator), in order to provide projections at a finer scale compared to coarse resolution data.
Monthly values of rainfall, as well as maximum and minimum temperature, were obtained for three GCMs (Table 1): ACCESS-CM2 [26], MIROC6 [27] and MRI-ESM2-0 [28] (hereafter referred to as ACCESS, MIROC6, and MRI), and three shared socioeconomic pathways (SSPs) combinations [29,30]; 2–4.5 (medium), 3–7.0 (high), and 5–8.5 (very high) forcing scenarios (hereafter defined to as most optimistic, intermediate, and pessimistic scenarios), projected for 20-year periods throughout the century; and 2021–2040 (short term), 2041–2060 (near medium term), 2061–2080 (late medium term), and 2081–2100 (long term). CMIP6 added the SSP3-7.0 scenario, which falls in the middle of the carbon emission range. Many consider this range the most likely to occur in the future, with some mitigation efforts, but without achieving all goals. Thus, in the present study, we considered results from a more optimistic scenario (SSP2-4.5), the middle-of-the-road (SSP3-7.0), and the worst-case scenario (SSP5-8.5) regarding carbon emissions. Regarding the adopted GCMs models, previous findings [31,32,33] demonstrate that these models have shown superior performance in Brazil.

2.2.3. Climate Trend Analysis: Historical Data

Trend analysis in historical rainfall and temperature series was assessed using the Mann–Kendall test [34,35], which is utilized to detect monotonic trends (either increasing or decreasing) and is widely employed for trend detection in time series data due to its simplicity, robustness, and independence from any specific statistical distribution. In cases where there may be inconsistencies in the data series, the non-parametric Mann–Kendall test is advantageous as its statistic is based on the signs (+ or −) rather than the values of a random variable, thereby making the determined trends less affected by inconsistencies. Additionally, the magnitude of the trend, i.e., the change per unit of time in the time series, was evaluated using Sen’s estimator [36]. The slope of the trend provides the rate of increase or decrease in the trend, as well as its direction. Seasonal analyses were also considered, wherein we proceeded as follows: summer (January, February, and March), autumn (April, May, and June), winter (July, August, and September), and spring (October, November, and December).

2.2.4. Current and Future Climate Classification

To analyze climate typologies, we used the Köppen and Thorthwaite methodologies. Köppen’s classification was implemented based on the methodology proposed by Vianello and Alves [37], while for the Thornthwaite classification we used Thornthwaite [38]. The approach considered daily historical data (1993–2022) and projections of future scenarios.
Two or three characters symbolize the Köppen classification. The first indicates the climatic zone and is defined by air temperature and precipitation; the second considers the seasonal distribution of rainfall, while the third takes into account the temporal variability of air temperature.
Thornthwaite’s climatic classification considers a hypothetical crop, which is viewed as the medium through which water is transported from the soil to the atmosphere. Thus, a particular climatic type can be defined as dry or humid based on the water needs of plants (water balance). The method was originally developed based on two equations that are direct functions of potential evapotranspiration (PET). The equations are the moisture index (Im, Equations (1)–(3)) and the thermal efficiency index.
Im = Ih 0 . 6   ×   Ia
Ih = SUR   PET   ×   100
Ia = DEF   PET   ×   100
where Ih and Ia are the hydrological and aridity indices, respectively. DEF (= PET − AET) represents the water deficit in the soil–plant system (mm), SUR is the water surplus in the soil–plant system (mm), and AET is the actual evapotranspiration (mm). DEF, SUR, and AET were estimated based on the water balance required for Thornthwaite classification, using the method proposed by Thornthwaite and Mather [39], with an available water capacity of 100 mm. Potential evapotranspiration was estimated using the method of Thornthwaite [38].

3. Results and Discussion

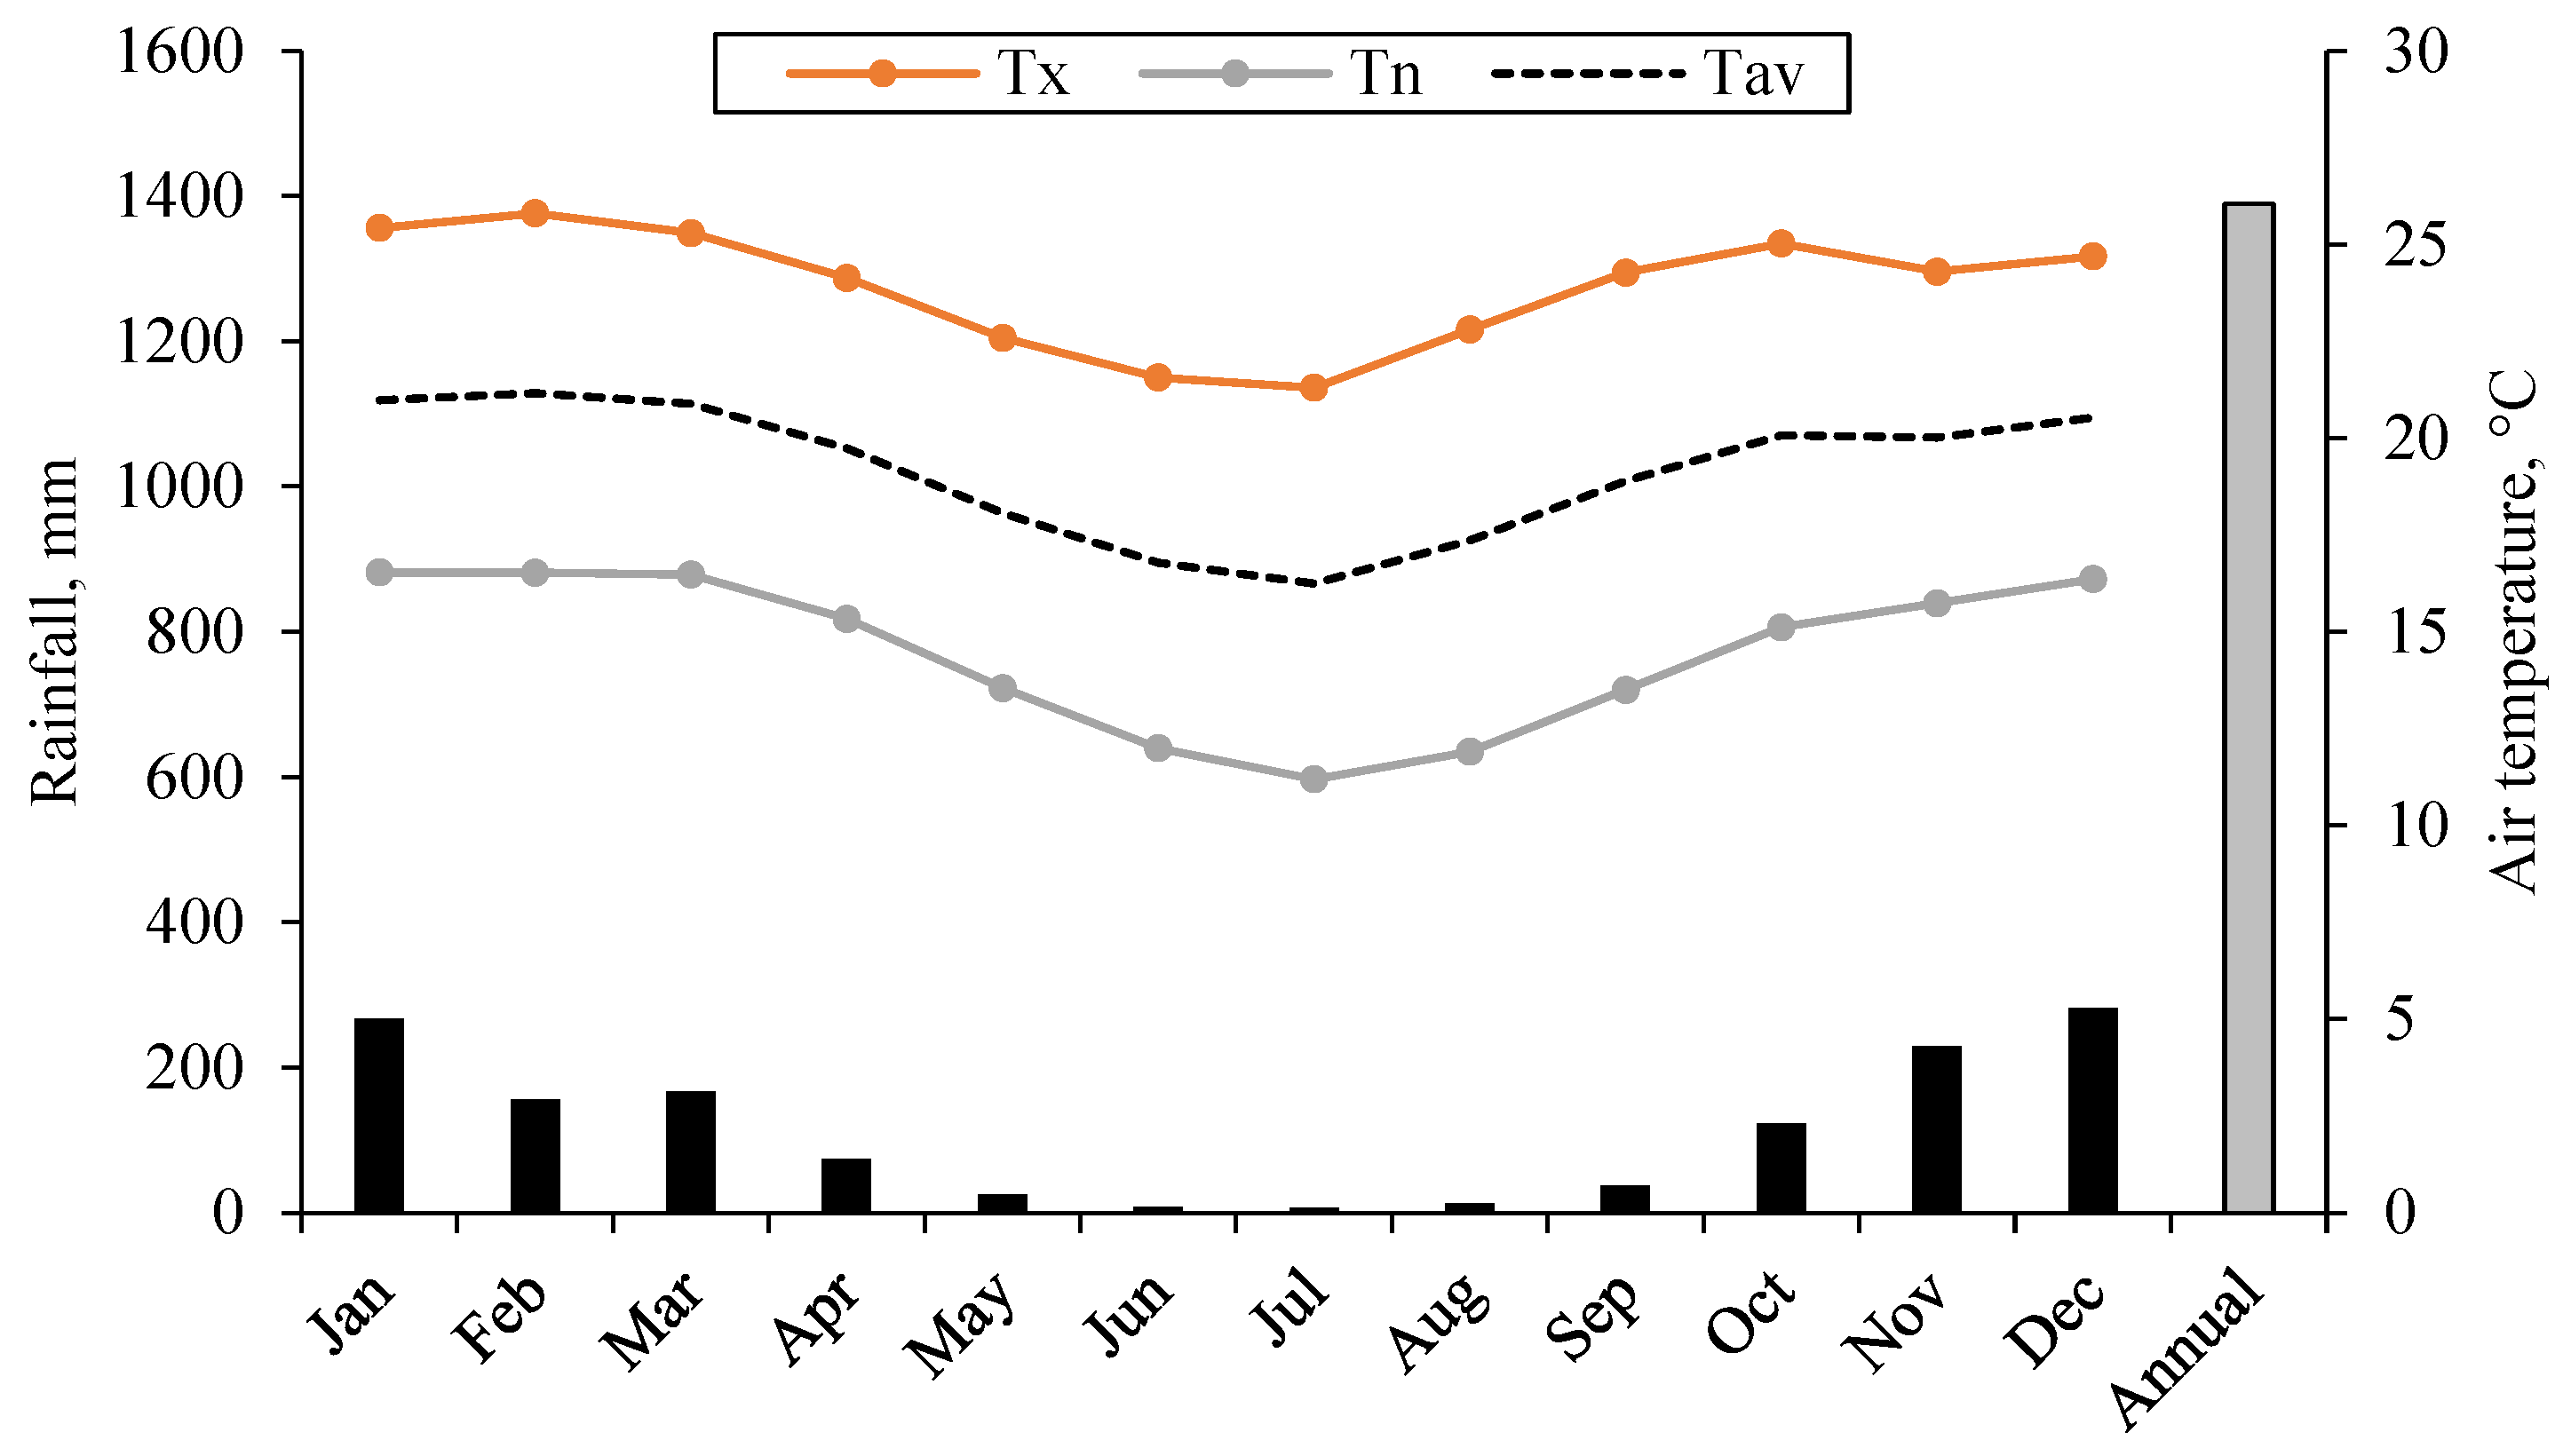
3.1. Current Climatology

The average trends for rainfall and air temperatures for the period from 1973 to 2022 are presented in Figure 2. The annual average temperature was 19.2 °C, with the minimum observed in July (11.2 °C) and the maximum in February (25.8 °C). In this application, the average temperature was obtained from the simple arithmetic mean derived from the maximum and minimum temperatures; this approach differs from the methodology employed by INMET, which uses the compensated mean.
The average rainfall for the period was 1388.9 mm, with extreme values ranging from 732.6 mm (2014) to 2147.8 mm (1992) in the annual accumulation. Historically, July is the driest month, with an average monthly accumulation of 7.2 mm. On the other hand, December is the rainiest month, with an average monthly accumulation of 282 mm.
Spring (OND) and summer (JFM) constitute the rainy season in Diamantina-MG, contributing 46% and 43% of the total annual rainfall (with December and January accounting for about 40% of the total precipitation). Winter is the driest season in the region, contributing only 4% of the annual rainfall.
When comparing rainfall accumulations between decades, we noticed no significant divergence among four of the five studied decades (1973–1982; 1983–1992; 1993–2002; and 2003–2012). However, particularly for the last decade (2013–2022), we observed a 9% reduction compared to the climatological norm (1388.9 mm). This result can be attributed to the year 2014, for which the lowest annual accumulation in the evaluated historical series was recorded (732.6 mm). According to Braga [40] and Marengo et al. [41], the main cause for the reduced rainfall volume that affected the southeastern portion of the country that year was the intense and persistent action of a high-pressure atmospheric system, which hindered the activity of rain-forming systems such as the South Atlantic Convergence Zone and cold fronts.

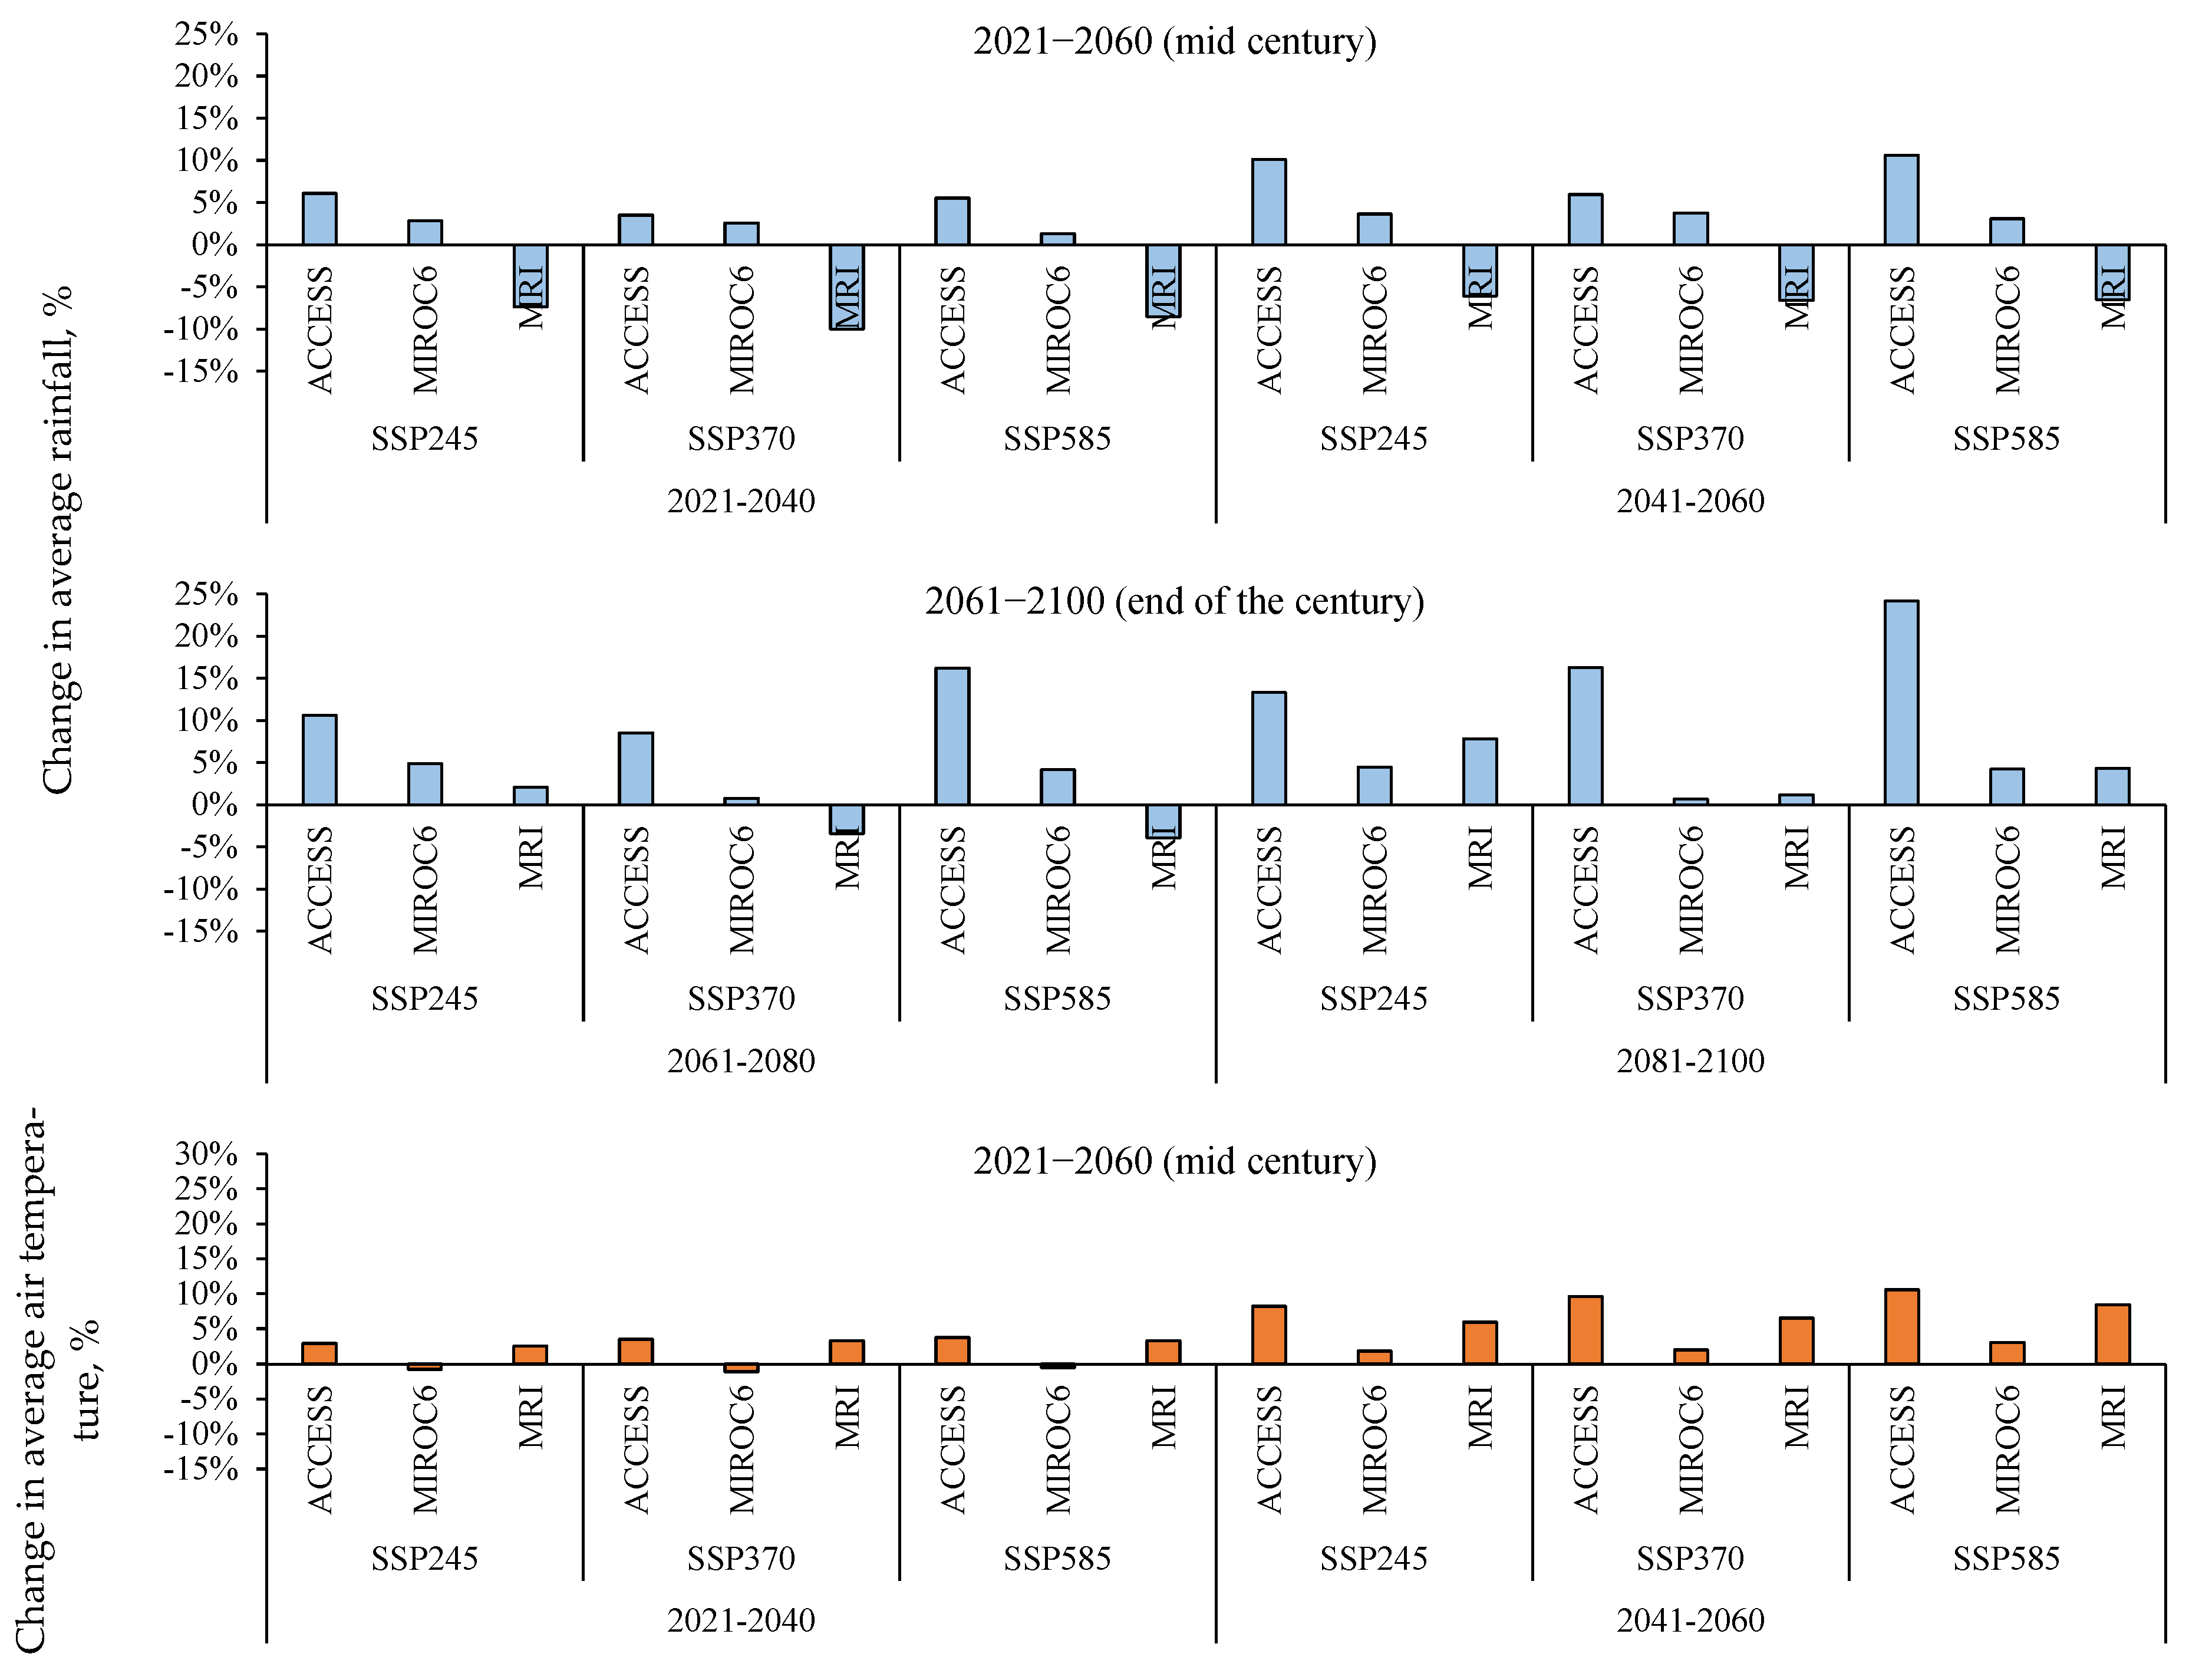
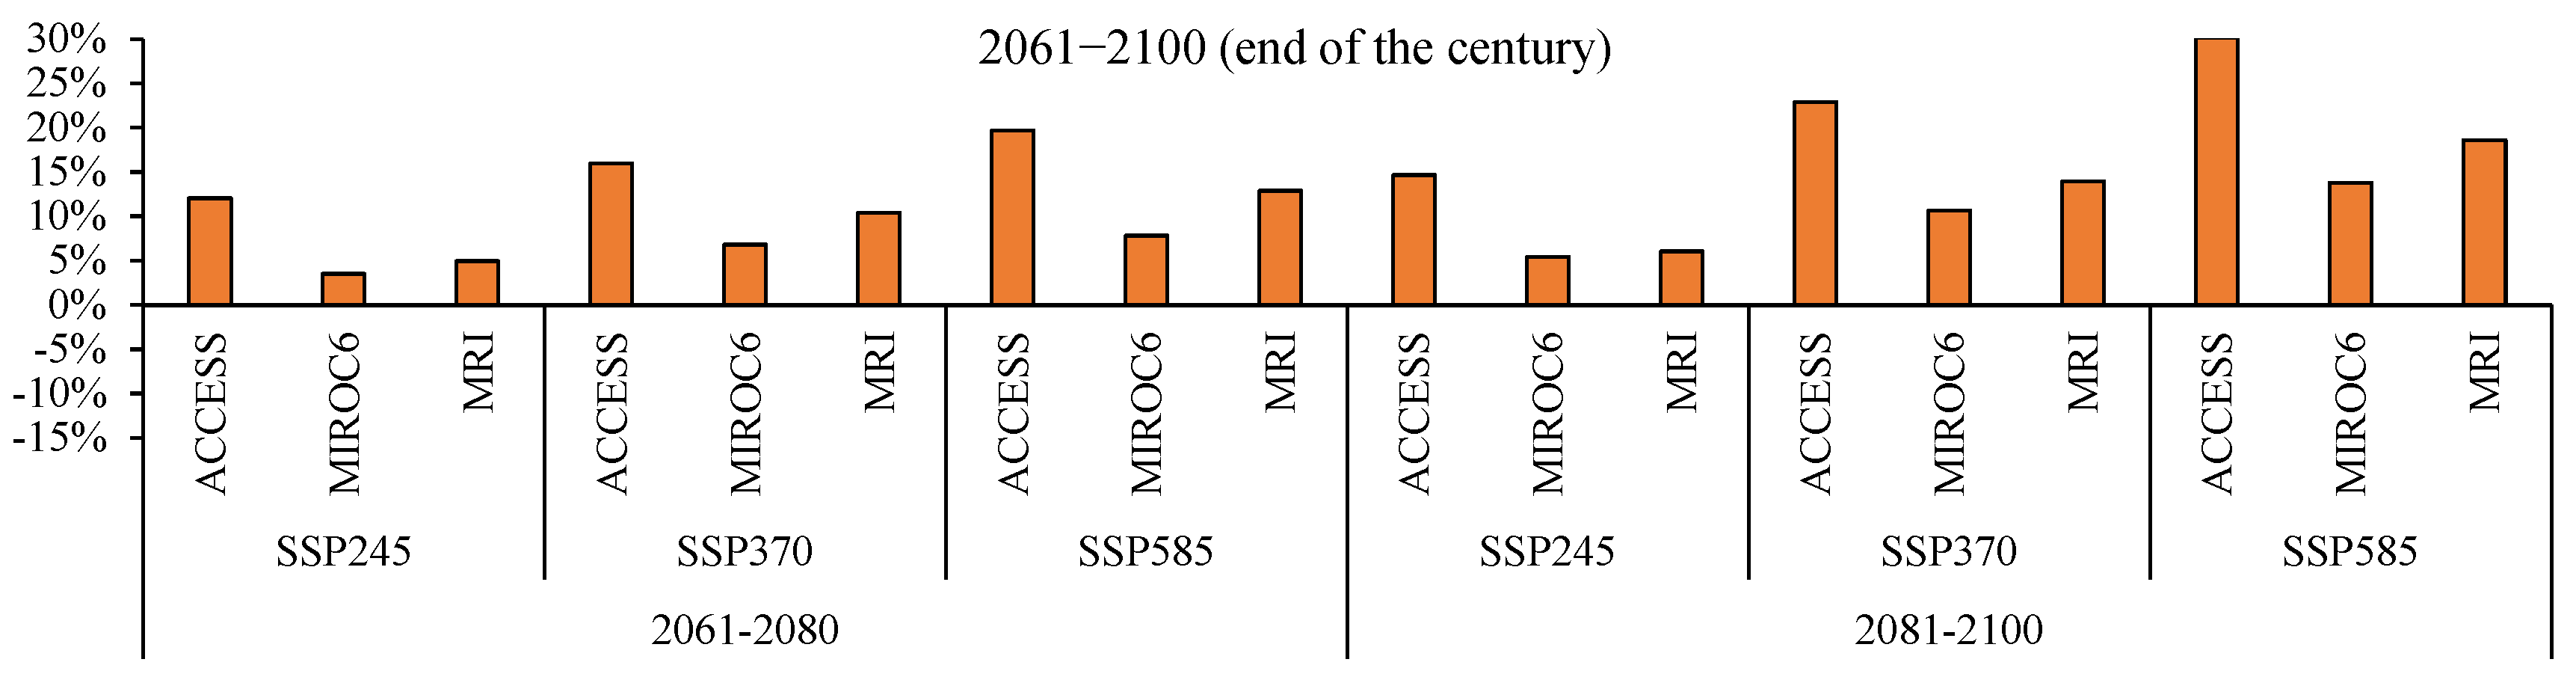
3.2. Future Trends and Projections
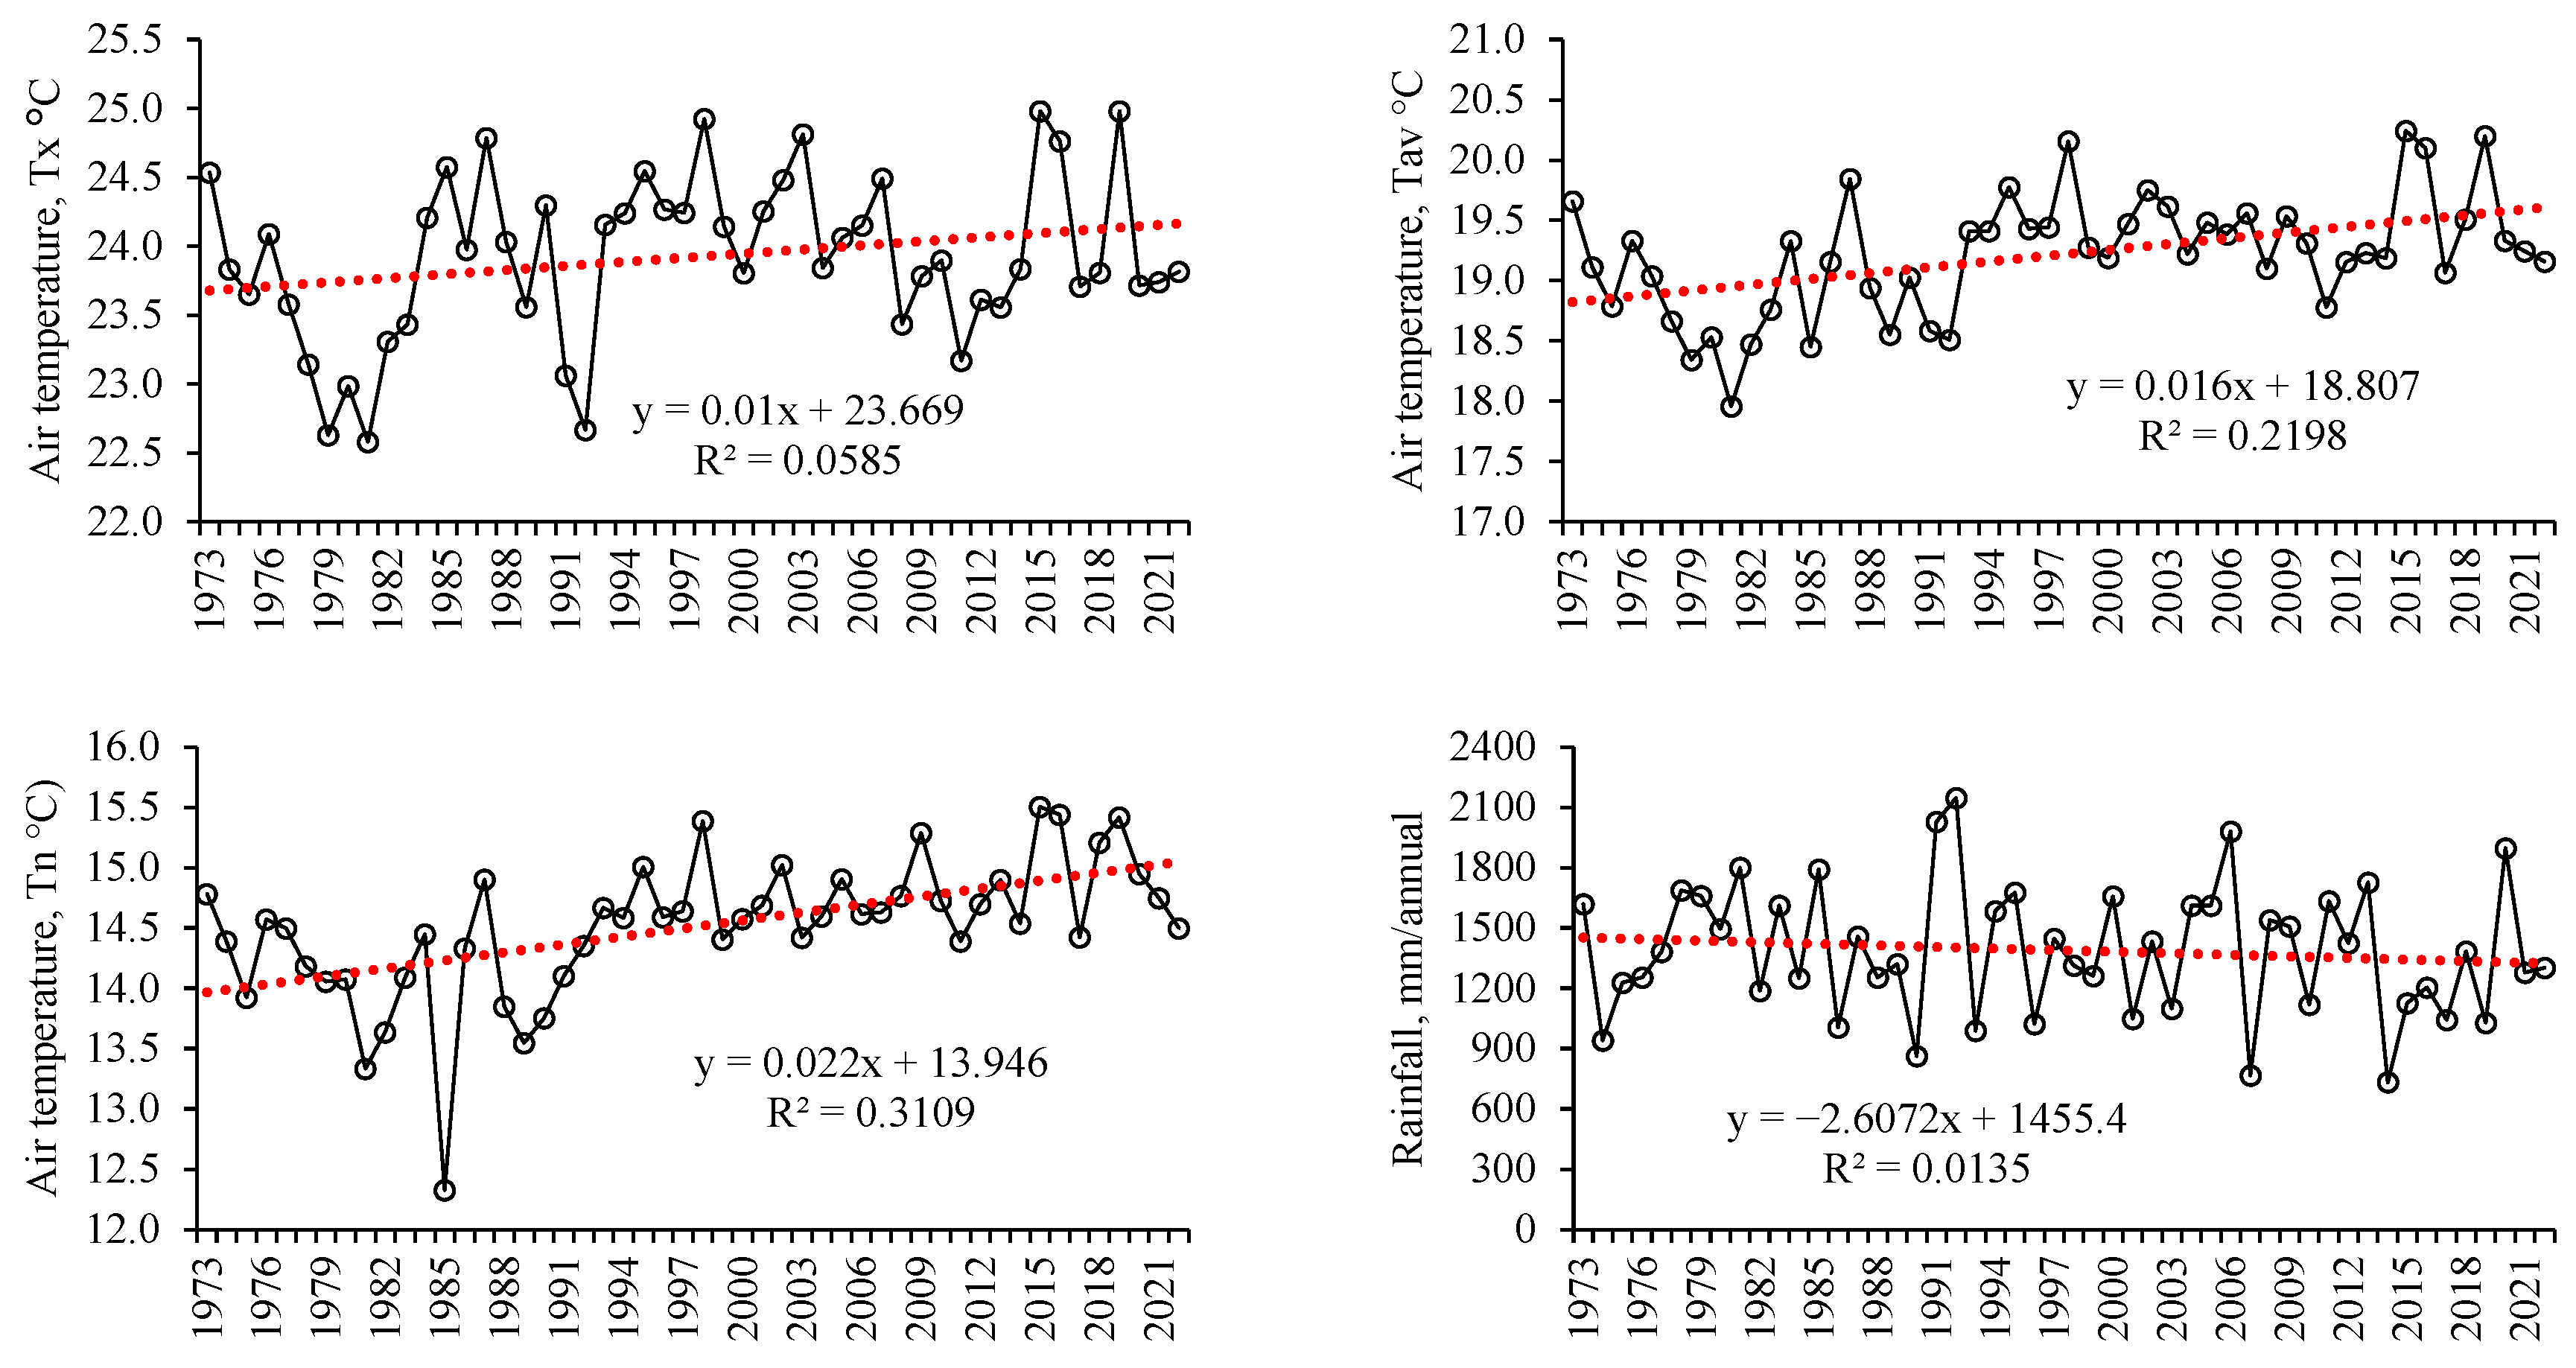
The monthly, annual, and seasonal averages of time series of climatic elements such as air temperature (maximum, minimum, and mean) and rainfall (1973–2022) were analyzed to understand the temporal trends of these meteorological variables for the municipality of Diamantina-MG. Table 2 presents the Mann–Kendall (MK) statistics and Sen’s slope estimator, considering a significance level of 5%. In the MK test, parameters such as Kendall’s tau, S statistic, and Z statistic were considered to identify increasing or decreasing trends in the time series. Sen’s test was used to assess the magnitude of the trends (rates of increase/decrease). The results of the tests are discussed in detail separately for each meteorological element.

3.2.1. Temperature

For the variable minimum air temperature (Tn), we identified a widespread, increasing trend at annual, seasonal, and monthly scales (except for the months of May and August, which were not statistically significant (p > 0.05). As shown in Table 2, Tn is consistently rising in Diamantina-MG at a rate of up to 0.035 °C per year (October). For the maximum temperature variable (Tx), we observed a distinct behavior from that observed for Tn, where, despite a predominant increasing trend, it was not statistically significant at the 5% probability level. Regarding the average air temperature (Tav), although all months showed an increasing trend in Tav, only five of them (Jan-Jun-Sep-Oct-Dec) had a significant increase (p ≤ 0.05). At the annual scale and two seasons of the seasonal scale (winter and spring), positive and significant increasing trends were also observed.
Overall, we found that air temperature is consistently rising in Diamantina-MG (Figure 3), which aligns with a manifestation of climate change. In Brazil, this trend was also observed by Almeida et al. [42] and Carvalho et al. [43] in studies conducted in the Legal Amazon and Northeast Region of the country, respectively.
Historically, the annual temperature has shown an increasing trend, although this is significant only in the case of minimum and average temperatures. This condition may be caused by not only warming induced by anthropogenic greenhouse gas emissions (GHGs) but also regional processes, such as urbanization, land use, and land cover change, which alter energy balance, favoring surface warming [44,45]. Indeed, previous studies have identified a global trend of greater increase in minimum temperatures compared to maximum temperatures, reducing the diurnal temperature range [46,47].
Despite a large amount of evidence of increases in air temperature worldwide, the precise estimation of temporal trends remains a matter that requires further research given the regional geographical particularities, especially location and topography. As pointed out by El Kasri et al. [48], a temperature increase tends to increase the atmosphere’s capacity to retain water through evaporation and transpiration processes, particularly in mountainous regions where the effect of relief (altitude) is pronounced, there is an expectation of increased rainfall, especially orographic rainfall, which has local characteristics. In Diamantina-MG, as will be presented later, there are projections of increased precipitation in the future, with more pronounced increments in the second half of the century.
In the analysis of the future climate projection of Diamantina-MG, increases in air temperature are projected, as shown in Figure 4. By the middle of the century (2021–2060), increases of up to 1.4 °C are expected in a more pessimistic scenario (SSP585), considering the average of the three evaluated GCMs compared to current climatology (1973–2022). On the other hand, in the more optimistic scenario (SSP245), the increment is 1.1 °C. In the comparative analysis between models, ACCESS projects more significant increases (2.1 °C), while MIROC6 projects a value of 0.1 °C below the historical average (19.2 °C).
More significant increases were projected for the second half of the century (2061–2100) of around 4.0 °C (average of the 3 GCMs in the SSP585 scenario). The optimistic and intermediate scenarios predict temperature increases of 1.3 °C and 2.2 °C, respectively. In the intermodel analysis, all scenarios indicate an increase in temperature in Diamantina-MG, with ACCESS projecting the highest increments (30%, equivalent to an increase of 5.8 °C compared to the historical average).
Comparing projections between models, we observe a decrease in temperature, less pronounced in the short term (2021–2040), only for the MIROC model. From 2041 onwards, until the end of the century, there is agreement in warming projections between models, regardless of the scenario considered. Therefore, under future climate conditions, except for the MIROC model in the short term, which projects a decrease of 1% compared to climatology, projections indicate warming conditions. These projected temperature increases for Diamantina-MG can impact various economic activities in the region significantly, such as the extraction of endemic species, such as Actinocephalus polyanthus [1,49], as well as microbial decomposition rates and groundwater levels in tropical peatlands areas [50]. The Serra do Espinhaço Meridional, where Diamantina-MG is located, has more than 14,000 ha of peatlands, responsible for retaining about 142 million m³ of water and approximately 3.6 million tons of carbon [10,51]. As reported by Barral et al. [9] and Costa et al. [11], disturbances resulting from anthropogenic action in peatlands or vegetation distribution, such as the release of greenhouse gases on a macro scale and fires and erosive processes on meso and topographic scales, can negatively impact ecosystem services in these systems, thereby reducing their water retention capacity and accelerating carbon losses.

3.2.2. Rainfall

Regarding rainfall observed in the last 50 years, despite identifying trends of reduction in the annual accumulation (Figure 3), these were not significant at 5% probability (Table 2). At the seasonal scale, we found positive trends for spring and autumn, while negative trends were identified in summer and winter, although all were not significant (p > 0.05). Monthly, a positive (non-significant) trend was observed in Feb, Apr, Jun, and Dec (Aug showed no trend).
The historical trend of reduction in annual rainfall accumulation, although not significant, represents an increase in the risk of droughts and dry spells, which have impacts on food production, energy generation, water supply, and an expansion in areas at risk of desertification [52], increasing the region’s water vulnerability [53,54]. The more pronounced reduction in summer rainfall (−0.964), which coincides with the wettest period, may contribute to local water scarcity, causing serious environmental impacts due to reduced rainfall [55,56].
In the analysis of future climate (“temporal windows” and shared socioeconomic pathways—SSP), projected for rainfall, we found a discrepancy among the climate models considered here, although, by the end of the century, all models agree on larger rainfall volumes compared to historical data (1388.9 mm from 1973–2022), with variations from −18 mm (−1.3%) to +147 mm (+11%) (Figure 4). The ACCESS and MIROC6 models concentrate higher volumes under future climate conditions. At the same time, the MRI indicates distinct impacts, with a reduction in accumulated totals in the medium term and an increase in the long term. Considering the average projected by the three GCMs, higher volumes are predicted compared to current climatology from 2061 until the end of the century (except for the SSP370 scenario from 2061 to 2080). Therefore, in agreement with previous studies, there is no consensus regarding the pattern of projected rainfall distribution among climate models for the studied region [57,58,59].
Following a common and recommended approach by the IPCC itself, we considered ensemble projections in the present study [52]. Given the uncertainties associated with global climate projection models, where different models present different results for the same region, depending on the parametrization and boundary conditions considered, the global and regional scale processes involved, spatial resolution, parameterizations, etc. [51,60,61,62], projections should not be based on a single model in order explore a range of possible changes.

3.3. Current and Future Climate Classification

According to the World Meteorological Organization (WMO), climate is defined as the weather pattern of a region, typically calculated as the average derived from 30 years of observations [58]. This number of years is derived from the central limit theorem, which states that the sample mean of a dataset tends to approach the population mean when the number of samples is equal to or greater than 30. In this study, we chose to use 50 years as the representative sample of the current climate (from 1973 to 2022) of Diamantina-MG since for some meteorological elements, such as rainfall, a 30-year period may not be sufficient to capture the full potential range of variability of the climate system [63].
The climatic typologies for the current climate of Diamantina-MG were identified as Cwb and B3rB’3a’ by the Köppen Climate Classification Systems (KCCS) and Thornthwaite Climate Classification Systems (TCCS), respectively (Table 3). The former refers to the subtropical highland climate, while the latter classifies the climate of the location as humid and mesothermal, with a slight water deficiency.
For the future climate of the Diamantina-MG, specifically in the short term (2021–2040), regardless of the socioeconomic scenario considered (SSP245, SSP370, and SSP585), the Köppen climate classification remains as Cwb, with a variation in the Thornthwaite classification to B2rB’3a’. This scenario suggests a possible moderate increase in temperature or rainfall (or in both) during this period.
In the near-medium term (2041–2060), there is a change in the KCCS, from Cwb to Cwa, in some scenarios (SSP370 and SSP585) due to increases in the annual average temperature. By the end of the medium term (2061–2080), there is a trend of increasing annual average temperature, with the KCCS changing to Cwa or even to Aw in some scenarios. The TCCS also shows a possible change to B2rB’4a’, indicating a different seasonal distribution for precipitation.
In the long term (2081–2100), projections are more uncertain, but there is a trend of increasing temperature and a possible change in rainfall distribution. The Köppen classification varies from Cwa to Aw or even to B1wA’a’ (Thornthwaite), depending on the socioeconomic scenario. Specifically for the long term and the KCCS, previous studies [64,65,66] have also identified the expansion of the Aw climatic typology in different regions of the globe, including Brazil.
These climate changes can have significant impacts on the Diamantina-MG region, including changes in water resource availability. Therefore, policymakers and urban planners must consider these projections when developing climate change adaptation and mitigation strategies to ensure the resilience and sustainability of the city and its population. This consideration is essential for the development of policies and practices that promote effective adaptation and mitigation of the impacts of climate change. Particularly for the Diamantina-MG region, where the legacy of mineral extraction is significant, and agriculture is predominantly of a family nature, planning to make systems more resilient is imperative, given the climatic dependence of its main economic activities.

4. Conclusions

In this study, we thoroughly investigated the climatic characteristics of Diamantina-MG (recognized by the FAO as Brazil’s first Important Agricultural Heritage System) using a multidisciplinary approach that integrated historical meteorological data, global climate models, and climate classification methodologies.
Our analyses revealed significant trends in the increase in minimum temperature over the examined historical period, indicating a clear warming trend. Furthermore, projections of future climate scenarios based on different global climate models and shared socioeconomic pathways corroborated this trend, projecting a continued increase in temperature in the region, with possible increments of up to 5.8 °C by the end of the century, compared to the historical average.
While projections for changes in rainfall present greater uncertainty, it is evident that climate changes will have significant impacts on water availability and rainfall patterns in the Vale do Jequitinhonha region. While short-term projections suggest discrepancies among models until 2060, there is a consensus that, in the second half of the century, an increase in annual precipitation accumulation is expected.
In addition to changes in climatic averages, our analyses indicate that the climatic typologies of the region are also subject to alterations. Projections indicate that the current climate, classified as Cwb (Köppen) and B3rB’3a’ (Thornthwaite), will evolve into a humid tropical climate with a dry winter (Cwa) by the mid-century and subsequently into a humid tropical savanna climate (Aw) by the end of the century, with negative impacts on regional water availability. These changes represent not only a shift in climate patterns but also have profound implications for local agricultural systems and ecosystems, with potential socioeconomic consequences.
In summary, this study presents compelling evidence of the ongoing and anticipated intensification of climate change in the Diamantina-MG region, emphasizing the imperative pursuit of sustainability, particularly within the framework of Brazil’s first GIAHS. These findings underscore the urgent need for mitigation and adaptive actions to confront the challenges posed by these changes. The focus extends beyond safeguarding the resilience of agricultural systems and local ecosystems to encompass the protection of the well-being and livelihoods of communities reliant on these vulnerable natural resources amidst shifting climate patterns.

Author Contributions

Conceptualization, L.d.C.S. and F.D.B.; methodology and software, L.S.d.P.F., J.V.J. and J.E.A.; validation, L.d.C.S., L.S.d.P.F. and J.d.O.C.; formal analysis and investigation, A.V.S. and F.D.B.; data curation, L.d.C.S., A.V.S. and F.D.B.; writing—original draft preparation, L.d.C.S., J.V.J. and E.L.M.M.; writing—review and editing, R.S.d.S., J.d.O.C. and J.E.A.; visualization, L.d.C.S., L.S.d.P.F., F.D.B., J.V.J., A.V.S., J.E.A., E.L.M.M., R.S.d.S. and J.d.O.C.; supervision, L.d.C.S. and F.D.B. All authors have read and agreed to the published version of the manuscript.

Funding

This research received no external funding.

Institutional Review Board Statement

Not applicable.

Informed Consent Statement

Not applicable.

Data Availability Statement

The datasets generated and/or analyzed during the current study are available on reasonable request.

Acknowledgments

The authors are very grateful to the National Institute of Meteorology of Brazil (INMET, acronym in Portuguese), for providing meteorological data, and the Minas Gerais State Research Support Foundation (FAPEMIG) and Higher Education Personnel Improvement Coordination (CAPES), for the financial support granted in the form of scholarships, to the second and fifth authors.

Conflicts of Interest

The authors declare no conflicts of interest.

References

  1. Fávero, C. Agroambientes manejados pelas comunidades apanhadoras de flores Sempre-Vivas. In Vida e Luta das Comunidades Apanhadoras de Flores Sempre-Vivas em Minas Gerais; Fávero, C., Monteiro, F.T., Oliveira, M.N.S., Eds.; UFVJM: Diamantina, MG, Brazil, 2021; pp. 108–129. [Google Scholar]
  2. Ocelli Pinheiro, R.; de Paula, L.F.A.; Giardino, M. Agricultural Heritage: Contrasting National and International Programs in Brazil and Italy. Sustainability 2022, 14, 6401. [Google Scholar] [CrossRef]
  3. SISEMA Índice Mineiro de Vulnerabilidade Climática (IMVC). Available online: https://clima-gerais.meioambiente.mg.gov.br/vulnerabilidade-territorial (accessed on 14 December 2023).
  4. Bhattacharyya, P.; Pathak, H.; Pal, S. Impact of Climate Change on Agriculture: Evidence and Predictions. In Climate Smart Agriculture. Green Energy and Technology; Springer: Singapore, 2020; pp. 17–32. [Google Scholar]
  5. Moura Cardoso do Vale, T.; Helena Constantino Spyrides, M.; De Melo Barbosa Andrade, L.; Guedes Bezerra, B.; Evangelista da Silva, P. Subsistence Agriculture Productivity and Climate Extreme Events. Atmosphere 2020, 11, 1287. [Google Scholar] [CrossRef]
  6. Wu, Y.; Meng, S.; Liu, C.; Gao, W.; Liang, X.-Z. A Bibliometric Analysis of Research for Climate Impact on Agriculture. Front. Sustain. Food Syst. 2023, 7, 1191305. [Google Scholar] [CrossRef]
  7. van Vliet, M.T.H.; Wiberg, D.; Leduc, S.; Riahi, K. Power-Generation System Vulnerability and Adaptation to Changes in Climate and Water Resources. Nat. Clim. Chang. 2016, 6, 375–380. [Google Scholar] [CrossRef]
  8. Hansen, J.; Sato, M.; Ruedy, R. Perception of Climate Change. Proc. Natl. Acad. Sci. USA 2012, 109, E2415–E2423. [Google Scholar] [CrossRef]
  9. Barral, U.M.; Silva, A.C.; Christófaro, C.; Costa, C.R.; Tassinari, D.; Filho, A.P.; Macedo, G.M.; Bispo, D.F.A.; Gonçalves, T.S. Can Anthropization Govern the Water and Carbon Dynamics? A Case Study of Peatlands in Serra Do Espinhaço Meridional, Brazil. Wetl. Ecol. Manag. 2023, 31, 479–497. [Google Scholar] [CrossRef]
  10. Silva, A.C.; Barbosa, M.S.; Barral, U.M.; Silva, B.P.C.; Fernandes, J.S.C.; Viana, A.J.S.; Filho, C.V.M.; Bispo, D.F.A.; Christófaro, C.; Ragonezi, C.; et al. Organic Matter Composition and Paleoclimatic Changes in Tropical Mountain Peatlands Currently under Grasslands and Forest Clusters. Catena 2019, 180, 69–82. [Google Scholar] [CrossRef]
  11. Costa, T.R.; de Moura, C.C.; da Silva, L.S.; Gonzaga, A.P.D.; Rech, A.R.; Machado, E.L.M. Environmental Factors Determining the Forest–Grassland Variation in the Espinhaço Range Biosphere Reserve—Brazil. J. Plant Ecol. 2023, 16, rtac089. [Google Scholar] [CrossRef]
  12. Santoro, A.; Venturi, M.; Bertani, R.; Agnoletti, M. A Review of the Role of Forests and Agroforestry Systems in the FAO Globally Important Agricultural Heritage Systems (GIAHS) Programme. Forests 2020, 11, 860. [Google Scholar] [CrossRef]
  13. Dias, L.F.; Aparício, B.A.; Nunes, J.P.; Morais, I.; Fonseca, A.L.; Pastor, A.V.; Santos, F.D. Integrating a Hydrological Model into Regional Water Policies: Co-Creation of Climate Change Dynamic Adaptive Policy Pathways for Water Resources in Southern Portugal. Environ. Sci. Policy 2020, 114, 519–532. [Google Scholar] [CrossRef]
  14. Tui, S.H.-K.; Descheemaeker, K.; Valdivia, R.O.; Masikati, P.; Sisito, G.; Moyo, E.N.; Crespo, O.; Ruane, A.C.; Rosenzweig, C. Climate Change Impacts and Adaptation for Dryland Farming Systems in Zimbabwe: A Stakeholder-Driven Integrated Multi-Model Assessment. Clim. Chang. 2021, 168, 10. [Google Scholar] [CrossRef]
  15. Balasundram, S.K.; Shamshiri, R.R.; Sridhara, S.; Rizan, N. The Role of Digital Agriculture in Mitigating Climate Change and Ensuring Food Security: An Overview. Sustainability 2023, 15, 5325. [Google Scholar] [CrossRef]
  16. Demirdogen, A.; Karapinar, B.; Özertan, G. The Impact of Climate Change on Wheat in Turkey. Reg. Environ. Chang. 2024, 24, 20. [Google Scholar] [CrossRef]
  17. Varajão, G.F.D.C. Por Uma Geografia de Diamantina-MG; UFMG: Belo Horizonte, MG, Brazil, 2015. [Google Scholar]
  18. Xavier, A.C.; Scanlon, B.R.; King, C.W.; Alves, A.I. New Improved Brazilian Daily Weather Gridded Data (1961–2020). Int. J. Climatol. 2022, 42, 8390–8404. [Google Scholar] [CrossRef]
  19. Bender, F.D.; Sentelhas, P.C. Solar Radiation Models and Gridded Databases to Fill Gaps in Weather Series and to Project Climate Change in Brazil. Adv. Meteorol. 2018, 2018, 6204382. [Google Scholar] [CrossRef]
  20. Battisti, R.; Bender, F.D.; Sentelhas, P.C. Assessment of Different Gridded Weather Data for Soybean Yield Simulations in Brazil. Theor. Appl. Climatol. 2019, 135, 237–247. [Google Scholar] [CrossRef]
  21. Pettitt, A.N. A Non-Parametric Approach to the Change-Point Problem. Appl. Stat. 1979, 28, 126. [Google Scholar] [CrossRef]
  22. Alexandersson, H.; Moberg, A. Homogenization of Swedish Temperature Data. Part I: Homogeneity Test for Linear Trends TRENDS. Int. J. Climatol. 1997, 17, 25–34. [Google Scholar] [CrossRef]
  23. CMIP Coupled Model Intercomparison Project. Available online: http://cmip-pcmdi.llnl.gov/ (accessed on 15 January 2024).
  24. IPCC. IPCC, 2023: Climate Change 2023: Synthesis Report. Contribution of Working Groups I, II and III to the Sixth Assessment Report of the Intergovernmental Panel on Climate Change; Core Writing Team, Lee, H., Romero, J., Eds.; IPCC: Geneva, Switzerland, 2023. [Google Scholar]
  25. Fick, S.E.; Hijmans, R.J. WorldClim 2: New 1-km Spatial Resolution Climate Surfaces for Global Land Areas. Int. J. Climatol. 2017, 37, 4302–4315. [Google Scholar] [CrossRef]
  26. Bi, D.; Dix, M.; Marsland, S.; O’Farrell, S.; Sullivan, A.; Bodman, R.; Law, R.; Harman, I.; Srbinovsky, J.; Rashid, H.A.; et al. Configuration and Spin-up of ACCESS-CM2, the New Generation Australian Community Climate and Earth System Simulator Coupled Model. J. South. Hemisph. Earth Syst. Sci. 2020, 70, 225–251. [Google Scholar] [CrossRef]
  27. Tatebe, H.; Ogura, T.; Nitta, T.; Komuro, Y.; Ogochi, K.; Takemura, T.; Sudo, K.; Sekiguchi, M.; Abe, M.; Saito, F.; et al. Description and Basic Evaluation of Simulated Mean State, Internal Variability, and Climate Sensitivity in MIROC6. Geosci. Model Dev. 2019, 12, 2727–2765. [Google Scholar] [CrossRef]
  28. Yukimoto, S.; Kawai, H.; Koshiro, T.; Oshima, N.; Yoshida, K.; Urakawa, S.; Tsujino, H.; Deushi, M.; Tanaka, T.; Hosaka, M.; et al. The Meteorological Research Institute Earth System Model Version 2.0, MRI-ESM2.0: Description and Basic Evaluation of the Physical Component. J. Meteorol. Soc. Jpn. Ser. II 2019, 97, 931–965. [Google Scholar] [CrossRef]
  29. O’Neill, B.C.; Kriegler, E.; Riahi, K.; Ebi, K.L.; Hallegatte, S.; Carter, T.R.; Mathur, R.; van Vuuren, D.P. A New Scenario Framework for Climate Change Research: The Concept of Shared Socioeconomic Pathways. Clim. Chang. 2014, 122, 387–400. [Google Scholar] [CrossRef]
  30. O’Neill, B.C.; Kriegler, E.; Ebi, K.L.; Kemp-Benedict, E.; Riahi, K.; Rothman, D.S.; van Ruijven, B.J.; van Vuuren, D.P.; Birkmann, J.; Kok, K.; et al. The Roads Ahead: Narratives for Shared Socioeconomic Pathways Describing World Futures in the 21st Century. Glob. Environ. Chang. 2017, 42, 169–180. [Google Scholar] [CrossRef]
  31. de Medeiros, F.J.; de Oliveira, C.P. Assessment of Dry and Heavy Rainfall Days and Their Projected Changes over Northeast Brazil in Coupled Model Intercomparison Project Phase 6 Models. Int. J. Climatol. 2022, 42, 8665–8686. [Google Scholar] [CrossRef]
  32. Reboita, M.S.; Willian de Souza Ferreira, G.; Gabriel Martins Ribeiro, J.; Ali, S. Assessment of Precipitation and Near-Surface Temperature Simulation by CMIP6 Models in South America. Environ. Res. Clim. 2024, 3, 025011. [Google Scholar] [CrossRef]
  33. Firpo, M.Â.F.; Guimarães, B.d.S.; Dantas, L.G.; da Silva, M.G.B.; Alves, L.M.; Chadwick, R.; Llopart, M.P.; de Oliveira, G.S. Assessment of CMIP6 Models’ Performance in Simulating Present-Day Climate in Brazil. Front. Clim. 2022, 4, 948499. [Google Scholar] [CrossRef]
  34. Mann, H.B. Nonparametric Tests Against Trend. Econometrica 1945, 13, 245. [Google Scholar] [CrossRef]
  35. Kendall, M.G. Rank Correlation Methods, 4th ed.; Charles Griffin: London, UK, 1975. [Google Scholar]
  36. Sen, P.K. Estimates of the Regression Coefficient Based on Kendall’s Tau. J. Am. Stat. Assoc. 1968, 63, 1379–1389. [Google Scholar] [CrossRef]
  37. Vianello, R.L.; Alves, A.R.M. Meteorologia Básica e Aplicações, 2nd, ed.; UFV: Viçosa, MG, Brazil, 2012. [Google Scholar]
  38. Thornthwaite, C.W. An Approach toward a Rational Classification of Climate. Geogr. Rev. 1948, 38, 55–94. [Google Scholar] [CrossRef]
  39. Thornthwaite, C.W.; Mather, J.R.T. The Water Balance: Publications in Climatology; Drexel Institute of Technology: Galloway, NJ, USA, 1955. [Google Scholar]
  40. Braga, H.A.; Molion, L.C.B. The Droughts 2013/2014 in Southeast Brazil. Anuário Do Inst. De Geociências UFRJ 2018, 41, 100–107. [Google Scholar] [CrossRef]
  41. Marengo, J.A.; Nobre, C.A.; Seluchi, M.E.; Cuartas, A.; Alves, L.M.; Mendiondo, E.M.; Obregón, G.; Sampaio, G. A Seca e a Crise Hídrica de 2014–2015 Em São Paulo. Rev. USP 2015, 106, 31–44. [Google Scholar] [CrossRef]
  42. Almeida, C.T.; Oliveira-Júnior, J.F.; Delgado, R.C.; Cubo, P.; Ramos, M.C. Spatiotemporal Rainfall and Temperature Trends throughout the Brazilian Legal Amazon, 1973–2013. Int. J. Climatol. 2017, 37, 2013–2026. [Google Scholar] [CrossRef]
  43. de Carvalho, A.A.; Montenegro, A.A.d.A.; da Silva, H.P.; Lopes, I.; de Morais, J.E.F.; da Silva, T.G.F. Trends of Rainfall and Temperature in Northeast Brazil. Rev. Bras. De Eng. Agrícola E Ambient. 2020, 24, 15–23. [Google Scholar] [CrossRef]
  44. Tomasella, J.; Silva Pinto Vieira, R.M.; Barbosa, A.A.; Rodriguez, D.A.; de Oliveira Santana, M.; Sestini, M.F. Desertification Trends in the Northeast of Brazil over the Period 2000–2016. Int. J. Appl. Earth Obs. Geoinf. 2018, 73, 197–206. [Google Scholar] [CrossRef]
  45. Marengo, J.A.; Ambrizzi, T.; Alves, L.M.; Barreto, N.J.C.; Simões Reboita, M.; Ramos, A.M. Changing Trends in Rainfall Extremes in the Metropolitan Area of São Paulo: Causes and Impacts. Front. Clim. 2020, 2, 3. [Google Scholar] [CrossRef]
  46. Easterling, D.R.; Horton, B.; Jones, P.D.; Peterson, T.C.; Karl, T.R.; Parker, D.E.; Salinger, M.J.; Razuvayev, V.; Plummer, N.; Jamason, P.; et al. Maximum and Minimum Temperature Trends for the Globe. Science (1979) 1997, 277, 364–367. [Google Scholar] [CrossRef]
  47. Gil-Alana, L.A. Maximum and Minimum Temperatures in the United States: Time Trends and Persistence. Atmos. Sci. Lett. 2018, 19, e810. [Google Scholar] [CrossRef]
  48. El Kasri, J.; Lahmili, A.; Soussi, H.; Jaouda, I.; Bentaher, M. Trend Analysis of Meteorological Variables: Rainfall and Temperature. Civ. Eng. J. 2021, 7, 1868–1879. [Google Scholar] [CrossRef]
  49. Rapini, A.; De Mello-Silva, R.; Kawasaki, M.L. Richness and Endemism in Asclepiadoideae (Apocynaceae) from the Espinhaço Range of Minas Gerais, Brazil—A Conservationist View. Biodivers. Conserv. 2002, 11, 1733–1746. [Google Scholar] [CrossRef]
  50. Sjögersten, S.; Aplin, P.; Gauci, V.; Peacock, M.; Siegenthaler, A.; Turner, B.L. Temperature Response of Ex-Situ Greenhouse Gas Emissions from Tropical Peatlands: Interactions between Forest Type and Peat Moisture Conditions. Geoderma 2018, 324, 47–55. [Google Scholar] [CrossRef]
  51. Silva, M.L.; Silva, A.C.; Silva, B.P.C.; Barral, U.M.; Soares, P.G.S.; Vidal-Torrado, P. Surface Mapping, Organic Matter and Water Stocks in Peatlands of the Serra Do Espinhaço Meridional—Brazil. Rev. Bras. Cienc. Solo 2013, 37, 1149–1157. [Google Scholar] [CrossRef]
  52. Dai, A. Drought under Global Warming: A Review. WIREs Clim. Chang. 2011, 2, 45–65. [Google Scholar] [CrossRef]
  53. Sondermann, M.; Chou, S.C.; Lyra, A.; Latinovic, D.; Siqueira, G.C.; Junior, W.C.; Giornes, E.; Leite, F.P. Climate Change Projections and Impacts on the Eucalyptus Plantation around the Doce River Basin, in Minas Gerais, Brazil. Clim. Serv. 2022, 28, 100327. [Google Scholar] [CrossRef]
  54. Natividade, U.A.; Garcia, S.R.; Torres, R.R. Tendência Dos Índices de Extremos Climáticos Observados e Projetados No Estado de Minas Gerais. Rev. Bras. De Meteorol. 2017, 32, 600–614. [Google Scholar] [CrossRef]
  55. Marengo, J.A.; Cunha, A.P.; Cuartas, L.A.; Deusdará Leal, K.R.; Broedel, E.; Seluchi, M.E.; Michelin, C.M.; De Praga Baião, C.F.; Chuchón Angulo, E.; Almeida, E.K.; et al. Extreme Drought in the Brazilian Pantanal in 2019–2020: Characterization, Causes, and Impacts. Front. Water 2021, 3, 639204. [Google Scholar] [CrossRef]
  56. Marengo, J.A.; Galdos, M.V.; Challinor, A.; Cunha, A.P.; Marin, F.R.; Vianna, M.d.S.; Alvala, R.C.S.; Alves, L.M.; Moraes, O.L.; Bender, F. Drought in Northeast Brazil: A Review of Agricultural and Policy Adaptation Options for Food Security. Clim. Resil. Sustain. 2022, 1, e17. [Google Scholar] [CrossRef]
  57. Elli, E.F.; Sentelhas, P.C.; Bender, F.D. Impacts and Uncertainties of Climate Change Projections on Eucalyptus Plantations Productivity across Brazil. For. Ecol. Manag. 2020, 474, 118365. [Google Scholar] [CrossRef]
  58. IPCC. Climate Change 2021—The Physical Science Basis; Cambridge University Press: Cambridge, UK, 2021; pp. 2215–2256. [Google Scholar]
  59. Tebaldi, C.; Knutti, R. The Use of the Multi-Model Ensemble in Probabilistic Climate Projections. Philos. Trans. R. Soc. A Math. Phys. Eng. Sci. 2007, 365, 2053–2075. [Google Scholar] [CrossRef] [PubMed]
  60. Morrison, M.A.; Lawrence, P. Understanding Model-Based Uncertainty in Climate Science. In Handbook of Philosophy of Climate Change; Springer: Cham, Switzerland, 2023; pp. 23–43. [Google Scholar]
  61. Eyring, V.; Bony, S.; Meehl, G.A.; Senior, C.A.; Stevens, B.; Stouffer, R.J.; Taylor, K.E. Overview of the Coupled Model Intercomparison Project Phase 6 (CMIP6) Experimental Design and Organization. Geosci. Model Dev. 2016, 9, 1937–1958. [Google Scholar] [CrossRef]
  62. Mauritsen, T.; Stevens, B.; Roeckner, E.; Crueger, T.; Esch, M.; Giorgetta, M.; Haak, H.; Jungclaus, J.; Klocke, D.; Matei, D.; et al. Tuning the Climate of a Global Model. J. Adv. Model Earth Syst. 2012, 4, 1–18. [Google Scholar] [CrossRef]
  63. WMO. WMO Guidelines on the Calculation of Climate Normals; WMO: Geneva, Switzerland, 2017. [Google Scholar]
  64. Fernandez, J.P.R.; Franchito, S.H.; Rao, V.B.; Llopart, M. Changes in Koppen–Trewartha Climate Classification over South America from RegCM4 Projections. Atmos. Sci. Lett. 2017, 18, 427–434. [Google Scholar] [CrossRef]
  65. Cui, D.; Liang, S.; Wang, D. Observed and Projected Changes in Global Climate Zones Based on Köppen Climate Classification. WIREs Clim. Chang. 2021, 12, e701. [Google Scholar] [CrossRef]
  66. de Lima, R.F.; Aparecido, L.E.d.O.; Torsoni, G.B.; Rolim, G.d.S. Climate Change Assessment in Brazil: Utilizing the Köppen-Geiger (1936) Climate Classification. Rev. Bras. De Meteorol. 2023, 38, e38230001. [Google Scholar] [CrossRef]
Figure 1. Location of the Jequitinhonha Valley in Minas Gerais (southeast region of Brazil), with emphasis on the study site (Diamantina).
Sustainability 16 04811 g001
Figure 2. Historical data (1973–2022) of the variables rainfall and air temperature (maximum—Tx, minimum—Tn and average—Tav) for Diamantina, located in the Jequitinhonha Valley in Minas Gerais, Brazil.
Sustainability 16 04811 g002
Figure 3. Annual trend for change in air temperature (maximum—Tx, minimum—Tn, and average—Tav) and rainfall observed in Diamantina, Minas Gerais (Southwest Region of Brazil), during the period 1973–2022. The red dotted line represents the trend line.
Sustainability 16 04811 g003
Figure 4. Change in annual rainfall accumulation and average air temperature under future climate conditions (combinations of “time windows”, shared socioeconomic pathways—SSP, and global climate models) for Diamantina-MG.
Sustainability 16 04811 g004aSustainability 16 04811 g004b
Table 1. Details of CMIP6 models used in the present study, including their institution’s identity, and horizontal resolution (longitude × latitude).
ModelInstitutionApproximate Grid Spacing (Longitude by Latitude)
ACCESS-CM2Australian Community Climate and Earth System Simulator (ACCESS), Sydney, Australia1.875° × 1.25°
MIROC6Japan Agency for Marine-Earth Science and Technology, Atmosphere and Ocean Research Institute, National Institute for Environmental Studies (MIROC), Yokosuka, Japan1.40° × 1.40°
MRI-ESM2-0Max Planck Institute for Meteorology (MPI-M), Hamburg, Germany1.12° × 1.12°
Table 2. Mann–Kendall and Sen slope tests applied to historical data (1973–2022) of air temperature (maximum—Tx, minimum—Tn and average—Tav) and rainfall for monthly, seasonal and annual scales of Diamantina, Minas Gerais (Southeast Region, Brazil).
Tx TnTavRainfall
Kendall’s TauSen’s SlopeKendall’s TauSen’s SlopeKendall’s TauSen’s SlopeKendall’s TauSen’s Slope
Jan0.13 ns0.022 ns3.01 × 10−1 *0.021*2.31 × 10−1 *0.024 *−0.16 ns−2.855 ns
Feb8.16 × 10−4 ns0.000 ns2.20 × 10−1 *0.016*9.06 × 10−4 ns0.009 ns9.71 × 10−2 ns1.200 ns
Mar−8.16 × 10⁻⁴ ns−0.000 ns2.76 × 10−1 *0.017 *9.88 × 10−2 ns0.008 ns−3.51 × 10⁻² ns−0.397 ns
Apr3.84 × 10−2 ns0.005 ns3.03 × 10−1 *0.020 *1.52 × 10−1 ns0.013 ns7.10 × 10−2 ns0.234 ns
May−5.63 × 10⁻² ns−0.008 ns1.06 × 10−1 ns0.009 ns−2.94 × 10⁻² ns−0.002 ns−3.84 × 10⁻² ns−0.062 ns
Jun−1.55 × 10⁻² ns−0.001 ns3.08 × 10−1 *0.024 *2.24 × 10−1 *0.013 *8.46 × 10−2 ns0.030 ns
Jul7.43 × 10−2 ns0.006 ns2.11 × 10−1 *0.021 *1.67 × 10−1 ns0.013 ns−8.85 × 10⁻² ns−0.030 ns
Aug−0.10 ns−0.012 ns7.76 × 10−2 ns0.006 ns1.47 × 10−2 ns0.002 ns−3.29 × 10⁻³ ns0.000 ns
Sep3.34 × 10−1 ns0.045 ns2.65 × 10−1 *0.028 *3.08 × 10−1 *0.036 *−0.15 ns−0.385 ns
Oct2.39 × 10−1 ns0.034 ns4.09 × 10−1 *0.035 *3.31 × 10−1 *0.035 *−0.18 ns−1.200 ns
Nov−3.51 × 10⁻² ns−0.003 ns3.08 × 10−1 *0.024 *1.49 × 10−1 ns0.008 ns−8.16 × 10⁻⁴ ns−0.009 ns
Dec1.84 × 10−1 ns0.019 ns3.14 × 10−1 *0.020 *2.62 × 10−1 *0.020 *1.61 × 10−1 ns1.671 ns
Annual1.03 × 10−1 ns0.007 ns4.25 × 10−1 *0.019 *2.77 × 10−1 *0.013 *−6.94 × 10⁻² ns−2.480 ns
Spring1.71 × 10−1 ns0.015 ns4.94 × 10−1 *0.027 *3.24 × 10−1*0.021 *4.48 × 10−2 ns0.259 ns
Summer3.51 × 10−2 ns0.004 ns3.42 × 10−1 *0.021 *1.74 × 10−1 ns0.013 ns−0.10 ns−0.964 ns
Autumn−3.34 × 10⁻² ns−0.002 ns2.78 × 10−1 *0.017 *1.06 × 10−1 ns0.007 ns6.45 × 10−2 ns0.104 ns
Winter1.68 × 10−1 ns0.012 ns2.24 × 10−1 *0.018 *2.16 × 10−1 *0.016 *−0.18 ns−0.217 ns
* significant differences at the 0.05; ns not significant.
Table 3. Current and future climate (as the mean of the ensemble from ACESS, MIROC6, and MRI GCMs) classification (southeastern Brazil) using the Köppen and Thornthwaite classification systems for Diamantina-MG, Brazil.
Scenario
(Current/Future)
Shared Socioeconomic Pathways (SSP)Climate Classification
KöppenThorthwaite
Current-CwbB3rB’3a’
2021–2040
(short term)
Optimist (SSP245)CwbB2rB’3a’
Intermediate (SSP370)CwbB2rB’3a’
Pessimist (SSP585)CwbB2rB’3a’
2041–2060
(short-medium term)
Optimist (SSP245)CwbB2rB’3a’
Intermediate (SSP370)CwaB2rB’3a’
Pessimist (SSP585)CwaB2rB’3a’
2061–2080
(late medium term)
Optimist (SSP245)CwaB2rB’3a’
Intermediate (SSP370)CwaB2rB’4a’
Pessimist (SSP585)AwB2rB’4a’
2081–2100
(long term)
Optimist (SSP245)CwaB2rB’3a’
Intermediate (SSP370)AwB1rB’4a’
Pessimist (SSP585)AwB1wA’a’
Disclaimer/Publisher’s Note: The statements, opinions and data contained in all publications are solely those of the individual author(s) and contributor(s) and not of MDPI and/or the editor(s). MDPI and/or the editor(s) disclaim responsibility for any injury to people or property resulting from any ideas, methods, instructions or products referred to in the content.

