Abstract
The widespread use of traditional packaging materials poses significant environmental challenges. Adopting green packaging is essential for reducing pollution and conserving natural resources. This paper aims to examine the effectiveness of government incentives and penalties in promoting the adoption of green packaging by logistics companies. We developed an evolutionary game theory model that involves governments and logistics companies, comparing the impacts of static and dynamic reward and penalty policies. The results indicate that (1) static policies often lead to oscillatory adoption rates of green packaging without achieving a stable equilibrium, while dynamic policies generally promote steadier adoption of sustainable practices. (2) Different combinations of dynamic policies have varying influences on logistics companies’ propensity to adopt green packaging solutions. Specifically, dynamic rewards and static penalties are particularly effective at encouraging logistics companies to adopt green packaging. (3) A combination of dynamic rewards and penalties tends to facilitate more rapid and consistent adoption of green packaging by logistics companies. (4) An increase in government supervision costs is associated with reduced regulatory actions and a lower prevalence of green packaging. These insights are critical for policymakers aiming to craft regulations that successfully encourage sustainability within logistics operations.
1. Introduction
The logistics industry has witnessed unprecedented growth in recent years, driven by the increase in e-commerce and global trade. However, a considerable portion of the logistics field remains dependent on traditional packaging materials, including corrugated boxes, plastic bags, file envelopes, and woven bags, among others [1]. The widespread use of these materials presents substantial environmental challenges, notably pollution and the depletion of natural resources. For instance, the New Plastics Economy report indicates that 32% of the 78 million tons of plastic packaging produced globally ends up in our oceans annually [2]. This poses a severe threat to fragile marine ecosystems [3]. Paper packaging leads to the cutting down of 3 billion trees annually. Consequently, the logging of these 3 billion trees annually is responsible for approximately 2.75 trillion pounds of CO2 emissions [4]. Furthermore, the production processes for these materials are characterized by high energy consumption, which contributes to the emission of greenhouse gases and the exacerbation of global warming [5]. As the logistics industry expands, the environmental impact of traditional packaging emerges as an increasingly pressing concern, underscoring the urgent need for sustainable alternatives to mitigate the ecological footprint of global logistics operations.
Green packaging, also known as sustainable packaging, embodies the principle of environmental stewardship by minimizing the ecological footprint of packaging activities [6]. This approach encompasses the use of recyclable, biodegradable, or renewable materials, alongside energy-efficient manufacturing processes that produce minimal waste [7]. By employing these materials and processes, green packaging significantly reduces environmental pollution. For example, packaging made from organic fabrics, such as hemp and flax, can biodegrade within 100 days, while plastic bags take 500 to 1000 years to decompose [8]. The European Commission’s proposed Packaging and Packaging Waste Regulation encourages the extensive use of reusable packaging, aiming to reduce packaging waste by 18 million tons by 2030 [9]. Thus, by substituting traditional packaging materials with eco-friendly alternatives, the logistics industry can significantly reduce its environmental impact [10]. This shift toward green packaging is not merely a matter of corporate responsibility but a critical adaptation to increasing consumer awareness [11]. Consequently, the transition from traditional to green packaging within the logistics industry is a vital step toward sustainable development goals, underscoring the industry’s key role in promoting a sustainable and environmentally conscious global economy.
Despite the acknowledged importance of green packaging in enhancing environmental sustainability, logistics companies face cost challenges in transitioning from traditional packaging methods [12]. Green packaging materials, such as biodegradable plastics and recyclable paper, generally have higher production costs compared to traditional plastics and cardboard, leading to a substantial increase in packaging material costs for logistics companies. Moreover, the design and production of green packaging often require higher technical investments and more complex processes, further elevating operational costs [13]. Aiming at nudging the logistics sector toward sustainable practices, governments worldwide have emerged as powerful agents of change, wielding a combination of rewards and penalties. These interventions manifest in various forms, including tax incentives, grants, regulatory mandates, and penalties for non-compliance, each designed to influence corporate behavior toward environmentally friendly alternatives. Yet, despite the critical role of such governmental measures, there exists a notable gap in our understanding of their direct impact on the adoption of green packaging in the logistics industry. This gap underscores a need for a comprehensive examination of how rewards and penalties shape corporate strategies and practices in green packaging adoption. Through this investigation, we aim to answer the following questions: First, how do governmental rewards and penalties influence the decision-making process of logistics companies regarding the adoption of green packaging? Second, what are the limitations of governmental rewards and penalties policies in achieving long-term sustainability goals? Third, what is the effect of government supervision costs on the regulatory actions of governments and the green packaging adoption by logistics companies? Finally, how do different combinations of dynamic rewards and penalties compare in promoting sustainable packaging practices among logistics companies?
The primary task of this paper is to analyze the impact of governmental rewards and penalties on the adoption of green packaging by logistics companies. This involves employing an evolutionary game theory framework complemented by numerical simulations to explore the dynamic interplay between different policy approaches—both static and dynamic—and their effects on company behavior in the logistics industry. Specifically, this paper first develops an evolutionary game theory model to simulate the decisions of logistics companies faced with different combinations of government-imposed rewards and penalties. Second, it analyzes the evolutionary stable strategies of both parties in the game, identifying the conditions for optimal equilibrium outcomes. It assesses how static versus dynamic policies influence the adoption of green packaging, determining which policy leads to sustainable adoption patterns. Finally, detailed simulations are used to predict the long-term outcomes of these policies, enhancing the understanding of their efficacy and stability over time.
The principal innovations of this study are as follows: (1) we introduce an integrated model that combines both static and dynamic mechanisms of rewards and penalties to assess their impact on the adoption of green packaging initiatives by logistics companies. This method differs from the traditional static models predominantly considered in existing literature. (2) We analyze the evolutionary stable strategy (ESS) of government and logistics companies under different constraint conditions, revealing the impact of various governmental behaviors on the adoption of green packaging by logistics companies under differing mechanisms. This analysis provides a theoretical basis for government decision-making in promoting green packaging. (3) We consider governments and logistics companies under the premise of bounded rationality and analyze the dynamic evolution process of group behavior selection.
2. Literature Review
2.1. Governmental Interventions in Green Packaging
Governmental interventions in green packaging play a pivotal role in promoting environmentally friendly practices across various industries. Fullerton and Wu [14] highlighted the significance of regulatory frameworks in encouraging manufacturers to adopt eco-friendly packaging solutions. Tencati et al. [15] explored the evolving trends in government policies aimed at minimizing packaging waste, indicating a shift toward more sustainable packaging options. Larrain et al. [16] examined how recycling policy interventions, alongside extended producer responsibility schemes, can enhance the recycling of plastic packaging, thereby reducing its environmental footprint. This approach underscores governmental policies’ role not only in managing waste but also in promoting recycling as a key component of green packaging initiatives. Li and Liu [17] further explored the dynamics between governmental interventions and the strategic decisions of firms within green supply chains, underscoring the complexity of implementing green packaging policies and highlighting the need for strategies that account for uncertainties and risk preferences. Wiesmeth et al. [18] conducted a study on environmental policies for drink packaging, emphasizing the importance of incentive compatibility in policy design. Their findings highlight the necessity of policies that guide producers and consumers toward compliance with regulations, reflecting the significance of aligning government interventions with industry needs. Wossen Kassaye [19] discussed the challenges and opportunities governments face in promoting green packaging, highlighting the dilemma between economic development and environmental sustainability, and emphasizing the need for balanced policies that encourage sustainable packaging adoption without hindering economic growth.
2.2. Green Packaging Adoption in the Logistics Industry
The adoption of green packaging in the logistics industry is a critical step toward achieving sustainability and reducing environmental impacts. Zailani et al. [20]’s survey on managers’ perceptions in Malaysia highlights the growing recognition among logistics service providers of the need for green innovations to enhance sustainability. This shift in managerial attitudes and organizational cultures toward embracing environmental initiatives is essential for integrating sustainable practices across logistics operations. Pillay and Mbhele [21] explored both the environmental and economic benefits of reducing packaging in Durban’s road freight industry. Their findings highlight direct environmental benefits, like significant carbon footprint reductions, and point to cost savings, suggesting a dual incentive for companies to adopt green packaging solutions. Zhang et al. [22] identified factors that promote the adoption of green logistics practices in Nanjing, China’s road freight industry. Focusing on green storage, packaging, transportation, and fleet management, the study suggests significant potential for sustainability improvements through strategic initiatives. Key motivators are regulatory support, economic incentives, and environmental awareness. Wang et al. [23] delved into the complexities of integrating green supply chain management in the food packaging sector using a decision-making trial and evaluation laboratory approach, revealing various barriers like cost implications, regulatory challenges, and stakeholder resistance. This foundational work paves the way for identifying strategic pathways to overcome these barriers, underscoring the need for comprehensive stakeholder engagement and policy reform to facilitate green practice adoption.
2.3. Evolutionary Game Theory in Environmental Policy
Evolutionary game theory has attracted considerable attention in environmental policy, particularly regarding its practical applications. Huang et al. [24] explored the incentivization of prefabricated residential buildings in China through evolutionary game theory. Their study identified key barriers to the widespread acceptance of prefabricated construction and introduced an innovative incremental cost allocation coefficient for analyzing stakeholder cooperation. Shi et al. [25] investigated rainwater trading for promoting Sponge city construction, emphasizing evolutionary game theory’s effectiveness in analyzing interactions between environmental protection enterprises and municipal entities. Furthermore, Yao et al. [26] addressed municipal solid waste with a multi-agent evolutionary game analysis focused on waste classification policies, demonstrating how government subsidies can encourage waste separation strategies among stakeholders. Zhou et al. [27] examined the low-carbon transition in energy-intensive enterprises through evolutionary game theory, analyzing the effects of command-and-control policies on enterprise decision-making. Sui et al. [28] investigated government mechanisms for recycling waste electrical and electronic equipment with evolutionary game theory, highlighting the necessity of policy interventions for sustainable practices. Yan and Cao [29] constructed a model based on evolutionary game theory to examine the critical elements affecting the management of marine environmental degradation, considering the monetary compensation benchmarks set by the central government. The results indicate that increasing penalties for local governments’ failure to adhere to these standards can substantially improve oversight. This, in turn, guarantees the successful implementation of financial restitution programs for the restoration of the marine environment.
Existing green packaging literature primarily focuses on static rewards or penalties. However, this study offers a new perspective by examining how a hybrid strategy of static and dynamic rewards and penalties affects logistics companies’ green packaging adoption. Second, this paper examines the presence or absence of governmental supervision of logistics companies under various policy frameworks. Third, a distinctive aspect of this research is the assumption that both governments and logistics companies exhibit bounded rationality, rather than perfect rationality. This study scrutinizes the dynamic evolutionary process between governments and logistics companies within this context, exploring various stable strategies.
3. Model and Analysis
3.1. Methods
We use an evolutionary game model to investigate the issues of green packaging adoption in logistics. Unlike traditional game theory, which assumes players are completely rational, evolutionary game theory assumes that players exhibit bounded rationality and emphasizes the dynamic adaptation process of strategies until they reach an evolutionarily stable strategy [30]. This characteristic provides an advantage over traditional game models in elucidating the dynamics of equilibrium states within a game system.
The evolutionary game model can demonstrate how players learn, compete, and adjust their strategies across multiple iterations of the game [31]. It uses the replicator dynamic equation to depict the strategy adaptation processes. For a group choosing strategy A, the equation can be articulated as follows:
where x represents the fraction of the population choosing strategy A, with denoting the payoff for adopting strategy A, and f denoting the mean payoff across strategies. The stable equilibrium in the replicator dynamics equation is reached when . At this point, the strategy that corresponds to the decision-maker’s stable choice is known as the evolutionary stable strategy (ESS). Stability is further characterized by the condition . According to Friedman [30], the ESS is identifiable through the characteristics of the game system’s Jacobian matrix (J).
In this study, using an evolutionary game theory model enables a detailed examination of how logistics companies and governments adapt strategies under conditions of bounded rationality. This evolutionary approach is particularly suited for analyzing the dynamic interactions and equilibrium states that emerge from environmental policy implementations and organizational reactions. The model effectively captures the progressive adjustments in strategy that lead to evolutionary stability, thereby offering deep insights into the long-term effects of policy measures on the adoption of green packaging solutions.
3.2. Model Parameter Description
Assuming that both governments and logistics companies are bounded rationality, in the evolutionary game process, both players can learn and adapt to the dynamic changes of the game system, adjusting and optimizing their respective strategies. This is a common assumption in evolutionary games, and evolutionary games are also based on this assumption [25,28,32,33]. Thus, the strategy space for governments is (supervision, non-supervision), with the probability of government supervision denoted by x, and the probability of non-supervision by . The strategy space for logistics companies is (green packaging, and traditional packaging), where the probability that logistics companies opt for green packaging is denoted by y, and the complementary probability for traditional packaging is .
We consider a logistics market in which logistics companies may opt for either traditional packaging or green packaging to transport goods. The cost of traditional packaging is denoted as , and the cost of green packaging is represented by . The production of green packaging requires the use of more environmentally friendly materials and more efficient production processes; therefore, its cost is also higher than that of traditional packaging [33]. The adverse environmental impact of traditional packaging is quantified as , whereas for green packaging, it is . Traditional packaging mostly uses non-biodegradable materials, which cause significant harm to the environment. In contrast, green packaging minimizes the use of materials that are difficult to decompose and uses materials that consume less energy, causing less harm to the environment; therefore, [34].
To steer the logistics industry toward sustainability, governments can implement supervision concerning the choice of packaging. If logistics companies choose traditional packaging, they may incur a penalty, denoted as f [35]. Conversely, the use of green packaging may result in a reward for logistics companies, with the reward amount stipulated as r [35]. When companies use traditional packaging, governments are also faced with addressing the associated environmental problems, incurring a processing cost denoted by d [33]. The cost of government supervision is denoted by h. Compared to the penalty imposed on logistics companies, the cost of government supervision of these companies is typically lower. Therefore, we assume that , as assumed in the literature [32].
The analysis explores four strategic scenarios—static rewards with static penalties, dynamic rewards with static penalties, static rewards with dynamic penalties, and dynamic rewards with dynamic penalties—to examine the resultant decision-making behaviors of governments and logistics companies.
The evolutionary game theory model employed in this paper is apt for analyzing the interactions and adaptive strategies of logistics companies in response to government rewards and penalties for adopting green packaging. This model simulates decision-making processes where players adjust their strategies based on the expected payoffs, which depend on the choices of other players within the system. In the context of environmental policy, where logistics companies continuously adapt to changing regulations and competitive pressures, evolutionary game theory provides a robust framework for predicting long-term behavioral adaptations. The model is suitable for exploring the dynamic interplay between various policy mechanisms and corporate responses, which are critical for designing effective and sustainable environmental policies. This approach allows for an understanding of how static and dynamic policies influence the adoption of green practices over time, underpinning the development of more targeted policy interventions.
3.3. Static Rewards and Static Penalties
Static reward and penalty tools are fundamental components of regulatory frameworks used to influence corporate behavior toward desired policy outcomes. These tools consist of fixed rewards or penalties. Rewards often take the form of tax incentives, subsidies, or direct financial support designed to encourage businesses to adopt practices that are beneficial to society. Conversely, penalties might include fines, taxes, or other punitive measures aimed at deterring undesirable practices. These tools are utilized in numerous articles, such as those by Ding et al. [36], Xu and Yang [35], and Zhang et al. [37]. Based on the above statements, we can establish an evolutionary game model under static rewards and static penalties, as shown in Table 1.

Table 1.
Payoff matrix under static rewards and static penalties.
When governments adopt a supervision strategy, their expected payoff is as follows:
When governments adopt a non-supervision strategy, their expected payoff is as follows:
Subsequently, the governments’ average expected payoff is as follows:
Therefore, the replication dynamic equation of governments is as follows:
When logistics companies choose green packaging, their expected payoff is as follows:
When logistics companies choose traditional packaging, their expected payoff is as follows:
Subsequently, the logistics companies’ average expected payoff is as follows:
Therefore, the replication dynamic equation of logistics companies is as follows:
Derived from Equations (5) and (9), the replicator dynamic system is formulated as System (1). From conditions and , the equilibrium points are as follows:
where
The stability of the system’s dynamic equilibrium points is evaluated through the Jacobian matrix. Under static rewards and dynamic penalties, the configuration of the system’s Jacobian matrix is presented as follows:
When the determinant of the Jacobian matrix at an equilibrium point meets the conditions and , this point is deemed a locally asymptotically stable point within the system’s evolutionary dynamics, signifying an evolutionary stable strategy (ESS). If the determinant fulfills the criteria and , the point is considered unstable. If the determinant of the Jacobian matrix at the equilibrium point fails to conform to these stipulations, it is classified as the saddle point of the evolutionary game. Table 2 presents the stability analysis for both participants.
Table 2.
Stability analysis of both players under static rewards and static penalties.
Proposition 1.
In the scenario of static rewards and static penalties, (i) (0,0), (1,0), (0,1), and (1,1) are four equilibrium points of the dynamic system ; (ii) when , and satisfies and , then is also an equilibrium point.
Proposition 1 shows the equilibrium dynamics within a system wherein logistics companies opt between green and traditional packaging, and governments resolve to implement supervision, all under a regime of static rewards and penalties. It identifies five potential equilibrium points, signifying various strategy combinations between governments and logistics companies. Four of these points—, and —depict extreme scenarios wherein players either uniformly adopt one strategy over the other or completely diverge in their strategies, encapsulating static decision-making scenarios. Furthermore, the proposition shows another equilibrium , wherein a balance is achieved under conditions wherein the cost differential between green and traditional packaging is substantial but less than the sum of penalties and rewards.
Corollary 1.
The stability analysis of Proposition 1 leads to the following conclusions: (i) dynamic system has no asymptotically stable equilibrium. (ii) (0,0), (1,0), (0,1), and (1,1) are saddle points. (iii) are the central points.
Corollary 1 examines the stability of the equilibrium points identified within the system modeling decision-making processes between logistics companies and governments in the context of packaging sustainability. It concludes that the system lacks any asymptotically stable equilibrium, implying the absence of a stable state toward which the system naturally gravitates over time without external intervention. The four extreme equilibrium points—, and —are characterized as saddle points, denoting instability in certain directions and sensitivity to perturbations, indicative of transitional states rather than permanent solutions. Meanwhile, the equilibrium point is classified as a central point, suggesting it embodies a delicate and potentially unstable balance of strategies, not inherently driving the system toward or away from it. This underscores the dynamic and sensitive nature of strategic decision-making amid regulatory and economic incentives for sustainability in logistics packaging, wherein stability remains elusive and strategies are in continuous flux.
3.4. Dynamic Rewards and Static Penalties
In this scenario, dynamic rewards are introduced, substituting the original constant r with the function , where r represents the reward’s maximum value. This implies that governments will enhance rewards as the probability () of logistics companies selecting traditional packaging increases. Table 3 displays the payoff matrix under the dynamic rewards and static penalties.
Table 3.
Payoff matrix under dynamic rewards and static penalties.
When governments adopt a supervision strategy, their expected payoff is as follows:
When governments adopt a non-supervision strategy, their expected payoff is as follows:
Subsequently, the governments’ average expected payoff is as follows:
Therefore, the replication dynamic equation of governments is as follows:
When logistics companies choose green packaging, their expected payoff is as follows:
When logistics companies choose traditional packaging, their expected payoff is as follows:
Subsequently, the logistics companies’ average expected payoff is as follows:
Therefore, the replication dynamic equation of logistics companies is as follows:
Based on Equations (14) and (18), we obtain the replicator dynamic system (2). According to , we derive the following equilibrium points:
where
The stability of the system’s dynamic equilibrium points is evaluated through the Jacobian matrix. Under static rewards and dynamic penalties, the configuration of the system’s Jacobian matrix is presented as follows:
Table 4 presents the stability analysis for both participants.
Table 4.
Stability analysis of both players under dynamic rewards and static penalties.
Proposition 2.
In the scenario of dynamic rewards and static penalties, (i) (0,0), (1,0), (0,1), and (1,1) are four equilibrium points of dynamic system ; (ii) when , and satisfies and , then is also an equilibrium point.
Proposition 2 investigates a scenario within the evolutionary game model wherein dynamic rewards and static penalties influence the decision-making of logistics companies and governments regarding the adoption of green versus traditional packaging. This scenario introduces a variable reward function wherein the reward increases as more companies opt for traditional packaging, aiming to incentivize a shift toward green packaging. The analysis identifies five equilibrium points: , and , representing static choices wherein players uniformly select one strategy over another, and another equilibrium point . This point arises under conditions wherein the cost differential between green and traditional packaging is less than the sum of the penalty and the dynamic reward, indicating a balanced mix of strategies adapting to the dynamic incentives offered by the reward function.
Proposition 3.
(i) When , and , is the only ESS of the dynamic system . (ii) When , (1,0) is the only ESS of the dynamic system . (iii) In other cases, the dynamic system has no ESS.
Proposition 3 further presents the dynamics of a system wherein the packaging choices of logistics companies are influenced by dynamic rewards and static penalties. Firstly, it shows that under specific conditions, wherein the cost differential between green and traditional packaging is less than the combined effect of penalties and dynamic rewards, and the reward is low, the system stabilizes at a unique ESS at point . This condition highlights a precise balance of incentives and penalties that can promote sustainable packaging choices.
Secondly, if the cost advantage of traditional over green packaging significantly exceeds the sum of penalties and rewards, the system gravitates toward a singular ESS . This suggests that—under dynamic rewards and static penalties—if the sum of penalties and rewards is low, the system inclines toward the least desirable state. Despite these regulatory efforts, logistics companies continue to choose traditional packaging. The government’s comprehensive regulatory measures do not suffice to incentivize logistics firms to adopt environmentally friendly packaging alternatives.
Lastly, Proposition 3(iii) shows that beyond these specific parameter ranges, the dynamic system fails to find an ESS, indicating a scenario where neither supervised nor incentive mechanisms sufficiently encourage the adoption of green packaging, thus highlighting the complex interplay of economic and regulatory factors in promoting sustainable practices within the logistics industry.
Corollary 2.
The relationships among the government supervision probability , logistics companies opting for green packaging probability , traditional packaging penalty f, government supervision cost h, and maximal green packaging reward r are as follows:
(i) , ,
(ii) , ,
Corollary 2 demonstrates how the probabilities of government supervision and logistics companies opting for green packaging are influenced by changes in the penalty f, the cost of government supervision h, and the maximal reward for green packaging r. Specifically, it suggests that an increase in the penalty for using traditional packaging or in the maximal reward for green packaging reduces the probability of government supervision, implying that heightened penalties and rewards may diminish the necessity for direct supervision as incentives correspond with desired outcomes. Conversely, the likelihood of logistics companies opting for green packaging increases with higher penalties f, suggesting that more stringent penalties against traditional packaging and increased costs borne by governments to enforce supervision encourage greener practices. This corollary underscores the delicate balance necessary in policy design to foster sustainable packaging choices, illustrating how modifications in penalties, rewards, and supervised costs can shift the equilibrium of decisions within the logistics sector.
3.5. Static Rewards and Dynamic Penalties
In this scenario, dynamic penalties are introduced, substituting the original constant f with the function , where f represents the penalty’s maximum value. This implies that governments will escalate penalties as the likelihood () that logistics companies opt for traditional packaging increases. Table 5 displays the payoff matrix under the static rewards and dynamic penalties.
Table 5.
Payoff matrix under static rewards and dynamic penalties.
When governments adopt a supervision strategy, their expected payoff is as follows:
When governments adopt a non-supervision strategy, their expected payoff is as follows:
Subsequently, the governments’ average expected payoff is as follows:
Therefore, the replication dynamic equation of governments is as follows:
When logistics companies choose green packaging, their expected payoff is as follows:
When logistics companies choose traditional packaging, their expected payoff is as follows:
Subsequently, the logistics companies’ average expected payoff is as follows:
Therefore, the replication dynamic equation of logistics companies is as follows:
Based on Equations (23) and (27), we obtain the replicator dynamic system (3). According to , we derive the following equilibrium points:
where
The stability of the system’s dynamic equilibrium points is evaluated through the Jacobian matrix. Under static rewards and dynamic penalties, the configuration of the system’s Jacobian matrix is presented as follows:
Table 6 presents the stability analysis for both participants.
Table 6.
Stability analysis of both players under static rewards and dynamic penalties.
Proposition 4.
In the scenario of static rewards and dynamic penalties, (i) (0,0), (1,0), (0,1), and (1,1) are four equilibrium points of the dynamic system ; (ii) when , and satisfies and , then is also an equilibrium point.
By replacing the fixed penalty with a dynamic function, wherein penalties increase as more companies opt for traditional packaging, this scenario proposes another supervision approach that adjusts penalties based on industry behavior. The analysis identifies equilibrium points at which the system could potentially stabilize, including the extremes represented by , and , reflecting unanimous choices by all players. Moreover, it introduces a specific equilibrium that emerges under conditions wherein the cost differential between green and traditional packaging is less than the sum of the reward and the dynamic penalty, and the dynamic penalty exceeds the cost of government supervision.
Proposition 5.
(i) When and , is the only ESS of the dynamic system . (ii) When , (1,0) is the only ESS of the dynamic system . (iii) In other cases, the dynamic system has no ESS.
Proposition 5 demonstrates that when the cost differential between green and traditional packaging is less than the sum of the reward and dynamic penalty, and the dynamic penalty exceeds the cost of government supervision, the specific equilibrium () emerges as the sole ESS for the system. This indicates a balanced scenario wherein the penalty sufficiently incentivizes compliance, leading to the stable adoption of green packaging practices. Secondly, if the cost differential significantly exceeds the combined values of the static reward and the maximum penalty, the system gravitates toward another stable state at (), reflecting the dominant strategy of supervision. Lastly, outside these conditions, the system lacks any ESS, suggesting that under most circumstances, neither strict penalties nor incentives alone suffice to secure stable, sustainable packaging practices without additional interventions or changes in the underlying parameters.
Corollary 3.
The relationships among the government supervision probability , the probability that logistics companies opt for green packaging , the traditional packaging penalty f, the government supervision cost h, and the maximal green packaging reward r are as follows:
(i) , ,
(ii) , ,
Corollary 3 demonstrates that an increase in the penalty for traditional packaging reduces the probability of government supervision, suggesting that higher penalties might adequately deter non-green practices, thus diminishing the need for regulatory intervention. Similarly, increases in the reward for green packaging and the cost of supervision also reduce the likelihood of government supervision, indicating that more attractive rewards or higher costs make direct supervision less appealing or necessary. Conversely, the likelihood of logistics companies opting for green packaging increases with harsher penalties, as these penalties for non-compliance drive companies toward sustainable practices. However, increases in both the reward and supervision costs diminish the likelihood of opting for green packaging.
3.6. Dynamic Rewards and Dynamic Penalties
In this scenario, we consider dynamic rewards and dynamic penalties. We substitute the original constant r with the function , and the original constant f with the function . Table 7 displays the payoff matrix under the dynamic rewards and dynamic penalties.
Table 7.
Payoff matrix under dynamic rewards and dynamic penalties.
When governments adopt a supervision strategy, their expected payoff is as follows:
When governments adopt a non-supervision strategy, their expected payoff is as follows:
Subsequently, the governments’ average expected payoff is as follows:
Therefore, the replication dynamic equation of governments is as follows:
When logistics companies choose green packaging, their expected payoff is as follows:
When logistics companies choose traditional packaging, their expected payoff is as follows:
Subsequently, the logistics companies’ average expected payoff is as follows:
Therefore, the replication dynamic equation of logistics companies is as follows:
Based on Equations (32) and (36), we obtain the replicator dynamic system (4). According to , we derive the following equilibrium points:
where
The stability of the system’s dynamic equilibrium points is evaluated through the Jacobian matrix. Under static rewards and dynamic penalties, the configuration of the system’s Jacobian matrix is presented as follows:
Table 8 presents the stability analysis for both players.
Table 8.
Stability analysis of both players under dynamic rewards and dynamic penalties.
Proposition 6.
In the scenario of dynamic rewards and dynamic penalties, (i) (0,0), (1,0), (0,1), and (1,1) are four equilibrium points of the dynamic system ; (ii) when and , satisfies and , then is also an equilibrium point.
By replacing static rewards and penalties, the model reflects a more responsive regulatory and incentive system that intensifies penalties and increases rewards as fewer companies opt for traditional packaging. This approach dynamically encourages greener practices. The proposition identifies stable equilibria at , and , representing unanimous decisions across the board. Additionally, another equilibrium is identified, occurring when the cost differential between green and traditional packaging is less than the combined effect of dynamic rewards and penalties, and the dynamic penalty exceeds the supervision costs. This equilibrium suggests a balanced dynamic where both regulatory and economic factors align to incentivize sustainable packaging, indicating the potential effectiveness of a flexible regulatory framework that adjusts penalties and rewards based on industry behavior.
Proposition 7.
(i) When , and , is the only ESS of the dynamic system . (ii) When , (1,0) is the only ESS of the dynamic system . (iii) In other cases, the dynamic system has no ESS.
Proposition 7 identifies conditions under which the system stabilizes to a unique ESS. Specifically, when the cost differential between green and traditional packaging is substantial and the reward r is relatively low, the system stabilizes at the equilibrium point . This equilibrium suggests an optimal balance, where dynamic adjustments to both penalties and rewards effectively promote sustainable packaging practices. Alternatively, if the cost advantage of traditional packaging significantly exceeds the total potential costs imposed by penalties and rewards, then a supervision approach at becomes the sole stable strategy, indicating a scenario where regulatory interventions prove ineffective. In all other cases, the dynamic system lacks a stable equilibrium, suggesting that absent these specific conditions, the system may oscillate or remain in flux, unable to converge on a sustainable strategy.
Corollary 4.
The relationships among the government supervision probability , the probability that logistics companies opt for green packaging , the traditional packaging penalty f, the government supervision cost h, and the maximal green packaging reward r are as follows:
(i) , ,
(ii) , ,
Corollary 4 details the sensitivities of the probabilities that governments will supervise and logistics companies will choose green packaging in response to changes in penalties f, supervision costs, h, and rewards, r under a scenario of dynamic rewards and penalties. It suggests that increasing penalties, f, and rewards, r, reduces the likelihood of government supervision, , indicating that higher penalties and more substantial rewards might sufficiently motivate compliance without the need for strict supervision. The decrease in the probability of government supervision with higher supervision costs h implies that more expensive enforcement makes supervision less attractive or feasible. Conversely, the probability that logistics companies will opt for green packaging, , increases with the penalty, f, indicating that higher penalties effectively discourage traditional packaging. However, an increase in rewards r and supervision costs h decreases the likelihood of choosing green packaging.
4. Numerical Simulations
To enhance our understanding and validate our theoretical model, we conduct numerical simulations using Matlab R2022a. These simulations monitor the decision-making trends of governments and logistics companies under various policy scenarios and assess the effects of parameter adjustments on both parties. JD Logistics is the second-largest courier company in terms of revenue in China. To reduce the environmental impact of courier packaging, it launched the green courier project “Qingliu Plan”, deploying 300,000 reusable courier boxes to the public. The cost of these boxes is CNY 15 each, with about 20 uses per box. Including the labor-management cost for each reusable package, the cost of a reusable package is approximately CNY 1.5. In comparison, the cost of traditional packaging is about CNY 1 [35]. According to information from the Hainan Provincial Development and Reform Commission, the government subsidizes each reusable package by CNY 0.4. Referring to the penalty policy for carbon emission excesses in Shanghai, it can be inferred that courier companies are fined CNY 0.3 for not using green packaging. For the government’s regulatory costs, we refer to the settings in Xu and Yang [35], which is . Therefore, we can set the corresponding parameter values , , , , and .
4.1. Dynamic Evolutionary Process
Figure 1 illustrates the oscillatory behavior of logistics companies’ probability of choosing green packaging over time, denoted by y. The two curves represent different initial conditions for y, one beginning at and the other at . This cyclical behavior may indicate that under static rewards and penalties, logistics companies might repeatedly switch their packaging strategies instead of converging to a stable preference. The simulations reveal that a reduced initial likelihood of adopting green packaging leads to greater volatility in outcomes.
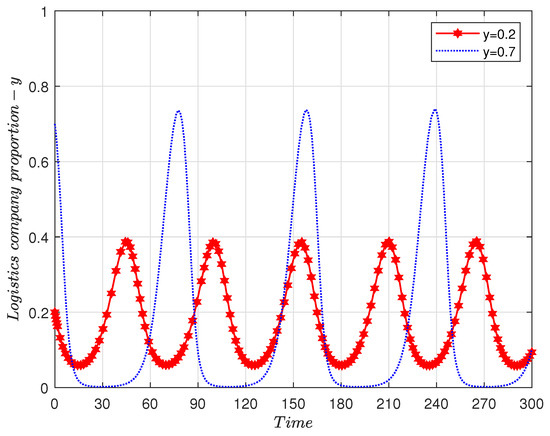
Figure 1.
Evolution of logistics companies’ proportion under static rewards and static penalties. .
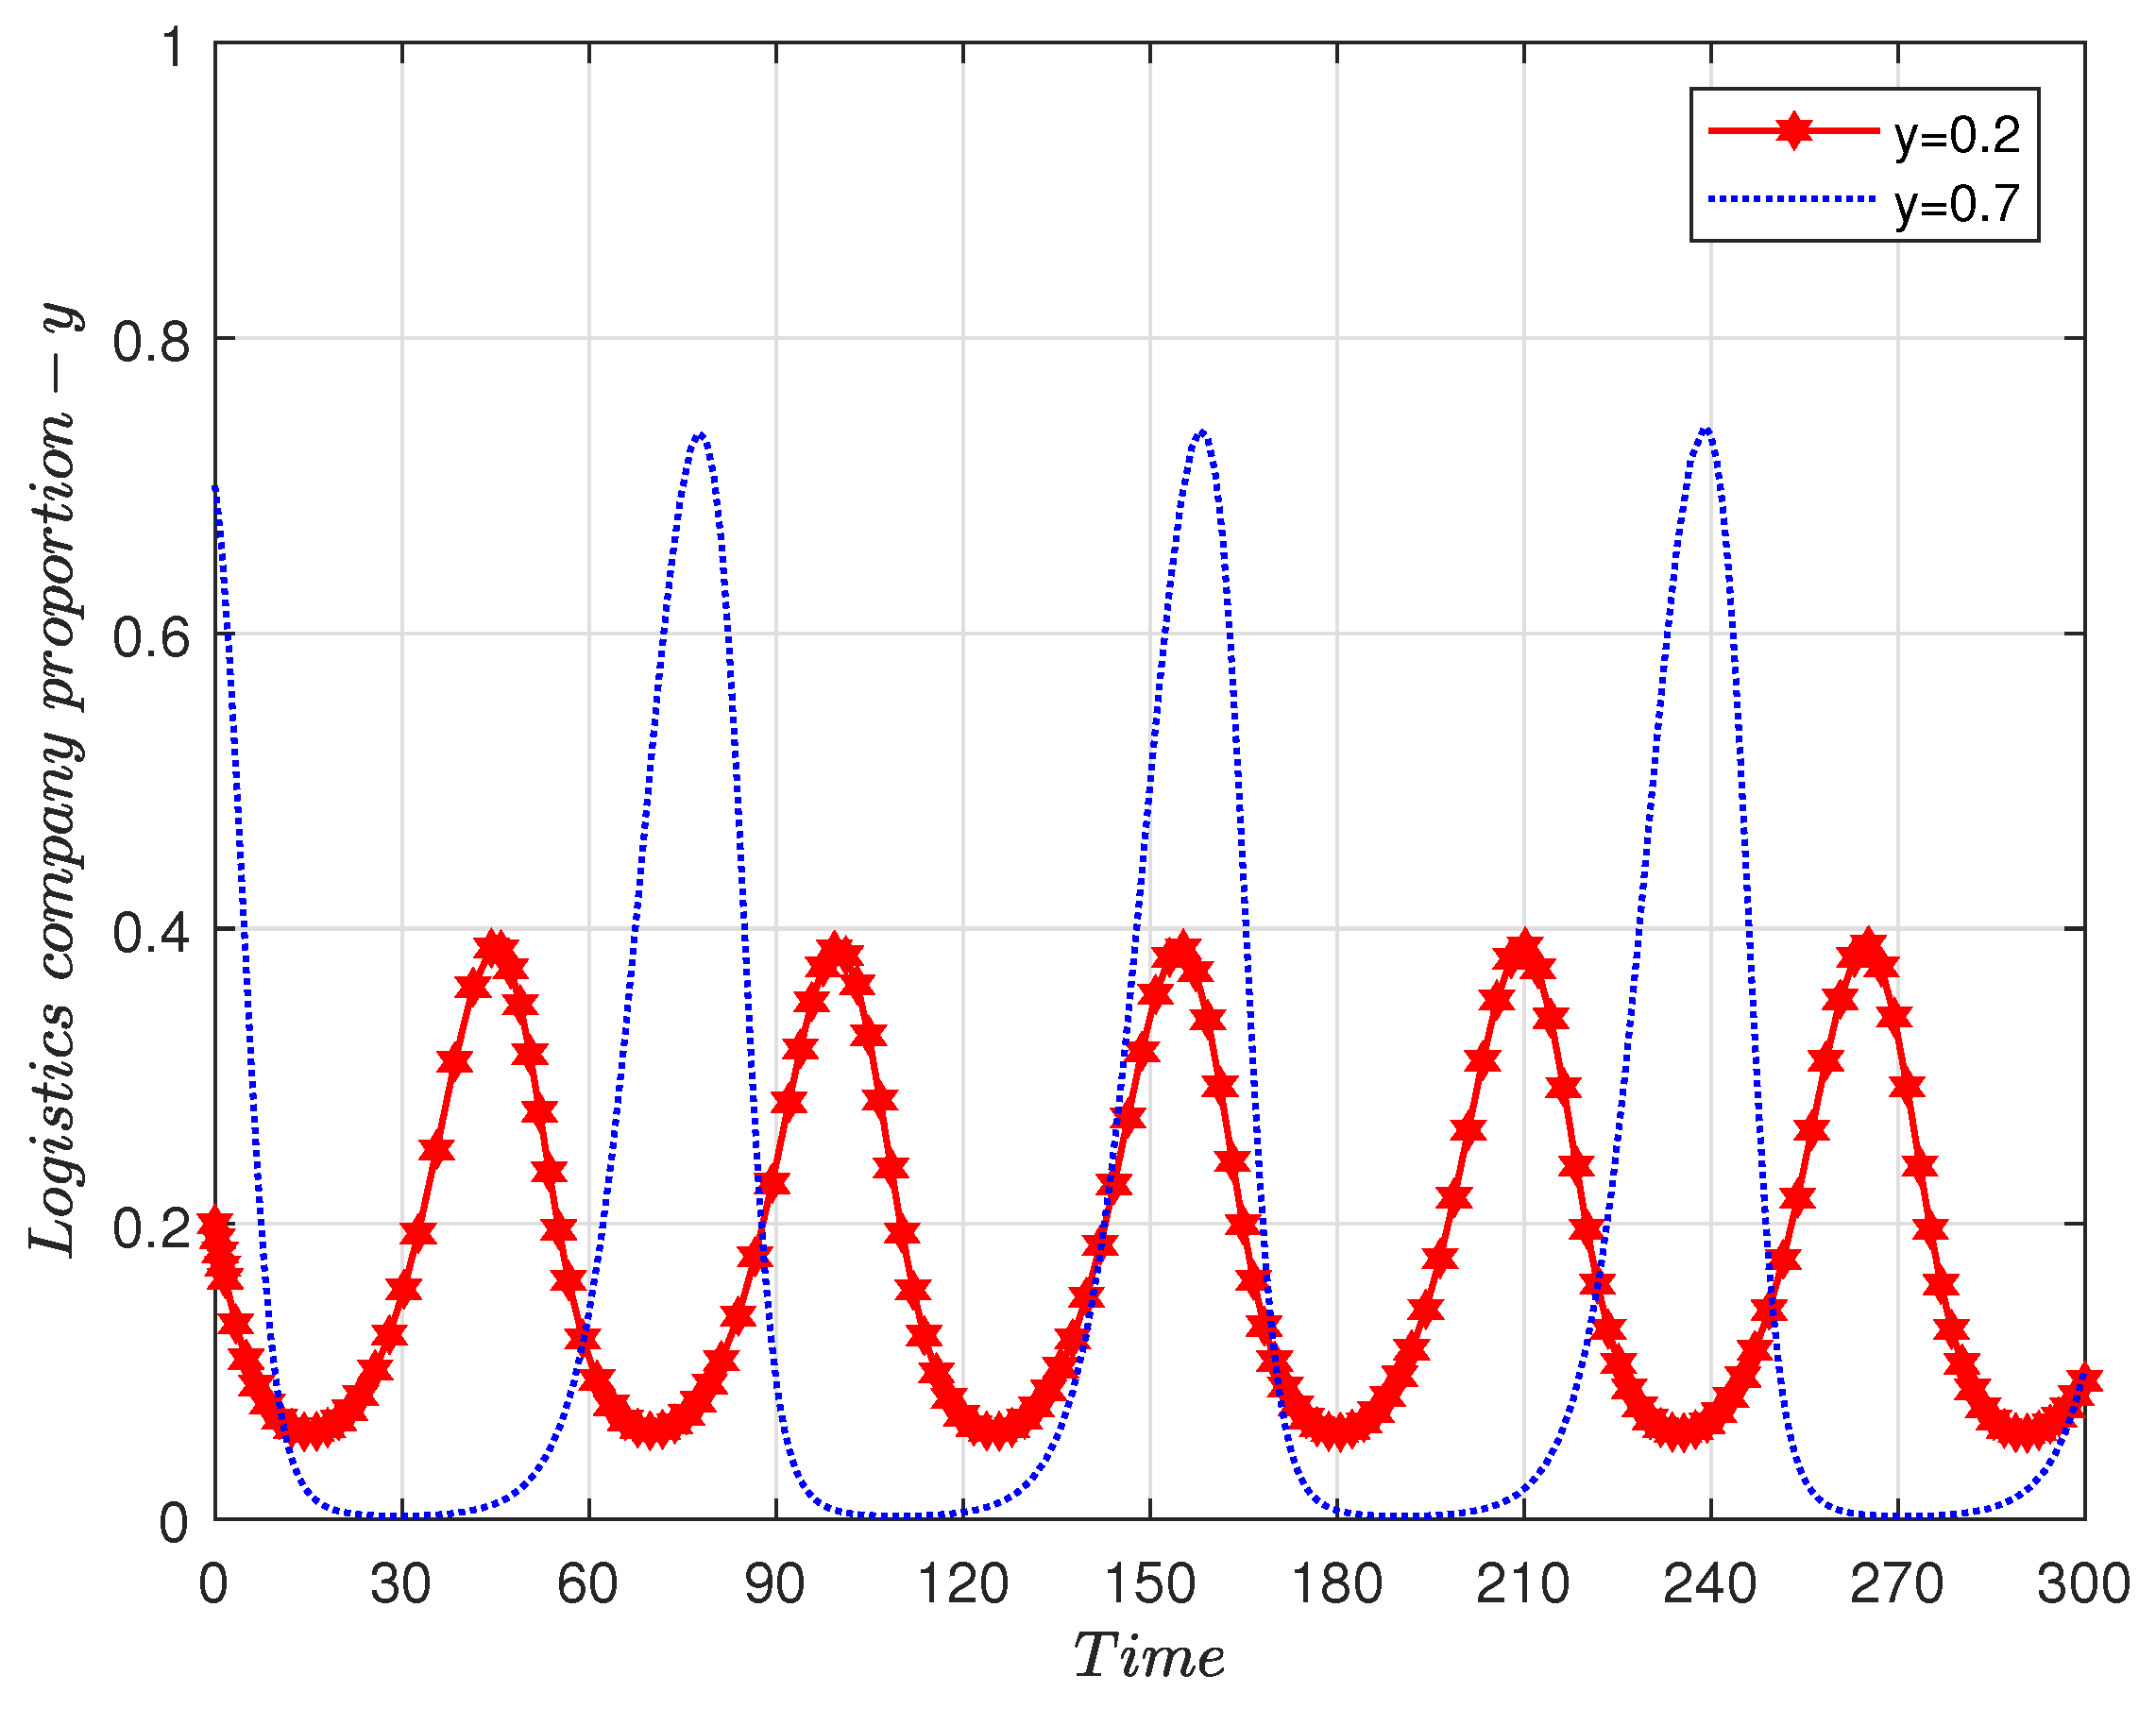
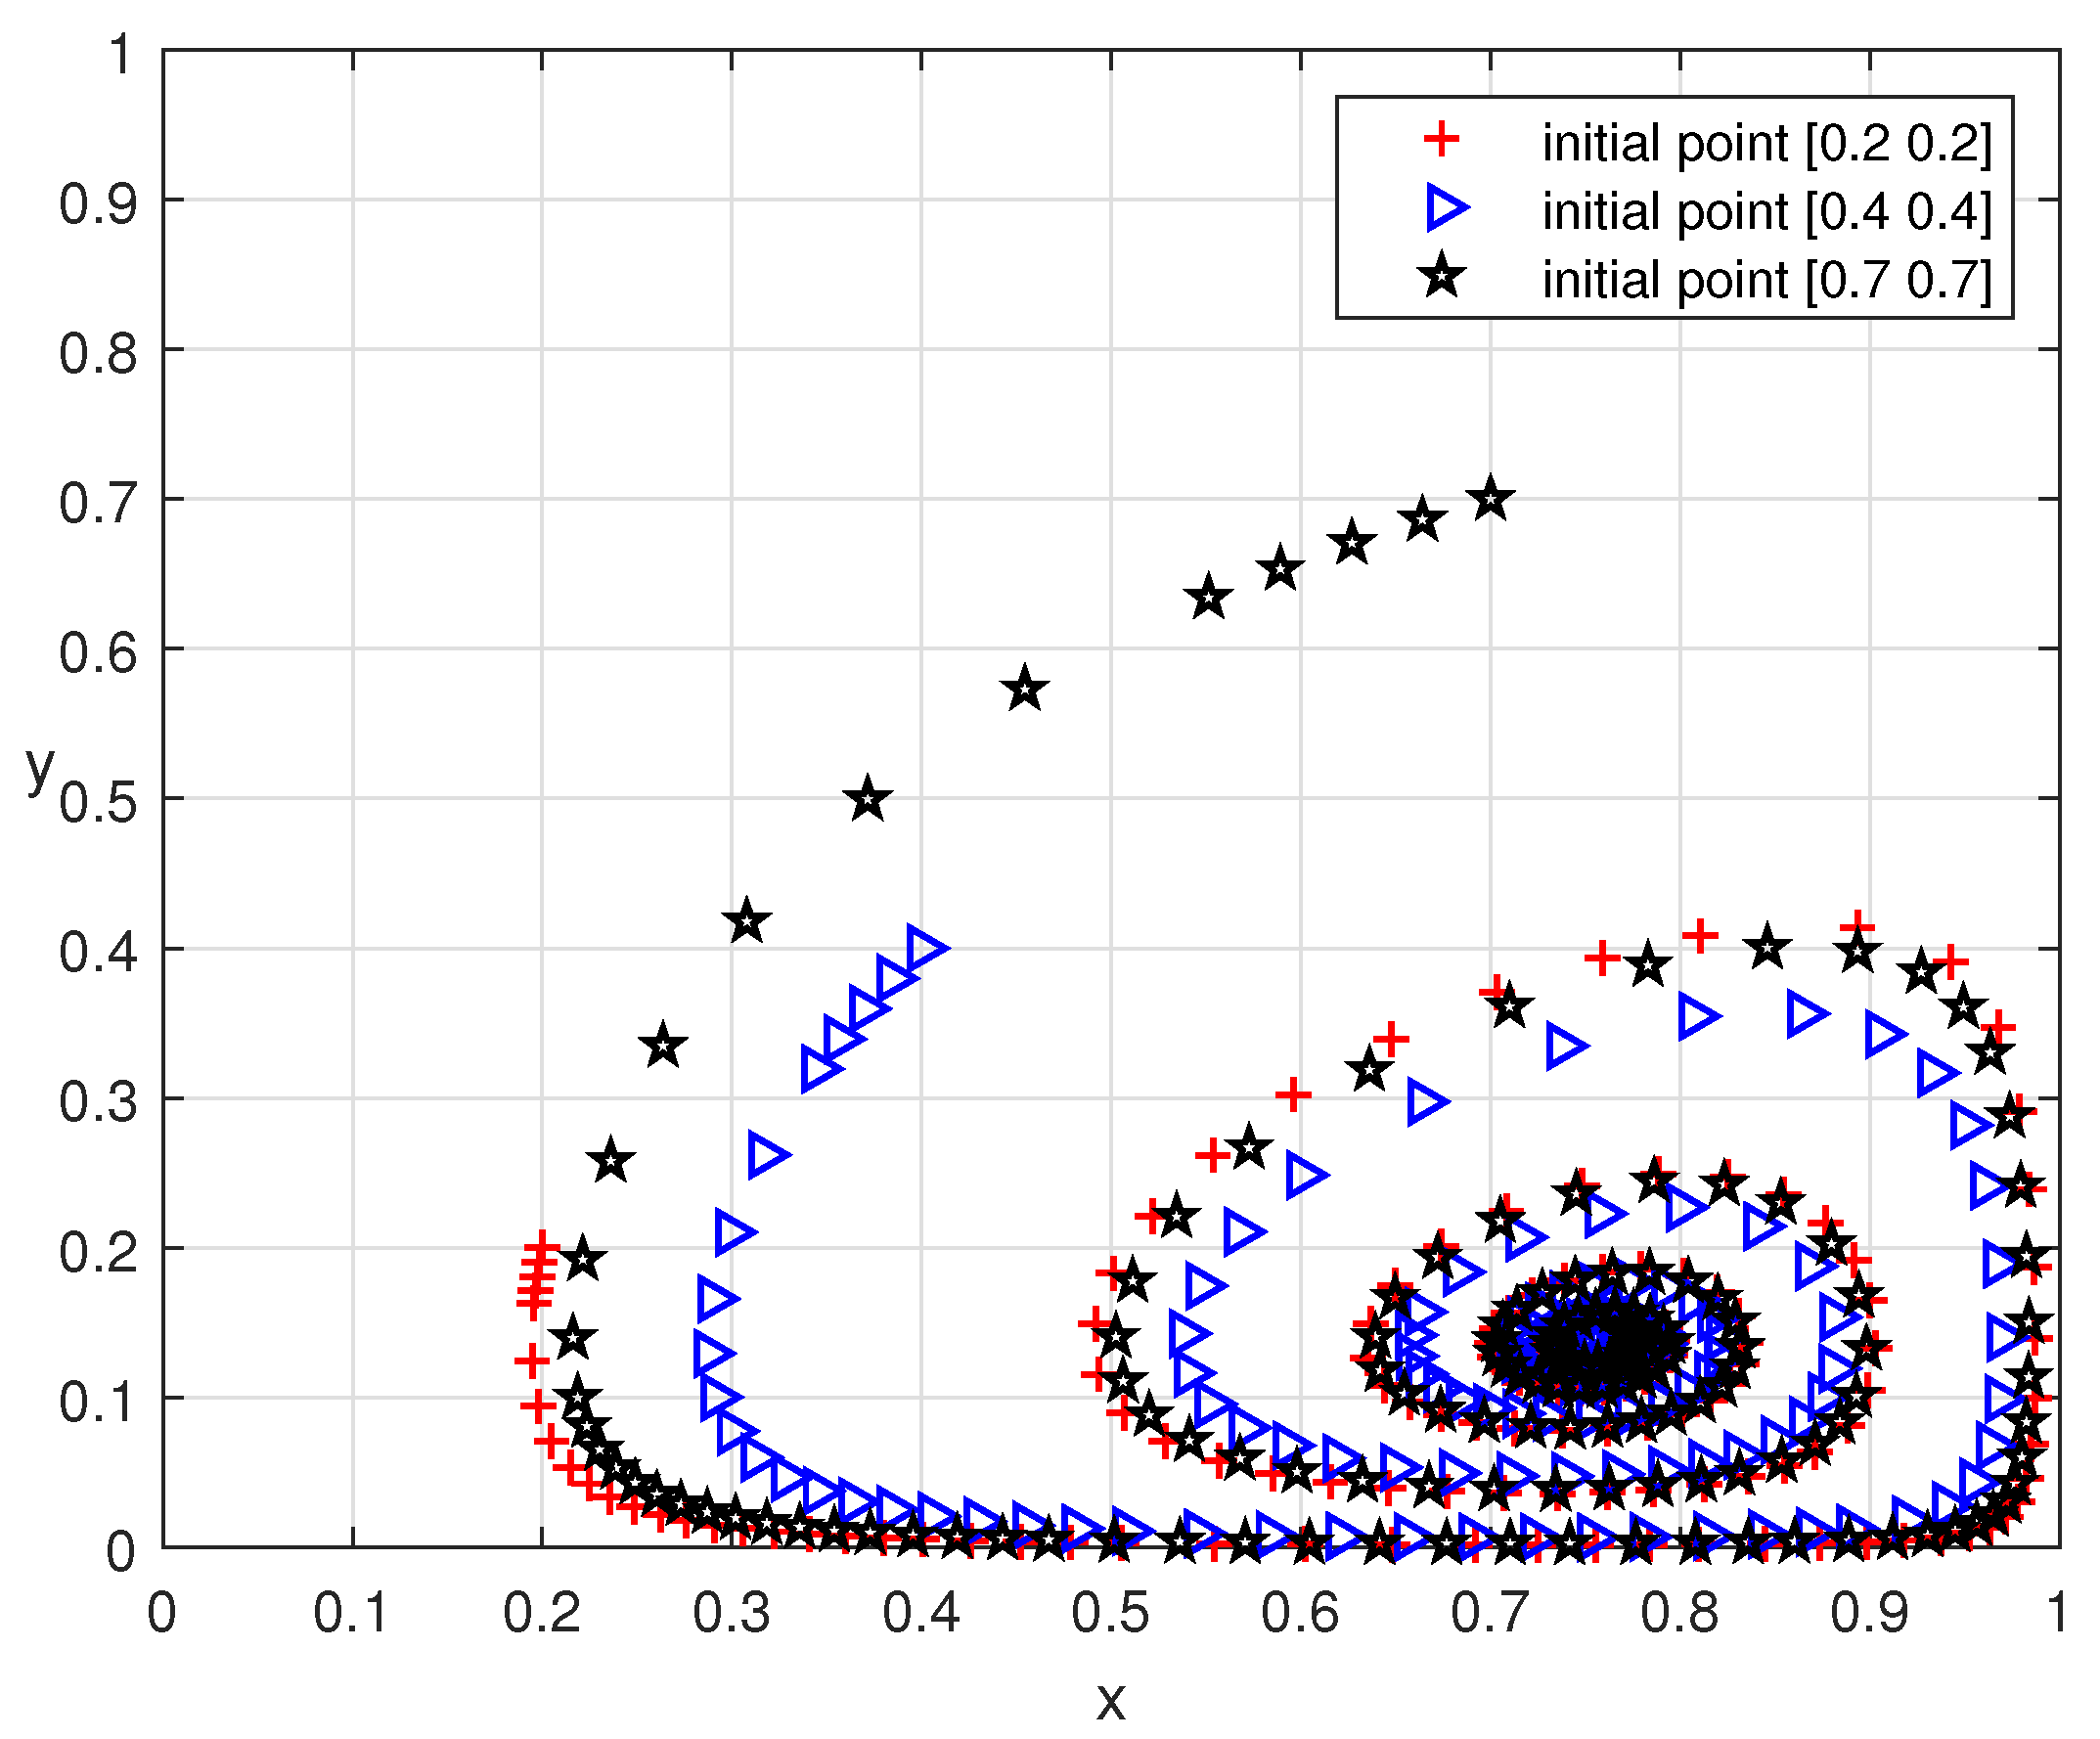
Figure 2 demonstrates that the closed loops, observable irrespective of the starting point, indicate that the strategies evolve cyclically and do not converge to a stable strategy. Instead, they continue to orbit within a specific range. The centers of these loops corresponds to the mixed strategies where both governments and logistics companies are neither fully committed to one action nor another, signifying the absence of a stable equilibrium within this policy framework.
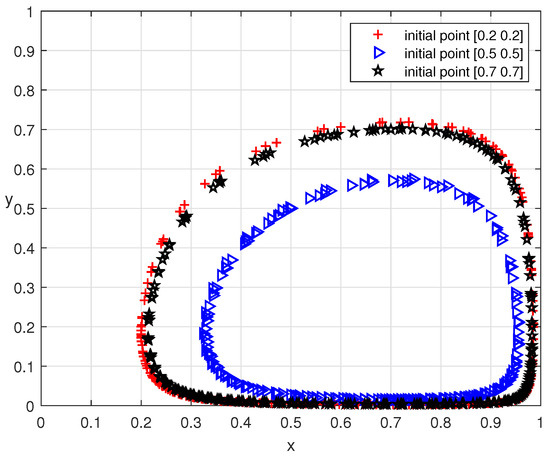
Figure 2.
Dynamic evolutionary process under static rewards and static penalties.
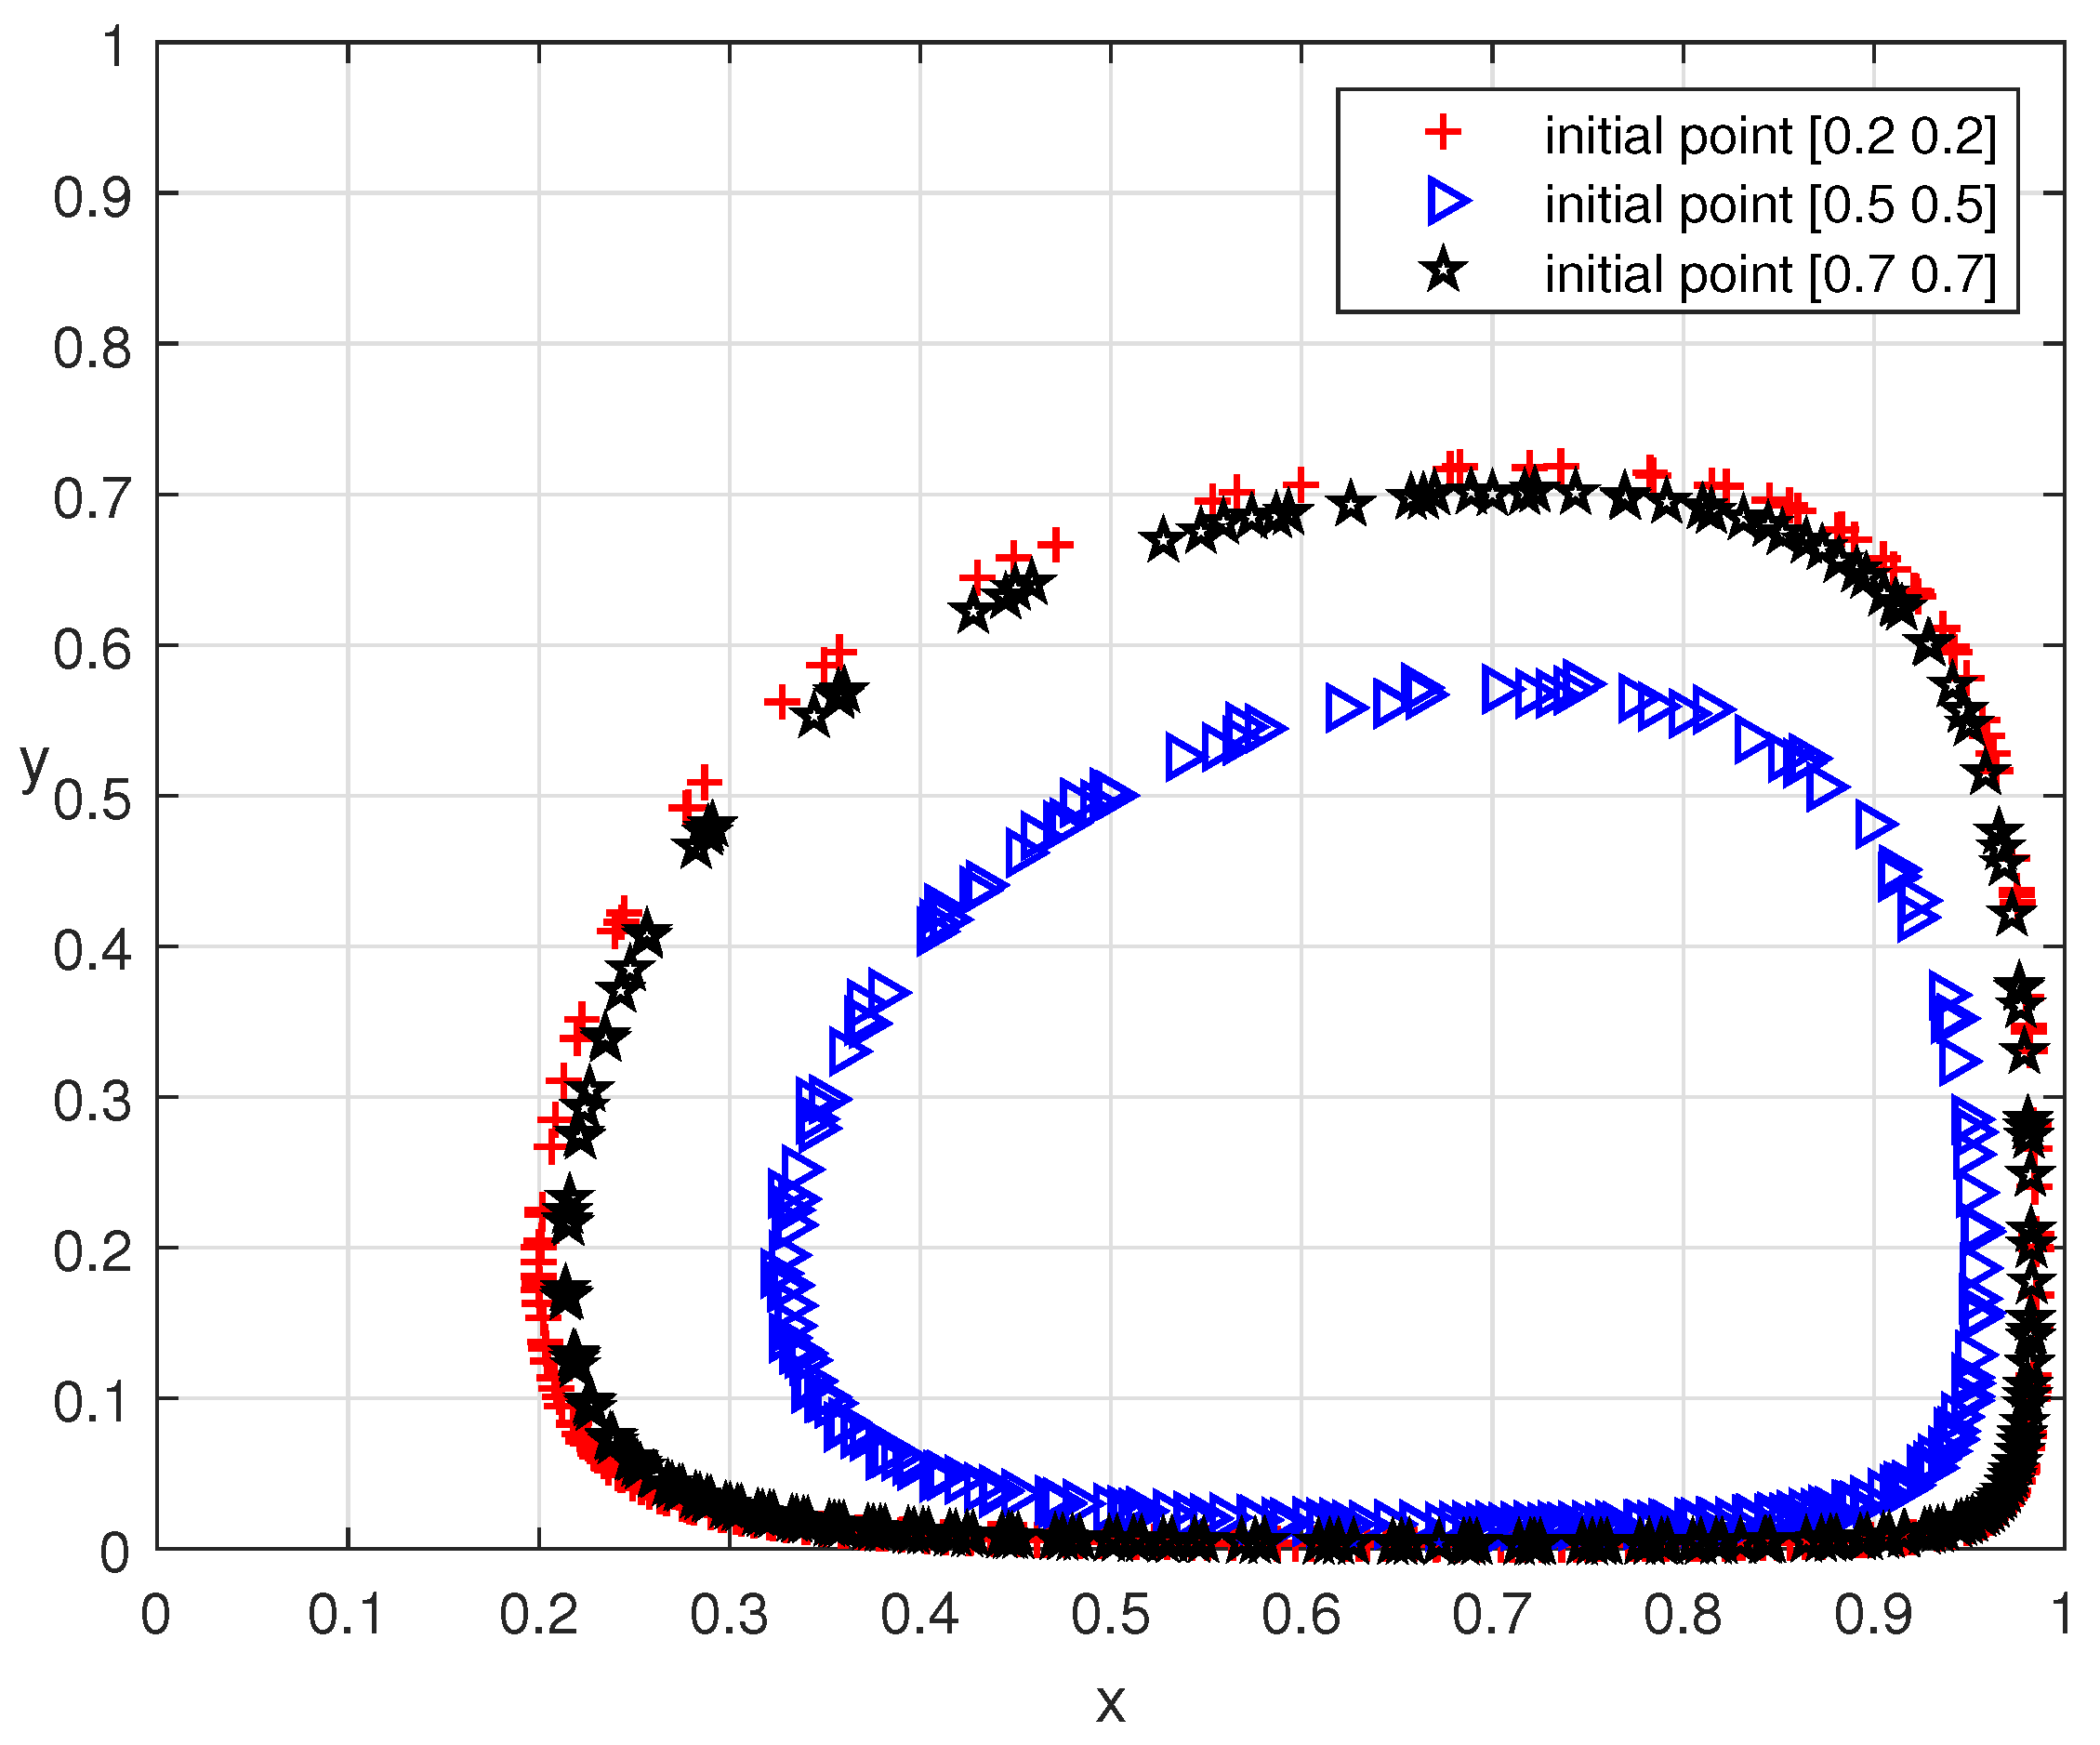
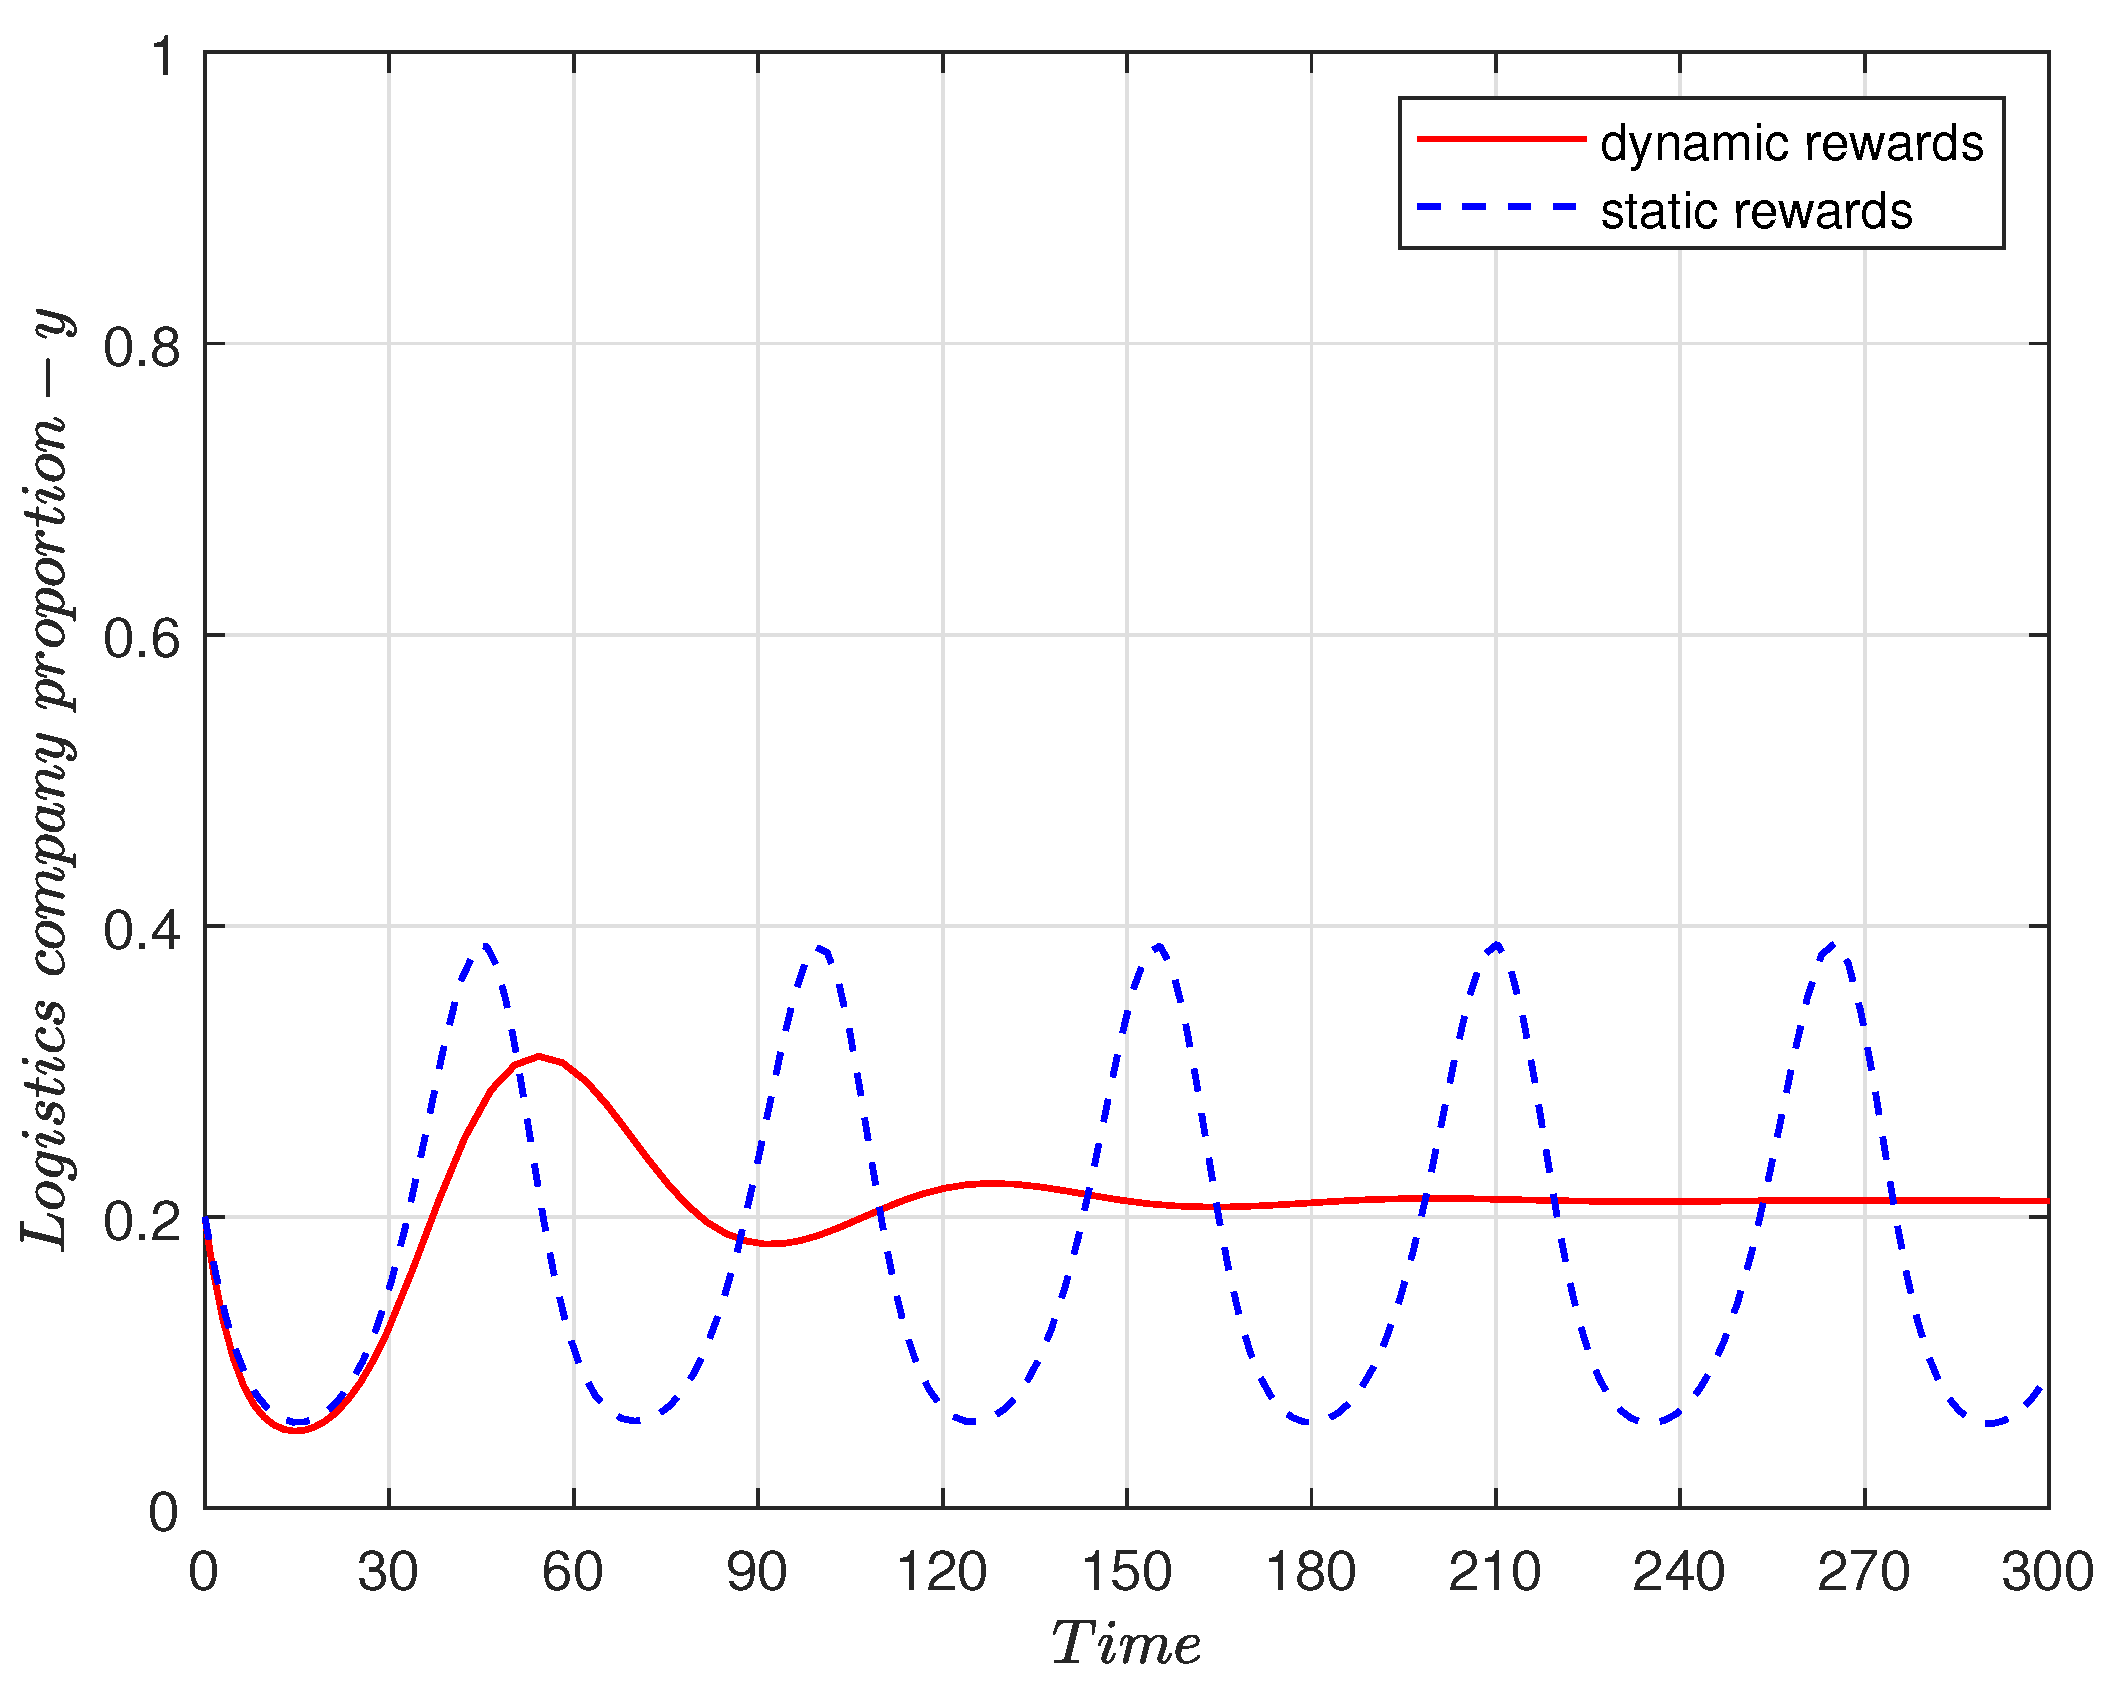
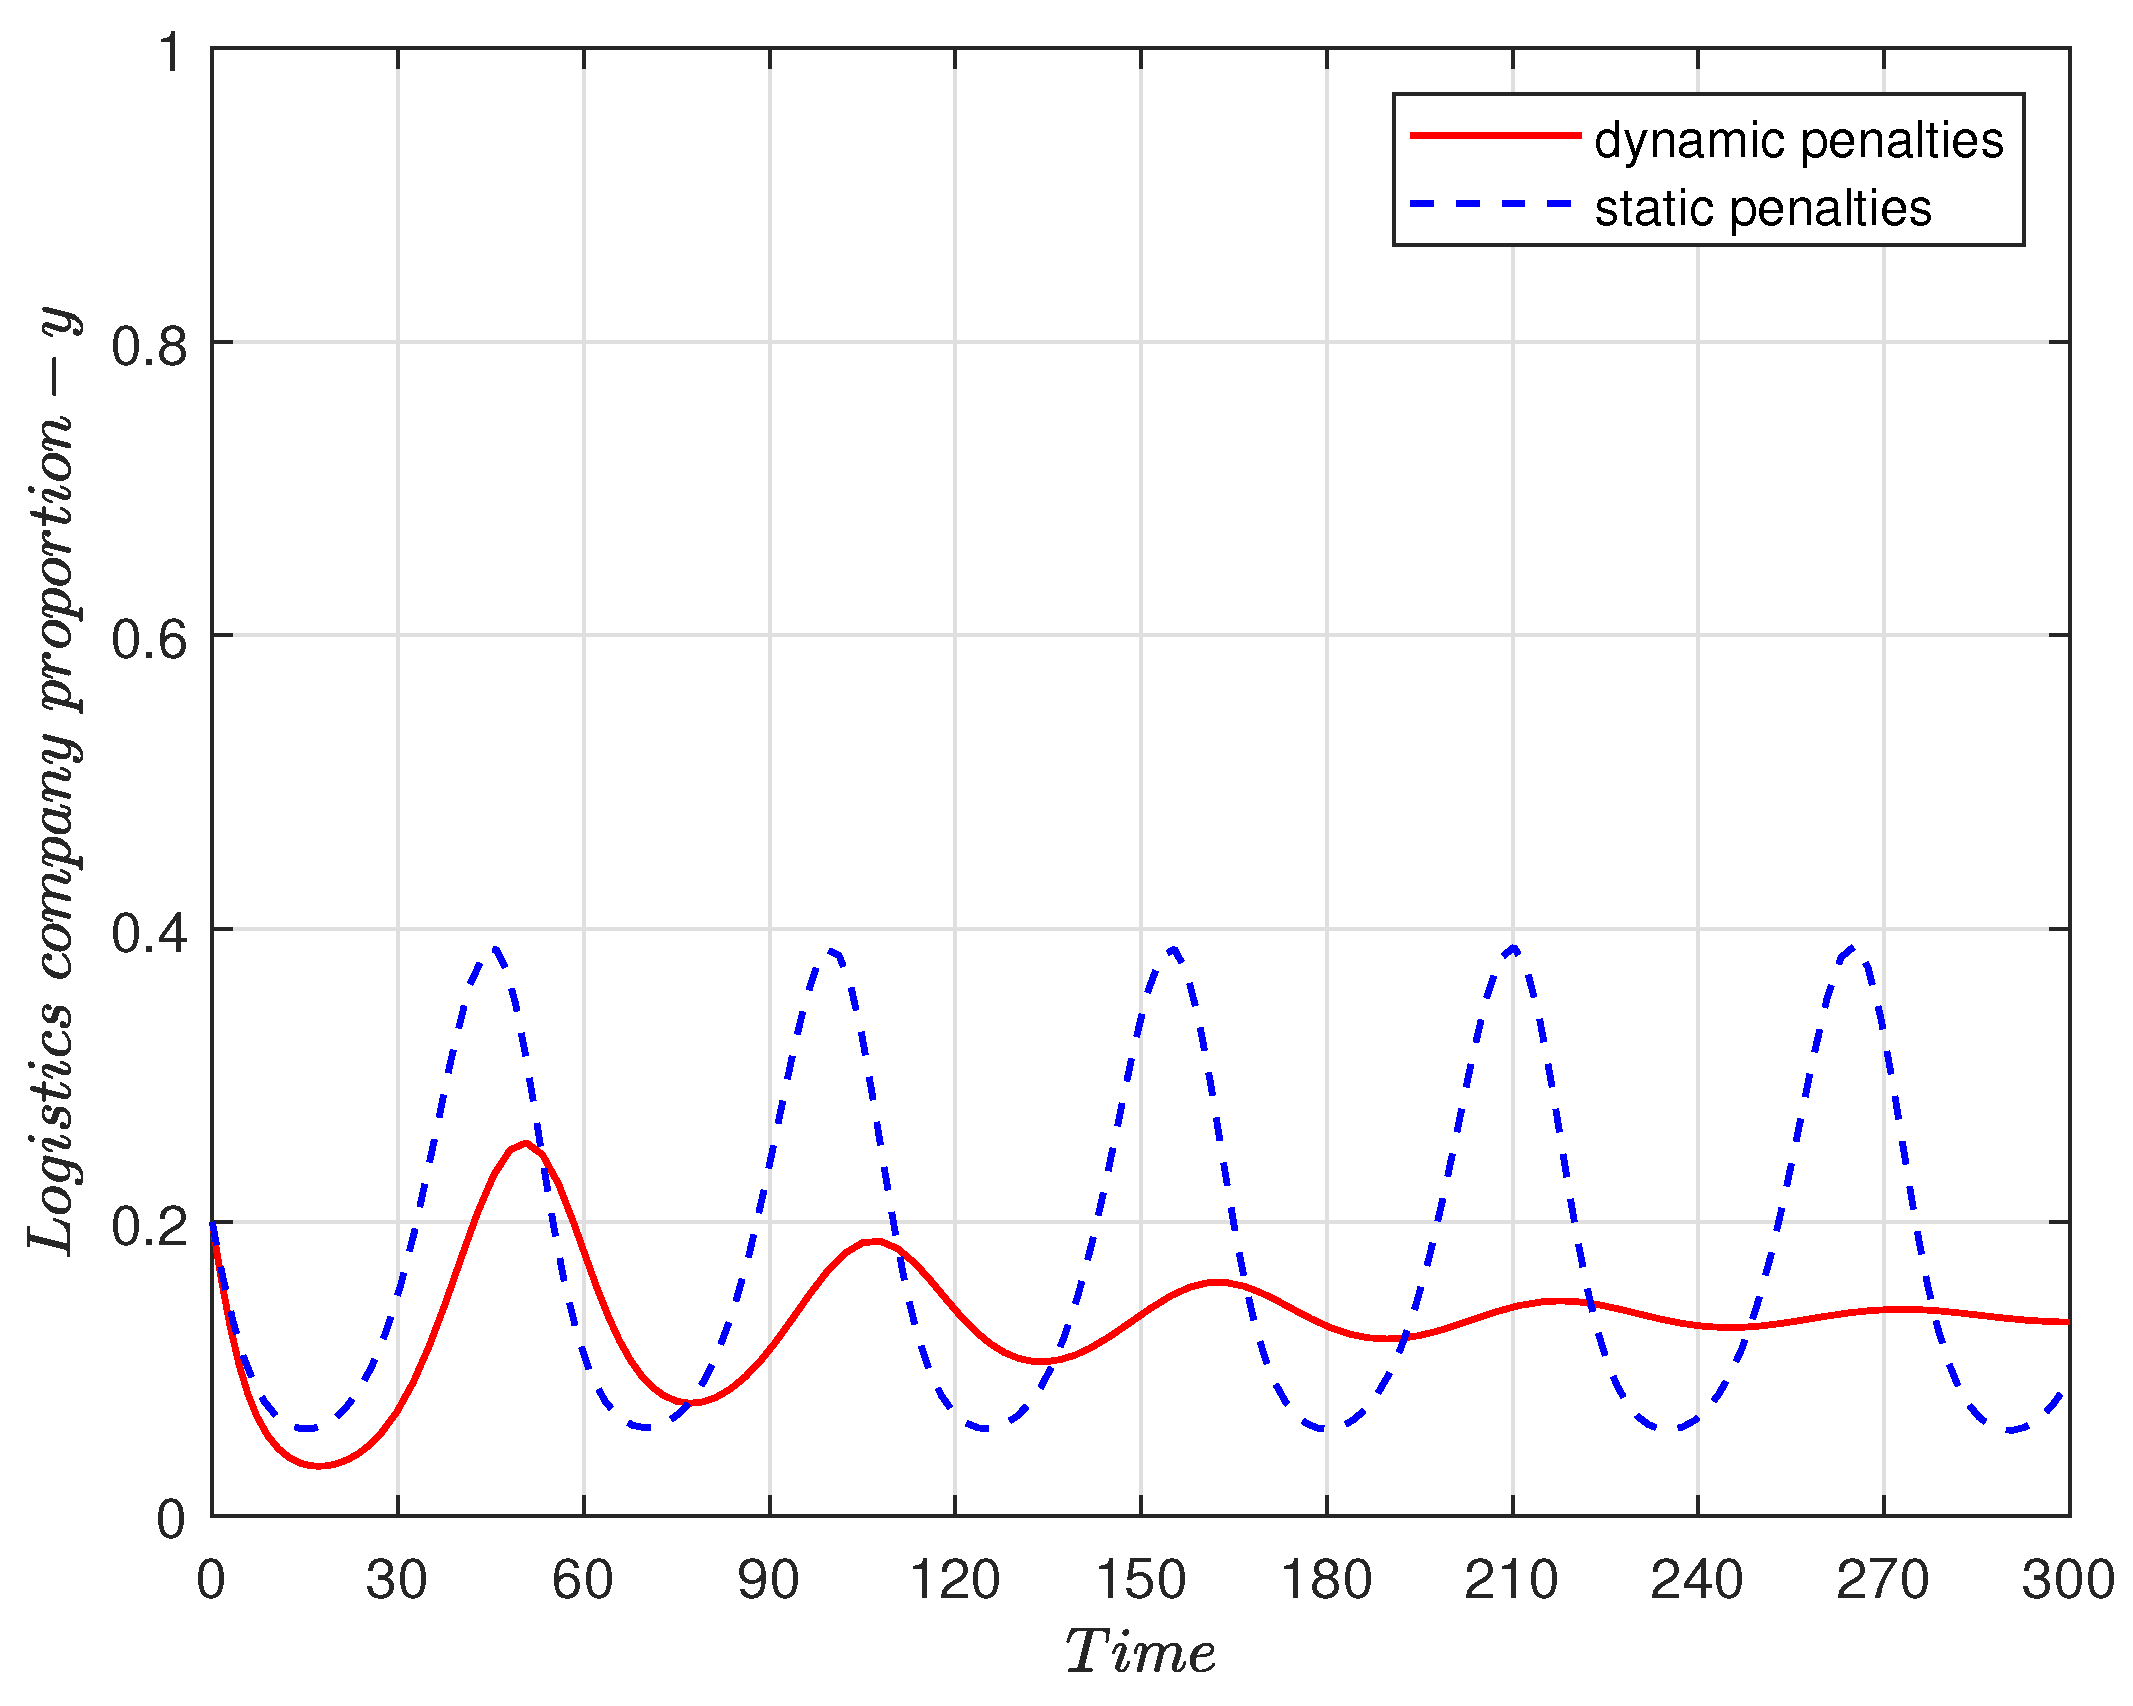
Figure 3 compares the impact of dynamic rewards versus static rewards on the proportion of logistics companies choosing green packaging over time when the initial possibility of choosing green packaging is . Notably, the system employing dynamic rewards exhibits an initial steep adjustment before transitioning into a more stable pattern with reduced variation over time. In contrast, the system with static rewards displays more pronounced and consistent oscillations, suggesting less stability in the behavior of logistics companies. This analysis indicates that dynamic rewards may facilitate quicker stabilization of green packaging choices in the logistics industry, while static rewards could lead to increased fluctuation and less predictability in companies’ sustainable practices.

Figure 3.
Evolution of logistics companies’ proportion under dynamic and static rewards. .
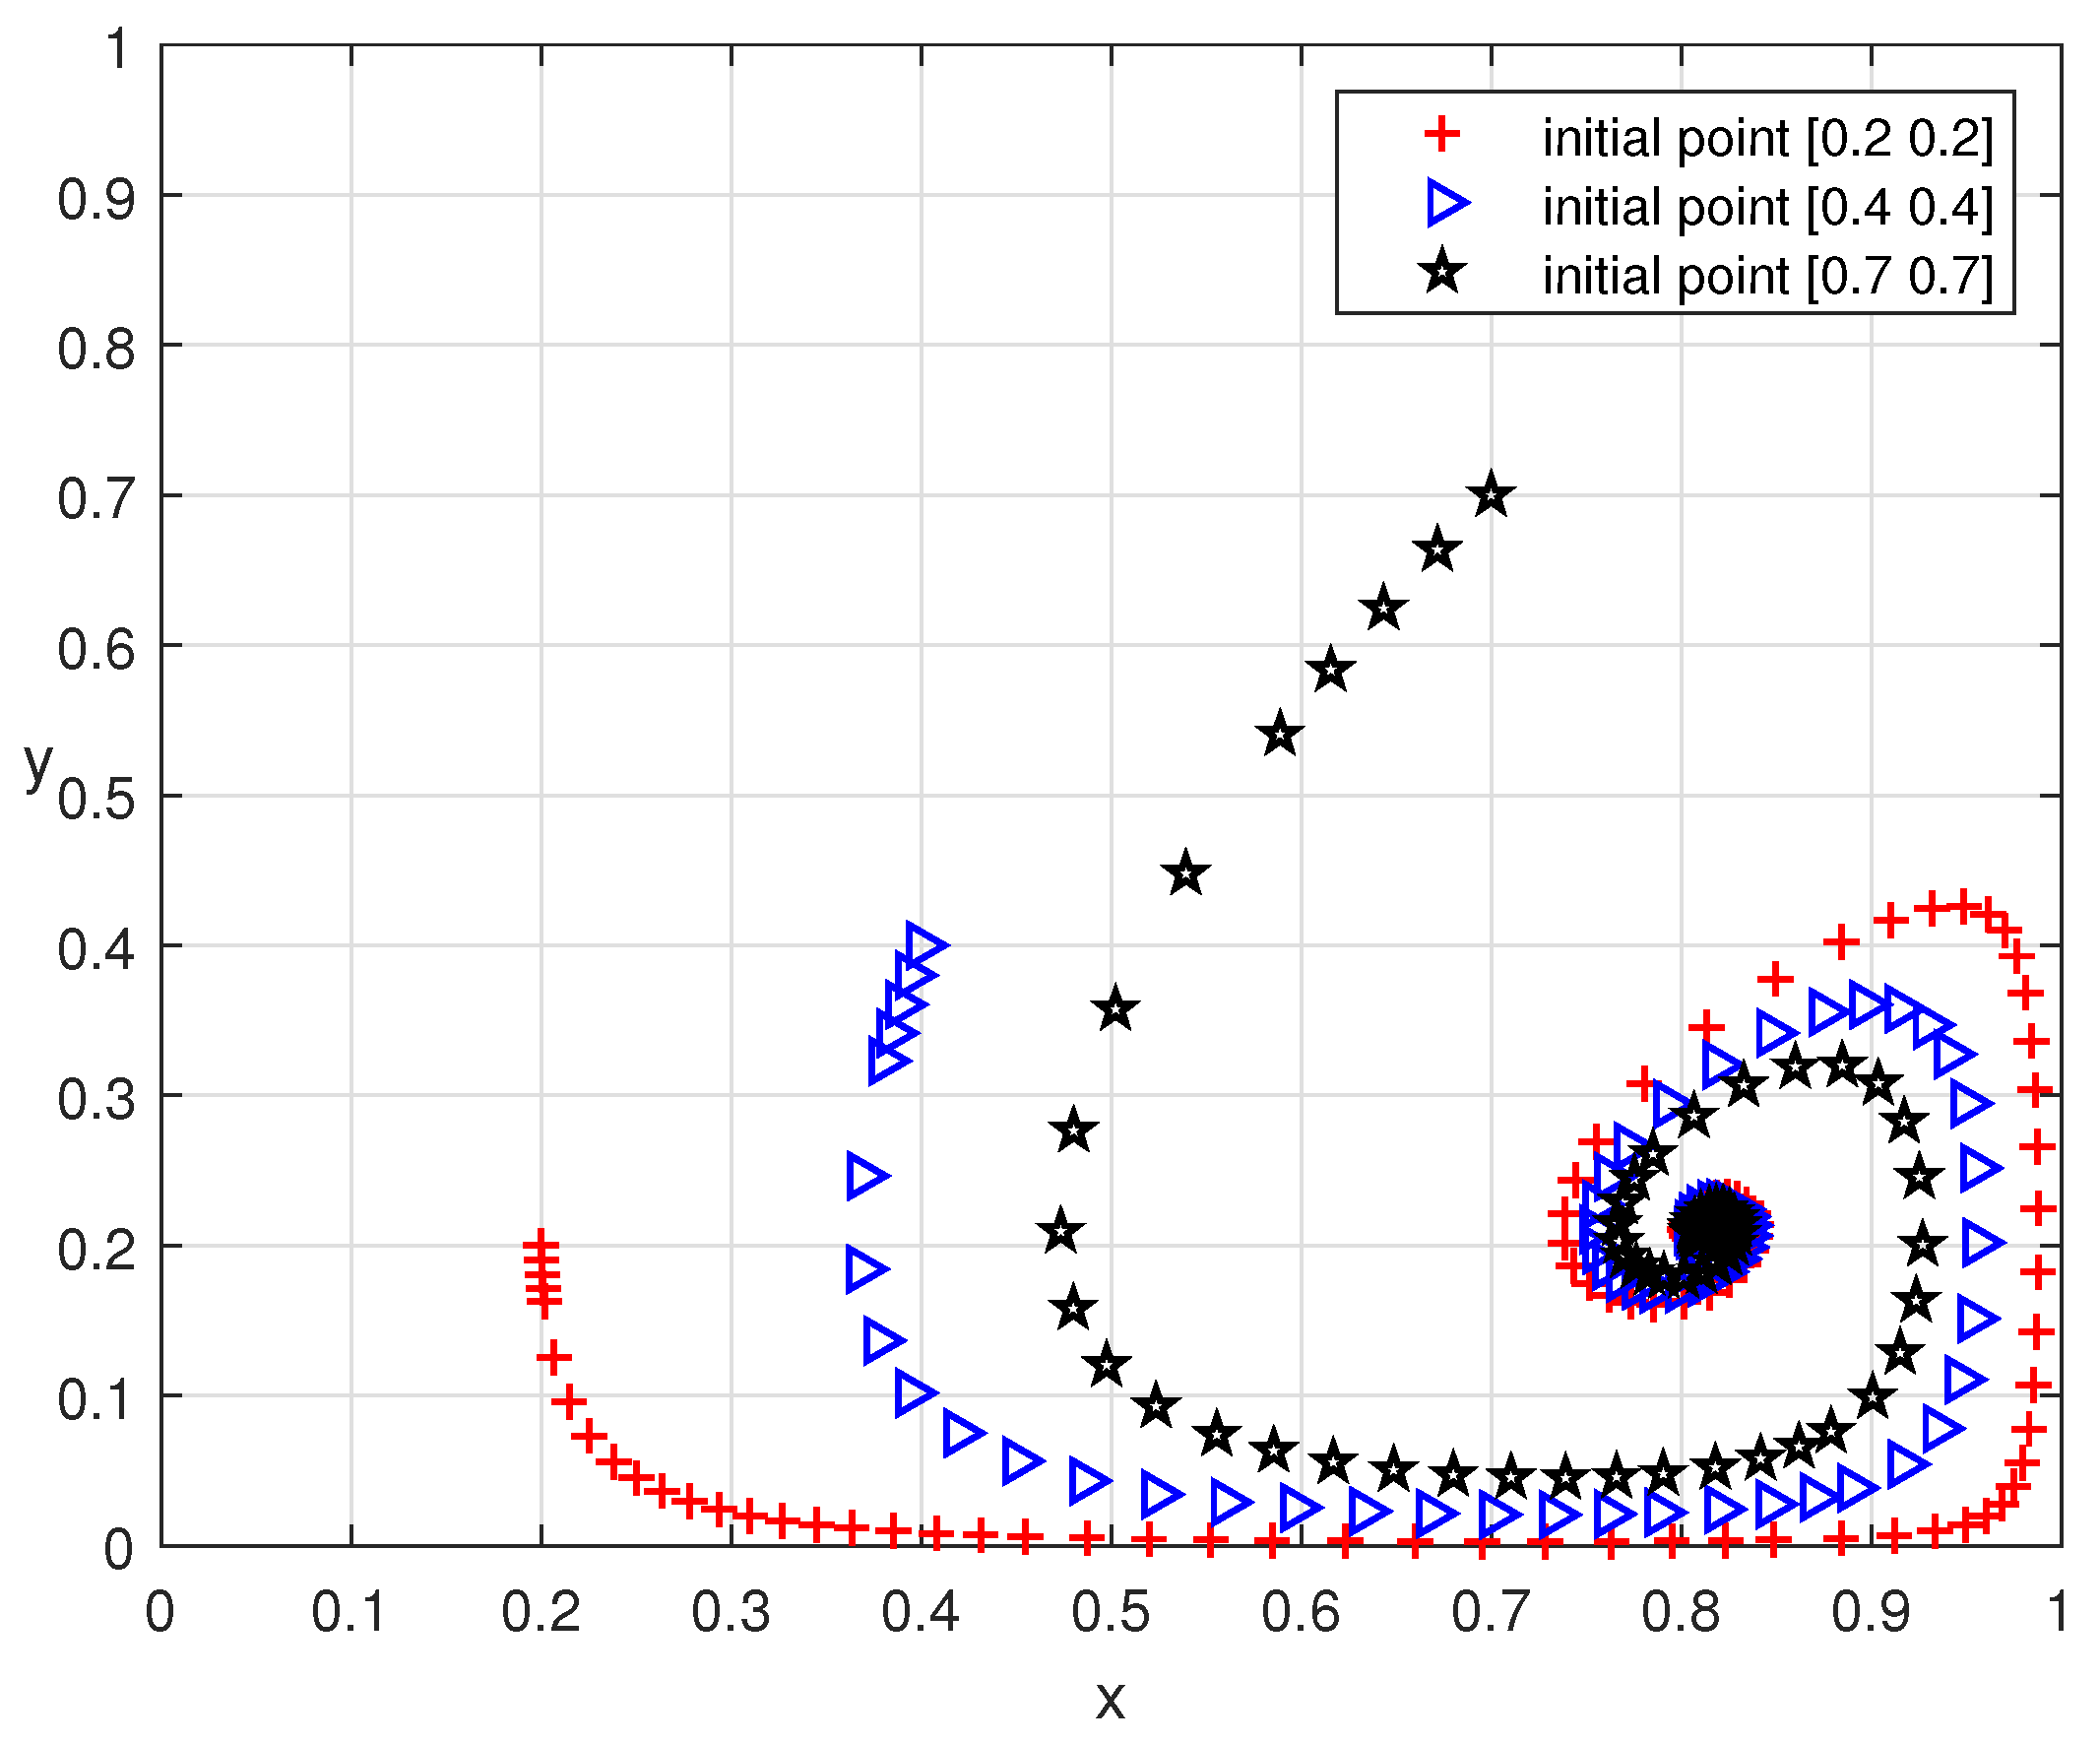
Figure 4 illustrates that under a policy combining dynamic rewards and static penalties, starting from three different initial conditions (, and ), the trajectories converge toward a central area, suggesting a stable equilibrium within this parameter space. Unlike the paths observed in systems with static rewards and penalties, these trajectories indicate that the combination of dynamic rewards and static penalties might foster converging behavior, where the strategies of both players stabilize over time. This central convergence point implies a consistent mix of regulatory and green packaging choices that both governments and logistics companies tend to adopt, reflecting the effectiveness of dynamic rewards in guiding the system toward a stable state.
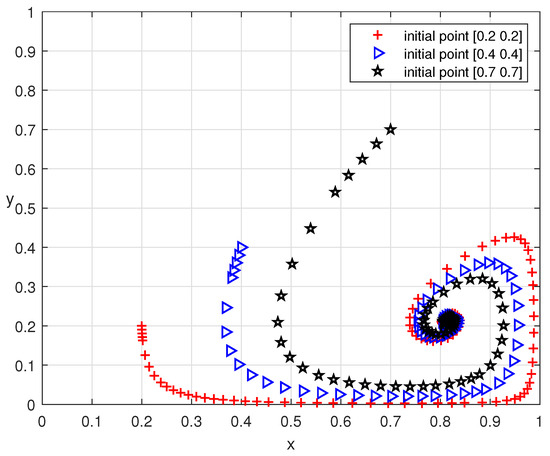
Figure 4.
Dynamic evolutionary process under dynamic rewards and static penalties.
Figure 5 illustrates the effects of dynamic penalties compared to static penalties on the proportion of logistics companies choosing green packaging over time. The red solid line represents the scenario with dynamic penalties, showing an initially volatile pattern that gradually stabilizes at a lower level of green packaging adoption. Figure 5 suggests that dynamic penalties, which increase as fewer companies opt for green packaging, effectively deter companies from choosing non-green alternatives over time, providing a more persistent deterrence compared to static penalties.
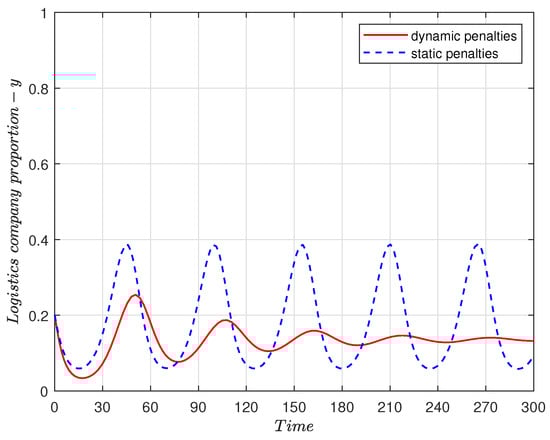
Figure 5.
Evolution of logistics companies’ proportion under dynamic and static penalties. .
Figure 6 displays the evolutionary paths of strategies for governments’ supervision probability, x, and the logistics companies’ probability of opting for green packaging, y, under static rewards and dynamic penalties. The paths originate from different initial strategy pairs: , and , demonstrating how the strategies evolve over time. Notably, the formation of a limit cycle around a central point for all three initial conditions suggests a stable pattern in the behavior of both players.
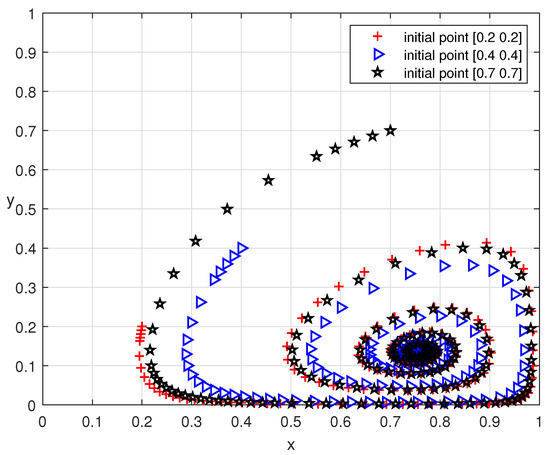
Figure 6.
Dynamic evolutionary process under static rewards and dynamic penalties.
Figure 7 illustrates the stabilization of logistics companies’ adoption of green packaging under three distinct systems, each with varying convergence rates and stabilization levels. System (2), which employs dynamic rewards and static penalties, exhibits the slowest convergence but ultimately maintains a high level of green packaging adoption. In contrast, System (3), characterized by static rewards and dynamic penalties, achieves a faster convergence rate but settles at the lowest level of green packaging usage. This suggests that, in this context, dynamic penalties may discourage the adoption of green packaging more effectively than dynamic rewards promote it. System (4), which implements both dynamic rewards and dynamic penalties, converges the fastest, reaching a steady state more quickly than the other systems, yet it stabilizes at a lower level than System (2). This indicates that while the combination of dynamic policies accelerates decision-making, it does not necessarily lead to the highest level of green packaging adoption. This analysis demonstrates how the type of incentives and penalties can critically affect both the speed of behavioral change and the ultimate sustainability outcomes within the logistics industry.
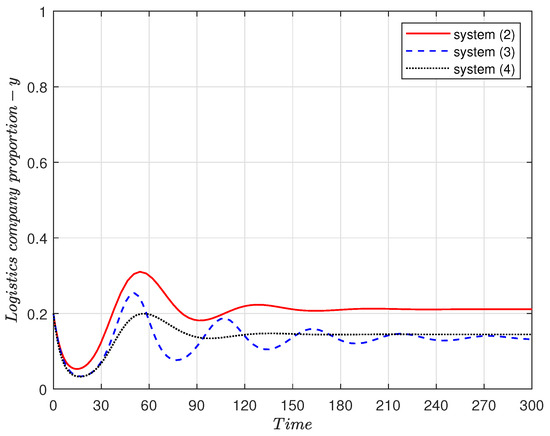
Figure 7.
Evolution of logistics companies’ proportion under system (2), (3) and (4). .
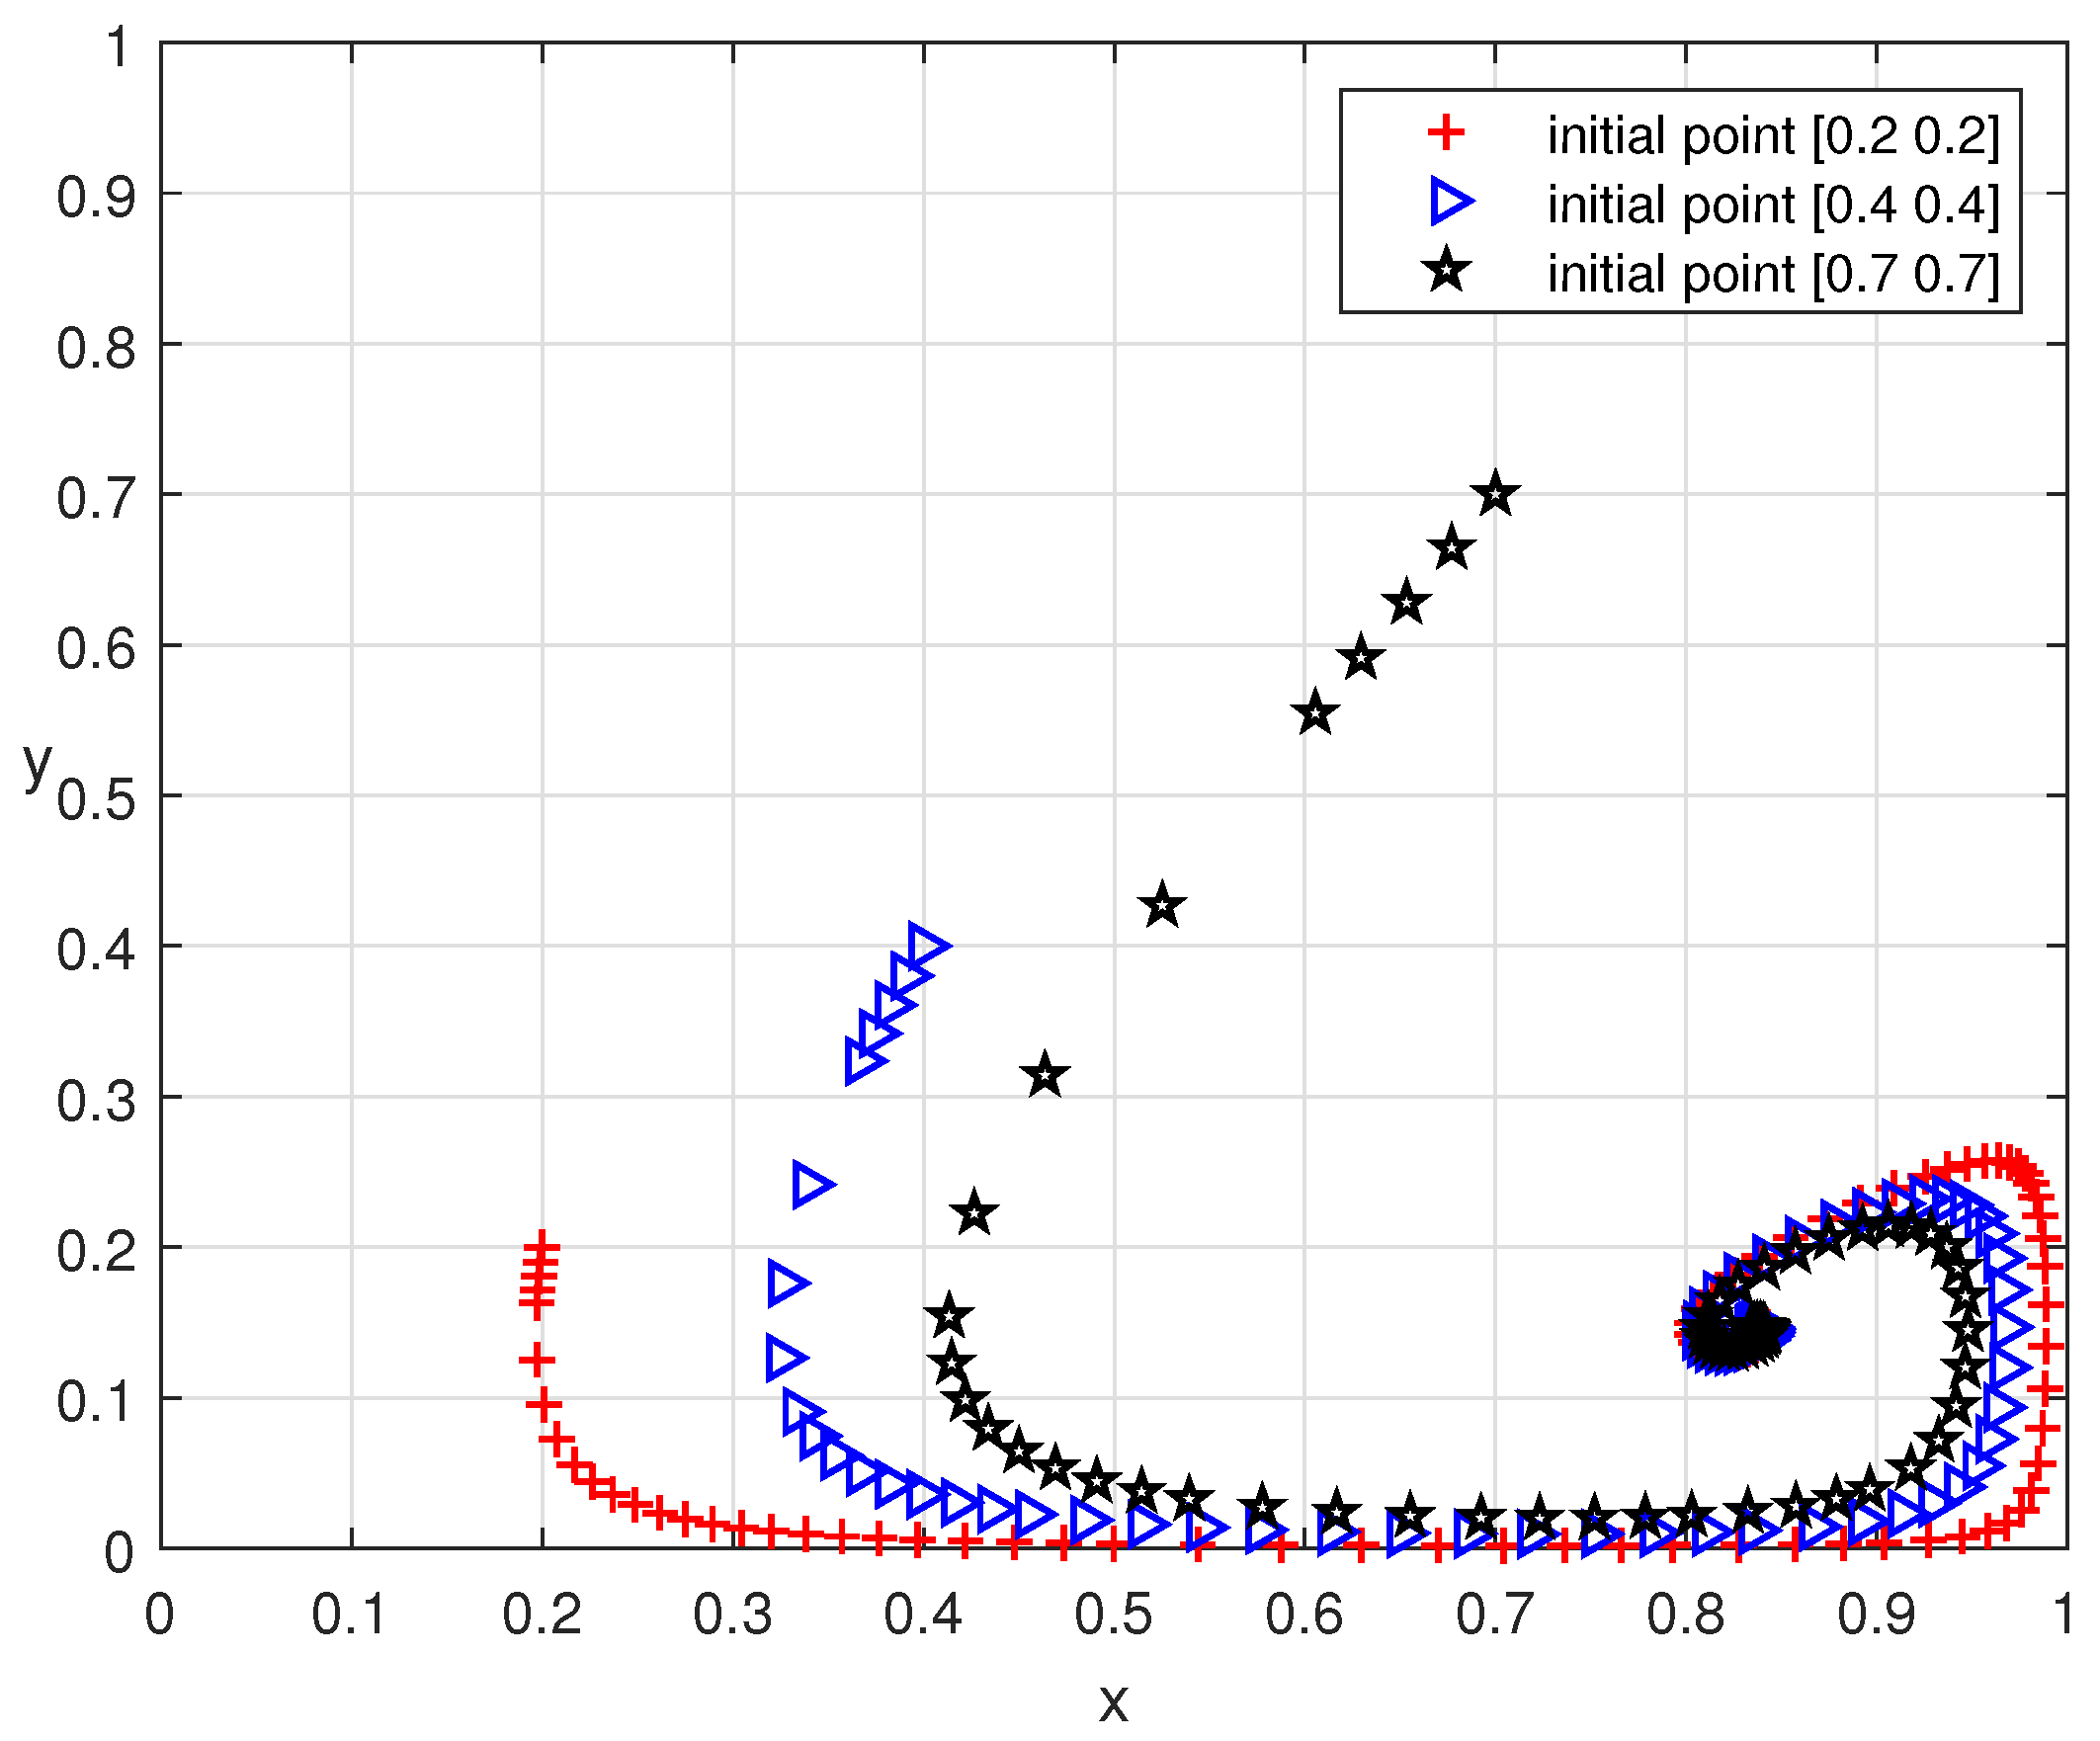
Figure 8 illustrates the evolutionary paths of the government’s supervision probability x and the logistics companies’ probability of adopting green packaging y under dynamic rewards and dynamic penalties. The trajectories, originating from three distinct initial conditions—, and —consistently converge toward a spiraling pattern. This convergence pattern—irrespective of the starting point—indicates that the strategies are drawn into a stable strategy.
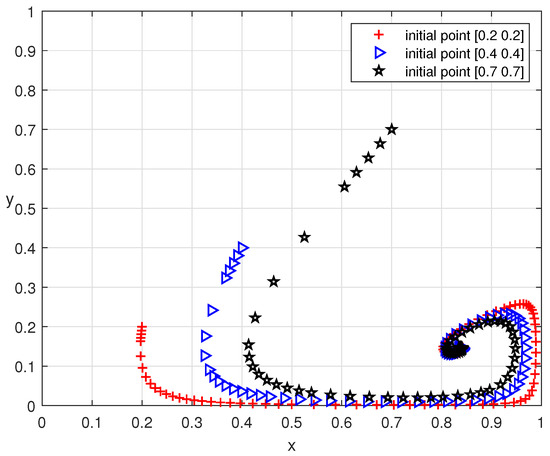
Figure 8.
Dynamic evolutionary process under dynamic rewards and dynamic penalties.
4.2. Sensitivity Analysis
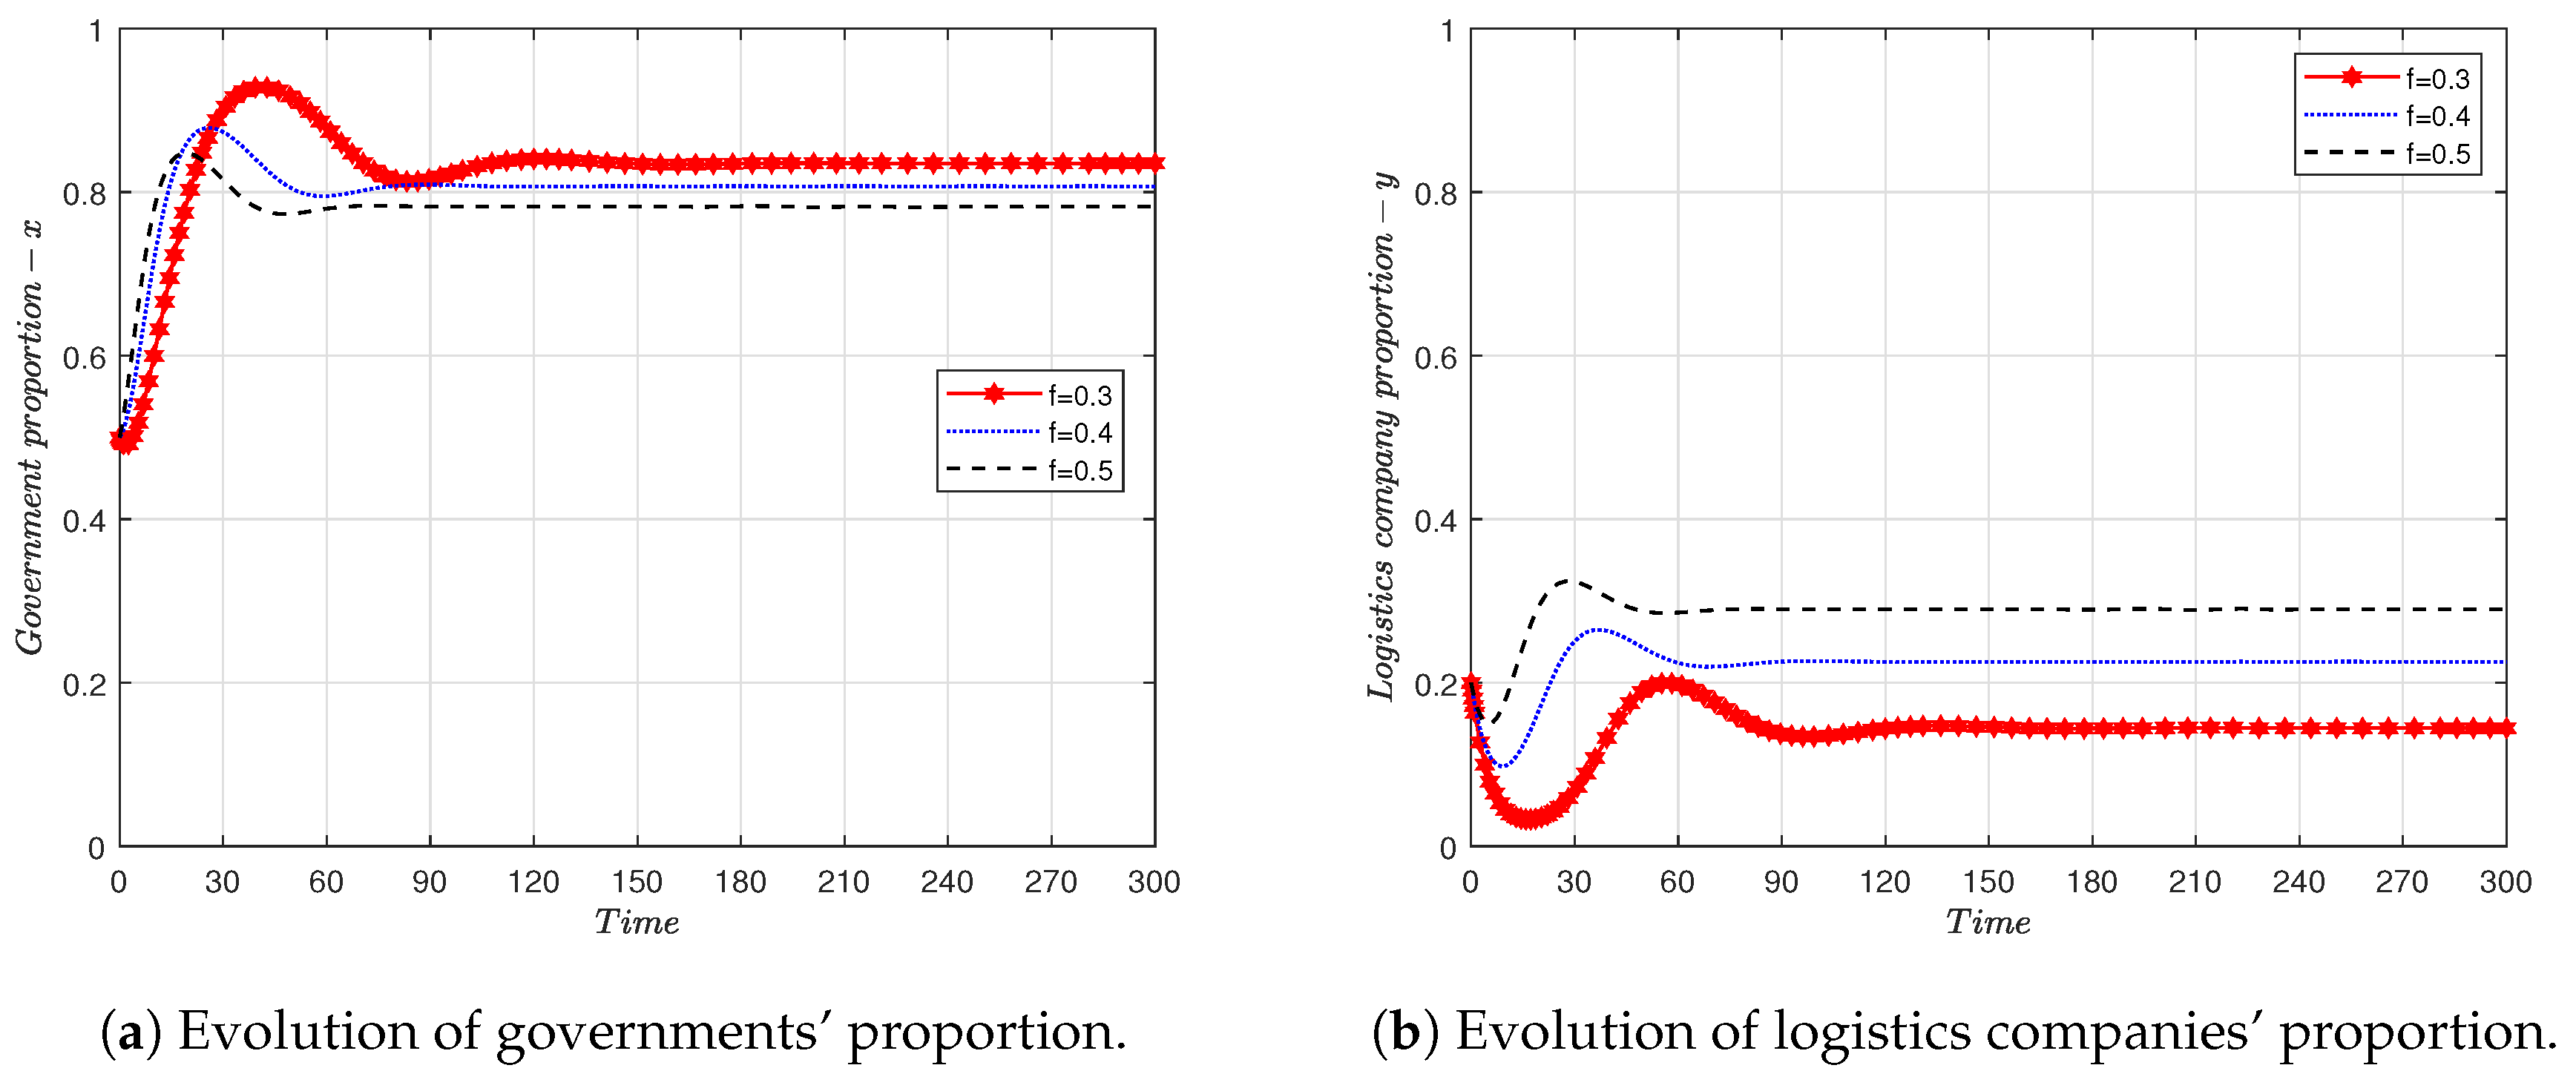
Figure 9a demonstrates that as the penalty for traditional packaging f increases, the probability of government regulation x decreases over time. This trend suggests that higher penalties may actually reduce the need for government intervention, as the market adapts and possibly self-regulates. In Figure 9b, it is observed that higher penalties f are associated with an increase in the probability of logistics companies adopting green packaging y, indicating that stronger financial disincentives for non-green practices effectively encourage companies to switch to environmentally friendly options.
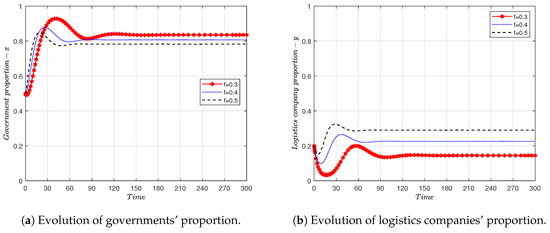
Figure 9.
Evolutionary results under different f. , .
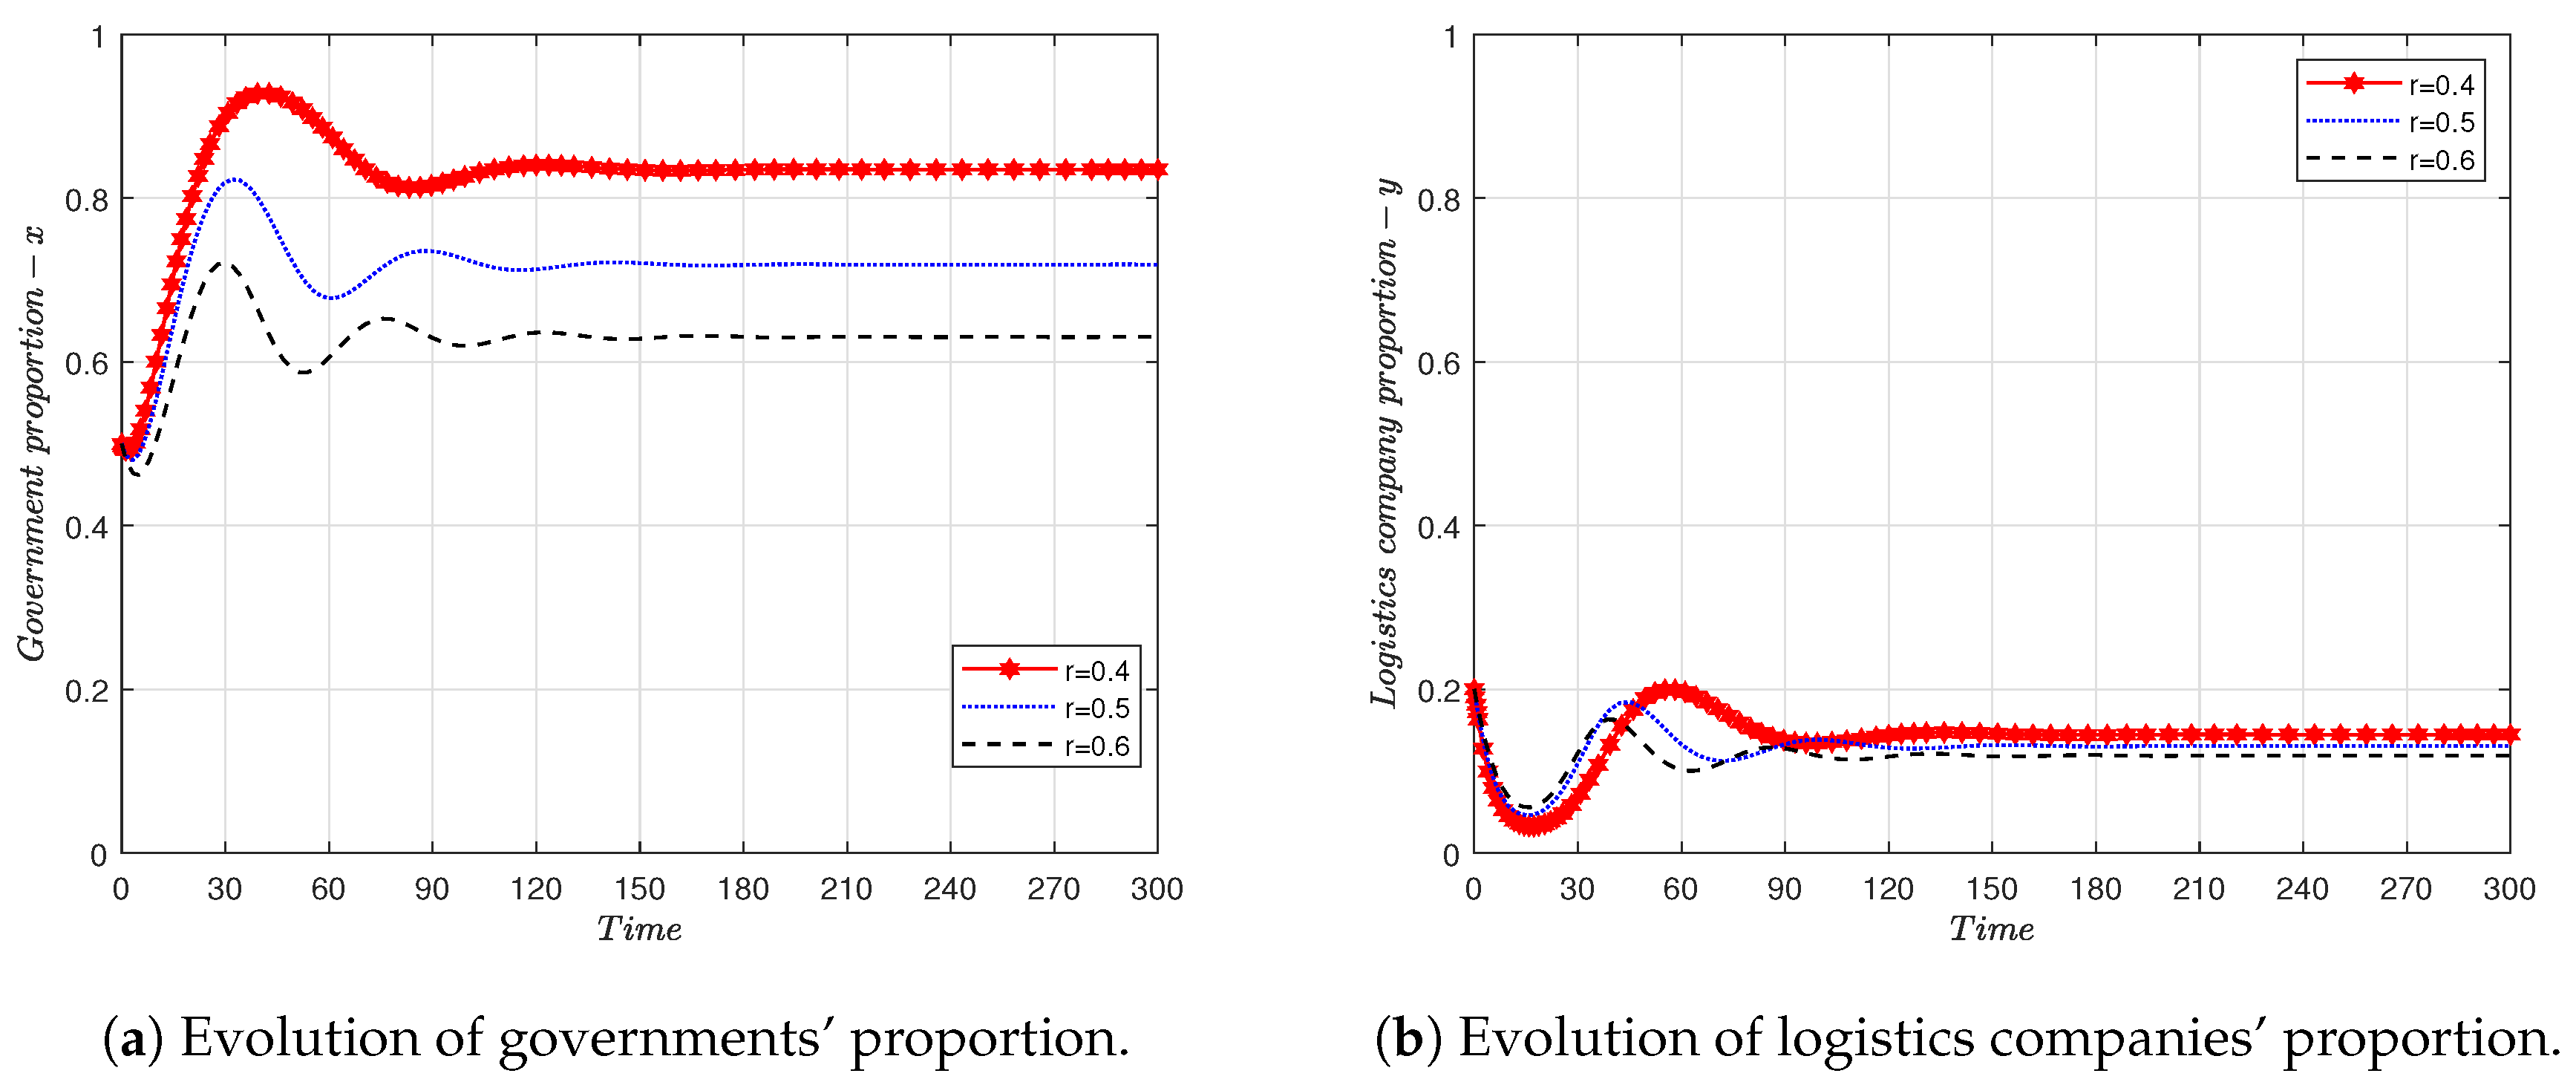
Figure 10a shows the governments’ probability of supervision, denoted as x. Here, higher rewards correspond to a decrease in x, indicating that increased incentives for companies to adopt green packaging lead to a reduction in government regulatory efforts. This reduction is likely because the incentives alone are sufficient to steer companies toward the desired outcomes without necessitating additional supervision. Figure 10b illustrates the probability of logistics companies adopting green packaging, denoted as y. As the reward, r, increases, there is a corresponding decrease in y.

Figure 10.
Evolutionary results under different f. , .
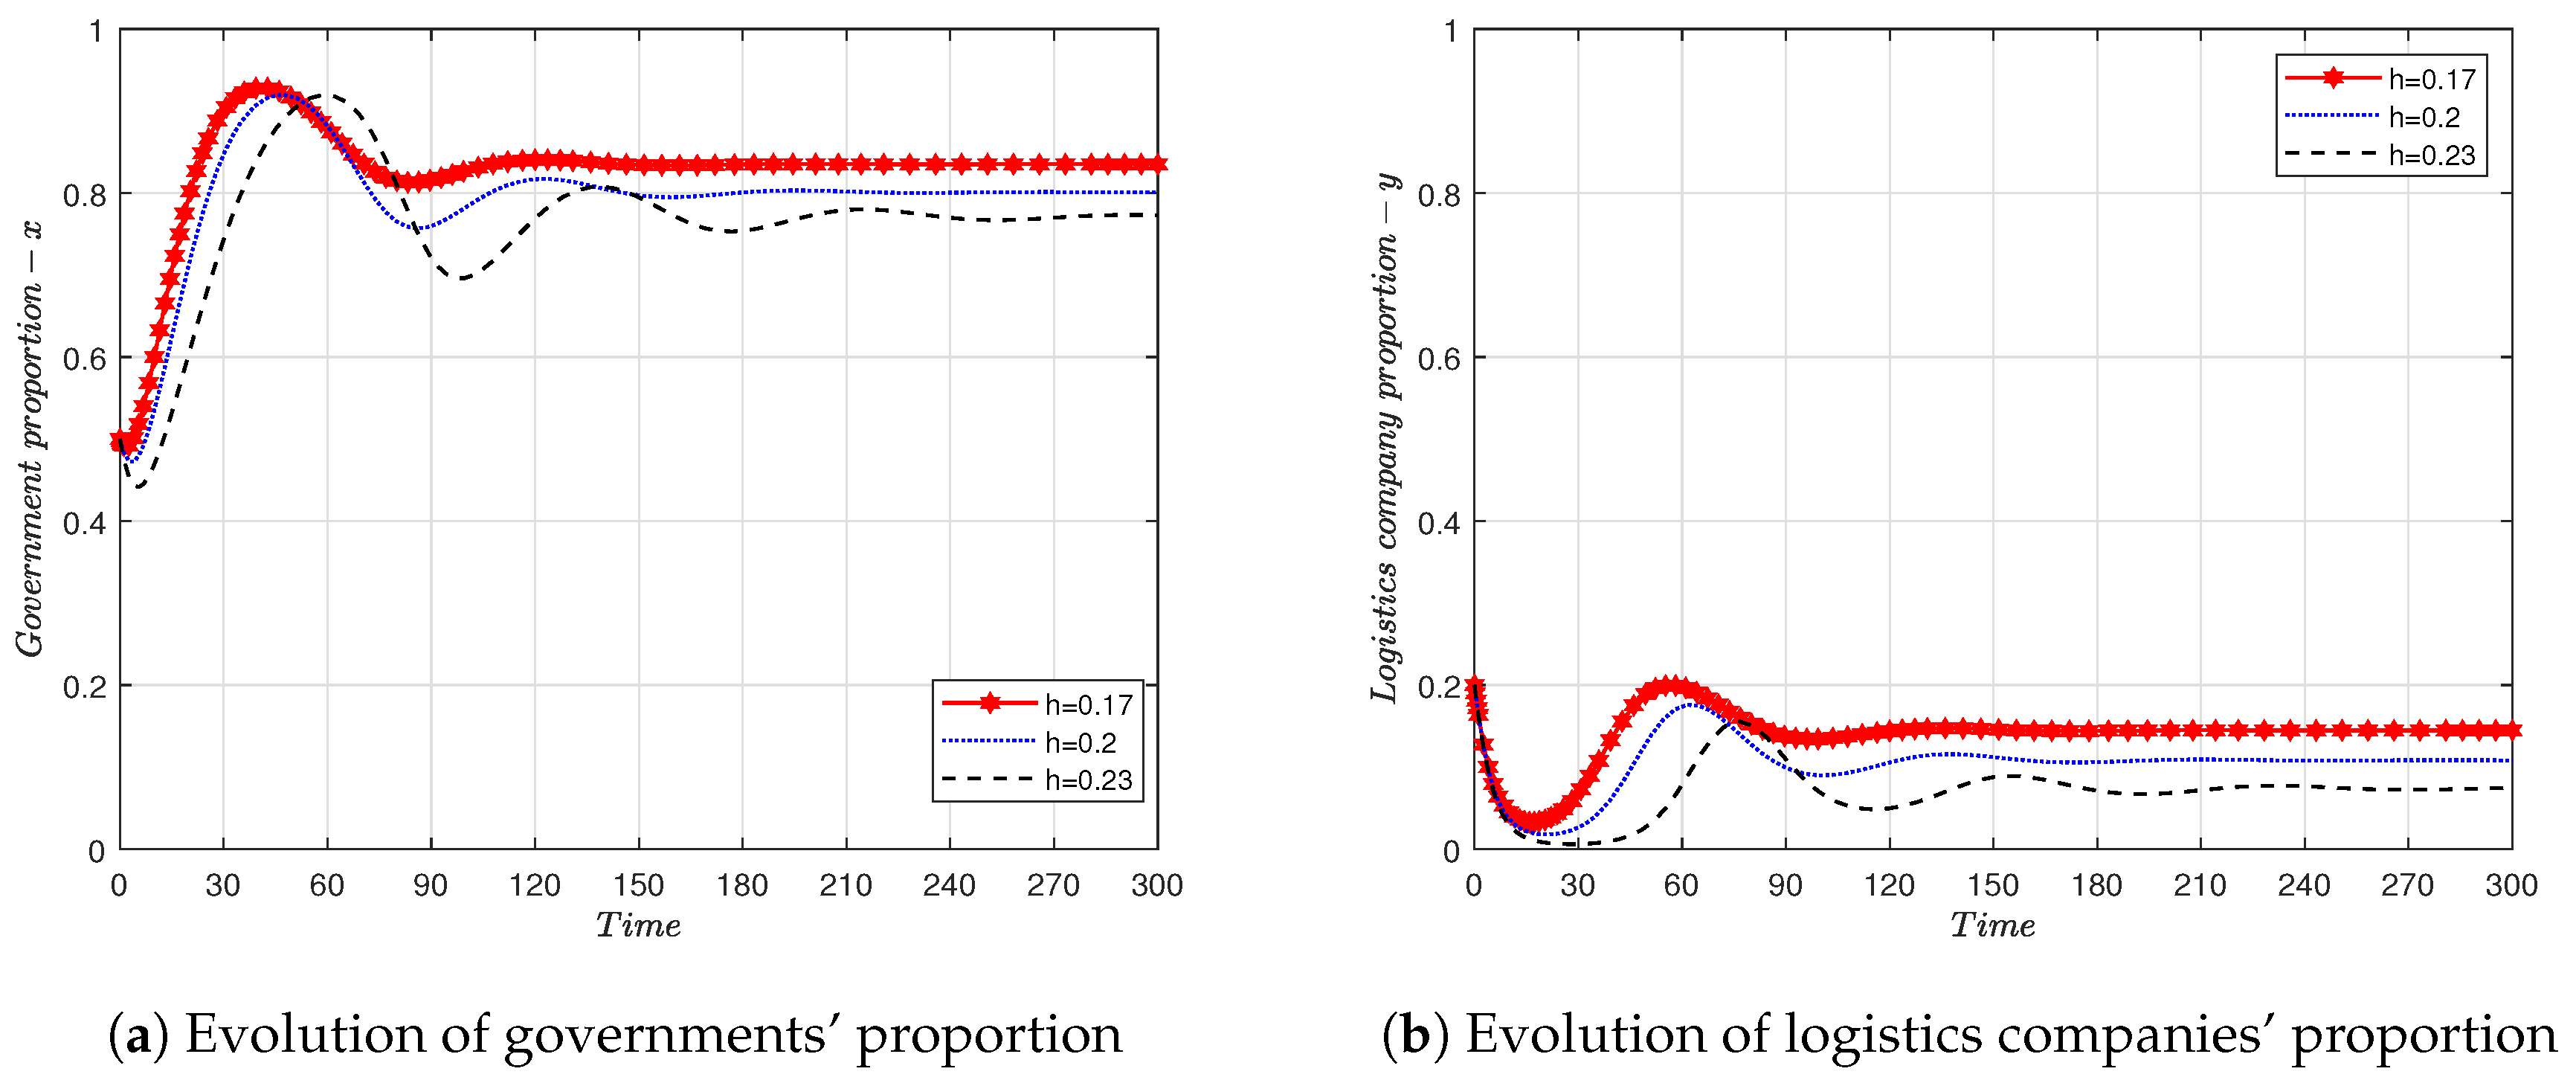
Figure 11a demonstrates that as supervision costs increase, governments’ propensity to supervise decreases, suggesting that costlier enforcement dissuades regulatory actions. Correspondingly, Figure 11b reveals that higher supervision costs also lead to a decrease in green packaging adoption by logistics companies. This trend is likely due to the anticipation of reduced regulatory enforcement, which diminishes the companies’ motivation to adopt environmentally friendly practices.
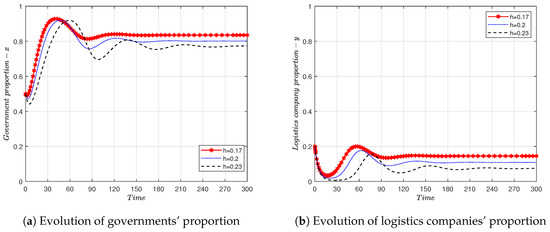
Figure 11.
Evolutionary results under different f. , .
5. Results and Discussions
From the above analysis, it can be seen that the cost of green packaging plays an important role in the promotion of green packaging in the logistics industry. When the cost of green packaging is high, logistics companies are unlikely to choose it. This view is consistent with Ahmed and Varshney [12]’s and Zhang and Zhao [5]’s view. Consequently, green packaging companies are highly focused on measures to reduce these costs. Unlike previous studies, this paper also found that even with government regulations, rewards for logistics companies that use green packaging, and penalties for those that use traditional packaging, high costs still deter the adoption of green packaging.
It is difficult to achieve the expected results in developing green packaging relying solely on market mechanisms; thus, government intervention is often necessary [5]. Our results align with the findings from studies such as those by Sun and Li [38], Rathore and Sarmah [39], and Xu and Yang [35], which also highlight the benefits of rewards and penalties. However, we incorporated dynamic government rewards and penalties, where incentives and penalties are adjusted according to the behavior of logistics companies. The findings from our evolutionary game theory model demonstrate that dynamic policies tend to be more effective in promoting the adoption of green packaging compared to static policies. Dynamic rewards can effectively encourage companies to transition to greener alternatives as they adapt to changing regulatory environments.
From the numerical simulations, we also found that among dynamic policies, dynamic rewards are more effective than dynamic penalties in encouraging more logistics companies to choose green packaging. This suggests that governments should focus more on rewards rather than penalties when promoting green packaging. However, if governments want logistics companies to adopt green packaging more quickly, they should focus more on penalties.
6. Conclusions
Our analysis of logistics companies’ decision-making in the context of government regulation reveals intricate dynamics influenced by the interplay between rewards and penalties. Through modeling and simulation of logistics companies’ behaviors under different government policies, we have gained valuable insights into the dynamics of adopting sustainable practices. Our study, which encompasses both static and dynamic rewards and penalties, has uncovered several key findings:
(1) The presence of static rewards and penalties tends to lead to oscillatory behavior among logistics companies, with no apparent steady state in the adoption of green packaging. This underscores the potential limitations of static policies in achieving long-term sustainability goals. Consequently, it is imperative for the government to refine these mechanisms to offer more effective incentives for logistics companies to implement green packaging solutions.
(2) When dynamic rewards or penalties are introduced, the adoption of green packaging by logistics companies initially fluctuates but eventually reaches a stable state. This suggests that dynamic incentives or penalties can effectively encourage sustainable practices. Therefore, the government needs to fine-tune the rewards for logistics companies that adopt green packaging and the penalties for those that do not, adjusting these based on the rate of green packaging adoption.
(3) Among the three dynamic policies examined, none holds an absolute advantage. Both dynamic rewards and dynamic penalties policies favor the broader adoption of green packaging by logistics companies. Additionally, the combination of dynamic rewards and penalties tends to converge more rapidly than other policies promoting green packaging.
(4) With rising government supervision costs, there is a tendency toward decreased regulatory actions and a consequent reduction in green packaging adoption by logistics companies. This indicates that the economic implications of enforcement play a significant role in shaping both government and corporate behavior, emphasizing the importance of considering enforcement costs in policy design. Therefore, the government should optimize its regulatory framework, aim to gradually reduce regulatory costs, and enhance regulatory efficiency and effectiveness.
This paper presents several limitations. First, this study does not take into account consumer reactions to green packaging. Second, the assumption that all green packaging types exert the same environmental impact is made. In practice, various types of green packaging may have differing impacts on environmental protection. For instance, recyclable packaging typically has a lesser environmental impact owing to its potential for multiple uses. Finally, future studies will examine the costs associated with transitioning from traditional to green packaging for logistics companies.
Author Contributions
Conceptualization, H.B.; writing—original draft preparation, X.Y.; writing—review and editing, X.D. All authors have read and agreed to the published version of the manuscript.
Funding
This research was funded by the Science Research Project of Hunan Provincial Department of Education grant number 21B0039, 23B0547, Hunan Provincial Education Science 14th Five-Year Plan Project: XJK22QJG001.
Institutional Review Board Statement
Not applicable.
Informed Consent Statement
Not applicable.
Data Availability Statement
Data are contained within the article.
Conflicts of Interest
The authors declare no conflicts of interest.
References
- Wang, F.; Hu, Y. Research on green express packaging design under the electronic commerce. Open J. Bus. Manag. 2016, 4, 621–628. [Google Scholar] [CrossRef]
- Forum, W.E. The New Plastics Economy-Catalysing Action; World Economic Forum: Geneva, Switzerland, 2017. [Google Scholar]
- Jambeck, J.R.; Geyer, R.; Wilcox, C.; Siegler, T.R.; Perryman, M.; Andrady, A.; Narayan, R.; Law, K.L. Plastic waste inputs from land into the ocean. Science 2015, 347, 768–771. [Google Scholar] [CrossRef] [PubMed]
- Repas, L. Paper Packaging Uses Three Billion Trees a Year. 2021. Available online: https://canopyplanet.org/paper-packaging-uses-three-billion-trees-a-year/ (accessed on 15 March 2024).
- Zhang, G.; Zhao, Z. Green packaging management of logistics enterprises. Phys. Procedia 2012, 24, 900–905. [Google Scholar] [CrossRef]
- Wong, C.W.; Lai, K.H.; Shang, K.C.; Lu, C.S.; Leung, T. Green operations and the moderating role of environmental management capability of suppliers on manufacturing firm performance. Int. J. Prod. Econ. 2012, 140, 283–294. [Google Scholar] [CrossRef]
- Pauer, E.; Wohner, B.; Heinrich, V.; Tacker, M. Assessing the environmental sustainability of food packaging: An extended life cycle assessment including packaging-related food losses and waste and circularity assessment. Sustainability 2019, 11, 925. [Google Scholar] [CrossRef]
- Bag, B. What Is Green Packaging? 2019. Available online: https://bulkbagreclamation.com/what-is-green-packaging/ (accessed on 15 May 2024).
- Sick. Green Packaging and Plastics, Solutions for 2023 and Beyond. 2023. Available online: https://www.sick.com/gb/en/green-packaging-and-plastics-solutions-for-2023-and-beyond/w/Blog-Green%20packaging%20/ (accessed on 15 May 2024).
- Xiang, N.; Xu, F.; Sha, J. Simulation analysis of China’s energy and industrial structure adjustment potential to achieve a low-carbon economy by 2020. Sustainability 2013, 5, 5081–5099. [Google Scholar] [CrossRef]
- Molina-Besch, K.; Pålsson, H. A supply chain perspective on green packaging development-theory versus practice. Packag. Technol. Sci. 2016, 29, 45–63. [Google Scholar] [CrossRef]
- Ahmed, J.; Varshney, S.K. Polylactides—Chemistry, properties and green packaging technology: A review. Int. J. Food Prop. 2011, 14, 37–58. [Google Scholar] [CrossRef]
- Sharma, C.; Bhardwaj, N.K.; Pathak, P. Static intermittent fed-batch production of bacterial nanocellulose from black tea and its modification using chitosan to develop antibacterial green packaging material. J. Clean. Prod. 2021, 279, 123608. [Google Scholar] [CrossRef]
- Fullerton, D.; Wu, W. Policies for green design. J. Environ. Econ. Manag. 1998, 36, 131–148. [Google Scholar] [CrossRef]
- Tencati, A.; Pogutz, S.; Moda, B.; Brambilla, M.; Cacia, C. Prevention policies addressing packaging and packaging waste: Some emerging trends. Waste Manag. 2016, 56, 35–45. [Google Scholar] [CrossRef] [PubMed]
- Larrain, M.; Billen, P.; Van Passel, S. The effect of plastic packaging recycling policy interventions as a complement to extended producer responsibility schemes: A partial equilibrium model. Waste Manag. 2022, 153, 355–366. [Google Scholar] [CrossRef] [PubMed]
- Li, J.; Liu, P. Modeling green supply chain games with governmental interventions and risk preferences under fuzzy uncertainties. Math. Comput. Simul. 2022, 192, 182–200. [Google Scholar] [CrossRef]
- Wiesmeth, H.; Shavgulidze, N.; Tevzadze, N. Environmental policies for drinks packaging in Georgia: A mini-review of EPR policies with a focus on incentive compatibility. Waste Manag. Res. 2018, 36, 1004–1015. [Google Scholar] [CrossRef] [PubMed]
- Wossen Kassaye, W. Green dilemma. Mark. Intell. Plan. 2001, 19, 444–455. [Google Scholar] [CrossRef]
- Zailani, S.; Amran, A.; Jumadi, H. Green innovation adoption among logistics service providers in Malaysia: An exploratory study on the managers’ perceptions. Int. Bus. Manag. 2011, 5, 104–113. [Google Scholar] [CrossRef]
- Pillay, K.; Mbhele, T.P. The challenges of green logistics in the Durban road freight industry. Environ. Econ. 2015, 6, 64–73. [Google Scholar]
- Zhang, Y.; Thompson, R.G.; Bao, X.; Jiang, Y. Analyzing the promoting factors for adopting green logistics practices: A case study of road freight industry in Nanjing, China. Procedia-Soc. Behav. Sci. 2014, 125, 432–444. [Google Scholar] [CrossRef]
- Wang, Z.; Mathiyazhagan, K.; Xu, L.; Diabat, A. A decision making trial and evaluation laboratory approach to analyze the barriers to Green Supply Chain Management adoption in a food packaging company. J. Clean. Prod. 2016, 117, 19–28. [Google Scholar] [CrossRef]
- Huang, Q.; Wang, J.; Ye, M.; Zhao, S.; Si, X. A study on the incentive policy of China’s prefabricated residential buildings based on evolutionary game theory. Sustainability 2022, 14, 1926. [Google Scholar] [CrossRef]
- Shi, C.; Miao, X.; Xu, T.; Gao, W.; Liu, G.; Li, S.; Lin, Y.; Wei, X.; Liu, H. Promoting Sponge City Construction through Rainwater Trading: An Evolutionary Game Theory-Based Analysis. Water 2023, 15, 771. [Google Scholar] [CrossRef]
- Yao, N.; Tan, X.; Zhang, Y.; Qu, Y.; Han, X.; Li, Z. Multi-agent evolutionary game analysis on the implementation of municipal solid waste classification policy. Front. Sustain. Cities 2023, 5, 954323. [Google Scholar] [CrossRef]
- Zhou, C.; Han, Y.; Zhang, R. Can Command-and-Control Policy Drive Low-Carbon Transition in Energy-Intensive Enterprises?-A study based on evolutionary game theory. Front. Energy Res. 2023, 11, 1247780. [Google Scholar] [CrossRef]
- Sui, Y.; Sun, Q.; Li, S. Government mechanism in waste electrical and electronic equipment recycling among prospect theory and evolutionary game theory. Energy Environ. 2024, 0958305X241228511. [Google Scholar] [CrossRef]
- Yan, Y.; Cao, Y. Three-party behavior strategy selection and simulation of monetary compensation for marine environmental damage based on evolutionary game theory. Ocean. Coast. Manag. 2024, 250, 107025. [Google Scholar] [CrossRef]
- Friedman, D. Evolutionary games in economics. Econom. J. Econom. Soc. 1991, 637–666. [Google Scholar] [CrossRef]
- Taylor, P.D.; Jonker, L.B. Evolutionary stable strategies and game dynamics. Math. Biosci. 1978, 40, 145–156. [Google Scholar] [CrossRef]
- Lin, J. How to reduce overpackaging of food in China: Analysis based on evolutionary game. Sustain. Prod. Consum. 2022, 31, 529–545. [Google Scholar] [CrossRef]
- Sui, Y.; Sun, Q.; Zhu, X. Optimising Express Packaging Recycling: A Tripartite Evolutionary Game Modelling Government Strategies under Extended Producer Responsibility. Environ. Technol. Innov. 2024, 33, 103510. [Google Scholar] [CrossRef]
- Mahmoud, M.A.; Tsetse, E.K.K.; Tulasi, E.E.; Muddey, D.K. Green packaging, environmental awareness, willingness to pay and consumers’ purchase decisions. Sustainability 2022, 14, 16091. [Google Scholar] [CrossRef]
- Xu, X.; Yang, Y. Analysis of the dilemma of promoting circular logistics packaging in China: A stochastic evolutionary game-based approach. Int. J. Environ. Res. Public Health 2022, 19, 7363. [Google Scholar] [CrossRef] [PubMed]
- Ding, L.; Guo, Z.; Xue, Y. Dump or recycle? Consumer’s environmental awareness and express package disposal based on an evolutionary game model. Environ. Dev. Sustain. 2023, 25, 6963–6986. [Google Scholar] [CrossRef] [PubMed]
- Zhang, S.; Yu, Y.; Zhu, Q.; Qiu, C.M.; Tian, A. Green innovation mode under carbon tax and innovation subsidy: An evolutionary game analysis for portfolio policies. Sustainability 2020, 12, 1385. [Google Scholar] [CrossRef]
- Sun, H.; Li, J. Behavioural choice of governments, enterprises and consumers on recyclable green logistics packaging. Sustain. Prod. Consum. 2021, 28, 459–471. [Google Scholar] [CrossRef]
- Rathore, P.; Sarmah, S. Modeling and identification of suitable motivational mechanism in the collection system of municipal solid waste supply chain. Waste Manag. 2021, 129, 76–84. [Google Scholar] [CrossRef]

Disclaimer/Publisher’s Note: The statements, opinions and data contained in all publications are solely those of the individual author(s) and contributor(s) and not of MDPI and/or the editor(s). MDPI and/or the editor(s) disclaim responsibility for any injury to people or property resulting from any ideas, methods, instructions or products referred to in the content. |
© 2024 by the authors. Licensee MDPI, Basel, Switzerland. This article is an open access article distributed under the terms and conditions of the Creative Commons Attribution (CC BY) license (https://creativecommons.org/licenses/by/4.0/).