Article

Spatiotemporal Variation of Correlated Color Temperature in the Tunnel Access Zone

1
China Railway Siyuan Survey and Design Group Co., Ltd., Wuhan 430063, China
2
Beijing Key Laboratory of Green Building Environment and Energy Saving Technology, Beijing University of Technology, Beijing 100124, China
3
Faculty of Architecture, Civil and Transportation Engineering, Beijing University of Technology, Beijing 100124, China
*
Author to whom correspondence should be addressed.
Sustainability 2024, 16(11), 4838; https://doi.org/10.3390/su16114838
Submission received: 6 May 2024 / Revised: 30 May 2024 / Accepted: 4 June 2024 / Published: 5 June 2024
(This article belongs to the Section Green Building)

Abstract

:
A scientific and logical tunnel entrance lighting environment is an important guarantee for the safety of drivers entering tunnels as well as an essential element for the sustainable development of the tunnel. At present, most of the highway tunnel entrance lighting environment focuses on the road surface luminance and does not consider the variation of correlated color temperatures (CCT) on the driver’s vision in the tunnel access zone. This study analyzes the temporal and spatial variation of the ambient CCT in the driver’s 20° field of view during the approach to the tunnel through field dynamic tests of existing tunnels in the Beijing area. As a result, the CCT received by the driver’s eyes when approaching the tunnel peaks at the midpoint of the tunnel access zone, after which it decreases slowly up to the tunnel portal. Moreover, a calculation model of the CCT outside the tunnel with the solar irradiance, the distance from the tunnel portal, and the CCT of tunnel interior lighting as the input parameters is established. The modeling methodology was validated in a new tunnel, and the calculation model’s average absolute error is within 5%, which could provide guidance for the selection of the tunnel interior lighting CCT and a basis for the design of intelligent control of sustainable lighting systems in tunnels.

1. Introduction

1.1. Tunnel-Luminous Environment

With the acceleration of the urbanization process, the increase in transportation demand, and the development of technology, more and more countries and regions are increasing their investment in highway tunnel construction. There are more than 24,850 existing road tunnels with a length of 26.78 million meters, and among them are 1582 new ones with 2.08 million meters in China [1,2,3]. The increase in the number and length of tunnels makes the problem of tunnel traffic safety gradually more prominent. As a special section of the highway, the tunnel has the particularities of a semi-closed channel, narrow space, and blocked vision. These factors determine that there is a great difference between tunnel lighting and general road lighting. The driver is able to produce a series of special visual effects and problems when passing through the tunnel, such as “black hole”, “white hole”, “visual lag”, stroboscopic effect, etc. [4,5,6]. According to Lai et al., the three periods with the most accidents in the tunnel section are 9:00~10:00, 11:00~12:00, and 13:00~15:00, accounting for about 7.70%, 8.52%, and 14.46% of the total accidents throughout the day [7]. The main causes of the accident are the speed illusion and distance illusion caused by the visual disparity and the driver’s inadaptability to the difference in light environment inside and outside the tunnel. In order to ensure that the driver has a good visual environment and traffic safety in the tunnel driving process, a reasonable and practical tunnel light environment is crucial to ensuring driving safety [8,9,10]. According to CIE technical report 100-1992 [11], visual information found in the fovea of the macular eye depends not only on the brightness of the object but also on the color of the object. According to the basic principle of optics, the correlated color temperature (CCT) in the tunnel light environment also has an important influence on human eye vision.

1.2. Traffic Color Environment

At present, the specification and research of tunnels at home and abroad mainly focus on the tunnel luminance, but studies have proved that the color of the traffic environment is also one of the important factors affecting traffic safety [12,13,14,15,16]. In 1987, Zube et al. [17] studied the influence of road color information on the visual psychological effect of drivers through a 3DMax simulation experiment and found that the psychological effect of road color is universal for different drivers, and the color psychological effect of drivers is proportional to the driving speed. In 1994, Chapanis et al. [18] found that color affects the driver’s perception of road information, and bright objects on the surface could help drivers identify roads faster. In 1999, Mcgwin and Brown [19] set horizontal deceleration signs on the colored road surface at the access zone, which can improve the effective control of the driving speed at the access zone, thus reducing the demand for visual distance during the deceleration process. Similarly, reducing the probability of visual discomfort caused by significant color differences inside and outside the tunnel can also reduce the occurrence of traffic accidents [20,21,22]. It is known that the CCT outside the tunnel changes over time, and the CCT inside the tunnel can be adjusted. Whether the matching between the CCT inside the tunnel and the CCT outside the tunnel will have a better impact on the driver’s visual performance is crucial as a basic study.

1.3. Tunnel Access Zone CCT

Some scholars started with tunnel lighting and carried out a series of reaction-time experiments to study the impact of CCT on driving vision. Zhang et al. [23] investigated the effect of CCT on the visual performance of tunnel lighting through reaction time experiments, and within a certain range of CCT, it was concluded that the higher the CCT of tunnel lighting, the shorter the reaction time of the driver. Based on the results of the influence of LED lighting on human visual performance, Liang et al. [24] established a 3D proportional model that simulates the lighting environment of a highway tunnel, measured the reaction time under different luminance values and CCT, and found that appropriately increasing the CCT of the light source could improve visual performance. However, when examining the effects of CCT on drivers, non-visual manifestations in addition to visual manifestations are important. Recently, Li et al. [25] proposed a VR-based framework to assess the effects of CCT on visual and non-visual performance in normal driving and accident situations. In this study, a tunnel model with seven different CCTs was built to analyze participants’ non-visual and visual performance. The results show that the CCT of light sources in the tunnel has a significant effect on participants’ non-visual performance as well as on visual performance when drivers are involved in rear-end collisions. Based on this study, some scholars have proposed a CCT suitable for LED light sources with different regional luminance levels by combining the influence of long tunnel visual performance with non-visual effects. Liu et al. [26] set five different LED CCTs in the tunnel, analyzed the relationship between the CCT and the reaction time and pupil area difference, and concluded that LED lighting with a CCT of 5100 K in the access and transition zones and 3800 K in the interior zones of long tunnels is more favorable to traffic safety. At the tunnel access zone, human eye dark adaptation has an important impact on the visual ability and safety of drivers. Reasonably setting the CCT of lighting in the tunnel can enable the driver to quickly adapt to the change of color inside and outside the tunnel and improve the dark adaptation at the access zone. Zhang et al. [27] conducted static identification experiments in different lighting environments, applied K-means clustering to analyze the identification time and lighting performance, and obtained the conclusion that improving the color rendering (CRI) of lamps can improve visibility and reduce the dark adaptation time. Dong et al. [28] analyzed the mechanism of dark adaptation, described the light color characteristics of LED, and experimentally studied the effect of LED CCT and CRI on human visual dark adaptation at the access zone. They found that LEDs with low CCT and high CRI2012 had positive effects on shortening the reaction time and color discrimination time in the human eye. The above is about the study on the CCT of lighting in the tunnel. In order to obtain the specific situation of CCT outside the tunnel and realize the smooth transition of CCT inside and outside the tunnel, Xu et al. [29] proposed the tunnel outside CCT measurement method based on the solar radiation and atmospheric science-related theory and research results, put forward the theory model under the condition of the solar radiation spectrum, and through the experimental test of the tunnel outside the scenery spectral reflection characteristics, put forward a research method based on the radiation measurement of tunnel luminance and CCT. However, this method needs to obtain the three-stimulus value or reflection spectral power distribution of all scenes outside the tunnel. It is difficult to calculate the large amount of data, and each tunnel is different, so the prediction model has defects in practical application. From a theoretical perspective, the design of CCT in the tunnel necessitates an understanding of the variation pattern of CCT outside the tunnel. However, current research focuses on matching the CCT of the artificial light source inside the tunnel to the external CCT, and there is a lack of research exploring the variation patterns of the CCT in the external portion of the tunnel from actual measurements. In order to better regulate the CCT inside the tunnel so that drivers have a safer and more comfortable driving environment, it is imperative to clarify the changing patterns of CCT outside the tunnel.

1.4. Proposal of This Study

In the context of the vehicular transition from external to internal environments of tunnels, the abrupt change in light conditions, which is marked by variations in background luminance and differences in CCT, can significantly affect a driver’s visual perception. This visual disparity often results in a perceptible lag, a phenomenon that poses a considerable risk to driving safety. The human eye, during the adaptation to darkness, endures heightened physiological demands, which not only tax the driver’s visual system but also extend reaction times, thereby escalating the likelihood of traffic accidents.
To investigate the color performance within drivers’ eyes outside tunnels, which has not yet been revealed, this study analyzed the temporal and spatial variations of CCT received by drivers’ eyes when approaching the tunnel through a field test and established a computational model for the CCT in the tunnel access zone, taking the distance from the tunnel entrance, the solar irradiance, and the CCT of tunnel interior lighting as input parameters. The results could provide theoretical support for the selection of the CCT lighting source in the tunnel entrance section.

2. Materials and Methods

2.1. Measurement

Tunnel 1 (Luhua Road Tunnel, Beijing) and Tunnel 2 (Tongzhou Beiguan Tunnel, Beijing) were selected as test tunnels (Figure 1) to investigate the spatiotemporal variation characteristics of CCT in the tunnel access zone. Vertical illuminance and solar irradiance were recorded at the same time. On the winter solstice, the sun’s altitude angle in the Beijing area will reach the minimum of the year, resulting in a higher probability of the sun appearing in the driver’s field of view when approaching the tunnel, further impacting driving safety. Accordingly, the study selected clear days in December as the experimental dates. The test date for Tunnel 1 is 5 December 2023 (Date 1), and for Tunnel 2, it is 29 December 2023 (Date 2).
The information about the two field-measured tunnels is shown in Table 1.
The field test process is illustrated in Figure 2 and can be divided into the following steps:
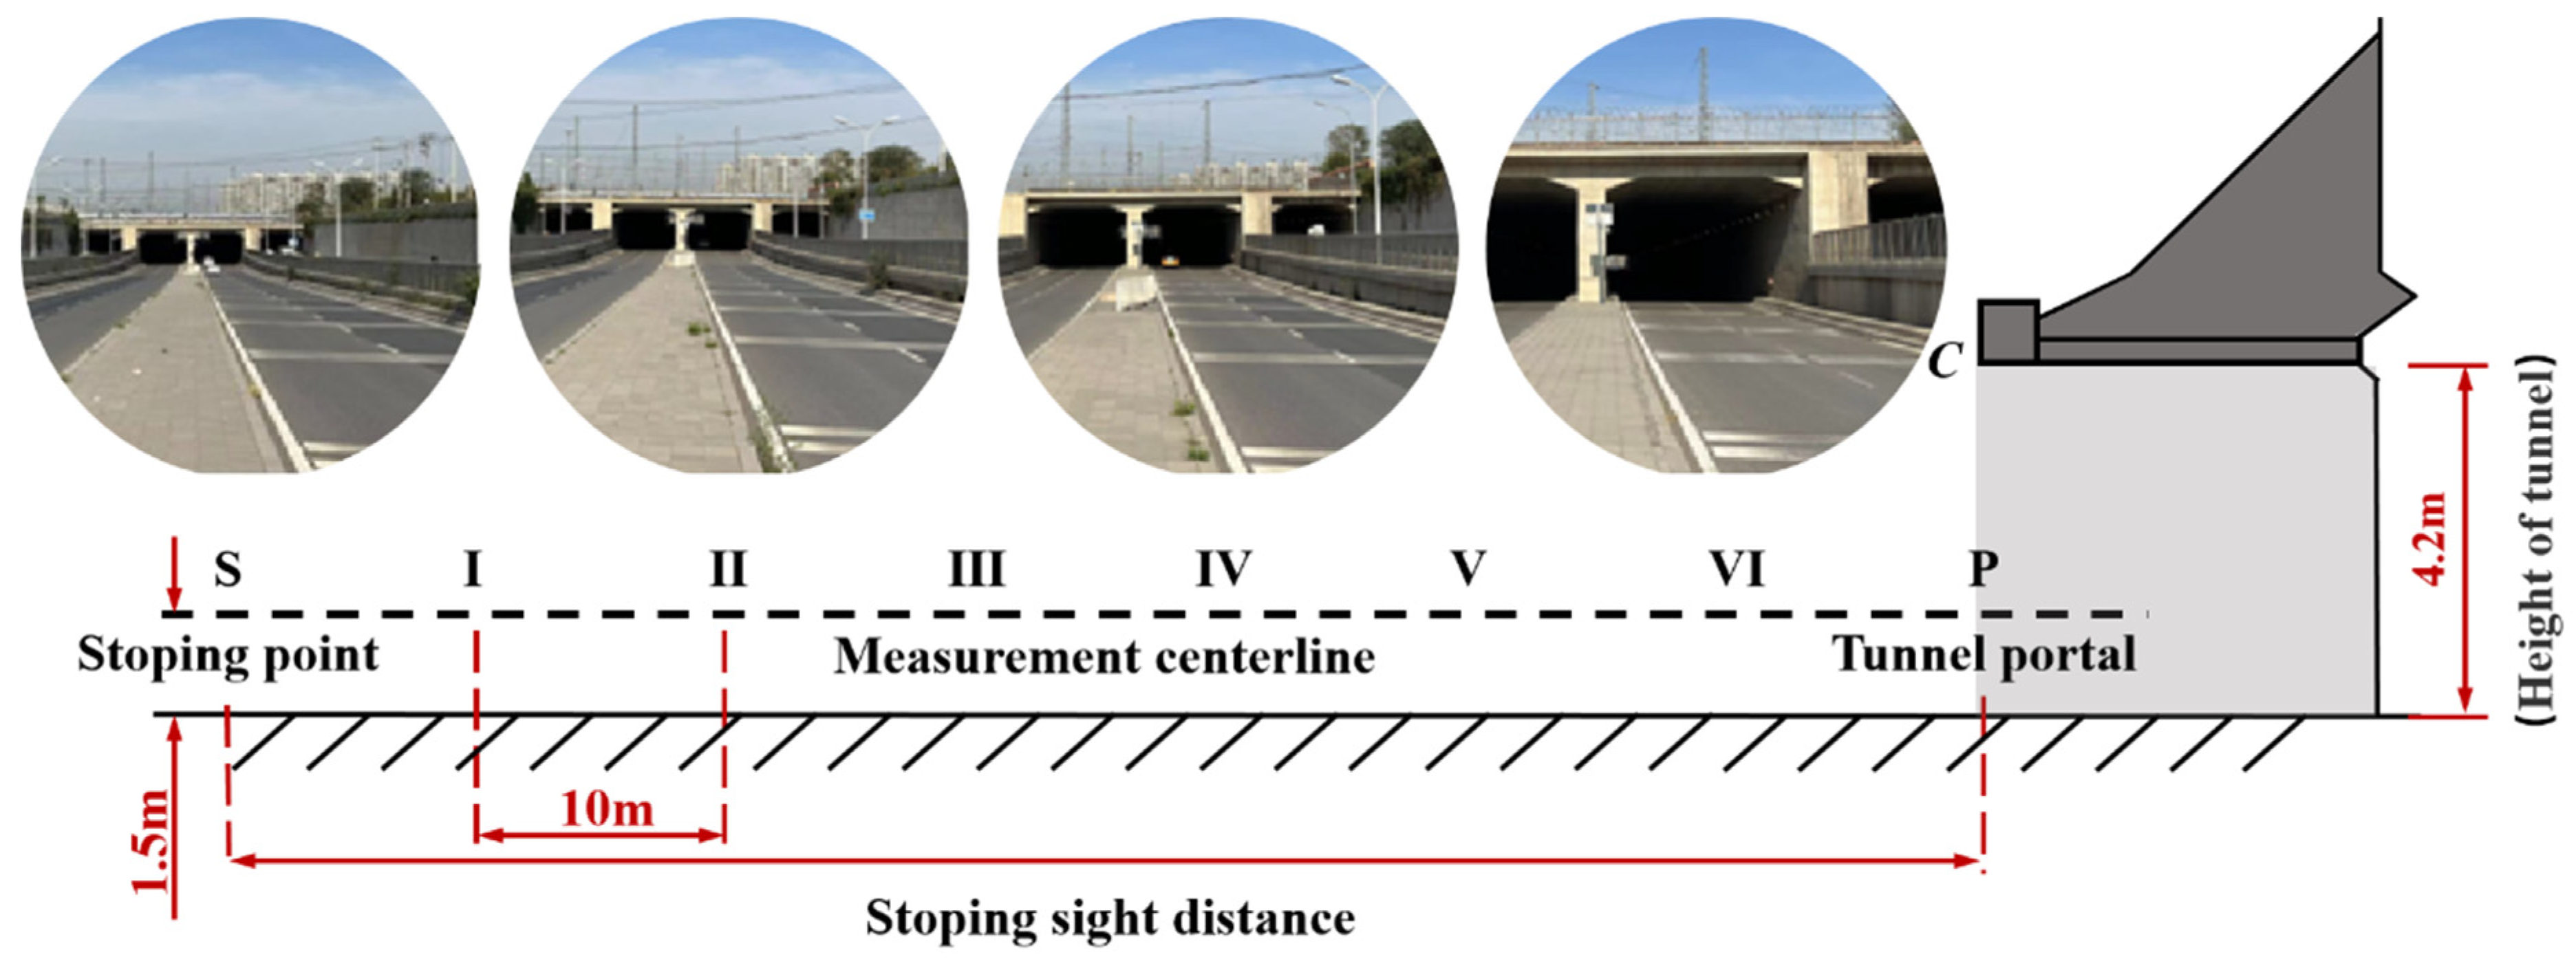
  • Select a typical tunnel (Beijing Luhua Road Tunnel is taken as an example in Figure 2), determine the stopping sight distance of the tunnel by consulting the charts;
  • Position the Spectral Flickering Irradiance Meter on a tripod with a stopping sight distance (SSD) along the tunnel axis 1.5 m above the road surface, hold it perpendicular to the road, and orient the receiving end towards the tunnel portal. Place the Irradiance Meter on a horizontal surface and ensure that the device is not obscured;
  • Record the CCT, the vertical illuminance, and the horizontal solar irradiance outside the tunnel; take a photograph facing the tunnel portal;
  • Move the Spectral Flickering Irradiance Meter forward 10 m;
  • Repeat steps 2 to 4 until the test position is at the tunnel portal;
  • Repeat steps 2 to 5 in sequence every half hour until all tests for the day are completed. Determine the area share of each scene within the driver’s 20° view angle at different positions from the photographs taken in step 3.
The SFIM-400 type Spectral Flickering Irradiance Meter produced by EVERFINE (Hangzhou, China) of China was used to measure the CCT and the vertical illuminance of each test position. The HD2102.2 type irradiance meter produced by DELTAOHM (Caselle di Selvazzano, Italy) of Italy was used to measure the solar irradiance. The primary parameters of the test instrument are shown in Table 2. The testing period was from about 9:00 a.m. to 5:00 p.m., and a set of CCT tests were conducted every 30 min.

2.2. Error Calculation and Modeling Methods

To evaluate the measurement accuracy of the CCT calculation model, two evaluation indexes, RMSE and MPAE, were selected to evaluate the prediction effect. RMSE indicates the sample root-mean-square error, which is more sensitive to the outliers in the data, and MAPE indicates the mean absolute percentage error; it is more sensitive to the relative error, which can be calculated by Equations (1) and (2).
R M S E = 1 N i = 1 N y i z i 2
M P A E = 1 N i = 1 N y i z i z i × 100 %
where yi is the calculated value, zi is the measured value, and N is the total number of measured data points.
The Spearman correlation analysis method was used to evaluate the nonlinear relationship between two variables, such as the CCT received by the driver’s eyes, the vertical illuminance at the driver’s position, and the sun’s position information. Spearman’s correlation coefficient between the two parameters (x and y) can be calculated by Equation (3).
ρ = i ( x i x ¯ ) ( y i y ¯ ) i ( x i x ¯ ) 2 i ( y i y ¯ ) 2
where x ¯ and y ¯ is the average value of x and y.
In this research, the data were analyzed using Origin, and the linear multivariate data fitting method was used to establish the CCT calculation model for the tunnel access zone.

2.3. Extension and Application of the CCT Calculation Model

Just Noticeable Difference (JND) represents the smallest change in the CCT that the human eye can distinguish, which is known to be a function of color temperature, denoted by E(T). The results of Judd et al. [30] show that JND as a function of CCT (T) can be expressed by Equation (4).
d T d E = 5.5 T 2 × 10 6
let the function
M ( T ) = 10 6 × T
then,
d M d T = 10 6 × T 2
and substituting into Equation (4) yields a functional relationship between M and E as shown in Equation (7).
d M d E = 5.5
defining M as the Micro Reciprocal Degree (MRD) of color temperature with units of mired, or MK−1, in the sense that the minimum discernible difference for the human eye is 5.5 mireds.

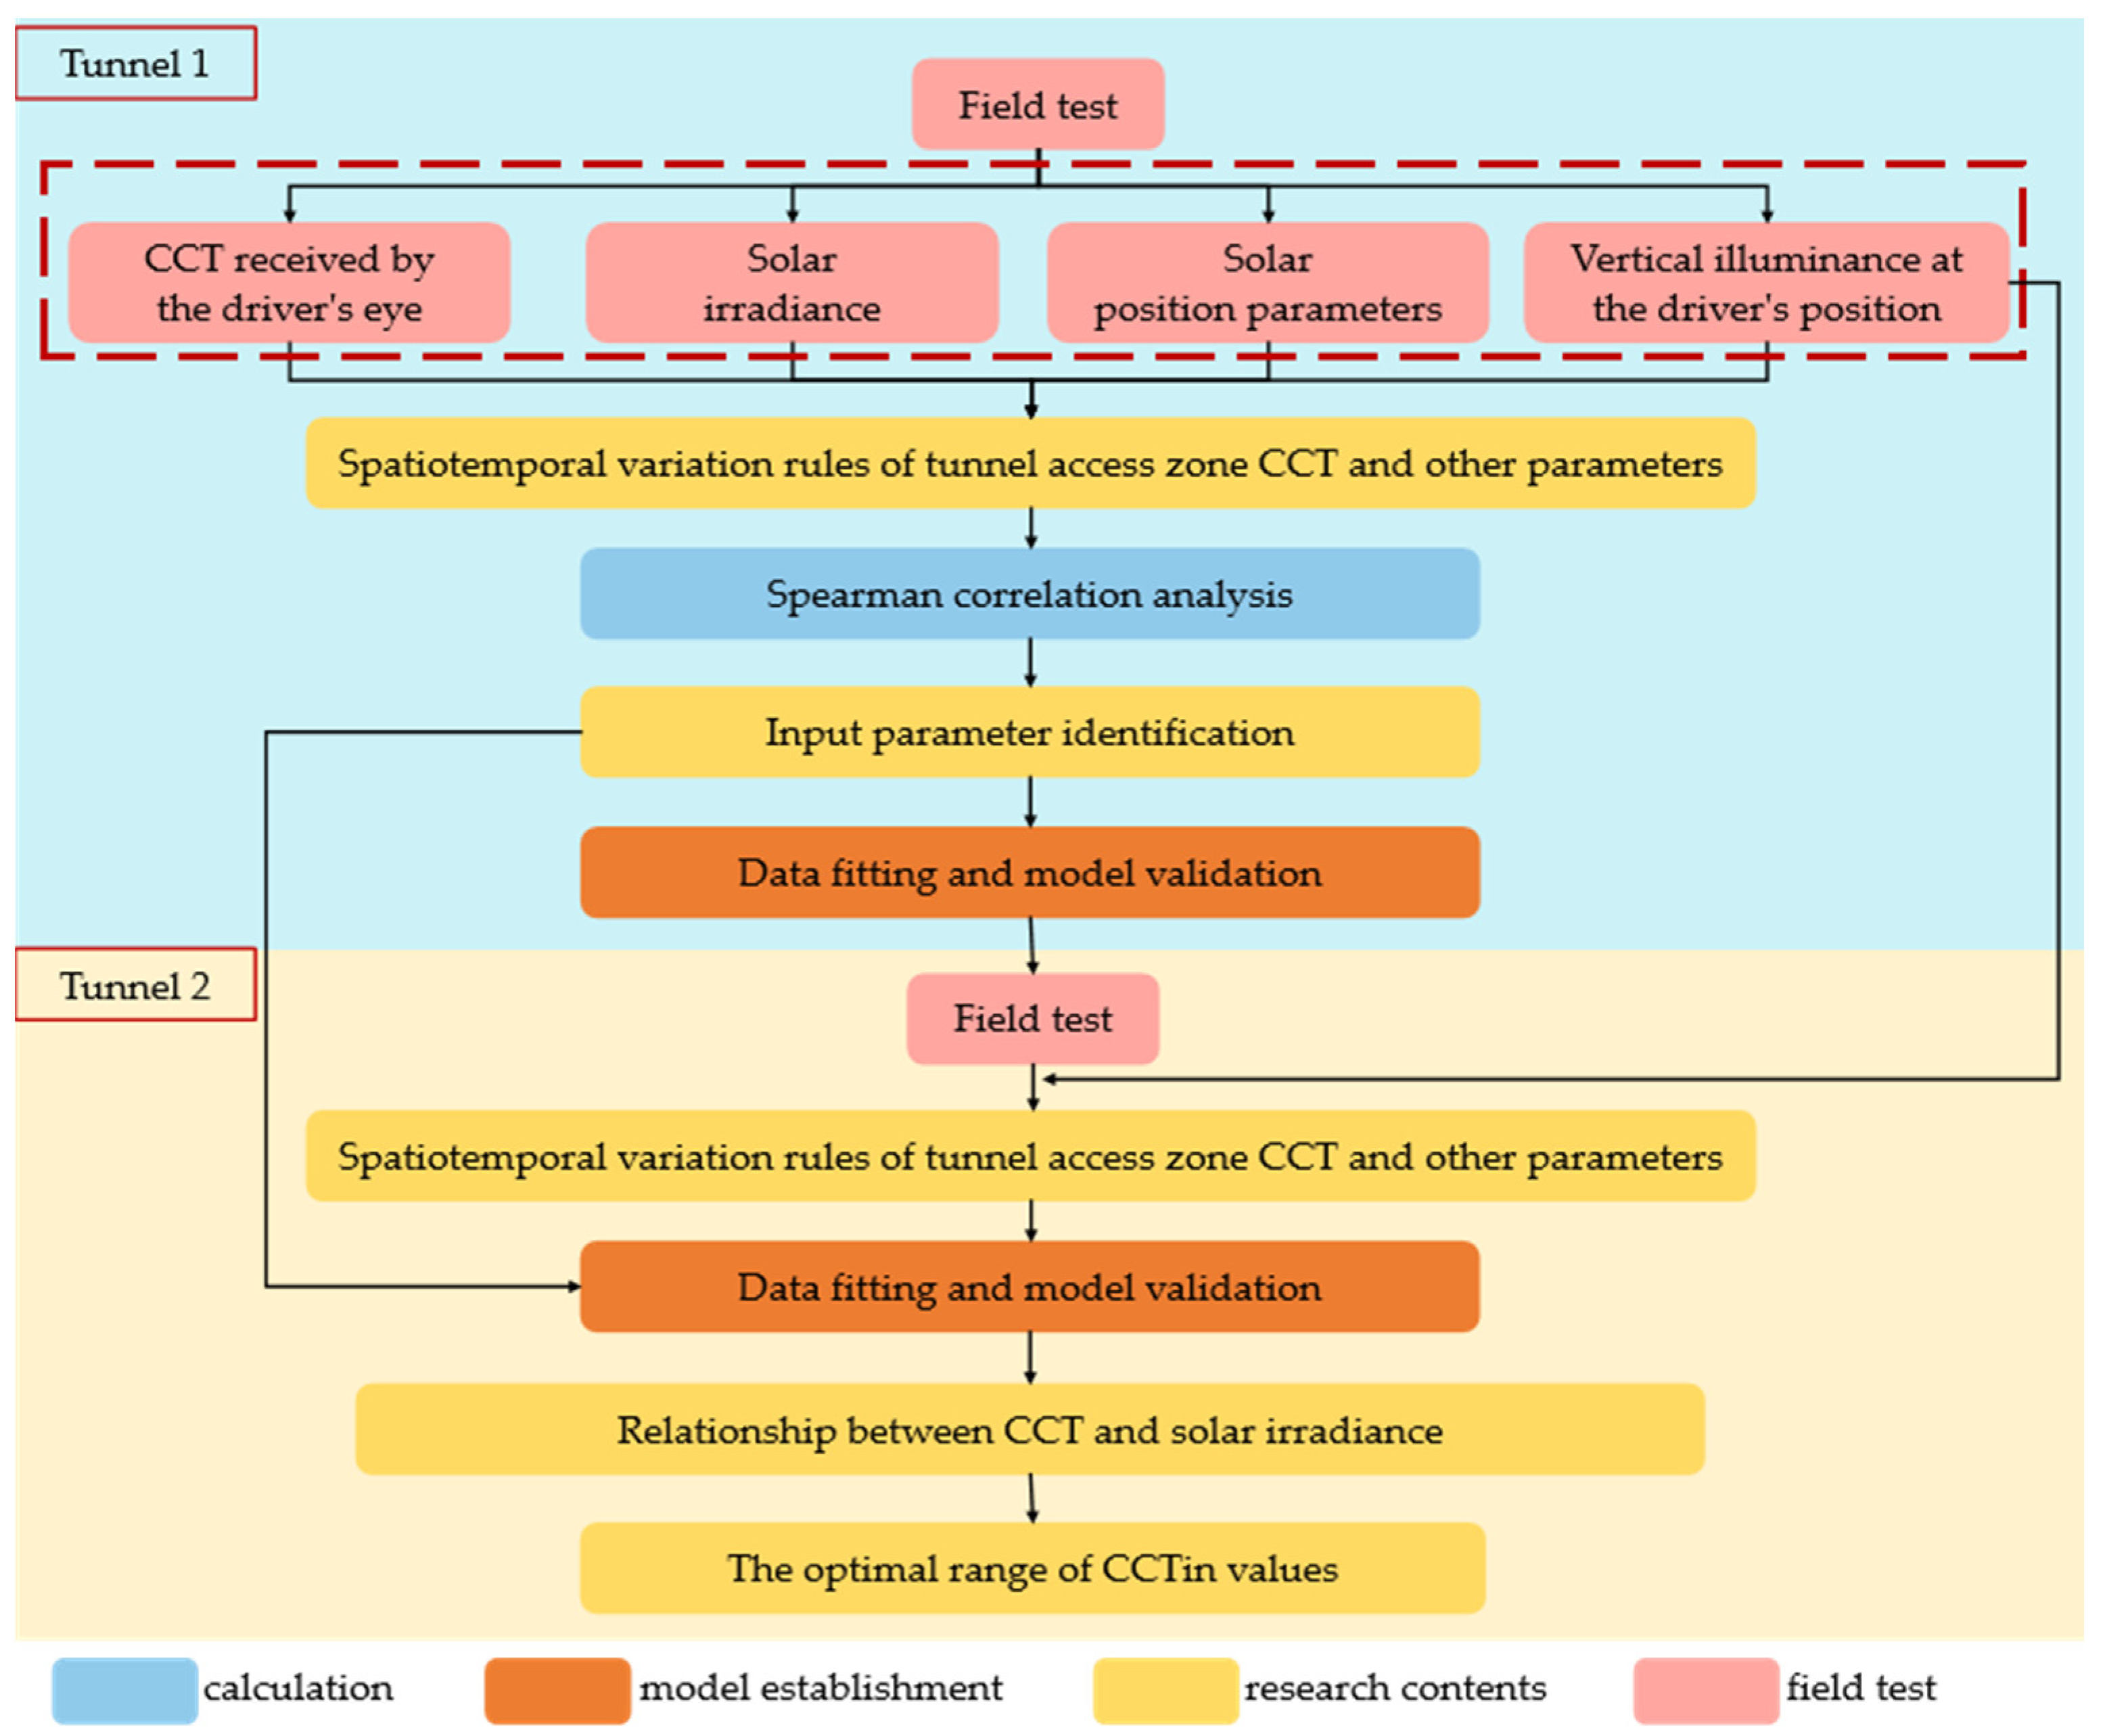
2.4. Technical Route

The research process is illustrated in Figure 3 and can be divided into the following steps: (1) select a typical tunnel (Tunnel 1) as the test object and follow the test steps in Section 2.1 to take a field test. Record the CCT received by the driver’s eye in the approach section of the tunnel at different times, solar position parameters, solar irradiance, and vertical illuminance at the driver’s position; (2) investigate the variation rules of CCT received by the driver’s eyes and vertical illuminance at the driver’s position during the approach to the tunnel from a temporal and spatial perspective; (3) analyze the correlation between the CCT received by the driver’s eyes in the tunnel access zone and other parameters, and identify the input parameters of the CCT calculation model; (4) data fitting based on measured data, establish the CCT calculation model of the tunnel access zone, and evaluate the accuracy of the model; (5) repeat steps (1)–(4) for a new tunnel (Tunnel 2) to verify the feasibility and scientific validity of the research methodology.

3. Results

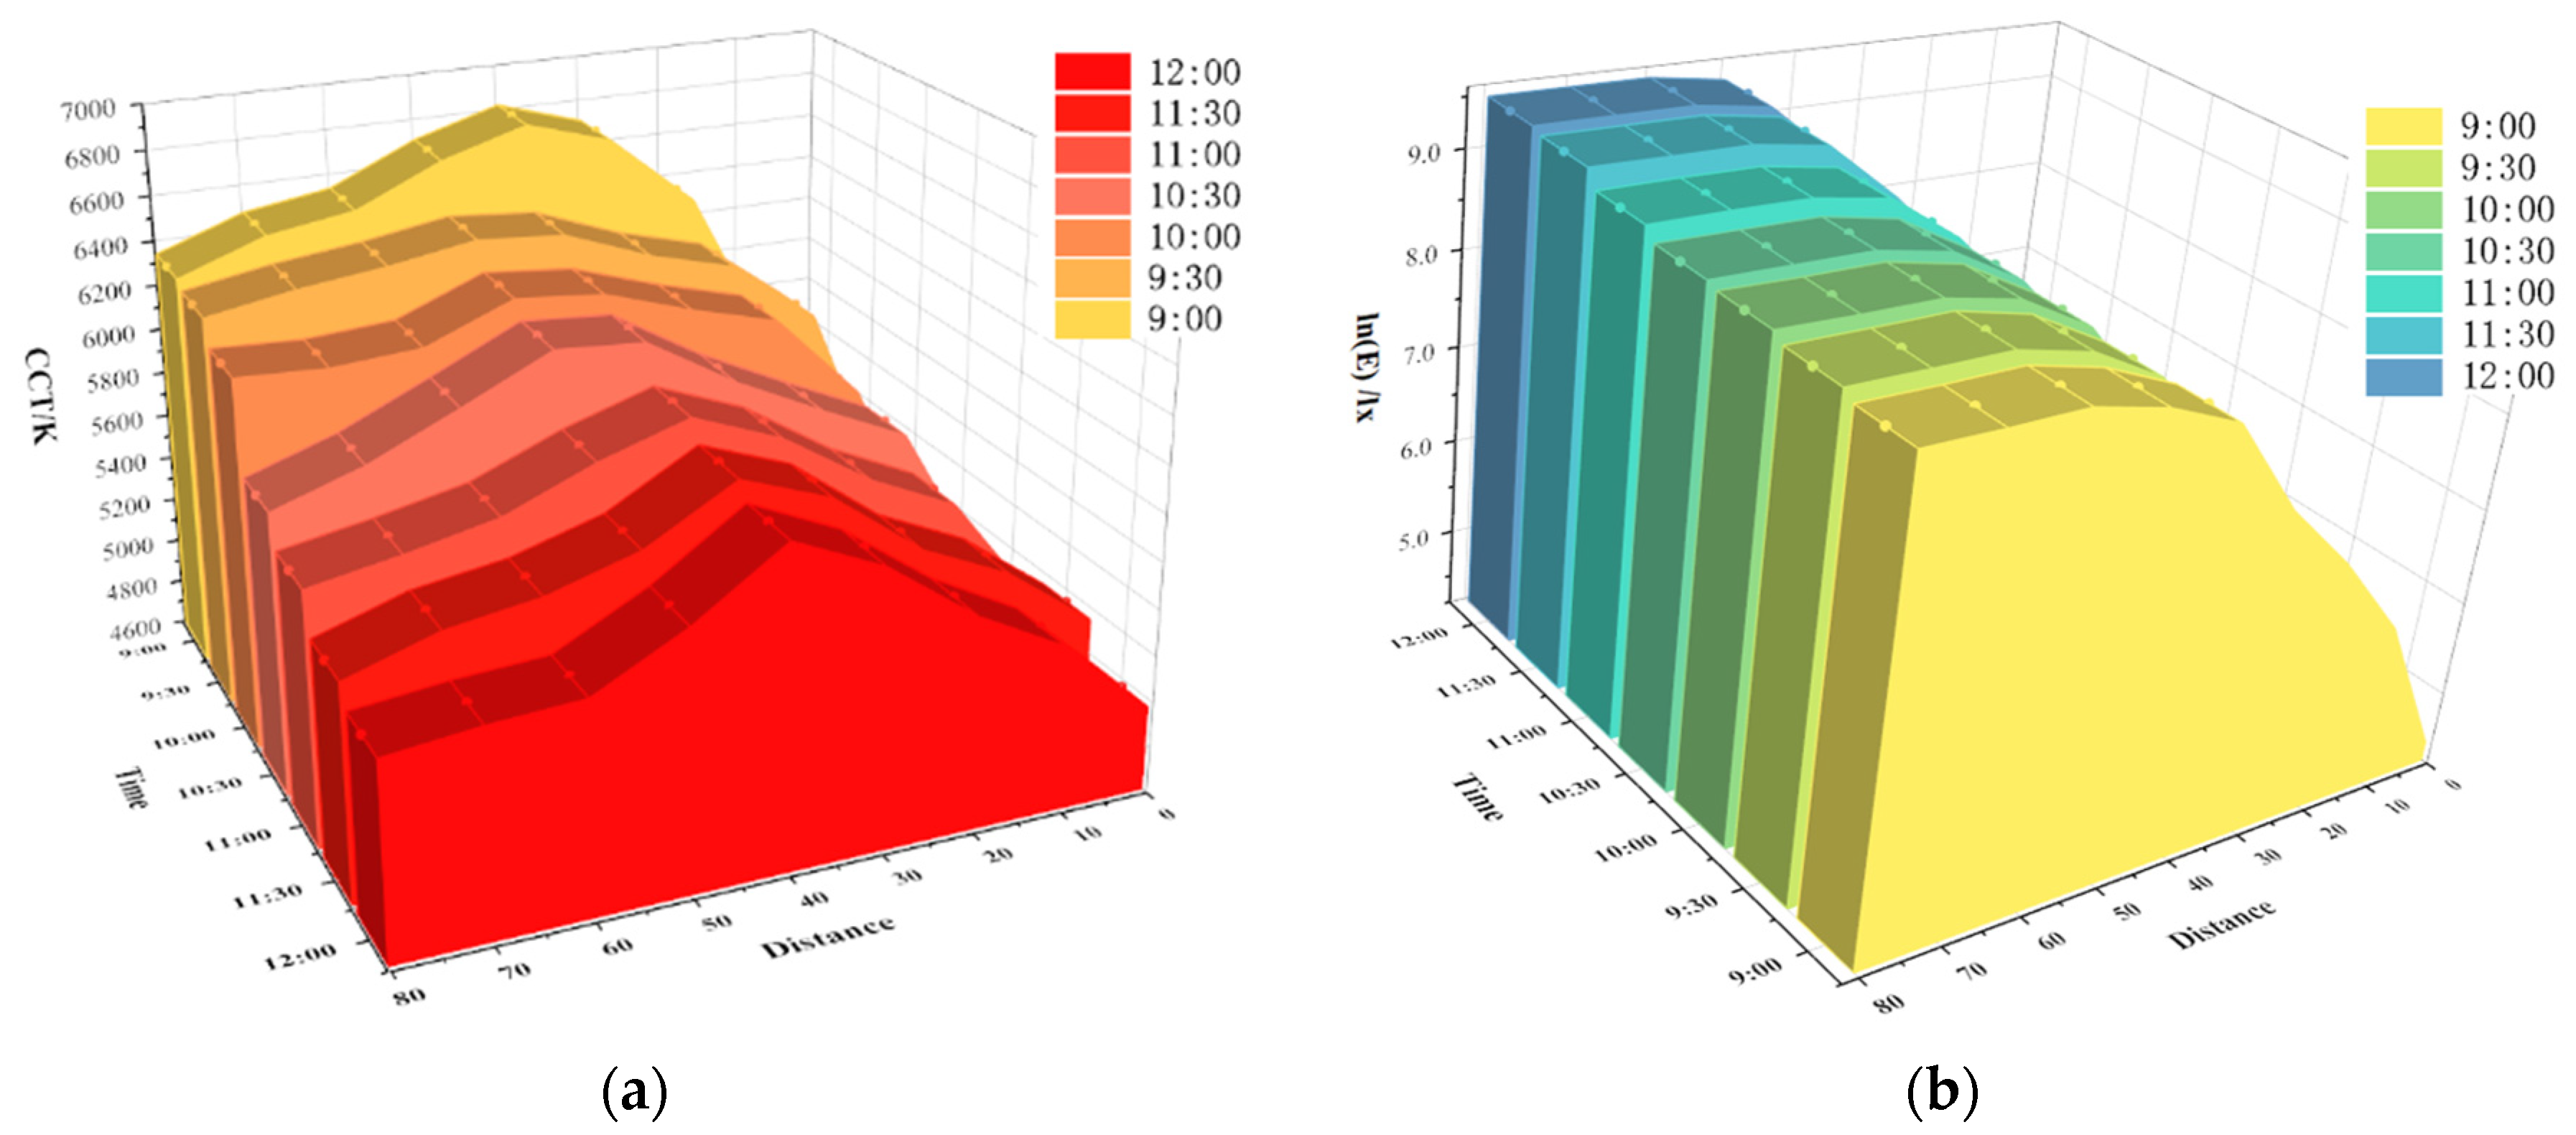
3.1. Temporal and Spatial Variation Rules

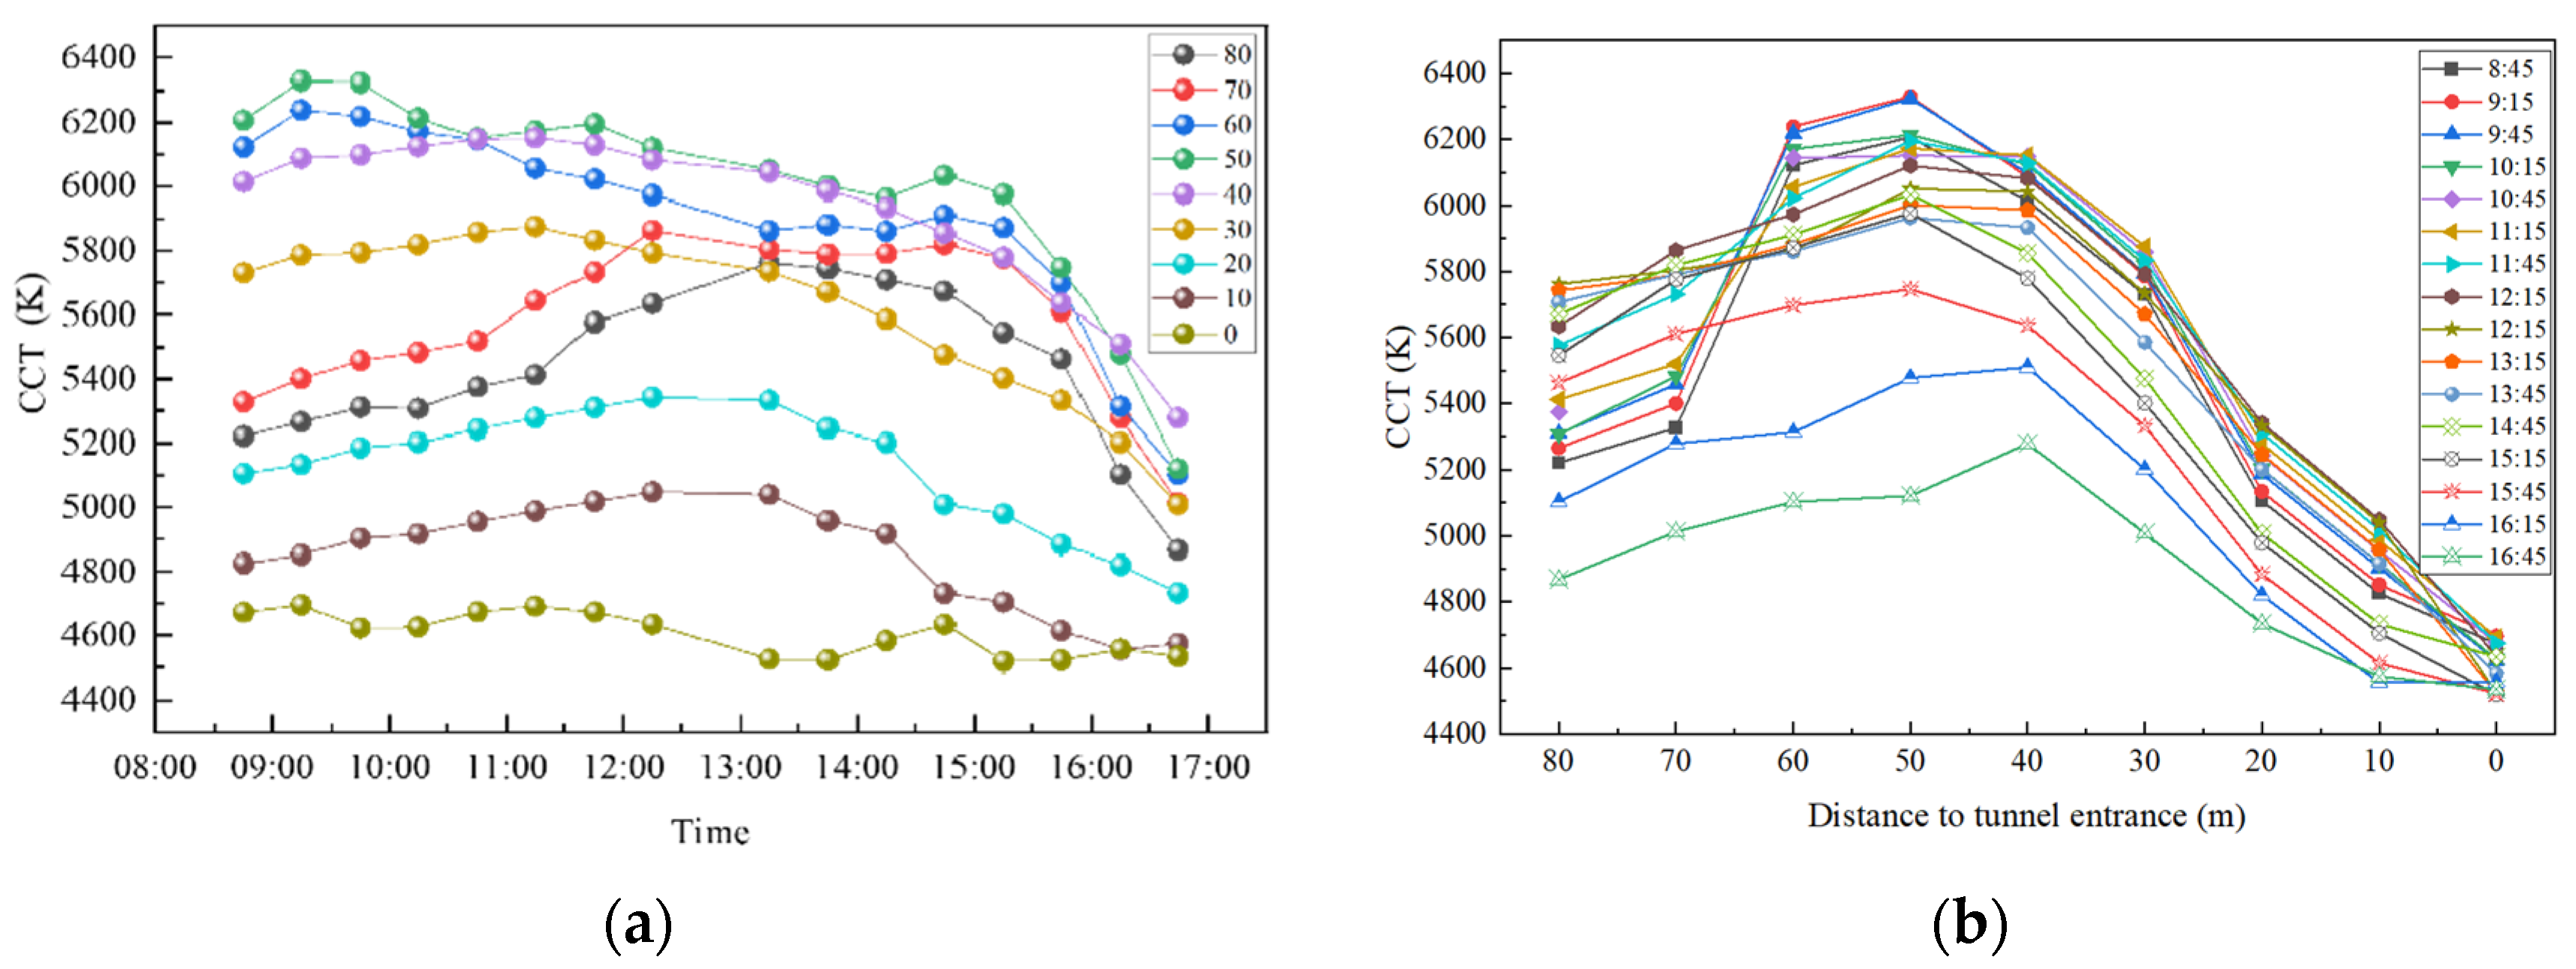
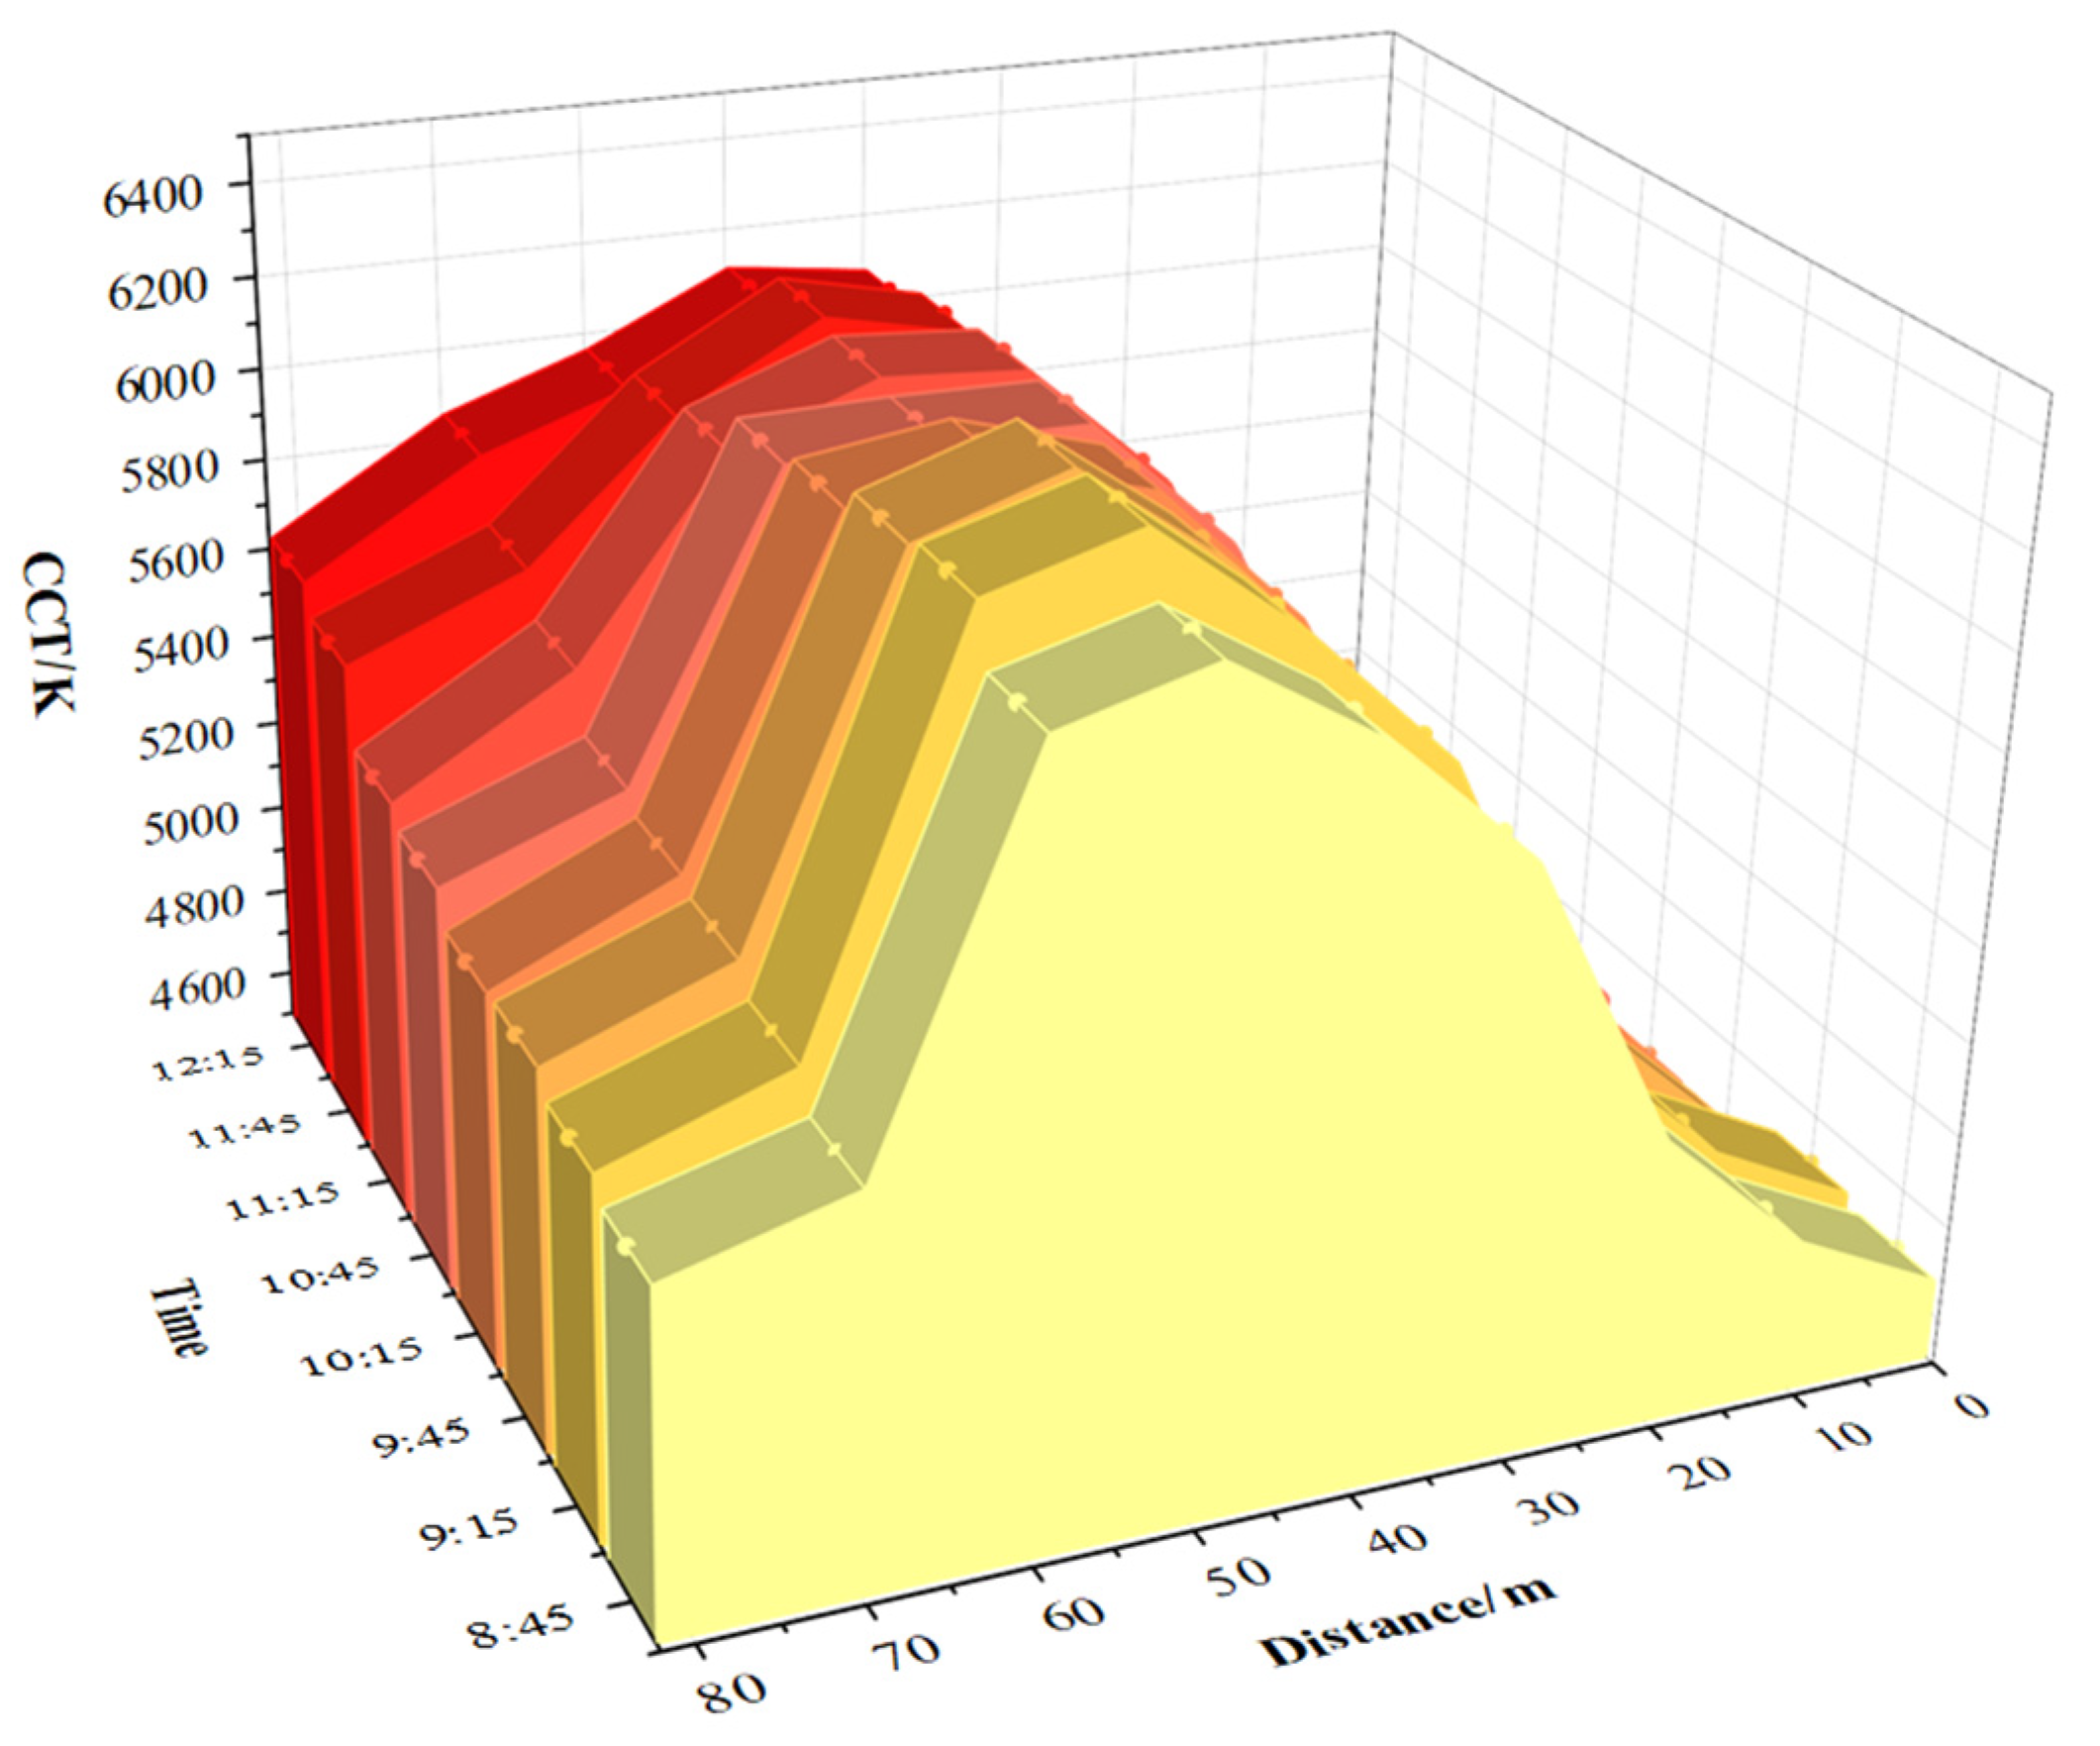
3.1.1. CCT in the Tunnel Access Zone

Tunnel 1 was selected as the test subject and recorded the CCT values at various distances from the tunnel entrance and different times, as illustrated in Figure 4. In Figure 4a, the horizontal axis represents the moments of testing, the vertical axis indicates the CCT, and data points of different colors signify the distances to the tunnel entrance. In Figure 4b, the horizontal axis represents the distance to the tunnel entrance, and the vertical axis indicates the CCT. Shaped data points, such as squares, circles, and triangles, represent the moments of testing.
In Figure 4a, it can be observed that between 8:00 and 15:00, the fluctuations in CCT are relatively minimal. Subsequently, beyond the 15:00 mark, there is a discernible downward trend in the CCT values. According to Figure 4b, it is evident that as one approaches the tunnel entrance, the CCT exhibits a trend of initial increase followed by a decrease, with the peak CCT observed at a distance of 50 m from the tunnel entrance. Within 20 m and below the tunnel entrance, the CCT varies more uniformly over time, without significant oscillations. This stability is due to the fact that the CCT in the space within 20 m from the tunnel entrance is mainly influenced by the tunnel’s internal lighting. Conversely, the CCT in the space above 20 m from the tunnel entrance exhibits more pronounced fluctuations over time, suggesting that the area above 20 m is primarily affected by solar radiation.
The reason for this phenomenon can be attributed to a combination of factors that influence the interplay of light sources and the environment within the vicinity of the tunnel. Firstly, the proximity to the tunnel entrance allows for an increased influence of natural light, particularly from the sun, which has a higher CCT and can raise the overall CCT of the area. As one moves closer to the entrance, the intensity and angle of the sunlight change, leading to variations in the CCT. Secondly, the internal lighting of the tunnel, which typically has a lower CCT, starts to exert a more significant influence as one gets closer to the entrance. This internal lighting provides a stable and consistent source of light that can affect the CCT in the surrounding area. The interplay between these two light sources—natural sunlight and artificial tunnel lighting—creates a transition zone near the tunnel entrance where the CCT fluctuates. The highest CCT observed at 50 m from the entrance could be due to the optimal balance between the natural sunlight’s influence and the tunnel’s artificial lighting at that specific distance. Additionally, environmental factors such as the presence of vegetation, the reflectance of surrounding surfaces, and atmospheric conditions can also impact the CCT. For instance, vegetation and other surfaces can reflect and absorb light differently, altering the CCT in the process.
As can be seen from Figure 4, the CCT of the tunnel access zone in the morning and afternoon is symmetrical in the spatiotemporal variation rule. Therefore, to more visually demonstrate the spatiotemporal variation of the CCT received by the driver’s eyes in the process of approaching the tunnel, based on the test data in the morning, the 3D wall charts with time as the X-axis, the distance from the tunnel entrance as the Y-axis, and the CCT as the Z-axis were drawn, in which the color from yellow to red indicated the test time sequence from early morning to noon, as shown in Figure 5.
As shown in Figure 5, the CCT of the access zone of Tunnel 1 rises from the stopping distance, reaches the maximum value of the CCT of the entire approaching section at 40 m from the tunnel portal, and then begins to fall slowly when it reaches 10 m from the tunnel and gradually stabilizes to the minimum value of the CCT at the tunnel portal. In terms of temporal, the CCT at any point in the access zone of the Luhua Road Tunnel shows a slow increasing trend as the morning test time progresses, and the peak of the day’s CCT occurs at around 12:00 noon.

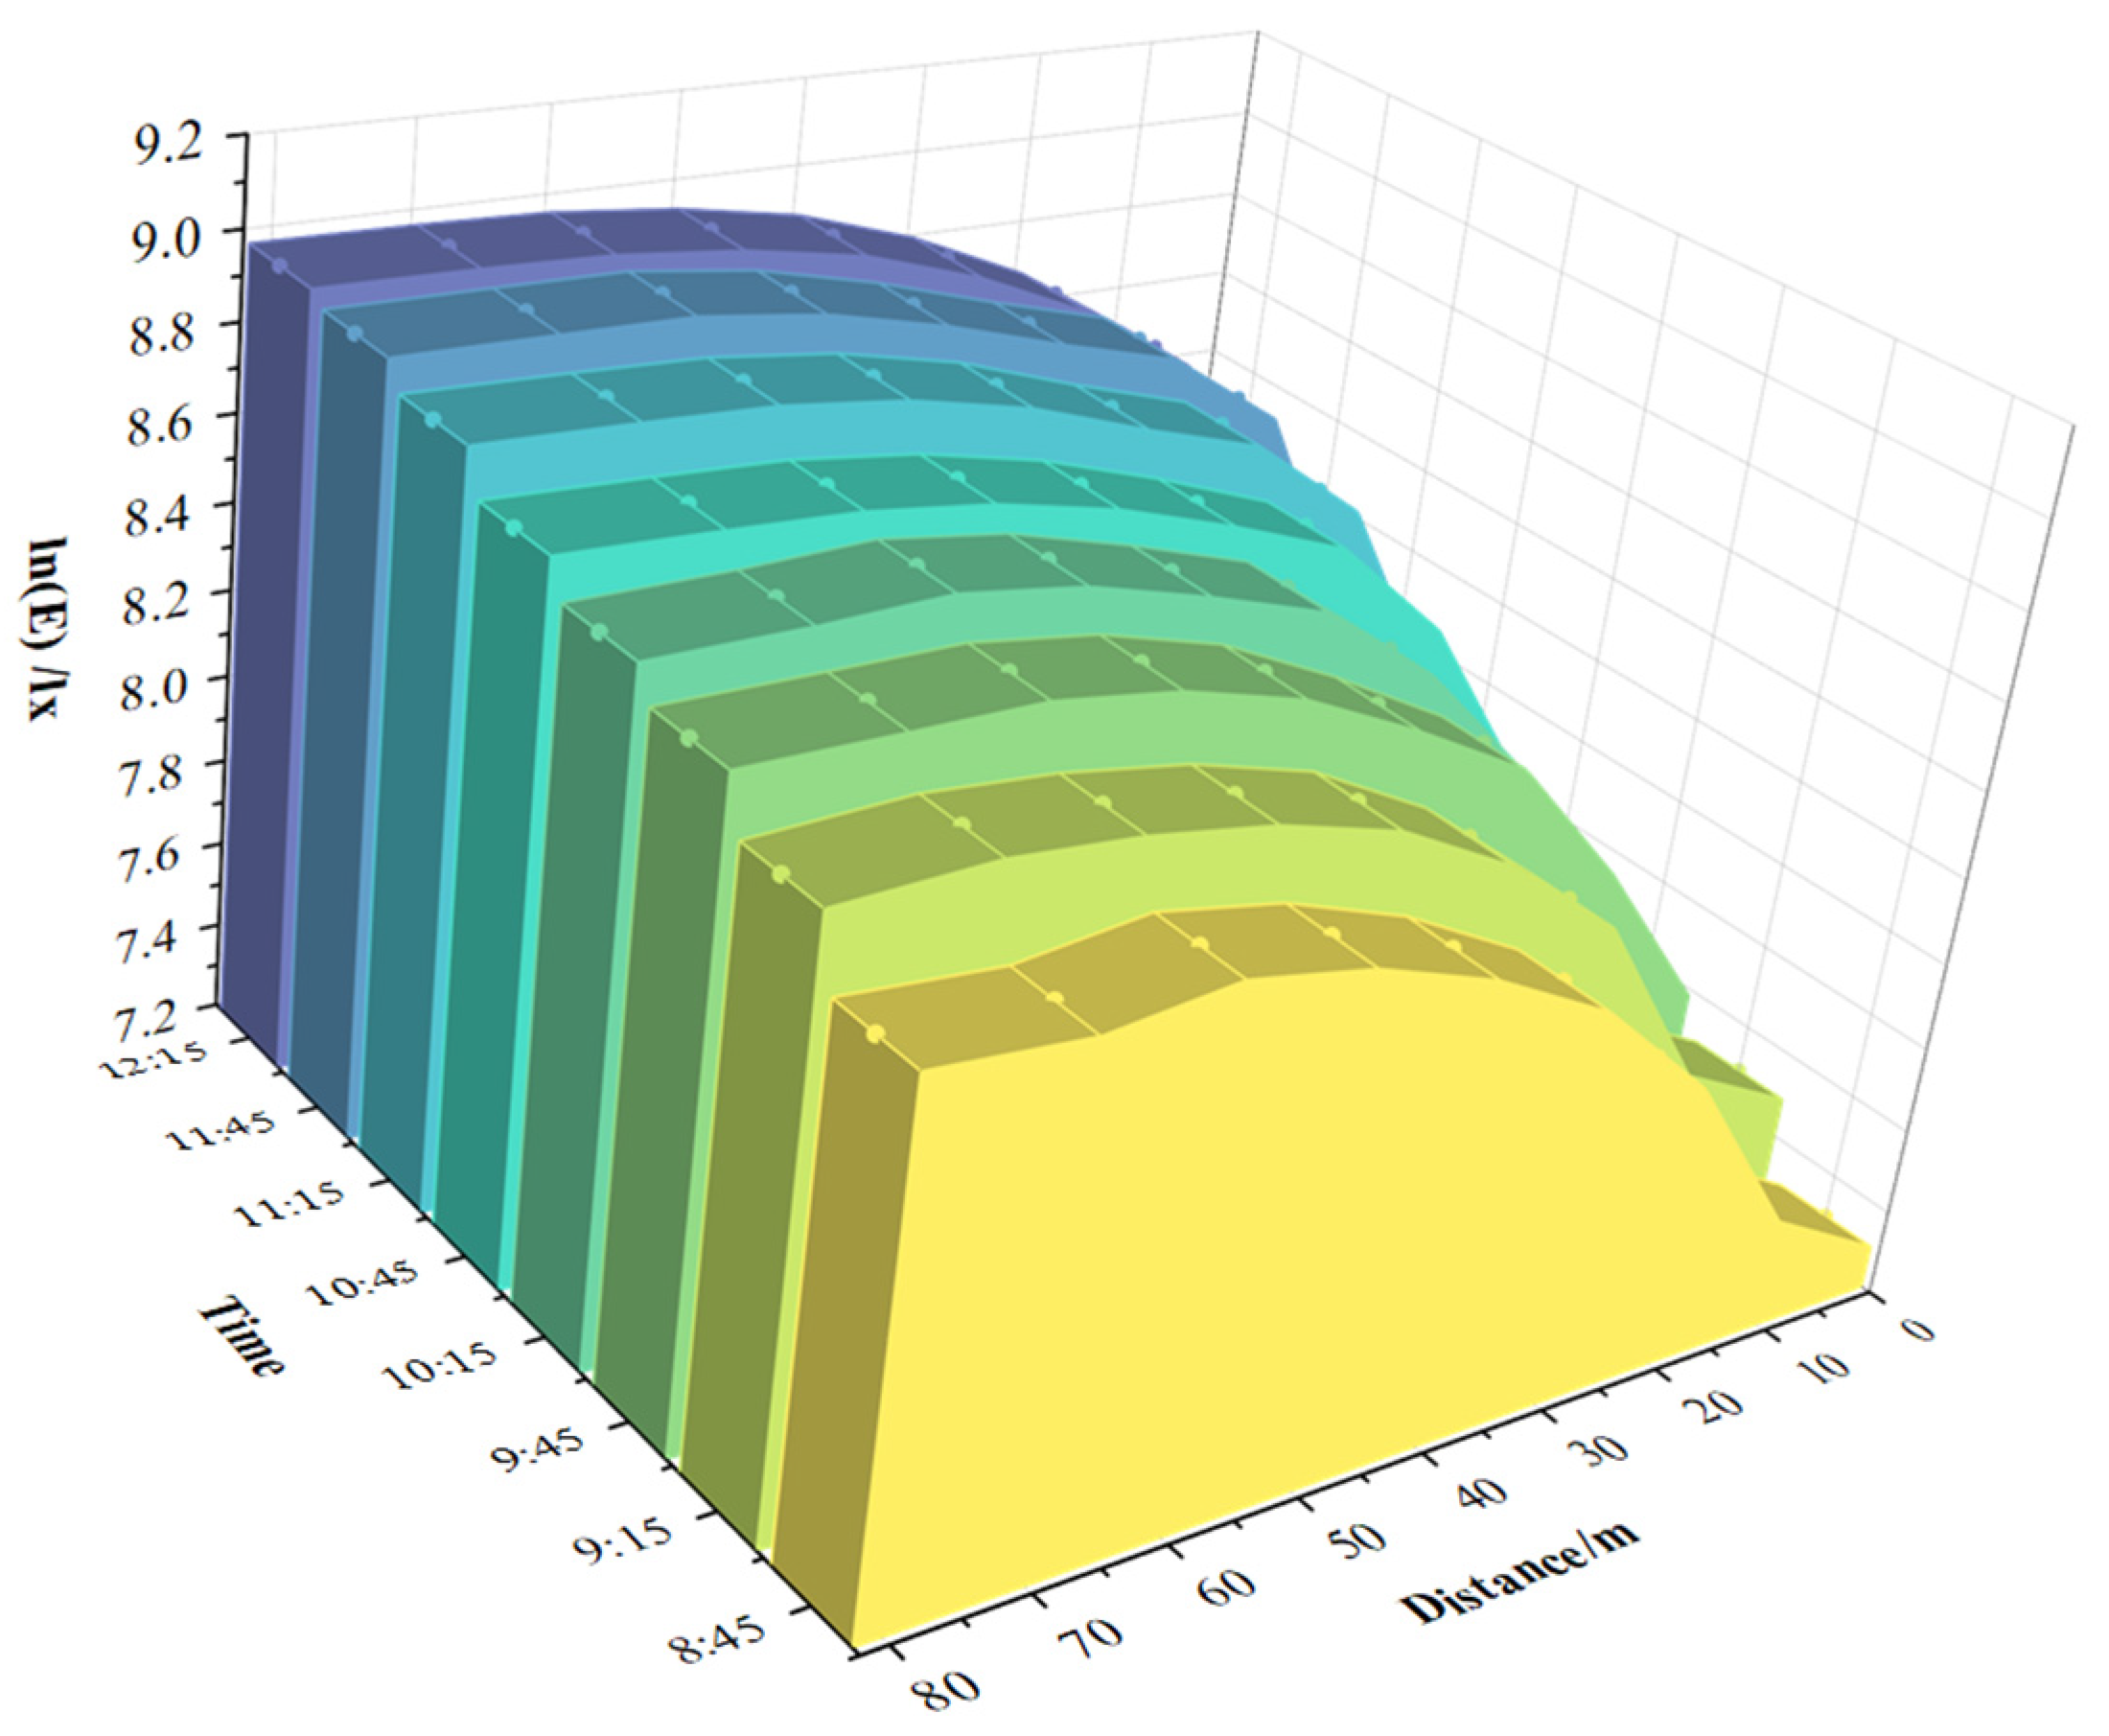
3.1.2. Vertical Illuminance at the Driver’s Position and Solar Irradiance

In addition, a 3D wall plot of the change in vertical illuminance at the driver’s position during the approach to the tunnel is drawn, as shown in Figure 6. Where X-axis is time, Y-axis is distance from the tunnel portal, and Z-axis is vertical illuminance. The color from yellow to blue indicates the test time sequence from morning to noon.
As can be seen from Figure 6, at the spatial level, the vertical illuminance at the driver’s position slowly decreases from the stopping distance and rapidly decreases at about 50 m from the tunnel portal until it reaches the minimum value at the tunnel portal. At the temporal level, the vertical illuminance at the driver’s position shows an overall increasing trend as the test time in the morning progresses, which is determined by the law of solar movement. As the sun’s altitude angle increases, the horizontal solar irradiance on the ground also increases gradually, and the overall ambient luminance gradually rises, resulting in an increase in the vertical illuminance.
Vertical illuminance refers to the level of illumination on a vertical surface, which affects the visual brightness inside and outside the tunnel and the visual adaptation of the driver. This implies that it can influence the driver’s perception of the environment outside the tunnel, thereby indirectly affecting the sensation of CCT. Vertical illuminance is considered a potential factor influencing the CCT exterior at the tunnel entrance. In this context, a comprehensive analysis of the spatiotemporal dynamics of illuminance has been conducted, as depicted in Figure 7. The horizontal axis is designated to reflect the measurements of vertical illuminance, while the vertical axis corresponds to the various temporal points of observation during the testing phase.
Figure 7 indicates that the vertical illuminance at different positions in front of the tunnel entrance and the solar irradiance follow a similar trend of change, both increasing first in the morning, peaking at noon, and then dwindling in the afternoon as time progresses. This suggests that vertical illuminance and solar irradiance are closely related, both being influenced by the position of the sun, atmospheric conditions, and other environmental factors. Solar radiation encompasses a broad spectrum, ranging from ultraviolet to infrared. CCT is a physical quantity that describes the color of a light source and is related to the spectral composition emitted by the source. The spectral components of solar radiation vary with changes in factors such as the solar altitude angle, atmospheric conditions, and cloud cover, which in turn can affect the perception of CCT. Figure 8 demonstrates the relationship between CCT and solar irradiance, with the horizontal axis indicating solar irradiance and the vertical axis representing CCT.
Based on Figure 8, it can be observed that within 20 m of the tunnel entrance, the variation in CCT is minimal with changes in solar irradiance, indicating that in this section of the road space, the CCT is largely influenced by the illumination within the tunnel. In the road space ranging from 20 to 50 m away from the tunnel entrance, the changes in solar irradiance led to moderate fluctuations in CCT, suggesting that in this area, the CCT is affected by a combination of tunnel lighting and solar radiation. From 50 m to the stopping sight distance, the changes in solar irradiance result in significant variations in CCT, demonstrating that in this stretch of road space, the CCT is predominantly influenced by solar radiation.

3.2. CCT Calculation Model

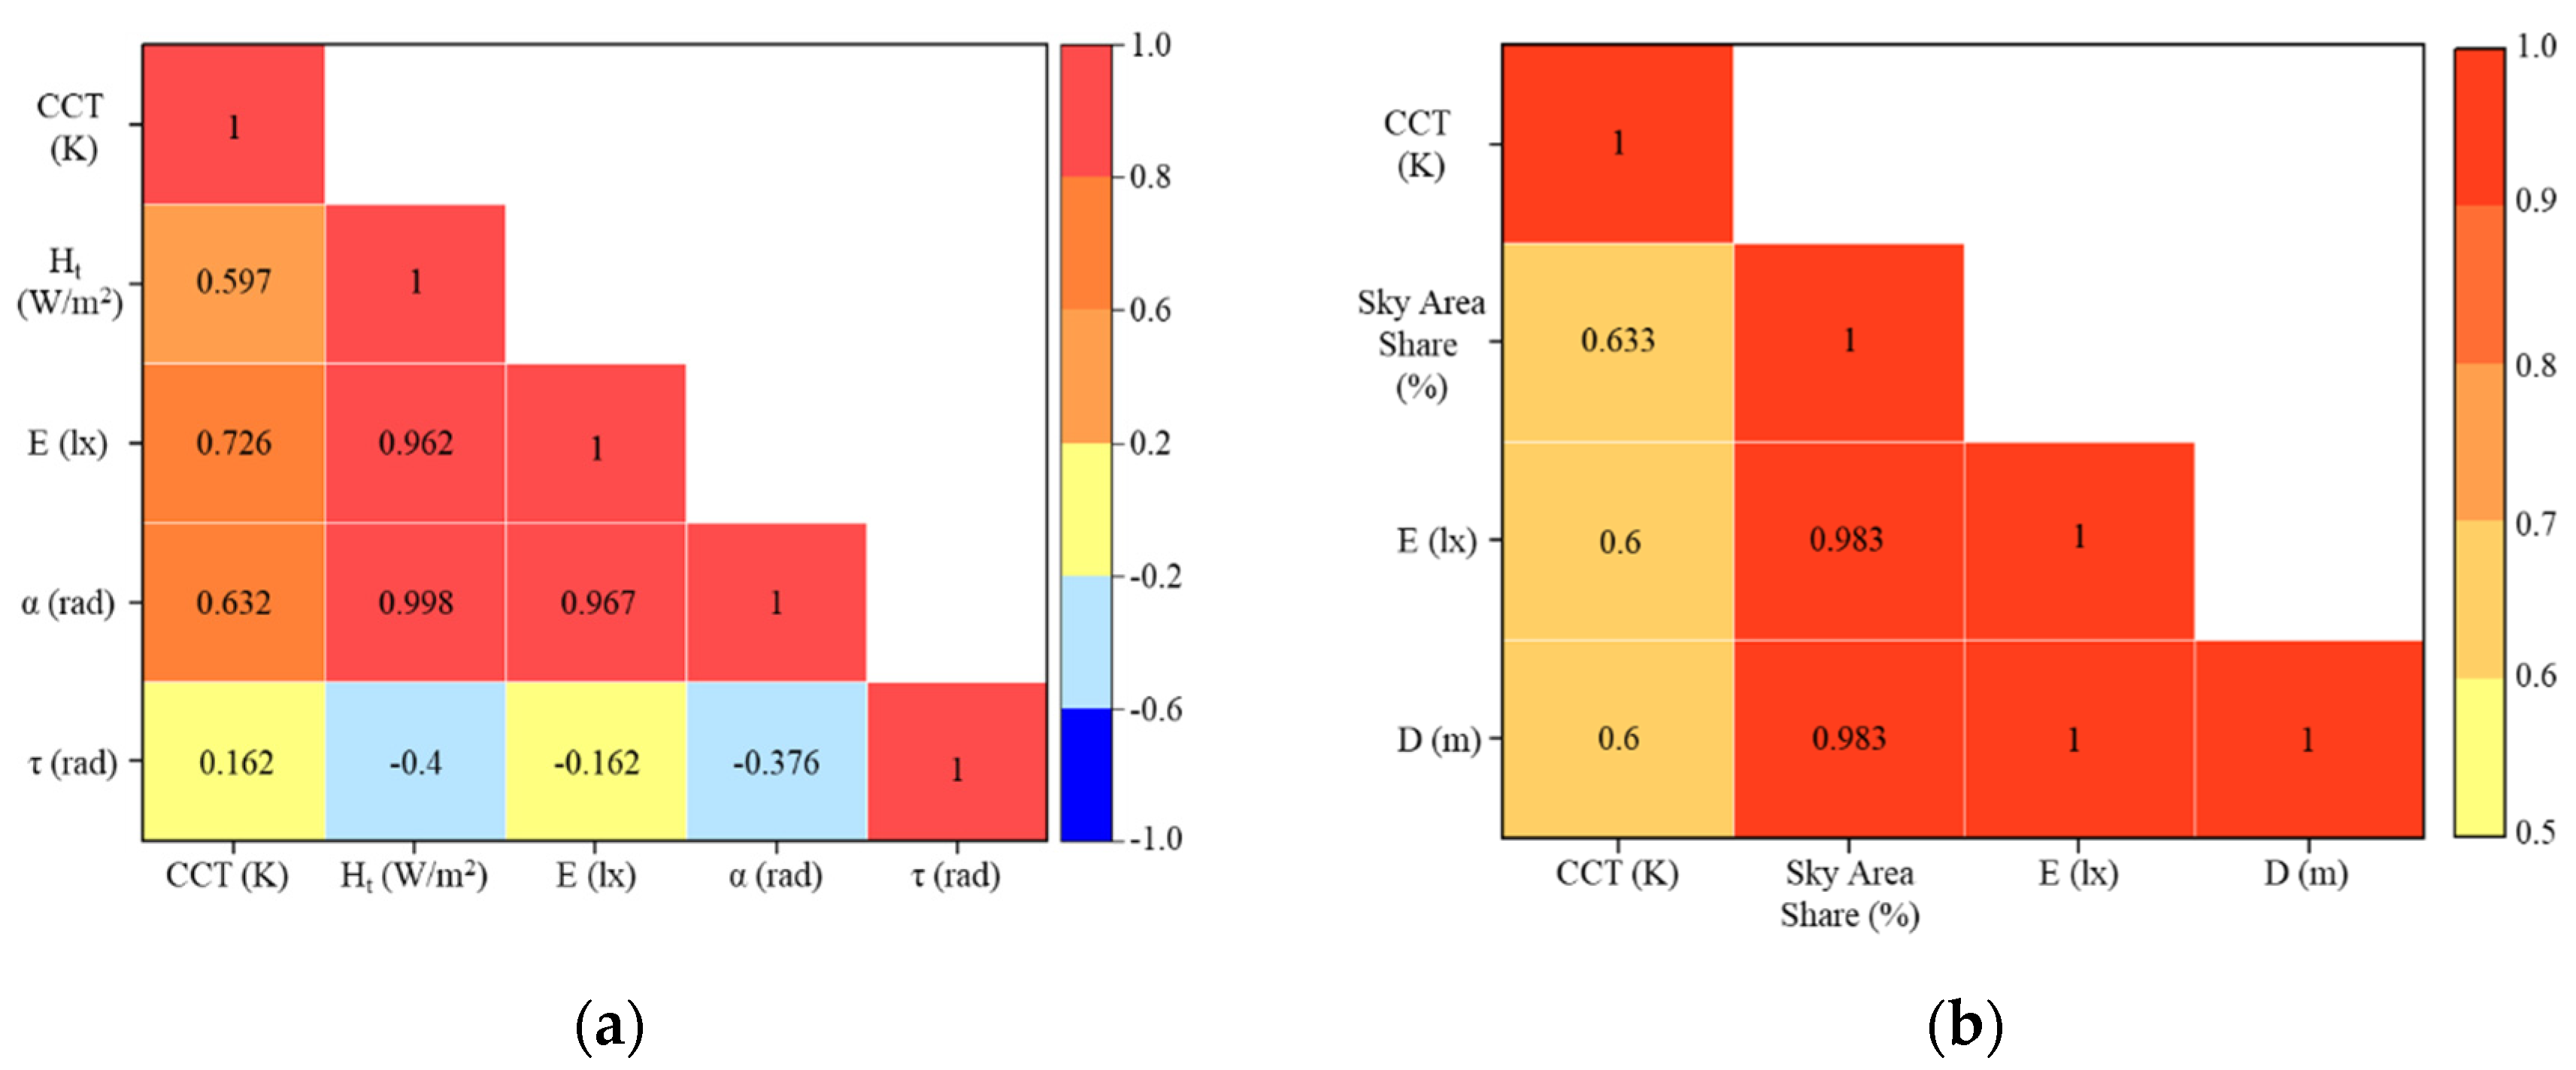
3.2.1. Correlation Analysis and Input Parameter Identification

To investigate the synergistic relationship between the CCT of the tunnel access zone and the solar irradiance, the vertical illuminance at the driver’s position and the sun’s position at the test time (solar altitude angle and solar hour angle) at the temporal level. In addition, in order to investigate the synergistic relationship between the CCT of the tunnel access zone and the vertical illuminance at the driver’s position, the sky area share within the driver’s 20° field of view and the distance of the test point from the tunnel portal at the spatial level. The Spearman correlation coefficients between the above parameters were calculated using the Luhua Road Tunnel as an example, and the correlation heat map has been plotted, as shown in Figure 9.
As can be seen from Figure 9a, the Spearman correlation coefficients between CCT and solar irradiance, vertical illuminance at the driver’s position, and solar altitude angle are all greater than 0.6, and the correlation coefficient with vertical illuminance at the driver’s position reaches 0.726. It can be found that the correlation coefficients between solar irradiance, vertical illuminance at the driver’s position, and solar altitude angle are all greater than 0.96, which shows a strong linear positive correlation. Moreover, as shown in Figure 9b, the CCT of the tunnel approach section is spatially non-linearly positively correlated with the above parameters, and the correlation coefficient with the sky area share reaches 0.633. Meanwhile, Spearman’s correlation coefficients of the vertical illuminance at the driver’s position, the sky area shared within the 20° field of view of the driver, and the distance of the test point from the tunnel portal are all up to 0.98.

3.2.2. Correlation Analysis and Input Parameter Identification

Combining the results of the correlation analysis between the tunnel access zone CCT and each characterization parameter in both temporal and spatial aspects, as mentioned above, the vertical illuminance at the driver’s position is taken as the input parameter, the distance D from the tunnel portal is selected as the spatial characterization parameter, and the solar irradiance Ht is taken as the temporal characterization parameter. The tunnel access zone CCT is taken as the dependent variable, and it is fitted with Ht, D, and the CCT of tunnel interior lighting (CCTin) in a multivariate linear fashion to further establish the CCT calculation model of the tunnel access zone. The data-fitting results are shown in Equation (8).
C C T = 1.3 H t 2.4 C C T i n D + 5618
To evaluate the calculation ability of the model, a scatter plot is plotted with the measured values as the horizontal coordinates and the calculated values as the vertical coordinates. The dashed line indicates that the percentage of relative error of the data on that line is 0%. The pink area indicates that the percentage of absolute error of the data points in the area is less than 6%, which is shown in Figure 10.
As can be seen from Figure 10, most of the errors of the data points in this calculation model are within ±6%, which indicates that the model possesses a relatively high measurement capability. According to Equations (1) and (2), the RMSE value of this CCT calculation model is 293 K, and the MAPE value is 4.19%. In addition, through the data traceability, it can be found that most of the data outside the error range of ±6% are concentrated in the stopping sight distance and 50 m from the tunnel portal. This is due to the fact that in the stopping sight distance, the area of the tunnel portal within the driver’s field of vision is relatively small, and at this time, the CCT received by the driver’s eyes is less affected by the tunnel internal lighting CCT, which leads to a deviation of the calculation results. According to Figure 6, the CCT peaks at 50 m from the portal of the tunnel, which is the critical position where solar radiation and the CCT of the interior tunnel lighting alternately affect the CCT received by the driver’s eyes, resulting in large fluctuations in the data.

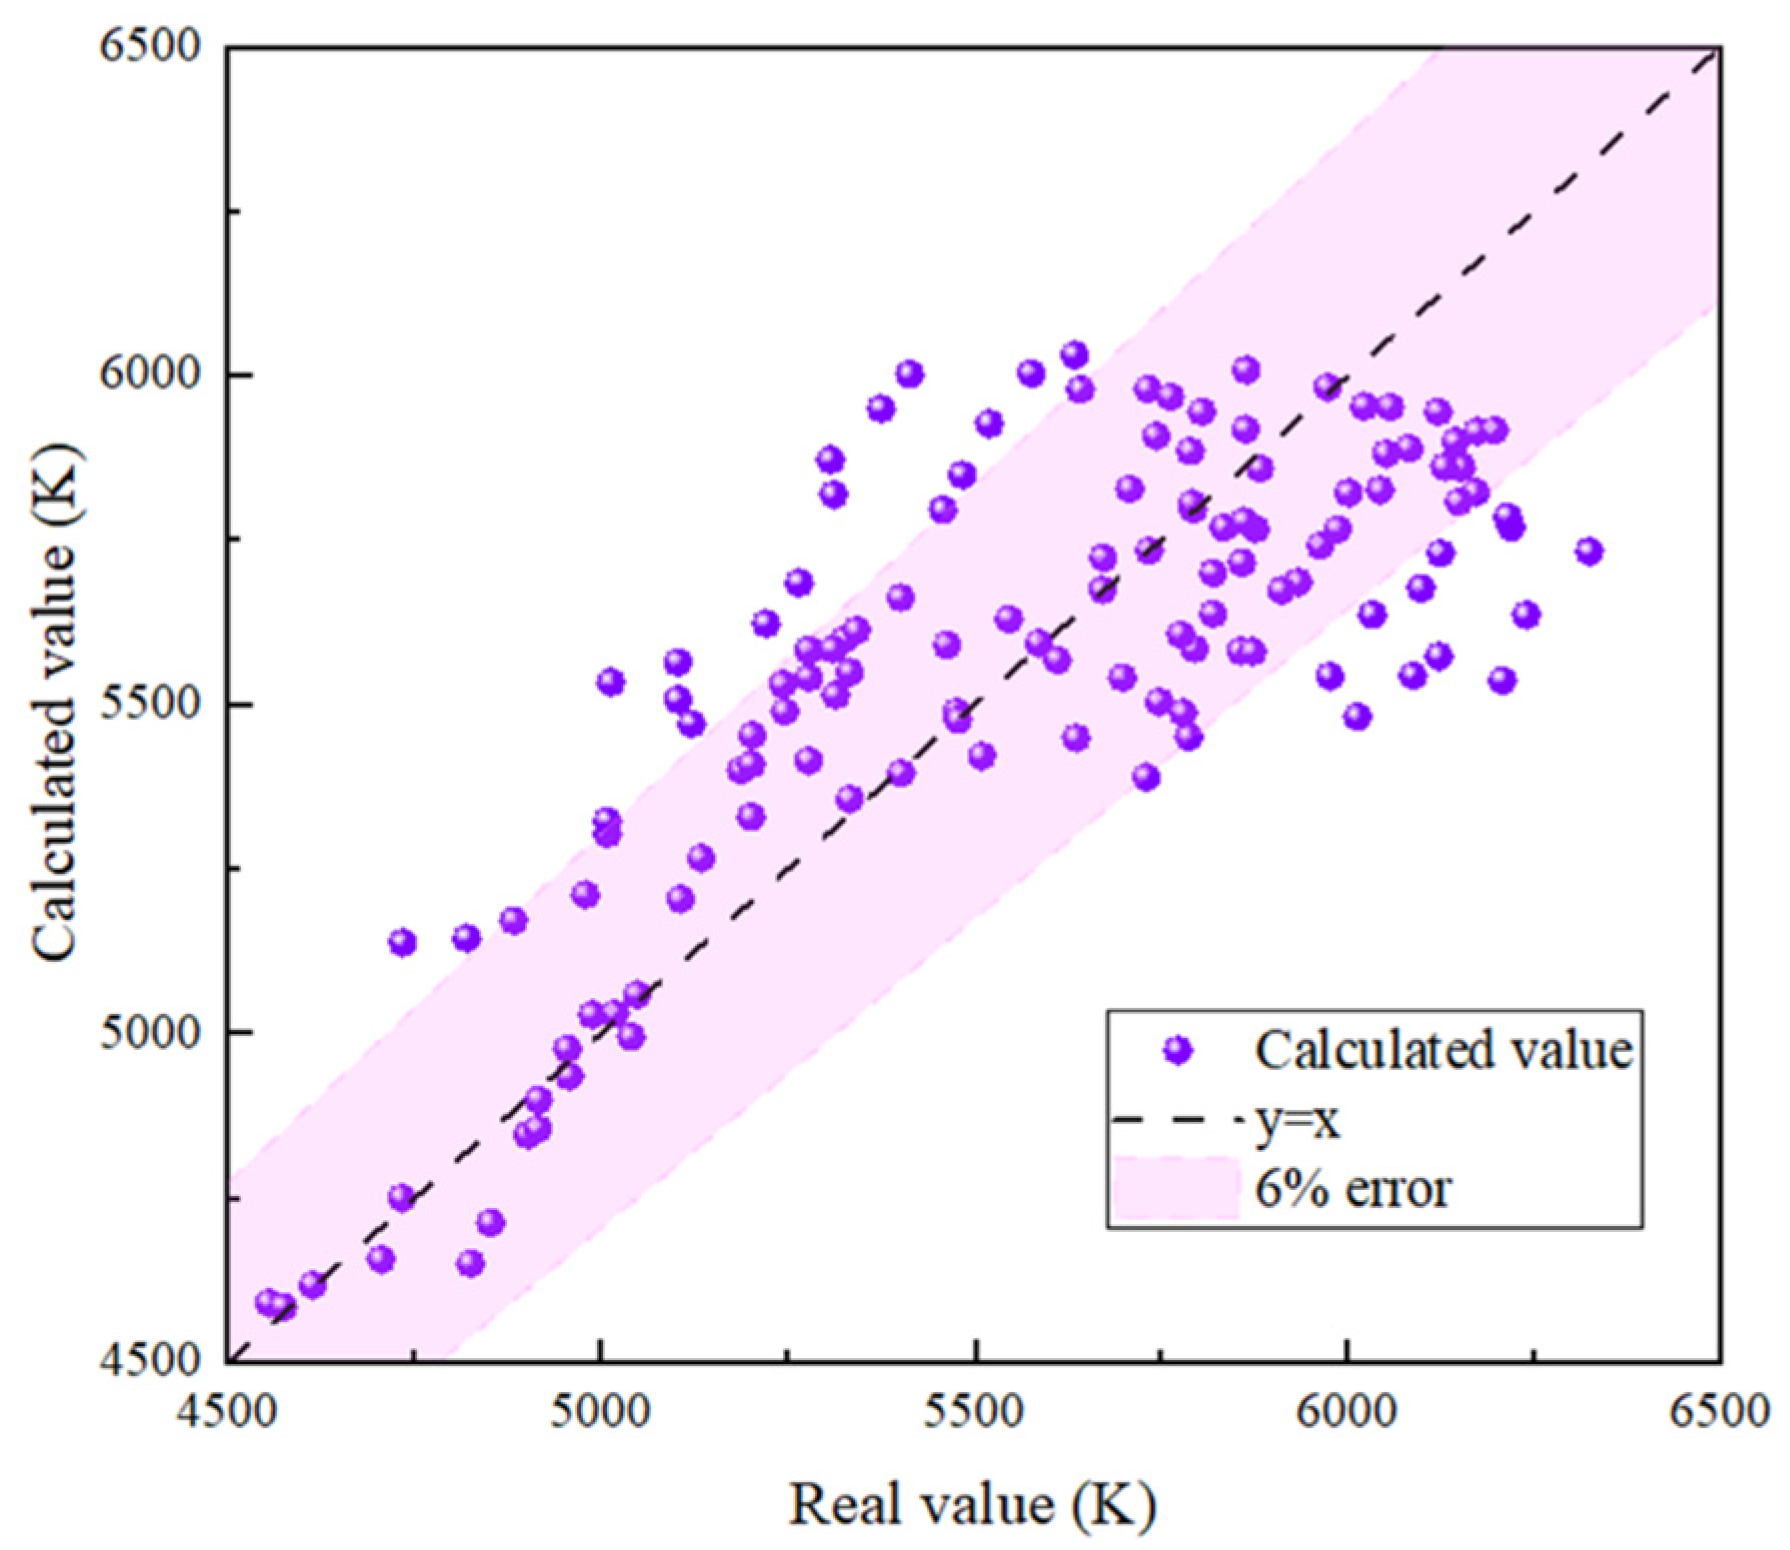
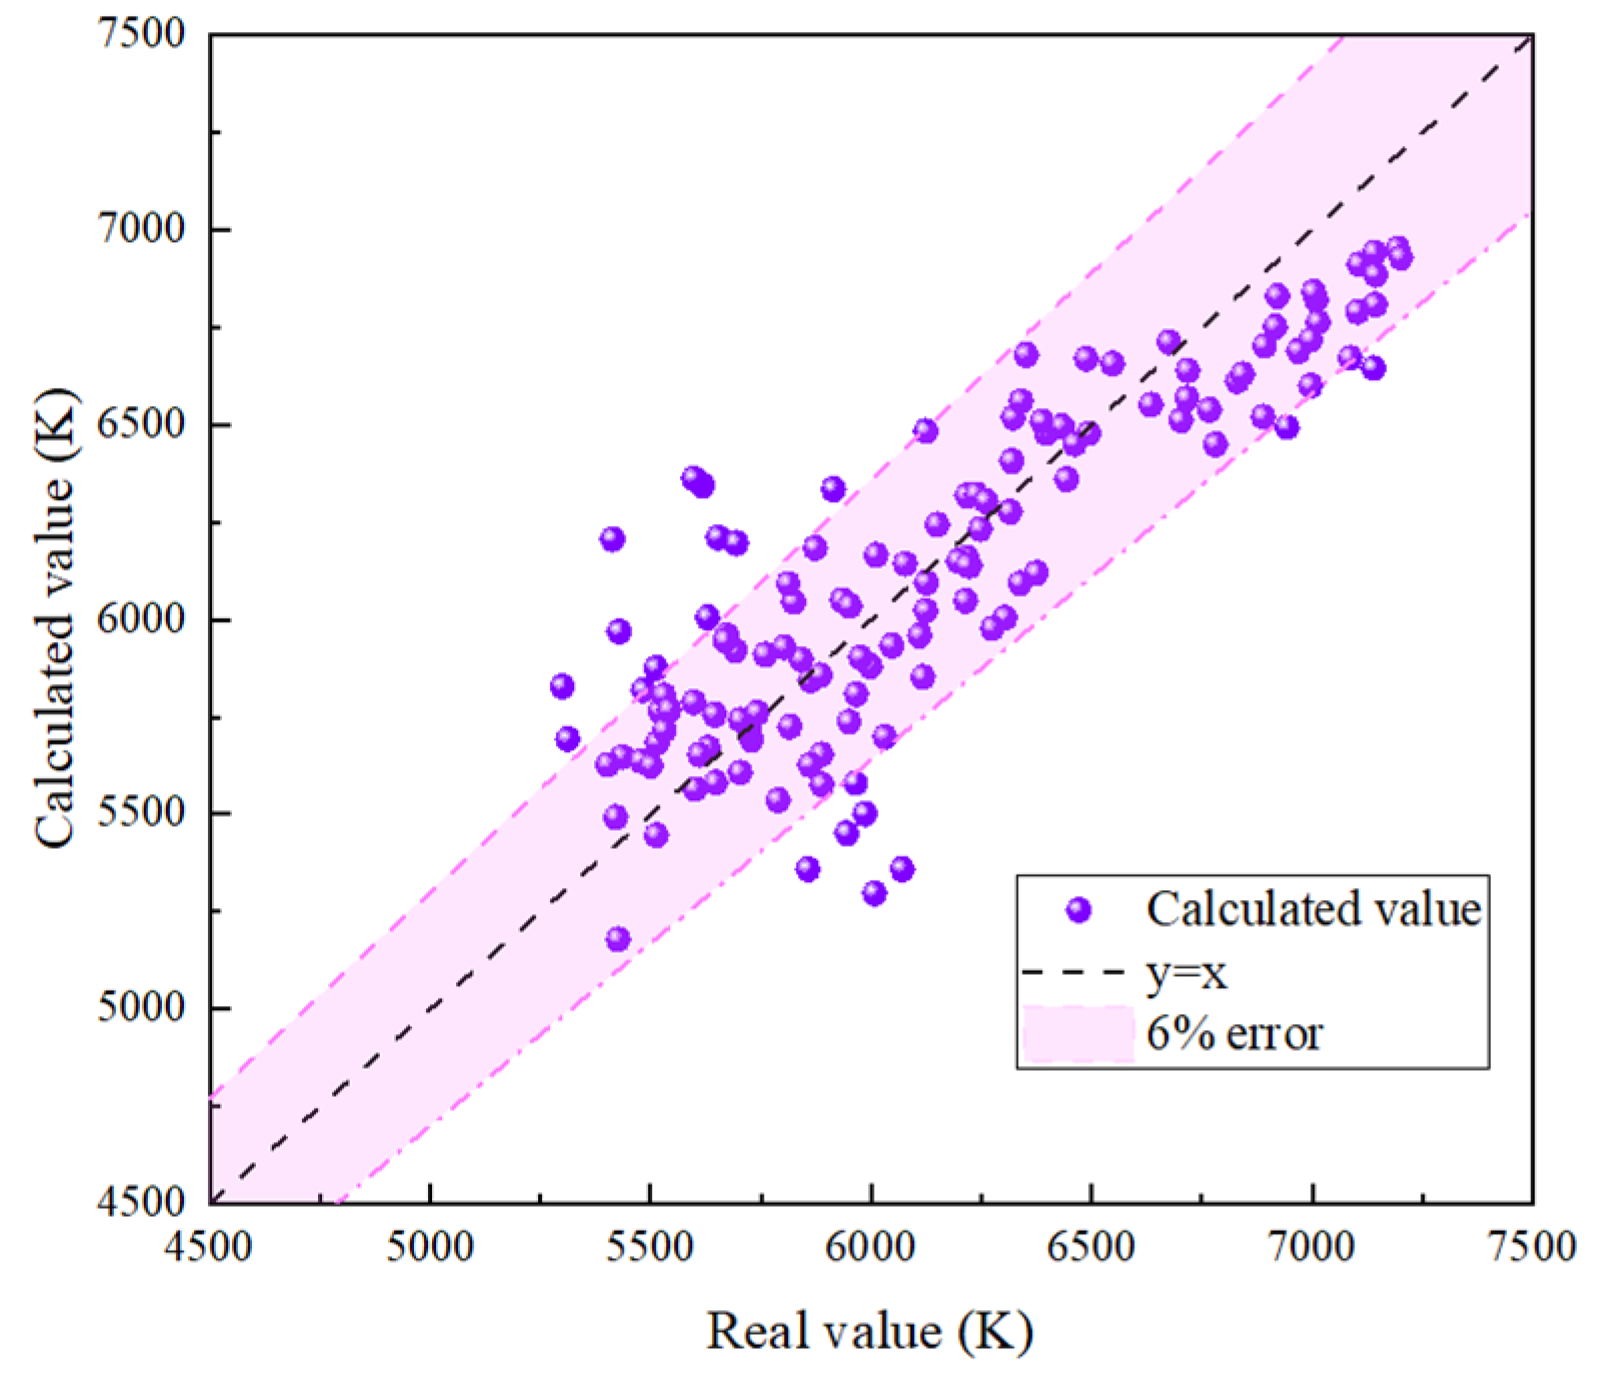
3.3. Validation of Research Methods

Tunnel 2 was selected to verify the scientific validity as well as the feasibility of the method of establishing the CCT calculation model. Based on the test data in the morning, the 3D wall charts are drawn with the same formality as Figure 6 and Figure 7, which is shown in Figure 11.
As shown in Figure 11, the variation rule of Tunnel 2 access zone CCT is similar to that of Tunnel 1, which is also 40 m away from the tunnel portal as the inflection point, with the CCT increasing gradually before 40 m and decreasing gradually after 40 m. However, in contrast to the variation rule of the CCT of the Tunnel 1 access zone, as the test time in the morning passes, the overall CCT in the access zone of Tunnel 2 shows a slowly decreasing trend and reaches the minimum value of the CCT in a day at about 12 o’clock in the middle of the day. It is analyzed that this is caused by the direction of the tunnel. Previous research has shown that the range of daytime sky CCT under clear sky conditions is generally 8000 K~18,000 K [31], which is much higher than the CCT of the reflected light on the surface of each ground scenery outside the tunnel; therefore, the tunnel access zone CCT is mainly determined by the CCT of the sky facing the direction of the tunnel. In addition, the test direction of Tunnel 1 is from south to north, while the test direction of Tunnel 2 is from north to south, which leads to the change of the sky color within the field of view of the driver in the approaching process of the tunnel to show the opposite rule of variation, which makes the rule of variation of the overall CCT opposite. In addition, the temporal variation rule of the CCT of the two tunnels is not obvious at their respective portals, which is due to the fact that the CCT measured in the experiment is the CCT received in the vertical plane facing the tunnel where the driver’s eyes are located, and the determining factor of the CCT has already been changed from the sunlight to the artificial lighting inside the tunnel when arriving at the portals of the tunnels. Meanwhile, the lighting sources in both tunnels are stationary, and their illumination parameters do not change. Therefore, the CCT at both portals is maintained at about 4700 K at any time of the day, and the variation is kept within a small range. Moreover, the spatiotemporal variation rule of vertical illuminance at the driver’s position is the same as that of the Luhua Road Tunnel.
According to Section 3.2, a multiple linear fit is performed using measured data from Tunnel 2. The data-fitting results are shown in Equation (9).
C C T = 3.3 H t 1.1 C C T i n D + 7216
To evaluate the calculation ability of the model, a scatter plot is plotted in the same manner as in Section 3.2.2, which is shown in Figure 12.
As can be seen from Figure 12, compared to the CCT calculation model of Tunnel 1, the data fit of Tunnel 2 is relatively better. According to Equations (1) and (2), the RMSE value of this CCT calculation model is 324.4 K and the MAPE value is 4.01%, which indicates that the model is capable of good CCT calculation. It also proves that the establishment method and process of the CCT calculation model are of scientific validity.

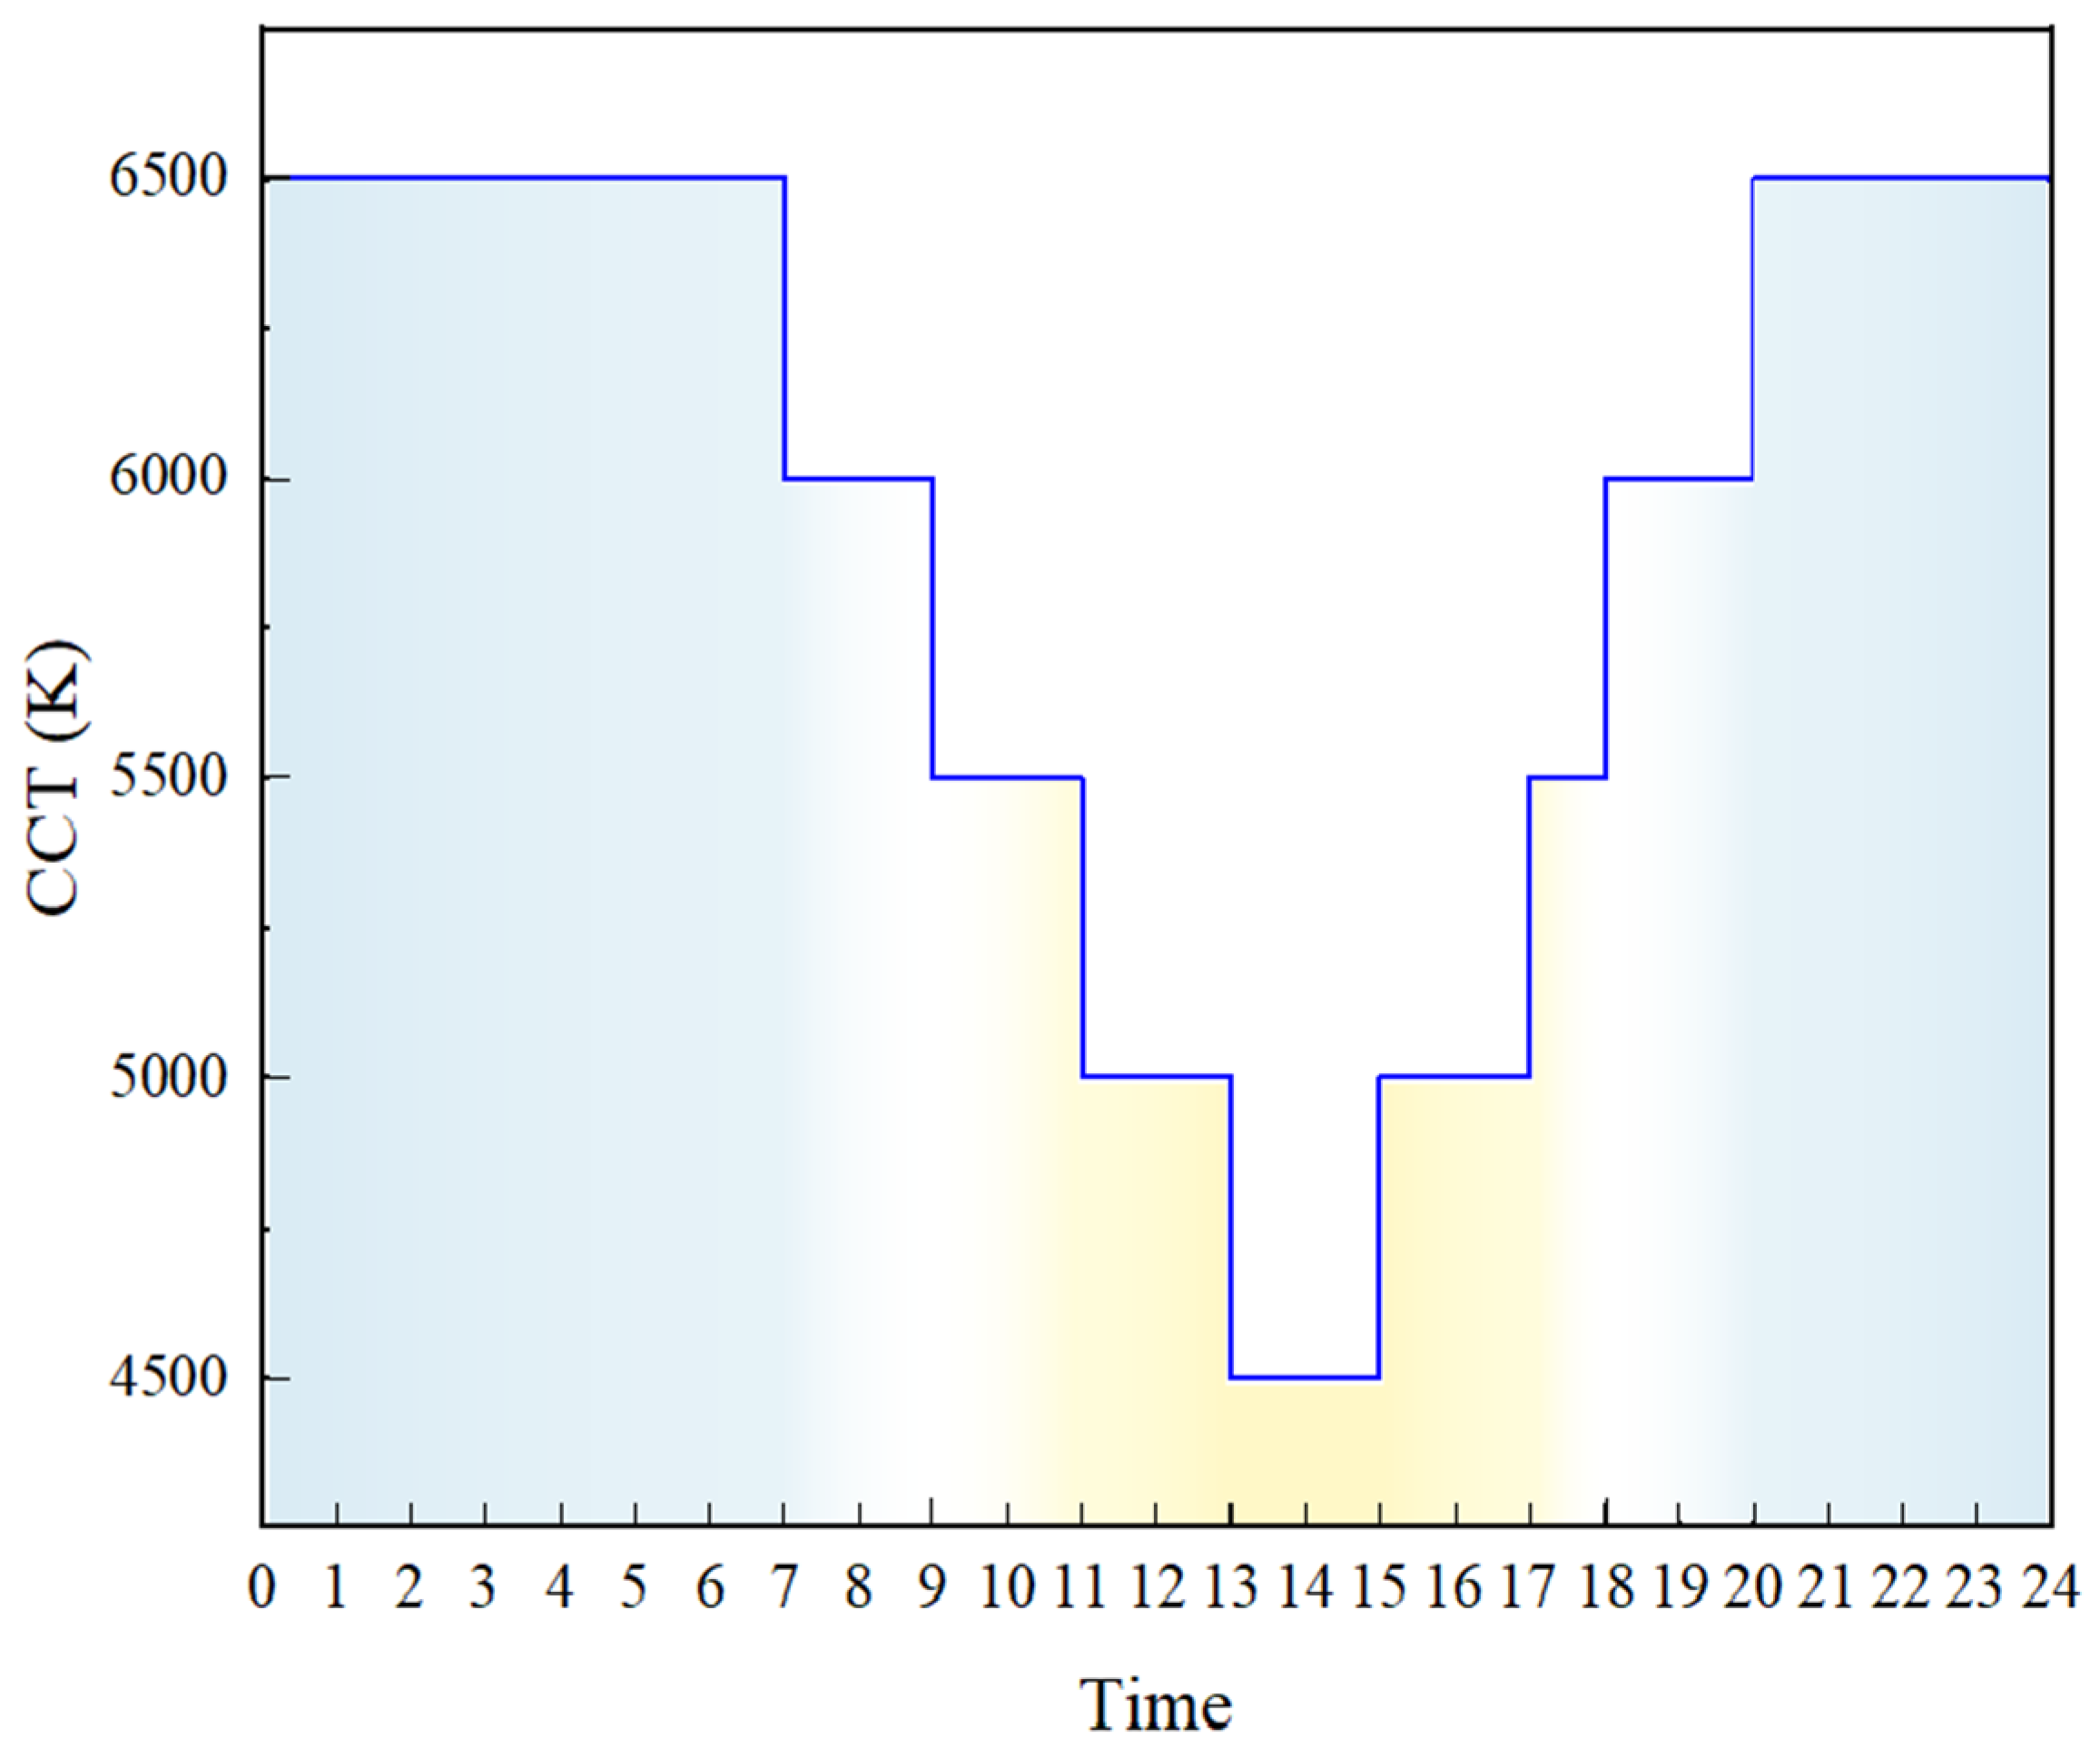
3.4. Suitable CCTin for Irradiance

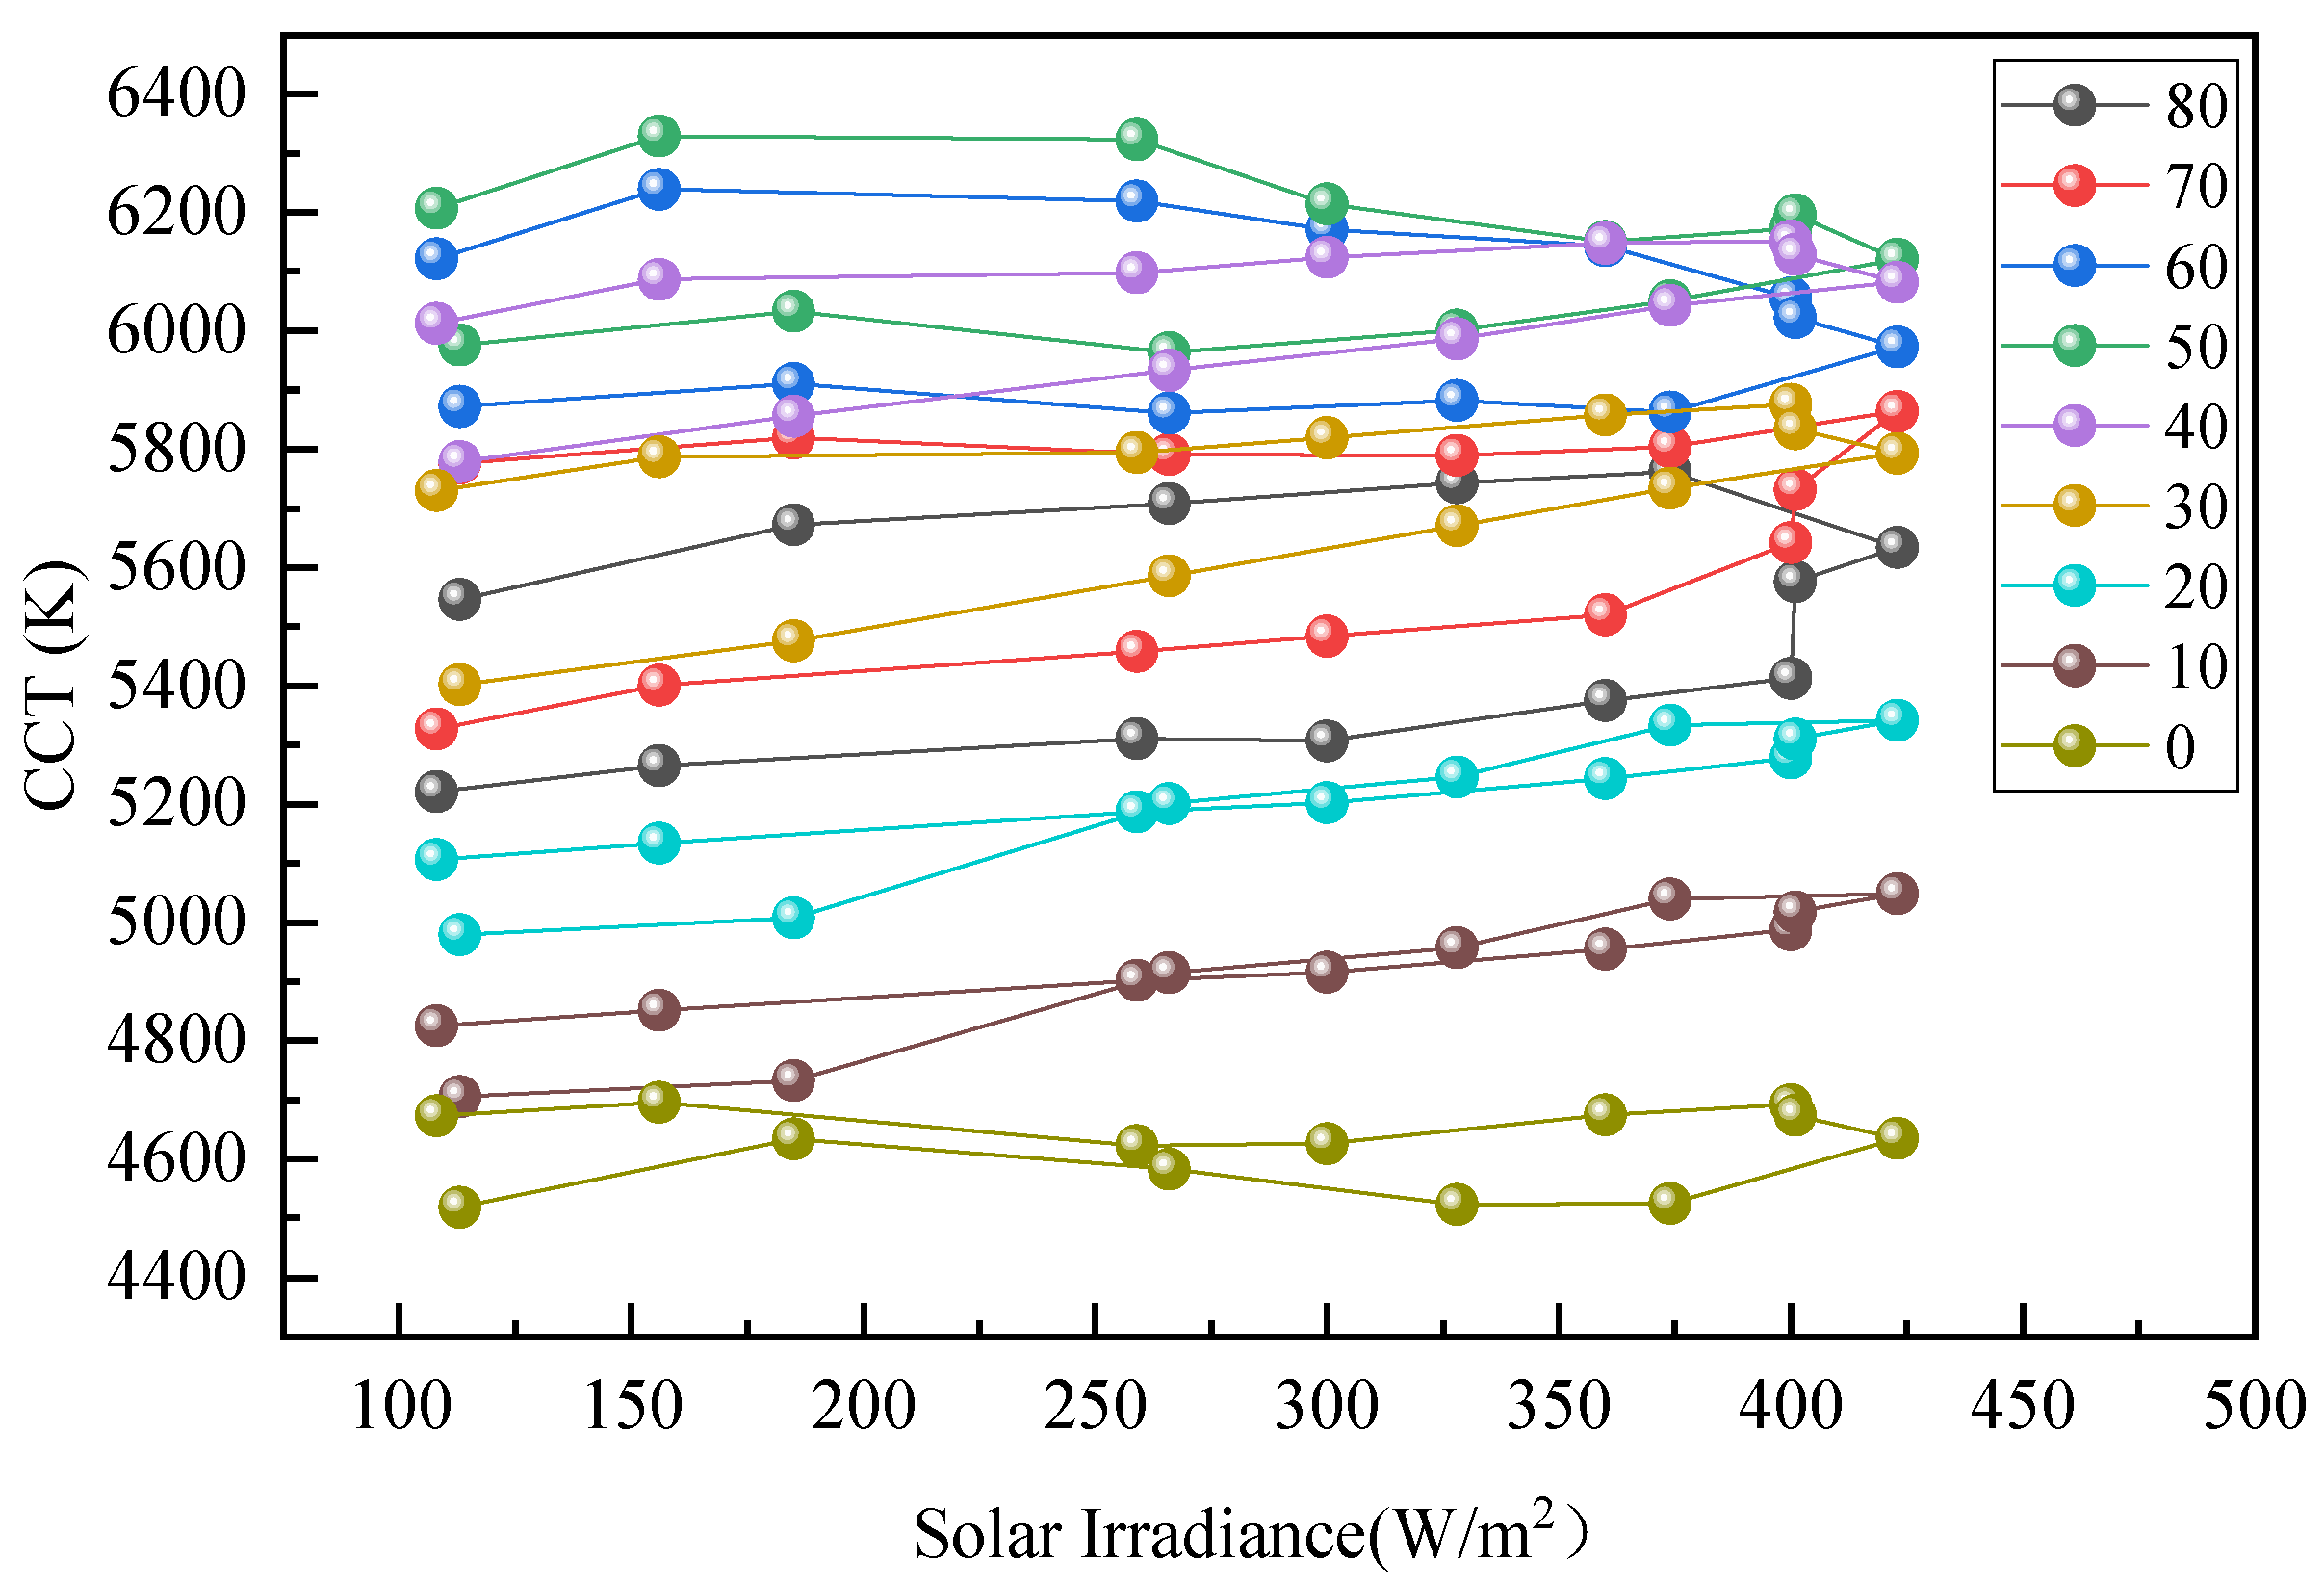
3.4.1. Relationship between CCT and Solar Irradiance

From Figure 5 and Figure 11, it can be found that a driver traveling at a speed of 60 km/h experiences a dramatic shift in CCT from 6200 K to 6800 K and subsequently to 4700 K within 5 s. Such a pronounced transition from natural daylight to artificial lighting impedes the driver’s capacity to swiftly acclimate to the novel lighting conditions, further exacerbating the visual lag. Therefore, the phenomenon of sudden changes in the CCT can be solved by replacing the lighting fixtures in the tunnel threshold zone with CCT adjustable fixtures and setting the CCTin to a range close to the CCT outside the tunnel.
Take Tunnel 2, for example; according to Equation (9), the CCT received by the driver’s eye at 40 m from the tunnel portal under any solar irradiance environment can be calculated, and then combined with Equation (9), the range of values of illumination color temperature that makes the driver’s eye more comfortable can be calculated. For example, when the solar irradiance is 800 W/m2, the CCT received by the driver’s eye at 40 m from the tunnel portal is about 4600 K. Under this environment, the range of the CCT that the human eye can distinguish is 4484 K to 4717 K; therefore, adjusting CCTin to this range will result in a smooth transition in the CCT of the driver’s eyes.

3.4.2. The Optimal Range of CCTin Values

Following the calculation steps in Section 3.4.1, the suitable CCTin at different irradiance levels can be derived. However, in the actual tunnel lighting, excessively high or low CCT environments will also lead to driver discomfort, and the CCT adjustment range of common tunnel lighting LED luminaires is 4000 K to 6500 K. Therefore, the value range of the suitable CCTin is adjusted accordingly on the basis of the calculation formula. The adjusted comfort CCTin range is shown in Figure 13. The black dashed line indicates the best CCTin value for Tunnel 2, and the pink area indicates the appropriate CCTin value.
As shown in Figure 13, when solar irradiance is between 300 W/m2 and 800 W/m2, the value of CCTin is determined by the CCT of the tunnel’s external environment, which ranges from 4400 K to 6300 K. Irradiance below 300 W/m2 occurs mostly in the early morning and late afternoon, when the CCT of the sky in the driver’s facing direction is relatively high. During this time period, the value of CCTin needs to be adjusted to between 6000 K and 6300 K. When solar irradiance is greater than 800 W/m2, a relatively low CCTin (4500 K) will allow the driver to adapt more quickly to changes in the light environment.

4. Discussion

4.1. Recommendations for Tunnel Lighting Based on CCT Variation

The human eye is highly sensitive to variations in CCT, especially under dynamic driving conditions. CCT refers to the warmth or coolness of light and has a significant impact on drivers’ visual perception and comfort. A higher CCT, typically associated with cooler, bluish light, can enhance contrast and visibility but may also lead to increased glare and visual fatigue over time. Conversely, a lower CCT, characterized by warmer, yellowish light, can provide a more comfortable and relaxed visual environment but may reduce contrast, especially in low-light conditions.
Therefore, it is imperative to not only enhance the luminance within the tunnel but also to ensure consistency between the CCT inside the tunnel and that outside. Section 3.4 describes the methodology for determining the optimal CCTin range by solar irradiance. According to the Spearman correlation analysis result in Figure 10, the solar irradiance has a strong positive correlation with the sun hour angle; therefore, the values of CCTin taken at different time periods can be plotted based on Figure 13. The new CCTin control logic can be represented by Figure 14.
The CCT outside the tunnel exhibits minimal fluctuation during the daytime, generally hovering around 6000 K. Consequently, it is recommended that the lighting at the tunnel entrance during the daytime employ LED light sources with a CCT of 6000 K. During dawn and dusk, there is a noticeable decrease in the CCT outside the tunnel, although it typically remains around 5000 K. As such, it is preferable that the lighting at the tunnel entrance during these times of day utilize LED light sources with a CCT of 5000 K. This approach ensures optimal visual conditions for drivers entering or exiting the tunnel, thereby enhancing overall driving safety.

4.2. Application Scenarios and Potential of the Proposed Model

This study proposes a method to establish a CCT calculation model for the access zone of a tunnel based on field measurements. Each tunnel has its own unique CCT calculation model due to the different external scenery of the tunnels. After establishing the CCT calculation model of a tunnel, the calculation equation applicable to the selection of the CCT of the tunnel interior lighting can be derived. Further, depending on the actual situation, the CCTin can be controlled according to solar radiation or according to the time of day.

5. Conclusions

The research presented in this paper contributes significantly to the field of road safety and lighting design, particularly in the context of tunnel access zones. By establishing a comprehensive CCT calculation model based on field test data, this study has provided a robust framework for understanding the dynamic interplay between natural light and artificial lighting within the critical approach to tunnels.
  • The CCT calculation model of the tunnel access zone has been established based on field test data, the modeling method has been validated, and the mean absolute percentage error can be controlled within 5% with verification, which can accurately calculate the CCT of the tunnel access zone.
  • For an urban tunnel that includes the sky in the driver’s 20° field of view at the stopping sight distance, the CCT received by the driver’s eye varies in the range of 4500~7300 K. Within 20 m from the tunnel portal, CCT is mainly influenced by lighting sources inside the tunnel; in the section space between 20 and 50 m from the tunnel portal, CCT is influenced by a combination of solar radiation and lighting sources inside the tunnel portal; beyond 50 m from the tunnel portal, CCT is mainly influenced by solar radiation.
  • As a result of Spearman correlation analysis, the CCT received by the driver’s eyes during the approach to the tunnel is related to the solar irradiance, the distance from the tunnel portal, and the CCT of the tunnel interior lighting.
The implications of this research extend beyond the immediate benefits of improved tunnel lighting. It offers a methodological approach that can be adapted and applied to other areas where the integration of natural and artificial light is crucial. Furthermore, the study’s focus on the temporal and spatial aspects of CCT variation provides a valuable reference for future research endeavors in the field of spatiotemporal lighting dynamics.
Moving forward, the application of the insights gained from this research will not only lead to the development of more effective lighting strategies for tunnel access zones but will also contribute to the broader discourse on sustainable and energy-efficient lighting solutions. The potential for integrating smart lighting technologies that respond to real-time environmental conditions presents an exciting avenue for future innovation, promising a safer and more comfortable driving experience for all road users.

Author Contributions

Conceptualization, Y.Y. and S.W.; methodology, Y.Z. and P.X.; software, P.X.; validation, Z.G. and Z.N.; formal analysis, Y.Z.; investigation, Z.G.; resources, Y.Y. and S.W.; data curation, Y.Z.; writing—original draft preparation, Y.Z., Z.G. and Z.N.; writing—review and editing, P.X.; visualization, Z.N.; supervision, P.X.; project administration, Y.Y. and S.W.; funding acquisition, P.X. All authors have read and agreed to the published version of the manuscript.

Funding

This research was funded by China Railway Siyuan Survey and Design Group Co., Ltd., grant number TSY2022QT032, and the APC was funded by Beijing University of Technology.

Institutional Review Board Statement

Not applicable.

Informed Consent Statement

Not applicable.

Data Availability Statement

Data is contained within the article.

Conflicts of Interest

The authors declare that this study received funding from China Railway Siyuan Survey and Design Group Co., Ltd. The funder had the following involvement with the study: TSY2022QT032.

References

  1. Ministry of Transport of China. Statistical Communiqúe on the Development of the Transportation Industry in 2021; Ministry of Transport of China: Beijing, China, 2022.
  2. Ministry of Transport of China. Statistical Communiqúe on the Development of the Transportation Industry in 2020; Ministry of Transport of China: Beijing, China, 2021.
  3. Ministry of Transport of China. Statistical Communiqúe on the Development of the Transportation Industry in 2019; Ministry of Transport of China: Beijing, China, 2020.
  4. Bassan, S. Overview of traffic safety aspects and design in road tunnels. IATSS Res. 2016, 40, 35–46. [Google Scholar] [CrossRef]
  5. Salata, F.; Golasi, I.; Poliziani, A.; Futia, A.; de Lieto Vollaro, E.; Coppi, M.; de Lieto Vollaro, A. Management optimization of the luminous flux regulation of a lighting system in road tunnels. A first approach to the exertion of predictive control systems. Sustainability 2016, 8, 1092. [Google Scholar] [CrossRef]
  6. Pannu, A. Artificial intelligence and its application in different areas. Artif. Intell. 2015, 4, 79–84. [Google Scholar]
  7. Lai, J.; Zhang, P.; Zhou, H.; Cheng, F.; Qin, H. Study of Rules of Traffic Accidents in Expressway Tunnels. Tunn. Constr. 2017, 37, 37–42. [Google Scholar]
  8. Moretti, L.; Cantisani, G.; Carrarini, L.; Bezzi, F.; Cherubini, V.; Nicotra, S. Italian road tunnels: Economic and environmental effects of an on-going project to reduce lighting consumption. Sustainability 2019, 11, 4631. [Google Scholar] [CrossRef]
  9. Moretti, L.; Cantisani, G.; Di Mascio, P.; Caro, S. Technical and economic evaluation of lighting and pavement in Italian road tunnels. Tunn. Undergr. Space Technol. 2017, 65, 42–52. [Google Scholar] [CrossRef]
  10. Qin, L.; Dong, L.; Xu, W.; Zhang, L.; Yan, Q.; Chen, X. A “vehicle in, light brightens; vehicle out, light darkens” energy-saving control system of highway tunnel lighting. Tunn. Undergr. Space Technol. 2017, 66, 147–156. [Google Scholar] [CrossRef]
  11. CIE. Fundamentals of the Visual Task of Night Driving; CIE Technical Report 100-1992; CIE: Taiwan, China, 1992. [Google Scholar]
  12. O’Donell, B.; Colombo, E.; Boyce, P. Colour information improves relative visual performance. Light. Res. Technol. 2011, 43, 423–438. [Google Scholar] [CrossRef]
  13. Boyce, P.; Akashi, Y.; Hunter, C.; Bullough, J. The impact of spectral power distribution on the performance of an achromatic visual task. Light. Res. Technol. 2003, 35, 141–156. [Google Scholar] [CrossRef]
  14. McKeefry, D.J.; Parry, N.R.; Murray, I.J. Simple reaction times in color space: The influence of chromaticity, contrast, and cone opponency. Investig. Ophthalmol. Vis. Sci. 2003, 44, 2267–2276. [Google Scholar] [CrossRef]
  15. O’Donell, B.M.; Barraza, J.F.; Colombo, E.M. The effect of chromatic and luminance information on reaction times. Vis. Neurosci. 2010, 27, 119–129. [Google Scholar] [CrossRef]
  16. Rea, M.S.; Ouellette, M.; Tiller, D.K. The effects of luminous surroundings on visual performance, pupil size, and human preference. J. Illum. Eng. Soc. 1990, 19, 45–58. [Google Scholar] [CrossRef]
  17. Zube; Taylor, J.G. Landscape Assessment and Perception Research Methods in Environmental and Behavioral Research; Van Nostrand Reinhold Company: New York, NY, USA, 1987; pp. 361–393. [Google Scholar]
  18. Chapanis, A. Hazards associated with three signal words and four colours on warning signs. Ergonomics 1994, 37, 265–275. [Google Scholar] [CrossRef]
  19. McGwin, G., Jr.; Brown, D.B. Characteristics of traffic crashes among young, middle-aged, and older drivers. Accid. Anal. Prev. 1999, 31, 181–198. [Google Scholar] [CrossRef]
  20. Dong, L.; Qin, L.; Xu, W.; Zhang, L. The impact of LED correlated color temperature on visual performance under mesopic conditions. IEEE Photonics J. 2017, 9, 8201616. [Google Scholar] [CrossRef]
  21. Jin, H.; Jin, S.; Chen, L.; Cen, S.; Yuan, K. Research on the lighting performance of LED street lights with different color temperatures. IEEE Photonics J. 2015, 7, 1601309. [Google Scholar] [CrossRef]
  22. Shin, J.C.; Yaguchi, H.; Shioiri, S. Change of color appearance in photopic, mesopic and scotopic vision. Opt. Rev. 2004, 11, 265–271. [Google Scholar] [CrossRef]
  23. Zhang, Q.; Chen, Z.; Hu, Y.; Yang, C. Study on the Influence of Lighting Source Color Temperature on Visual Performance in Tunnel and Road Lighting. China Illum. Eng. J. 2008, 19, 24–29. [Google Scholar]
  24. Liang, B.; He, S.; Tähkämö, L.; Tetri, E.; Cui, L.; Dangol, R.; Halonen, L. Lighting for road tunnels: The influence of CCT of light sources on reaction time. Displays 2020, 61, 101931. [Google Scholar] [CrossRef]
  25. Li, X.; Ling, J.; Shen, Y.; Lu, T.; Feng, S.; Zhu, H. The impact of CCT on driving safety in the normal and accident situation: A VR-based experimental study. Adv. Eng. Inform. 2021, 50, 101379. [Google Scholar] [CrossRef]
  26. Liu, Y.; Peng, L.; Lin, L.; Chen, Z.; Weng, J.; Zhang, Q. The impact of LED spectrum and correlated color temperature on driving safety in long tunnel lighting. Tunn. Undergr. Space Technol. 2021, 112, 103867. [Google Scholar] [CrossRef]
  27. Zhang, X.; Hu, J.; Wang, R.; Gao, X.; He, L. The comprehensive efficiency analysis of tunnel lighting based on visual performance. Adv. Mech. Eng. 2017, 9, 1687814017696449. [Google Scholar] [CrossRef]
  28. Dong, L.-L.; Lou, Q.; Liu, P.; Xu, W.-H. The Impact of LED Colour Rendering on Reaction Time of Human Eyes in Tunnel Interior Zone. Adv. Civ. Eng. 2021, 2021, 6987673. [Google Scholar] [CrossRef]
  29. Xu, J.; Chen, Z. Research on dynamic changes of tunnel adaptation luminance and color temperature based on radiometry. Archit. Pract. 2019, 2, 40–41. [Google Scholar]
  30. Judd, D.B.; Wyszecki, G.W. Color in Business, Science, and Industry, 3rd ed.; Wiley-Blackwell: Hoboken, NJ, USA, 1975. [Google Scholar]
  31. Xue, P.; Wang, H.; Luo, T.; Zhao, Y.; Fan, C.; Ma, T. Clear sky color modeling based on BP neural network. Build. Environ. 2022, 226, 109715. [Google Scholar] [CrossRef]
Figure 1. Tunnel photos: (a) The Luhua Road Tunnel in Beijing. (b) The Tongzhou Beiguan Tunnel in Beijing.
Sustainability 16 04838 g001
Figure 2. Schematic diagram of a field test.
Sustainability 16 04838 g002
Figure 3. Overall flow chart of the study.
Sustainability 16 04838 g003
Figure 4. The spatiotemporal variation pattern of CCT in the tunnel access zone: (a) Different time. (b) Different distances.
Sustainability 16 04838 g004
Figure 5. CCT 3D wall charts of Tunnel 1.
Sustainability 16 04838 g005
Figure 6. Vertical illuminance 3D wall charts of Tunnel 1.
Sustainability 16 04838 g006
Figure 7. Vertical illuminance and irradiance in the tunnel access zone.
Sustainability 16 04838 g007
Figure 8. The variation pattern of CCT and irradiance in the tunnel access zone.
Sustainability 16 04838 g008
Figure 9. The correlation heat map of CCT and other parameters: (a) Temporal parameters. (b) Spatial parameters.
Sustainability 16 04838 g009
Figure 10. Comparison between measured and calculated CCT of Tunnel 1.
Sustainability 16 04838 g010
Figure 11. Three-dimensional wall charts of Tunnel 2: (a) CCT and (b) vertical illuminance.
Sustainability 16 04838 g011
Figure 12. Comparison between measured and calculated CCT of Tunnel 2.
Sustainability 16 04838 g012
Figure 13. Suitable CCTin of Tunnel 2.
Sustainability 16 04838 g013
Figure 14. Recommended control logic for tunnel threshold zone CCT.
Sustainability 16 04838 g014
Table 1. Information on the two field-measured tunnels.
NameLocationOrientationSlope
Luhua Road Tunnel116.3° E, 39.8° N15° North by West3%
Beiguan Tunnel116.6° E, 39.9° N28° South by East4%
Table 2. Primary parameters for the devices used in this research.
InstrumentPictureTest ContentParameterValue
Spectral Flickering Irradiance Meter Sustainability 16 04838 i001CCTRange1518~100,000 K
Accuracy±3%
Vertical illuminanceRange1~220,000 l×
Accuracy±3%
Solar irradiance meter
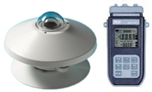
Sustainability 16 04838 i002Solar irradianceRange0.01~2000 W/m2
Accuracy±2%
Disclaimer/Publisher’s Note: The statements, opinions and data contained in all publications are solely those of the individual author(s) and contributor(s) and not of MDPI and/or the editor(s). MDPI and/or the editor(s) disclaim responsibility for any injury to people or property resulting from any ideas, methods, instructions or products referred to in the content.

