

Data Drive—Charging Behavior of Electric Vehicle Users with Variable Roles


Abstract
:1. Introduction
2. Literature Review
3. Research Design
3.1. Data Interpretation
3.2. Research Models
4. Result
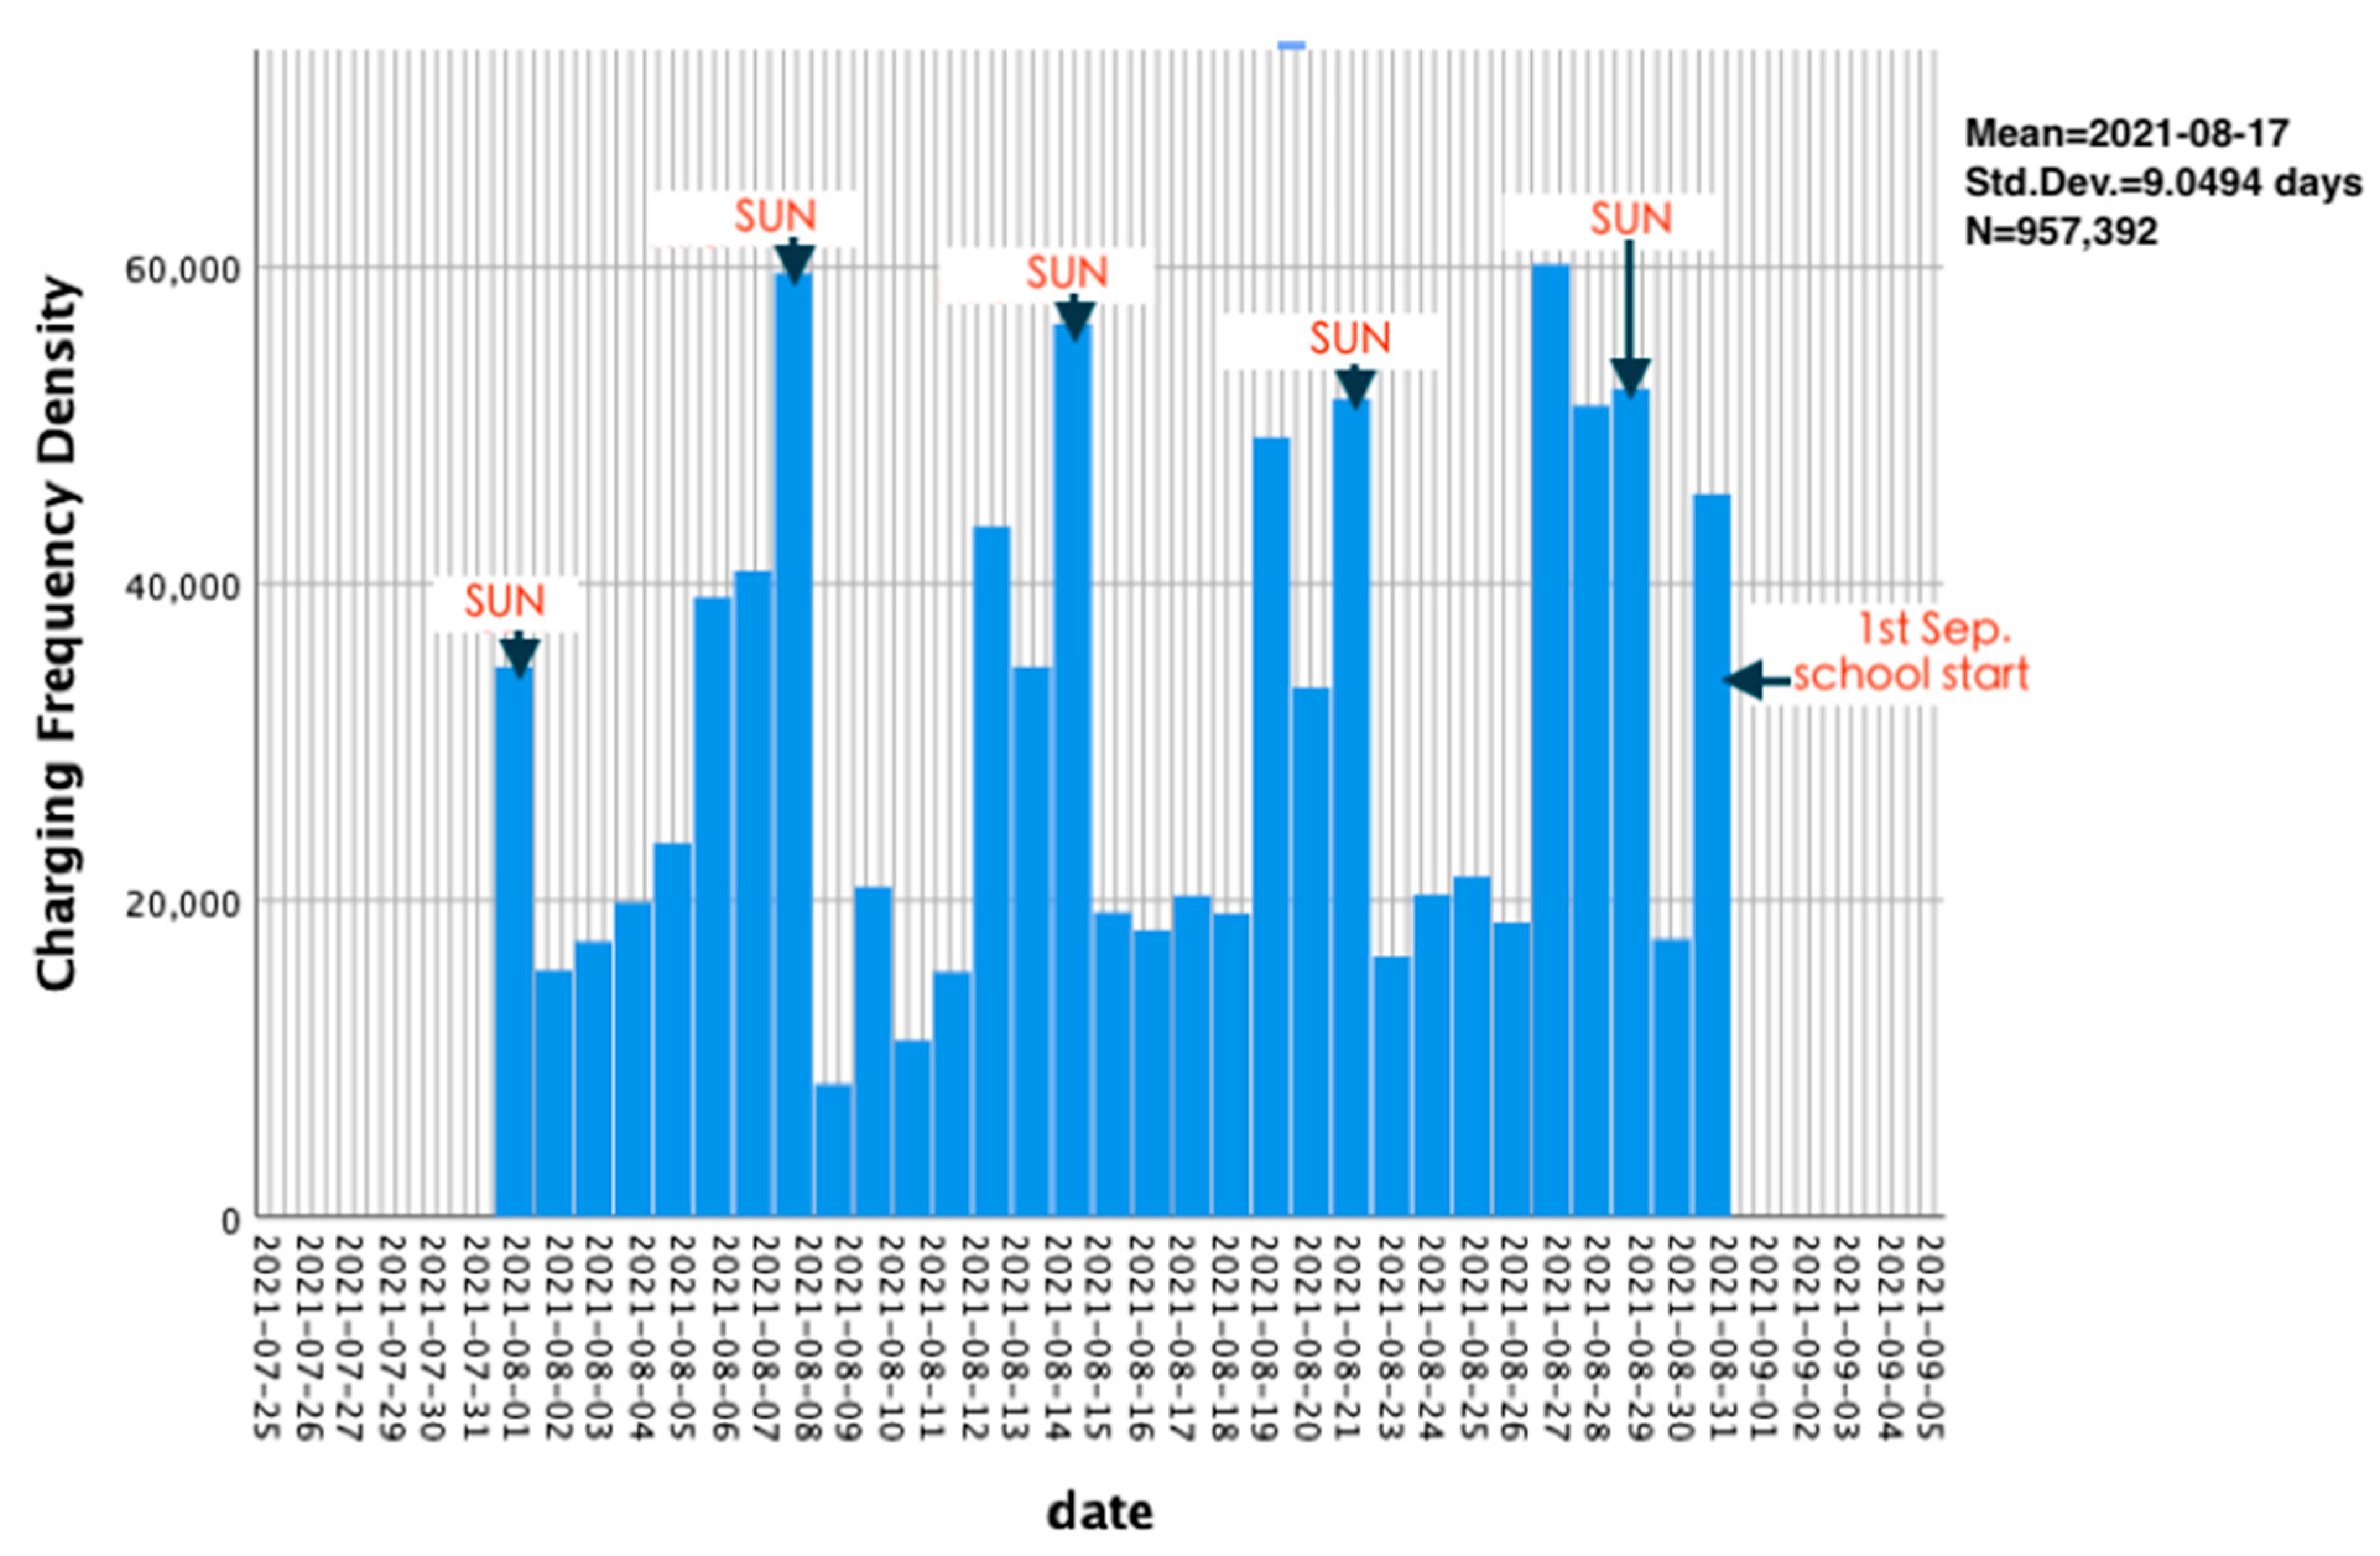
4.1. Research Charging Behavior of Private EV
- (1)
- In EV instead of walking mode, the weekly charging frequency can meet the power needs of an EV. It is more convenient to charge on holidays.
- (2)
- The charging concentration on the day before the holiday is to meet the need of holiday travel.
- (3)
- The increase in the travel distance will also increase the frequency of holiday charging.
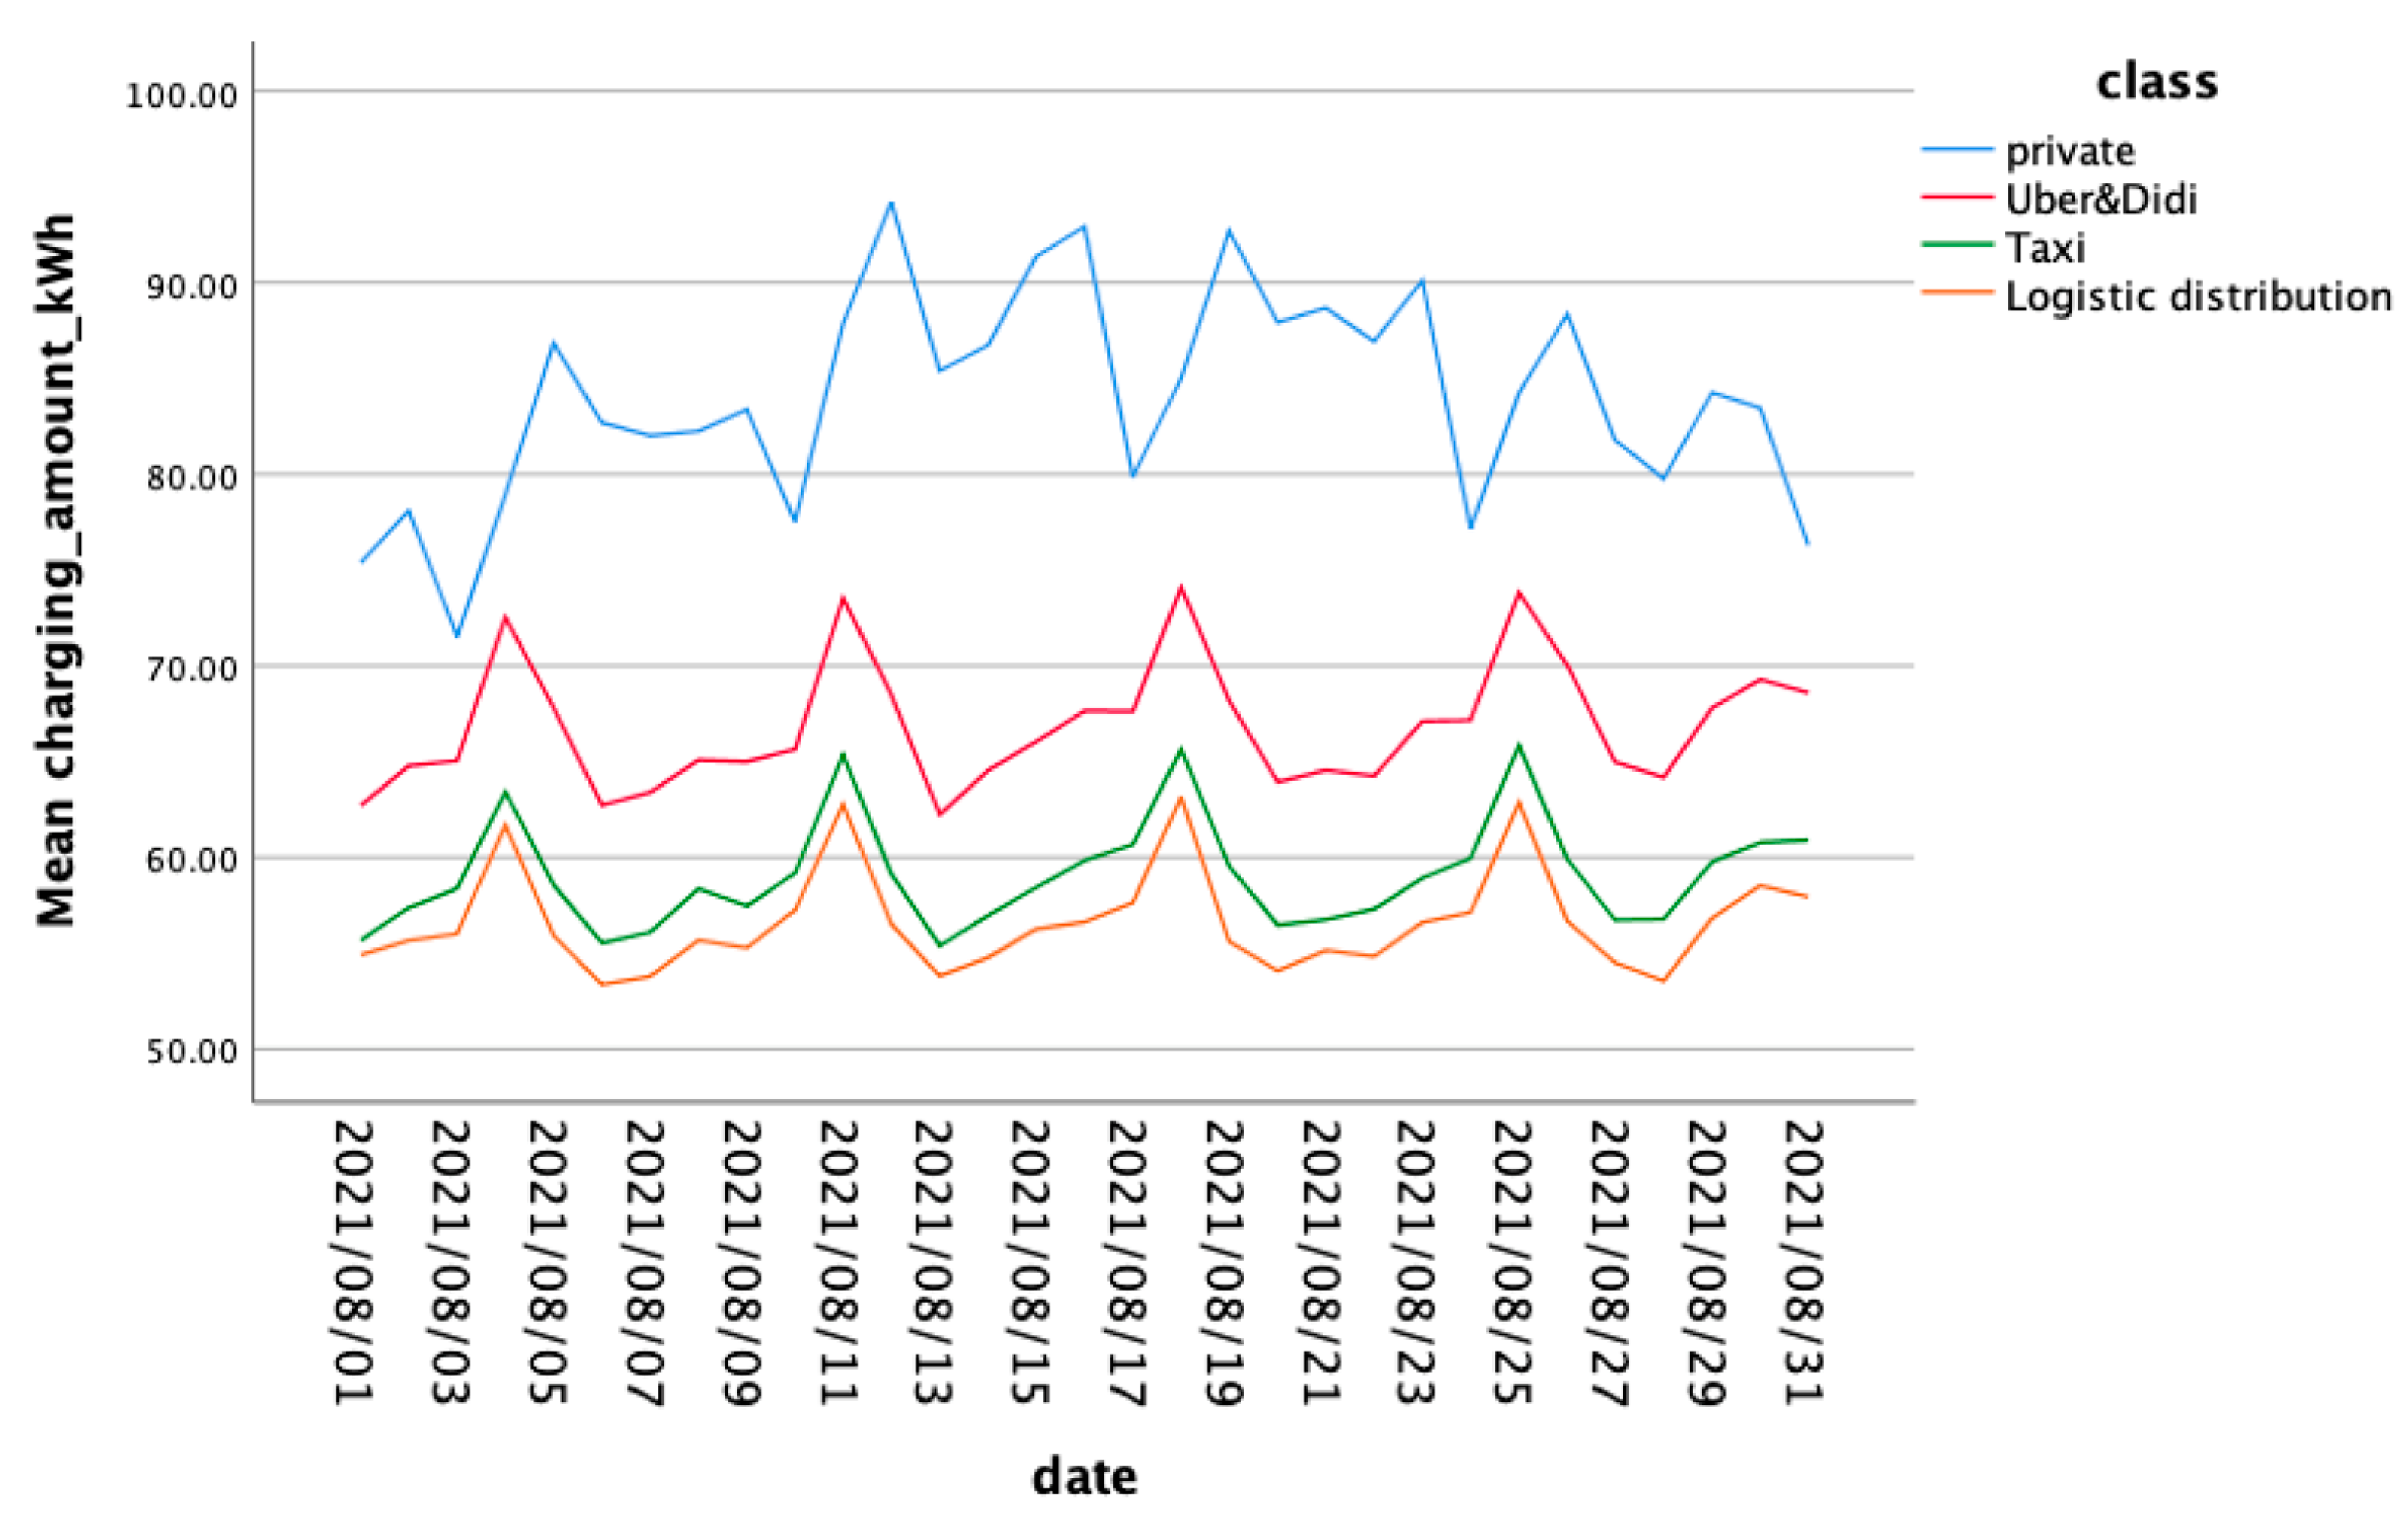
4.2. Research Charging Behavior of Passenger Operating EV
4.3. Research Charging Behavior of Logistics Distribution EV
5. Conclusions and Limitations
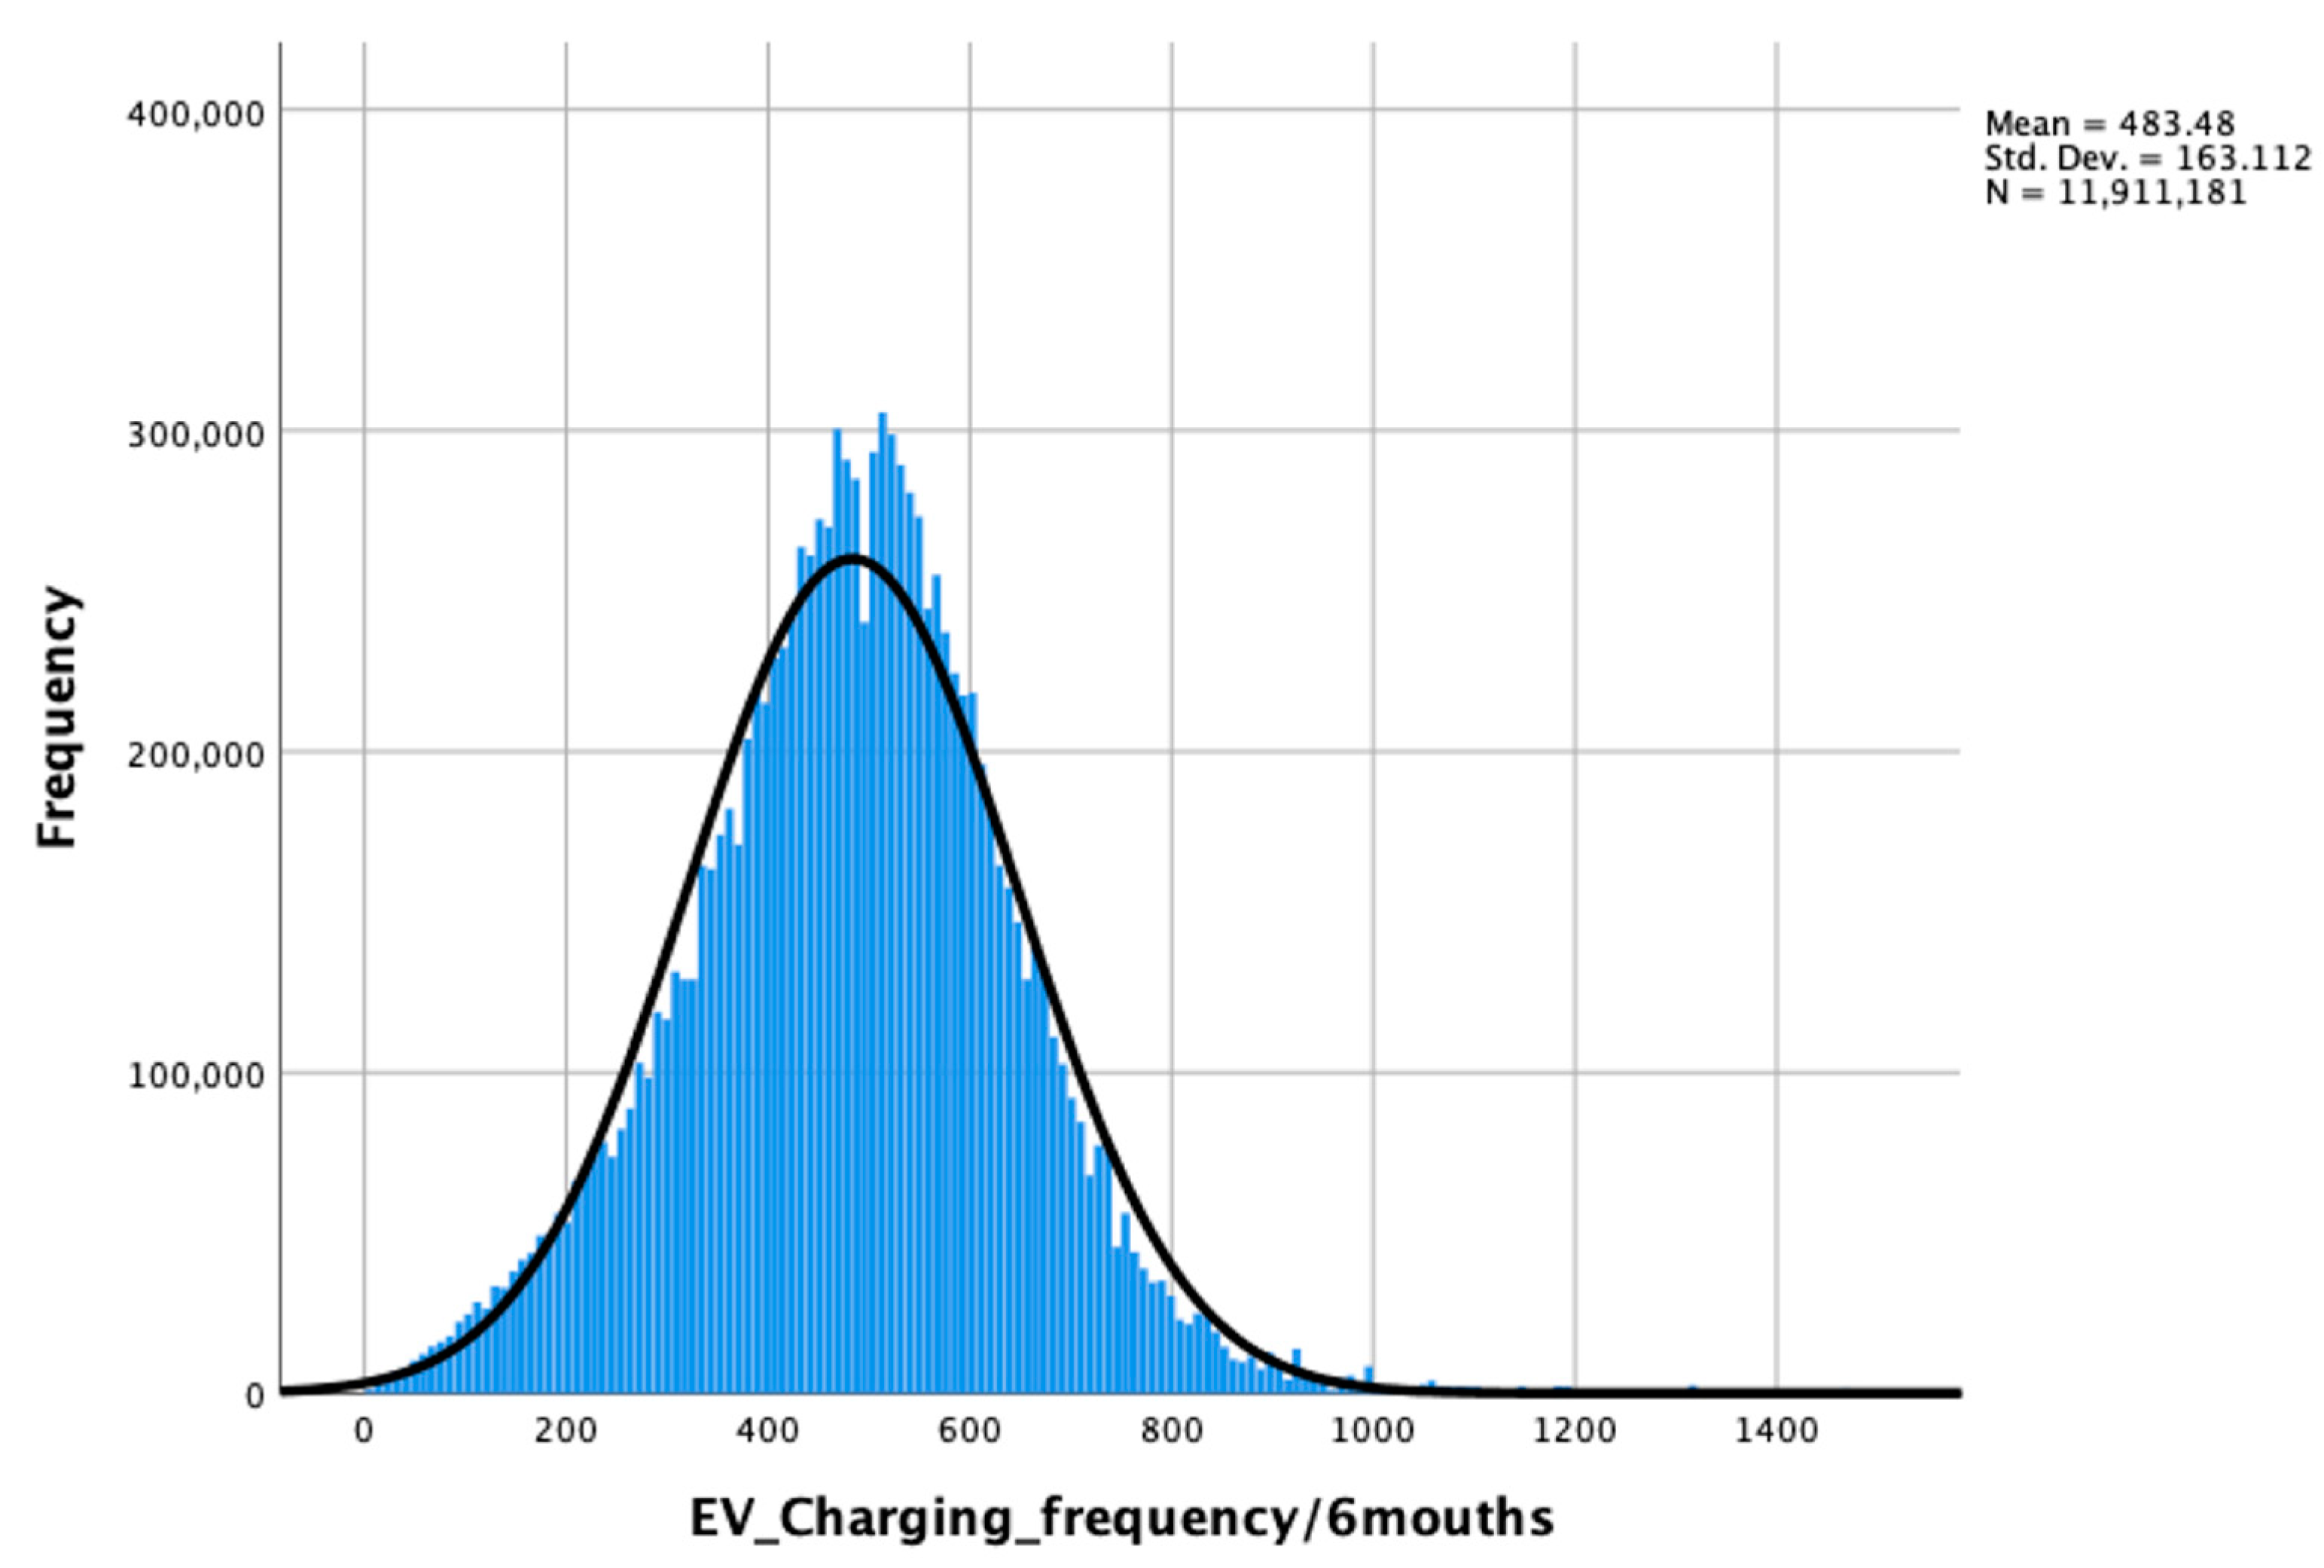
- (1)
- The charging behavior of a private EV was analyzed using the frequency density method, utilizing 5gRTS-ET data. This approach considered charging time as a primary factor.
- (2)
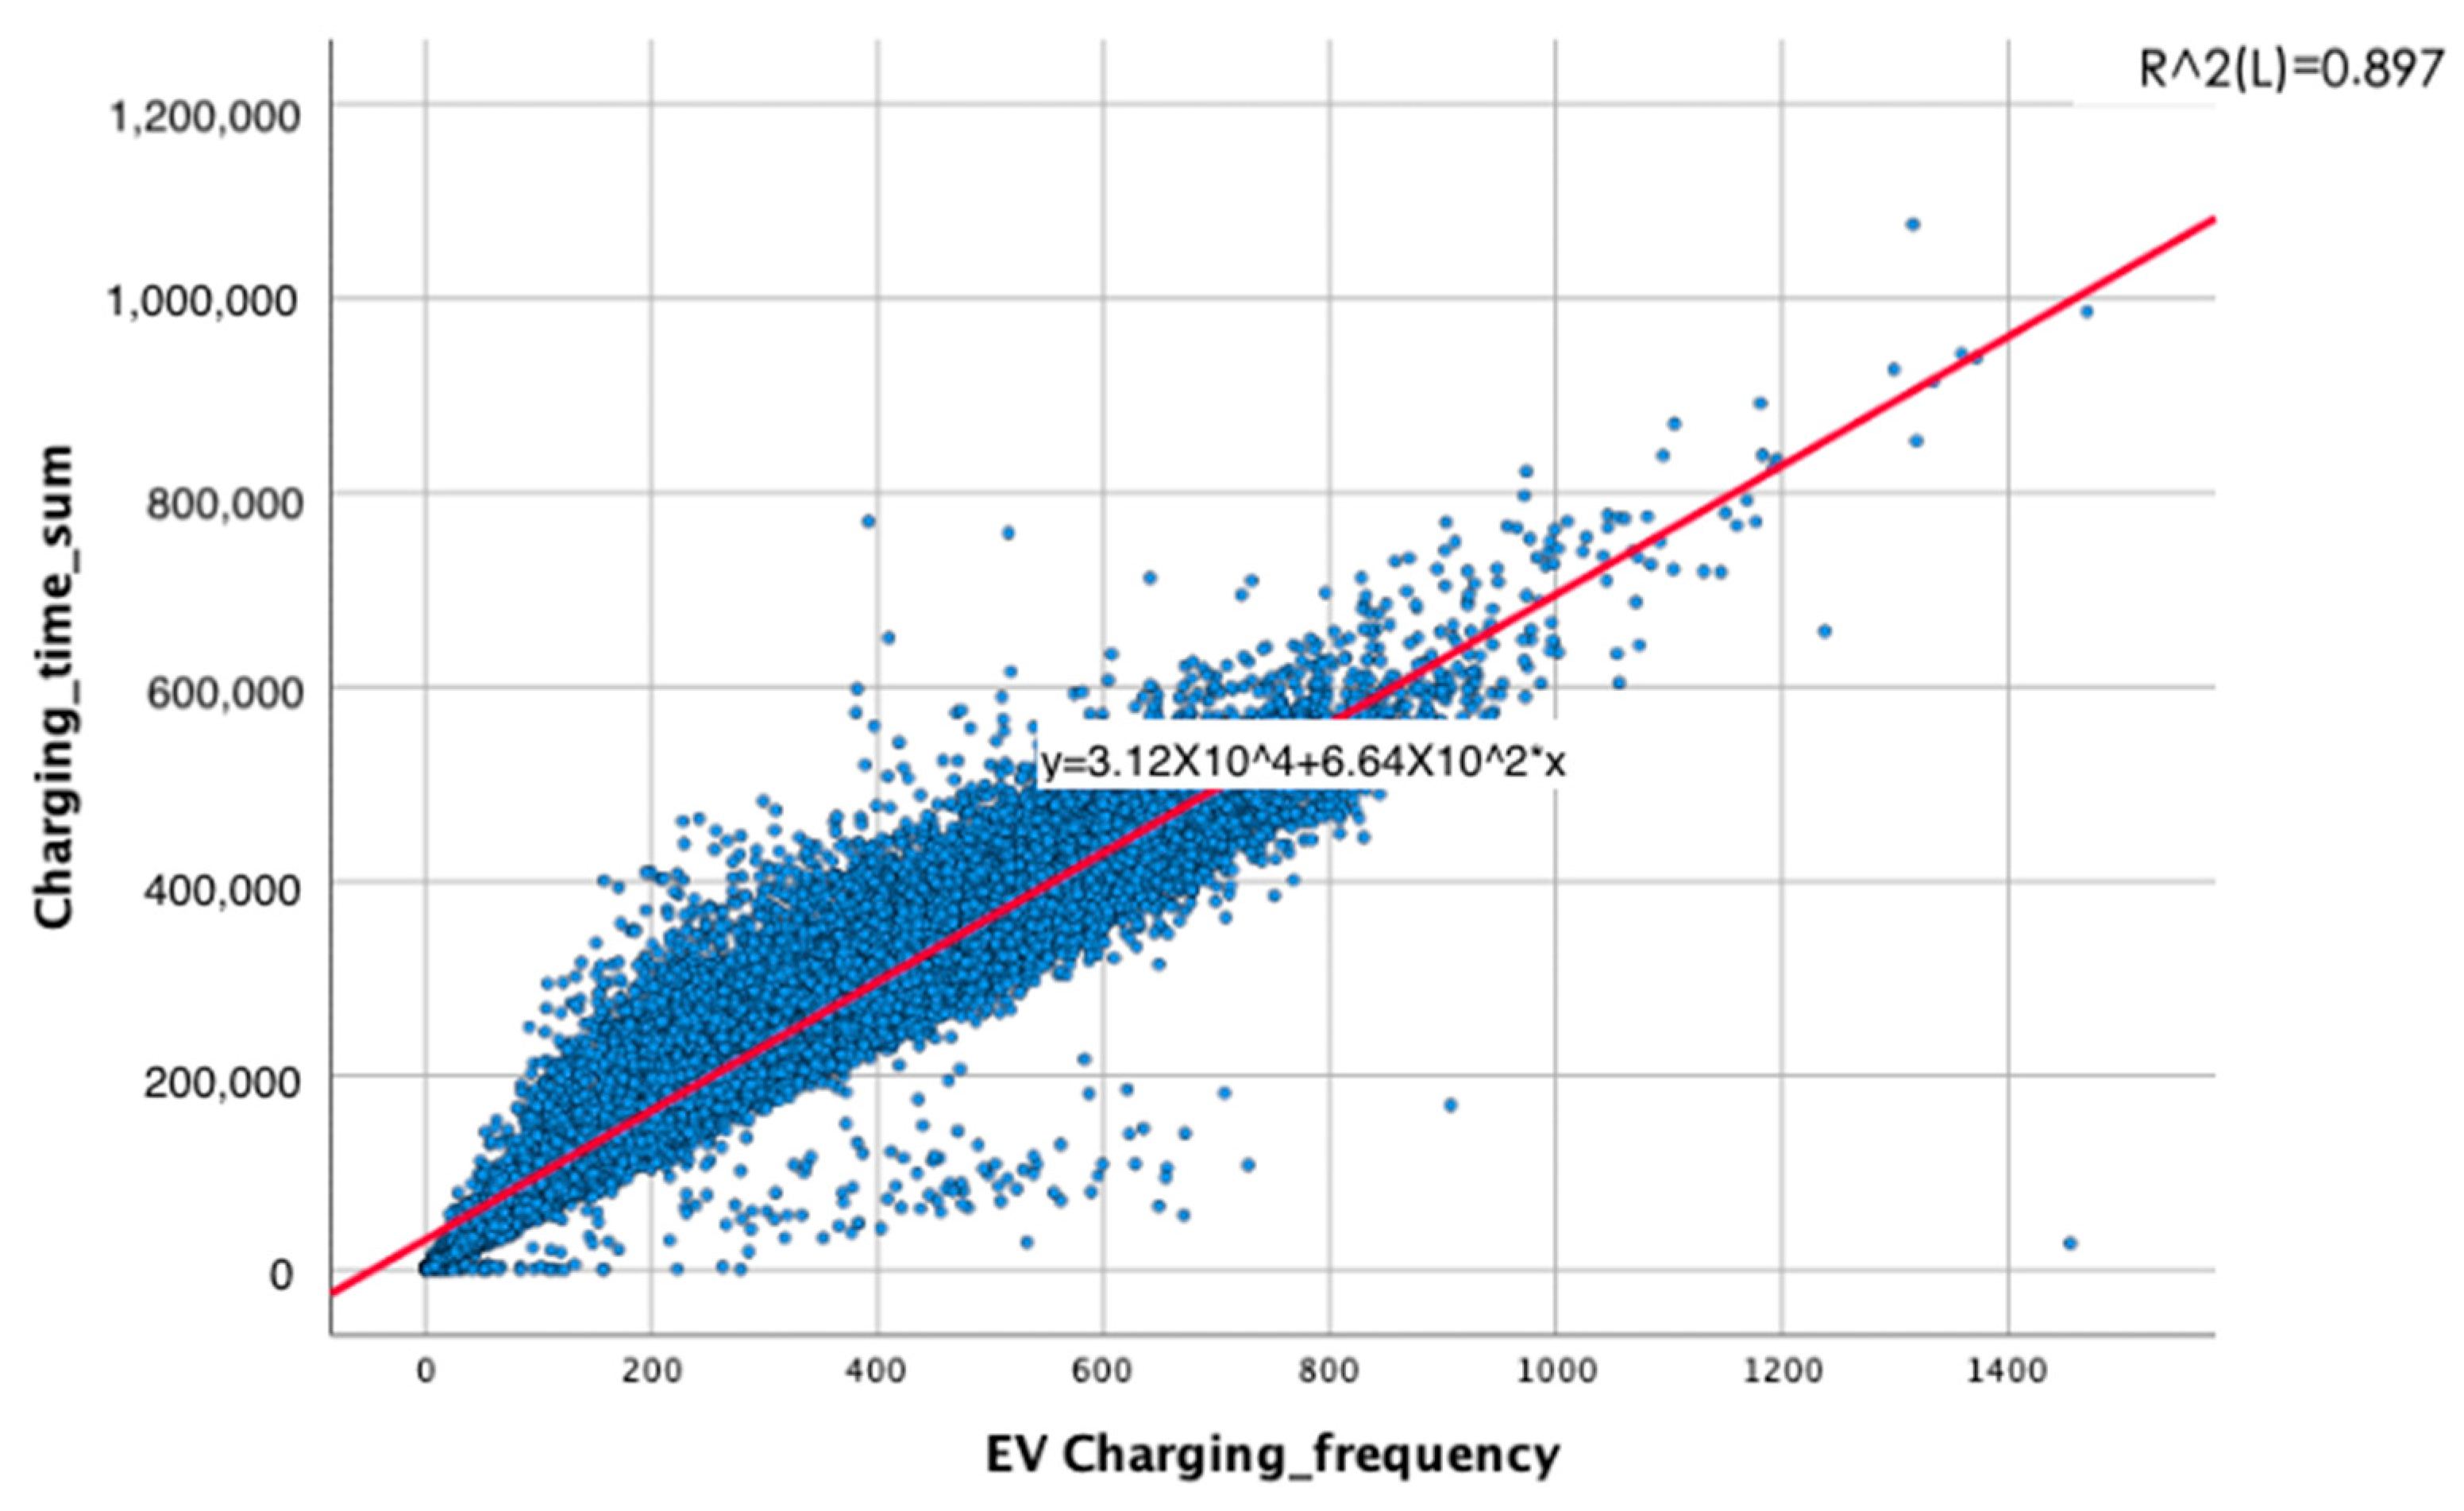
- The mathematical model was developed using nonlinear regression, discrete selection theory, and constraint analysis. The validity of the data was tested using K–S. Subsequently, the charging behavior of the passenger operating EV mode with a preference for charging speed was analyzed and addressed.
- (3)
- This study utilizes numerical modeling, numerical analysis methods, and constraint analysis to construct a model for analyzing and addressing the charging behavior in the logistics distribution EV mode, considering charging price preferences.
- (1)
- The model formulated in this study for the charging behavior of an EV during operation is established using important parameters and variables from the 5gRTS-ET platform. Future research opportunities include the conducting of cluster analysis by integrating subjective behavioral preferences and performing adjustment analysis of the charging behavior model by incorporating urban traffic information variables.
- (2)
- With the advancement and increasing economic viability of vehicle-to-grid (V2G) technology, its adoption is expected to grow [43]. Consequently, the focus for future research will be on establishing real-time interaction systems aligning 5G connectivity among vehicles, charging stations, power grid, and transportation networks, alongside an examination of the site selection and business models for new charging stations incorporating updated technologies like V2G.
Author Contributions
Funding
Institutional Review Board Statement
Informed Consent Statement
Data Availability Statement
Conflicts of Interest
References
- Pan, A.; Zhao, T.; Yu, H.; Zhang, Y. Deploying Public Charging Stations for Electric Taxis: A Charging Demand Simulation Embedded Approach. IEEE Access 2019, 7, 17412–17424. [Google Scholar] [CrossRef]
- Jordan, S.; Newport, D.; Sandland, S.; Vandergert, P. Impact of Public Charging Infrastructure on the Adoption of Electric Vehicles in London. In Sustainable Ecological Engineering Design; Springer International Publishing: Cham, Switzerland, 2020; pp. 327–333. [Google Scholar] [CrossRef]
- Wu, W.; Zhang, Y.; Chun, D.; Song, Y.; Qing, L.; Chen, Y.; Li, P. Research on the Operation Modes of Electric Vehicles in Association with a 5G Real-Time System of Electric Vehicle and Traffic. Energies 2022, 15, 4316. [Google Scholar] [CrossRef]
- Qiu, J. What Does Uber Bring for Consumers? Data Sci. Manag. 2021, 2, 20–27. [Google Scholar] [CrossRef]
- Shen, H.; Zou, B.; Lin, J.; Liu, P. Modeling Travel Mode Choice of Young People with Differentiated E-Hailing Ride Services in Nanjing China. Transp. Res. Part D Transp. Environ. 2020, 78, 102216. [Google Scholar] [CrossRef]
- Ullah, I.; Safdar, M.; Zheng, J.; Severino, A.; Jamal, A. Employing Bibliometric Analysis to Identify the Current State of the Art and Future Prospects of Electric Vehicles. Energies 2023, 16, 2344. [Google Scholar] [CrossRef]
- Lee, J.H.; Chakraborty, D.; Hardman, S.J.; Tal, G. Exploring Electric Vehicle Charging Patterns: Mixed Usage of Charging Infrastructure. Transp. Res. Part D Transp. Environ. 2020, 79, 102249. [Google Scholar] [CrossRef]
- Bi, R.; Xiao, J.; Viswanathan, V.; Knoll, A. Influence of Charging Behaviour given Charging Infrastructure Specification: A Case Study of Singapore. J. Comput. Sci. 2017, 20, 118–128. [Google Scholar] [CrossRef]
- Kim, S.; Yang, D.; Rasouli, S.; Timmermans, H. Heterogeneous Hazard Model of PEV Users Charging Intervals: Analysis of Four Year Charging Transactions Data. Transp. Res. Part C Emerg. Technol. 2017, 82, 248–260. [Google Scholar] [CrossRef]
- Chakraborty, D.; Bunch, D.S.; Lee, J.H.; Tal, G. Demand Drivers for Charging Infrastructure-Charging Behavior of Plug-in Electric Vehicle Commuters. Transp. Res. Part D Transp. Environ. 2019, 76, 255–272. [Google Scholar] [CrossRef]
- Schmidt, M.; Staudt, P.; Weinhardt, C. Evaluating the Importance and Impact of User Behavior on Public Destination Charging of Electric Vehicles. Appl. Energy 2020, 258, 114061. [Google Scholar] [CrossRef]
- Monios, J.; Bergqvist, R. Logistics and the Networked Society: A Conceptual Framework for Smart Network Business Models Using Electric Autonomous Vehicles (EAVs). Technol. Forecast. Soc. Change 2020, 151, 119824. [Google Scholar] [CrossRef]
- Sadeghianpourhamami, N.; Refa, N.; Strobbe, M.; Develder, C. Quantitive Analysis of Electric Vehicle Flexibility: A Data-Driven Approach. Int. J. Electr. Power Energy Syst. 2018, 95, 451–462. [Google Scholar] [CrossRef]
- Yang, D.; Sarma, N.J.S.; Hyland, M.F.; Jayakrishnan, R. Dynamic Modeling and Real-Time Management of a System of EV Fast-Charging Stations. Transp. Res. Part C Emerg. Technol. 2021, 128, 103186. [Google Scholar] [CrossRef]
- Kang, J.; Kong, H.; Lin, Z.; Dang, A. Mapping the Dynamics of Electric Vehicle Charging Demand within Beijing’s Spatial Structure. Sustain. City Soc. 2022, 76, 103507. [Google Scholar] [CrossRef]
- Zhang, Z.; Chen, Z.; Xing, Q.; Ji, Z.; Zhang, T. Evaluation of the Multi-Dimensional Growth Potential of China’s Public Charging Facilities for Electric Vehicles through 2030. Util. Policy 2022, 75, 101344. [Google Scholar] [CrossRef]
- Bayram, I.S.; Ismail, M.; Abdallah, M.; Qaraqe, K.; Serpedin, E. A Pricing-Based Load Shifting Framework for EV Fast Charging Stations. In Proceedings of the 2014 IEEE International Conference on Smart Grid Communications (SmartGridComm), Venice, Italy, 3–6 November 2014; IEEE: Piscataway, NJ, USA, 2014. [Google Scholar] [CrossRef]
- Wolbertus, R.; Gerzon, B. Improving Electric Vehicle Charging Station Efficiency through Pricing. J. Adv. Transp. 2018, 2018, 4831951. [Google Scholar] [CrossRef]
- Sun, X.-H.; Yamamoto, T.; Morikawa, T. Charge Timing Choice Behavior of Battery Electric Vehicle Users. Transp. Res. Part D Transp. Environ. 2015, 37, 97–107. [Google Scholar] [CrossRef]
- Luo, C.; Huang, Y.-F.; Gupta, V. Stochastic Dynamic Pricing for EV Charging Stations with Renewable Integration and Energy Storage. IEEE Trans. Smart Grid 2018, 9, 1494–1505. [Google Scholar] [CrossRef]
- Helmus, J.R.; Lees, M.H.; van den Hoed, R. A Data Driven Typology of Electric Vehicle User Types and Charging Sessions. Transp. Res. Part C Emerg. Technol. 2020, 115, 102637. [Google Scholar] [CrossRef]
- Wolbertus, R.; van den Hoed, R.; Kroesen, M.; Chorus, C. Charging Infrastructure Roll-out Strategies for Large Scale Introduction of Electric Vehicles in Urban Areas: An Agent-Based Simulation Study. Transp. Res. Part Policy Pract. 2021, 148, 262–285. [Google Scholar] [CrossRef]
- Yang, Y.; Yao, E.; Yang, Z.; Zhang, R. Modeling the Charging and Route Choice Behavior of BEV Drivers. Transp. Res. Part C Emerg. Technol. 2016, 65, 190–204. [Google Scholar] [CrossRef]
- Li, Z.; Alsabbagh, A.; Meng, Y.; Ma, C. User Behavior-Based Spatial Charging Coordination of EV Fleet. In Proceedings of the IECON 2020 The 46th Annual Conference of the IEEE Industrial Electronics Society, Singapore, 18–21 October 2020; IEEE: Piscataway, NJ, USA, 2020. [Google Scholar] [CrossRef]
- Helmus, J.; van den Hoed, R. Unraveling User Type Characteristics: Towards a Taxonomy for Charging Infrastructure. WEVJ 2015, 7, 589–604. [Google Scholar] [CrossRef]
- Namdeo, A.; Tiwary, A.; Dziurla, R. Spatial Planning of Public Charging Points Using Multi-Dimensional Analysis of Early Adopters of Electric Vehicles for a City Region. Technol. Forecast. Soc. Change 2014, 89, 188–200. [Google Scholar] [CrossRef]
- Morrissey, P.; Weldon, P.; O’Mahony, M. Future Standard and Fast Charging Infrastructure Planning: An Analysis of Electric Vehicle Charging Behaviour. Energy Policy 2016, 89, 257–270. [Google Scholar] [CrossRef]
- Wolbertus, R.; Kroesen, M.; van den Hoed, R.; Chorus, C. Fully Charged: An Empirical Study into the Factors That Influence Connection Times at EV-Charging Stations. Energy Policy 2018, 123, 1–7. [Google Scholar] [CrossRef]
- Pan, L.; Yao, E.; Yang, Y.; Zhang, R. A Location Model for Electric Vehicle (EV) Public Charging Stations Based on Drivers’ Existing Activities. Sustain. City Soc. 2020, 59, 102192. [Google Scholar] [CrossRef]
- Sun, D.; Ou, Q.; Yao, X.; Gao, S.; Wang, Z.; Ma, W.; Li, W. Integrated Human-Machine Intelligence for EV Charging Prediction in 5G Smart Grid. J. Wirel. Com. Netw. 2020, 2020, 139. [Google Scholar] [CrossRef]
- Rao, R.; Cai, H.; Xu, M. Modeling Electric Taxis’ Charging Behavior Using Real-World Data. Int. J. Sustain. Transp. 2018, 12, 452–460. [Google Scholar] [CrossRef]
- Jaiswal, D.; Kaushal, V.; Kant, R.; Kumar Singh, P. Consumer Adoption Intention for Electric Vehicles: Insights and Evidence from Indian Sustainable Transportation. Technol. Forecast. Soc. Change 2021, 173, 121089. [Google Scholar] [CrossRef]
- Daina, N.; Polak, J.W.; Sivakumar, A. Patent and Latent Predictors of Electric Vehicle Charging Behavior. Transp. Res. Rec. 2015, 2502, 116–123. [Google Scholar] [CrossRef]
- Yang, Y.; Tan, Z.; Ren, Y. Research on Factors That Influence the Fast Charging Behavior of Private Battery Electric Vehicles. Sustainability 2020, 12, 3439. [Google Scholar] [CrossRef]
- Patil, P.; Kazemzadeh, K.; Bansal, P. Integration of Charging Behavior into Infrastructure Planning and Management of Electric Vehicles: A Systematic Review and Framework. Sustain. City Soc. 2023, 88, 104265. [Google Scholar] [CrossRef]
- Ullah, I.; Zheng, J.; Jamal, A.; Zahid, M.; Almoshageh, M.; Safdar, M. Electric Vehicles Charging Infrastructure Planning: A Review. Int. J. Green Energy 2023, 21, 1710–1728. [Google Scholar] [CrossRef]
- Jamali Jahromi, A.; Mohammadi, M.; Afrasiabi, S.; Afrasiabi, M.; Aghaei, J. Probability Density Function Forecasting of Residential Electric Vehicles Charging Profile. Appl. Energy 2022, 323, 119616. [Google Scholar] [CrossRef]
- Tianjie, C.; Zegong, Z. A Method Based on the Relation between Frequency and Probability Density Function to Estimate the Values of the Parameters. Reliab. Eng. Syst. Saf. 1990, 29, 241–248. [Google Scholar] [CrossRef]
- Sheng, H.; Xiao, J. Electric Vehicle State of Charge Estimation: Nonlinear Correlation and Fuzzy Support Vector Machine. J. Power Sources 2015, 281, 131–137. [Google Scholar] [CrossRef]
- Yu, H.; MacKenzie, D. Modeling Charging Choices of Small-Battery Plug-In Hybrid Electric Vehicle Drivers by Using Instrumented Vehicle Data. Transp. Res. Rec. 2016, 2572, 56–65. [Google Scholar] [CrossRef]
- Holden, E.; Gilpin, G.; Banister, D. Sustainable Mobility at Thirty. Sustainability 2019, 11, 1965. [Google Scholar] [CrossRef]
- Gibbs, W.; Gawrylewski, A. Autonomy: The Quest to Build the Driverless Car—And How It Will Reshape Our World. Sci. Am. 2018, 319, 100. [Google Scholar]
- Goncearuc, A.; Sapountzoglou, N.; De Cauwer, C.; Coosemans, T.; Messagie, M.; Crispeels, T. An Integrative Approach for Business Modelling: Application to the EV Charging Market. J. Bus. Res. 2022, 143, 184–200. [Google Scholar] [CrossRef]


| Related Parameters | Description | Unit |
|---|---|---|
| EVID | EV Identity | piece |
| Date | Charging service date | yyyy.mm.dd |
| Waiting_time | Wait time before charging | minute |
| Start_time | Charging start time | hh:mm:ss |
| End_time | Charging end time | hh:mm:ss |
| Charging _amount | The amount of charge during a single charge | KWh |
| Charging_fare | Charging paid with a fee | RMB |
| fast_low model | 1 = fast, 2 = low | 1, 2 |
| Related Parameters | Calculation Formula | Description | Unit |
|---|---|---|---|
| Charging_time | Start time—end time | The length of the charging time of the EV | minute |
| Charging_frequency | Count EVID | The number of times the EV is charged in 6 months | times |
| Charging_speed | Charging Amount/charging time * 60 | Average charge for one hour | kw/h |
| Class | 1-private EV | 1–4 |
| EV Operation Model | % of Total | EV Number |
|---|---|---|
| Private | 24.2% | 7816 |
| Uber and Didi | 34.9% | 11,256 |
| Taxi | 36.5% | 11,762 |
| Logistic distribution | 4.4% | 1425 |
| Total | 100.0% | 32,259 |
| Variable | Date | Start_ Time | Charging_ Time | Charging_ Fare | Charging_ Frequency | Charging_ Amount |
|---|---|---|---|---|---|---|
| Date | 1 | 0.007 ** | 0.000 | 0.006 ** | −0.013 ** | 0.011 ** |
| Start_ time | 1 | 0.020 ** | −0.010 ** | 0.017 ** | −0.033 ** | |
| Charging_ time | 1 | 0.813 ** | −0.085 ** | 0.743 ** | ||
| Charging_fare | 1 | −0.090 ** | 0.892 ** | |||
| Charging_ frequency | 1 | −0.090 ** | ||||
| Charging_ amount | 1 |
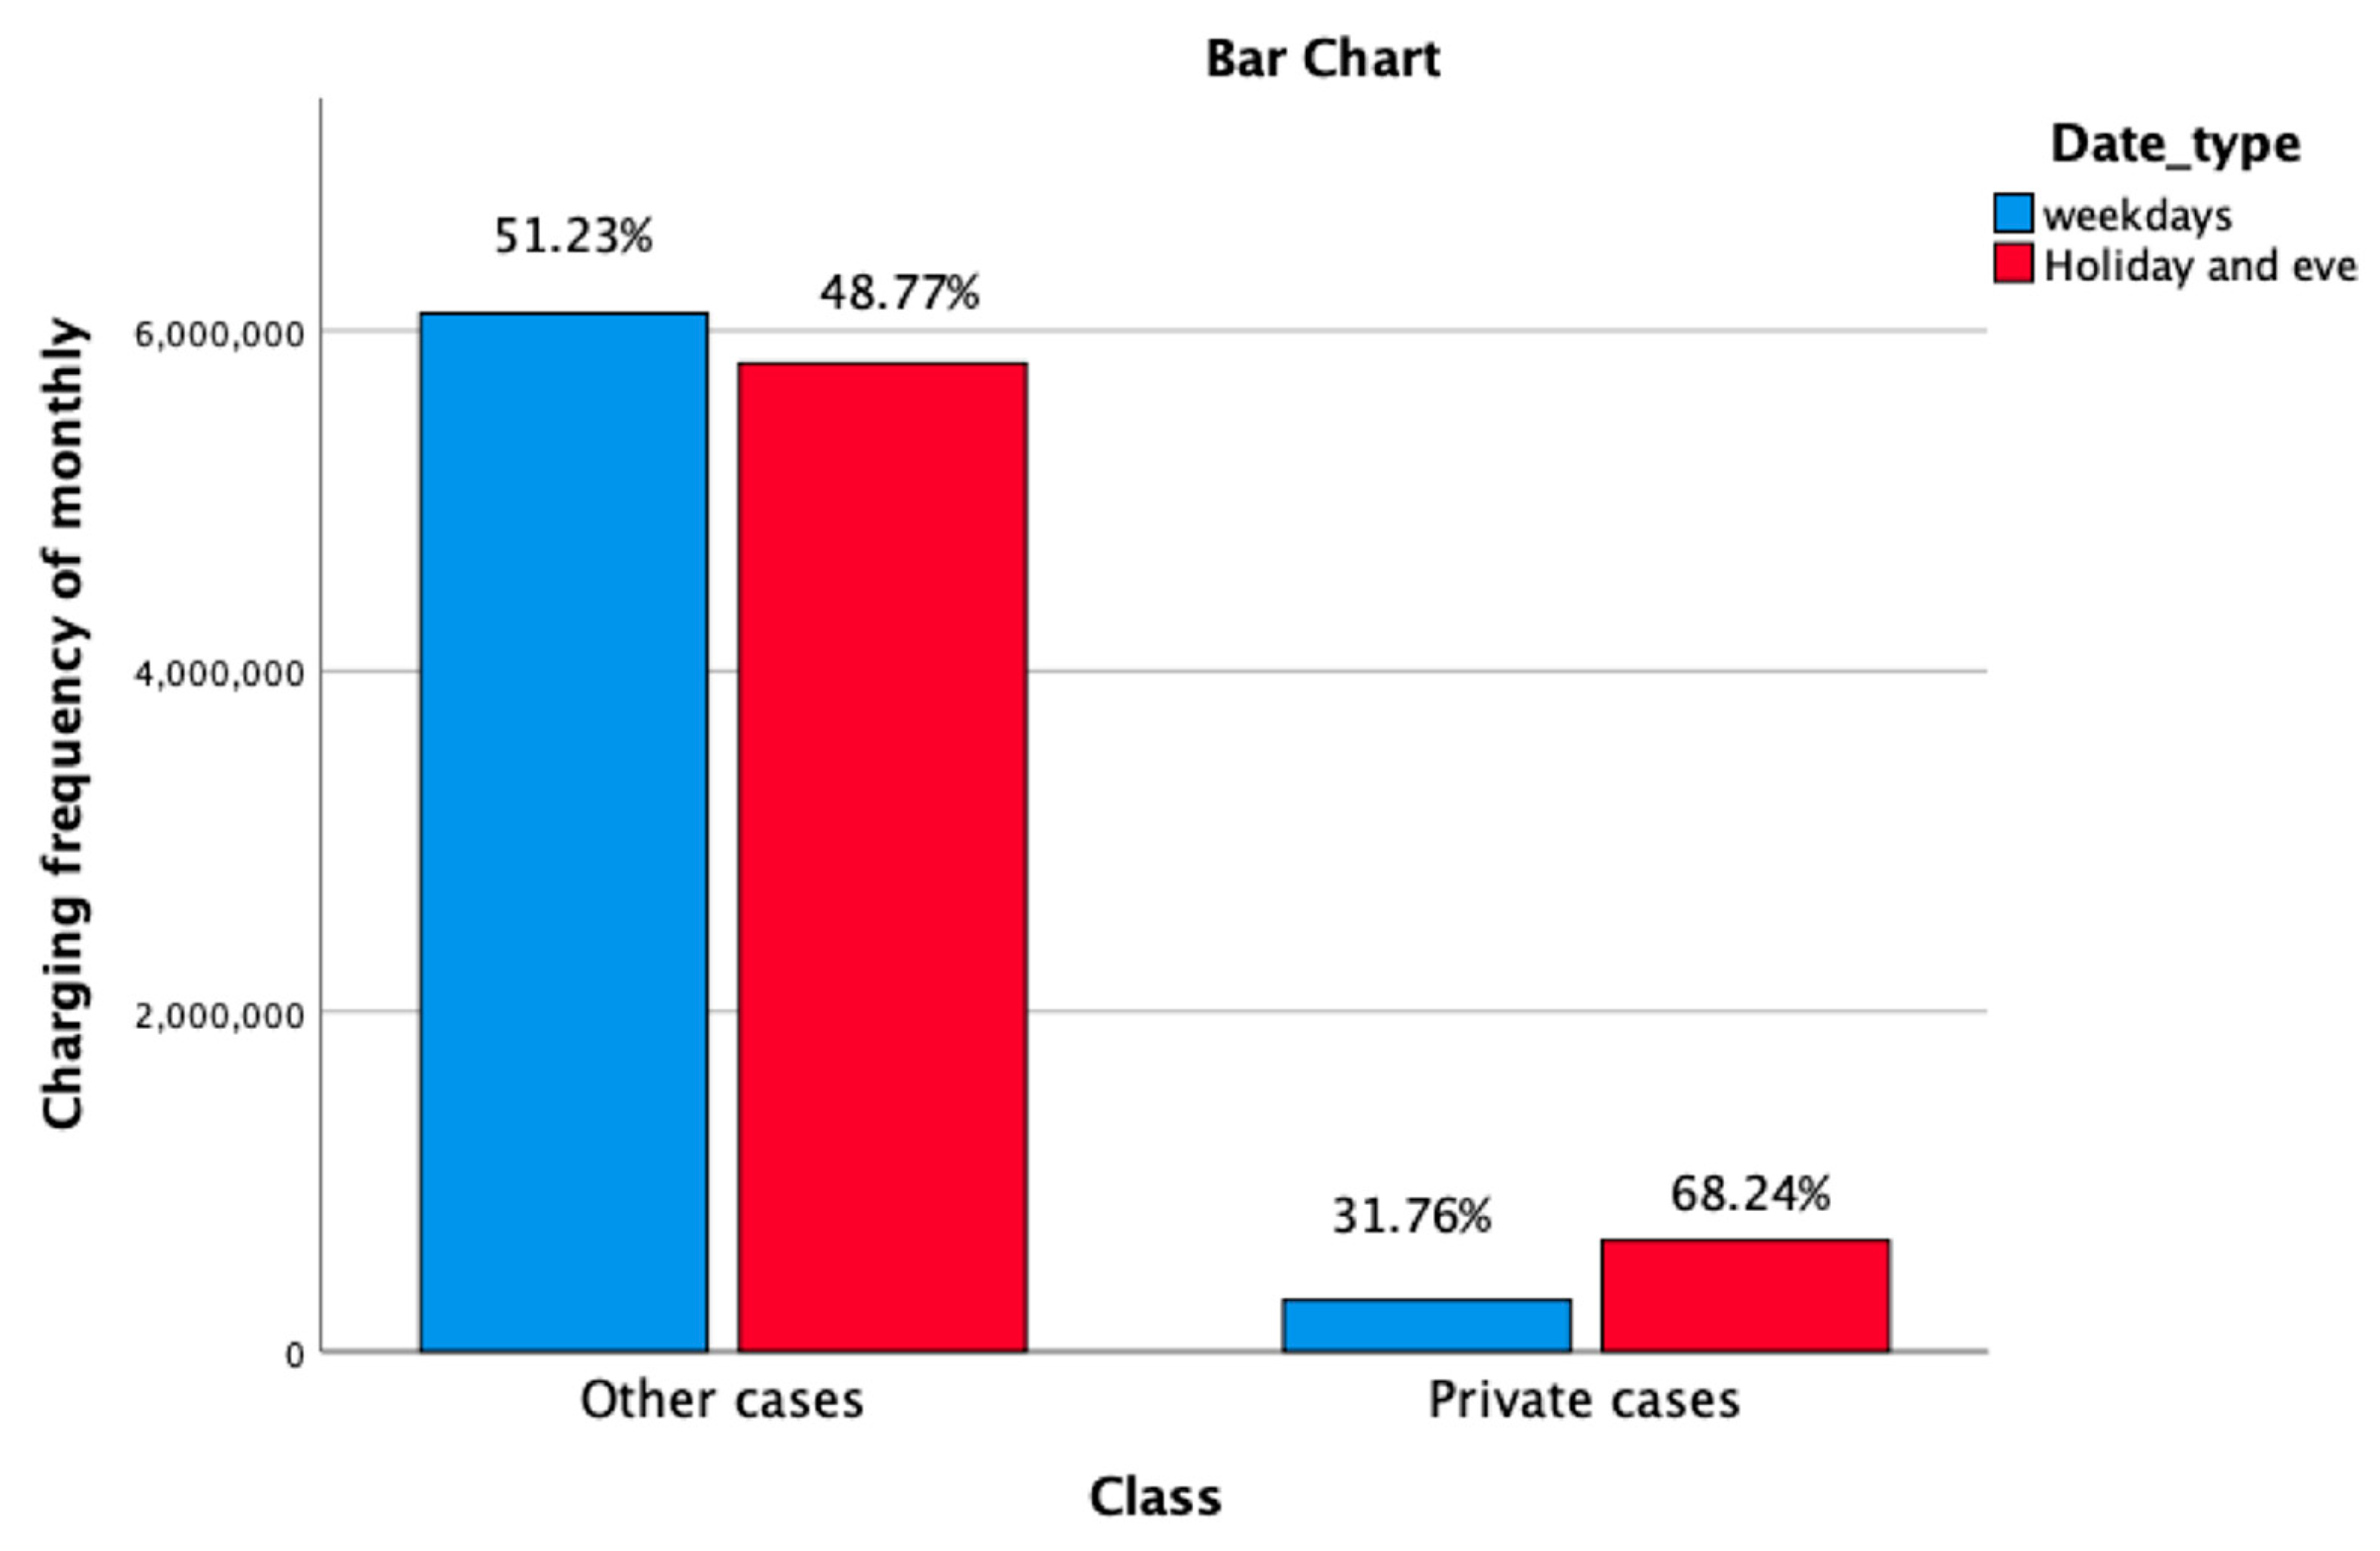
| Date Type | Total | Holiday and Day before Holiday of Total % | |||
|---|---|---|---|---|---|
| Weekdays | Holiday and Eve | ||||
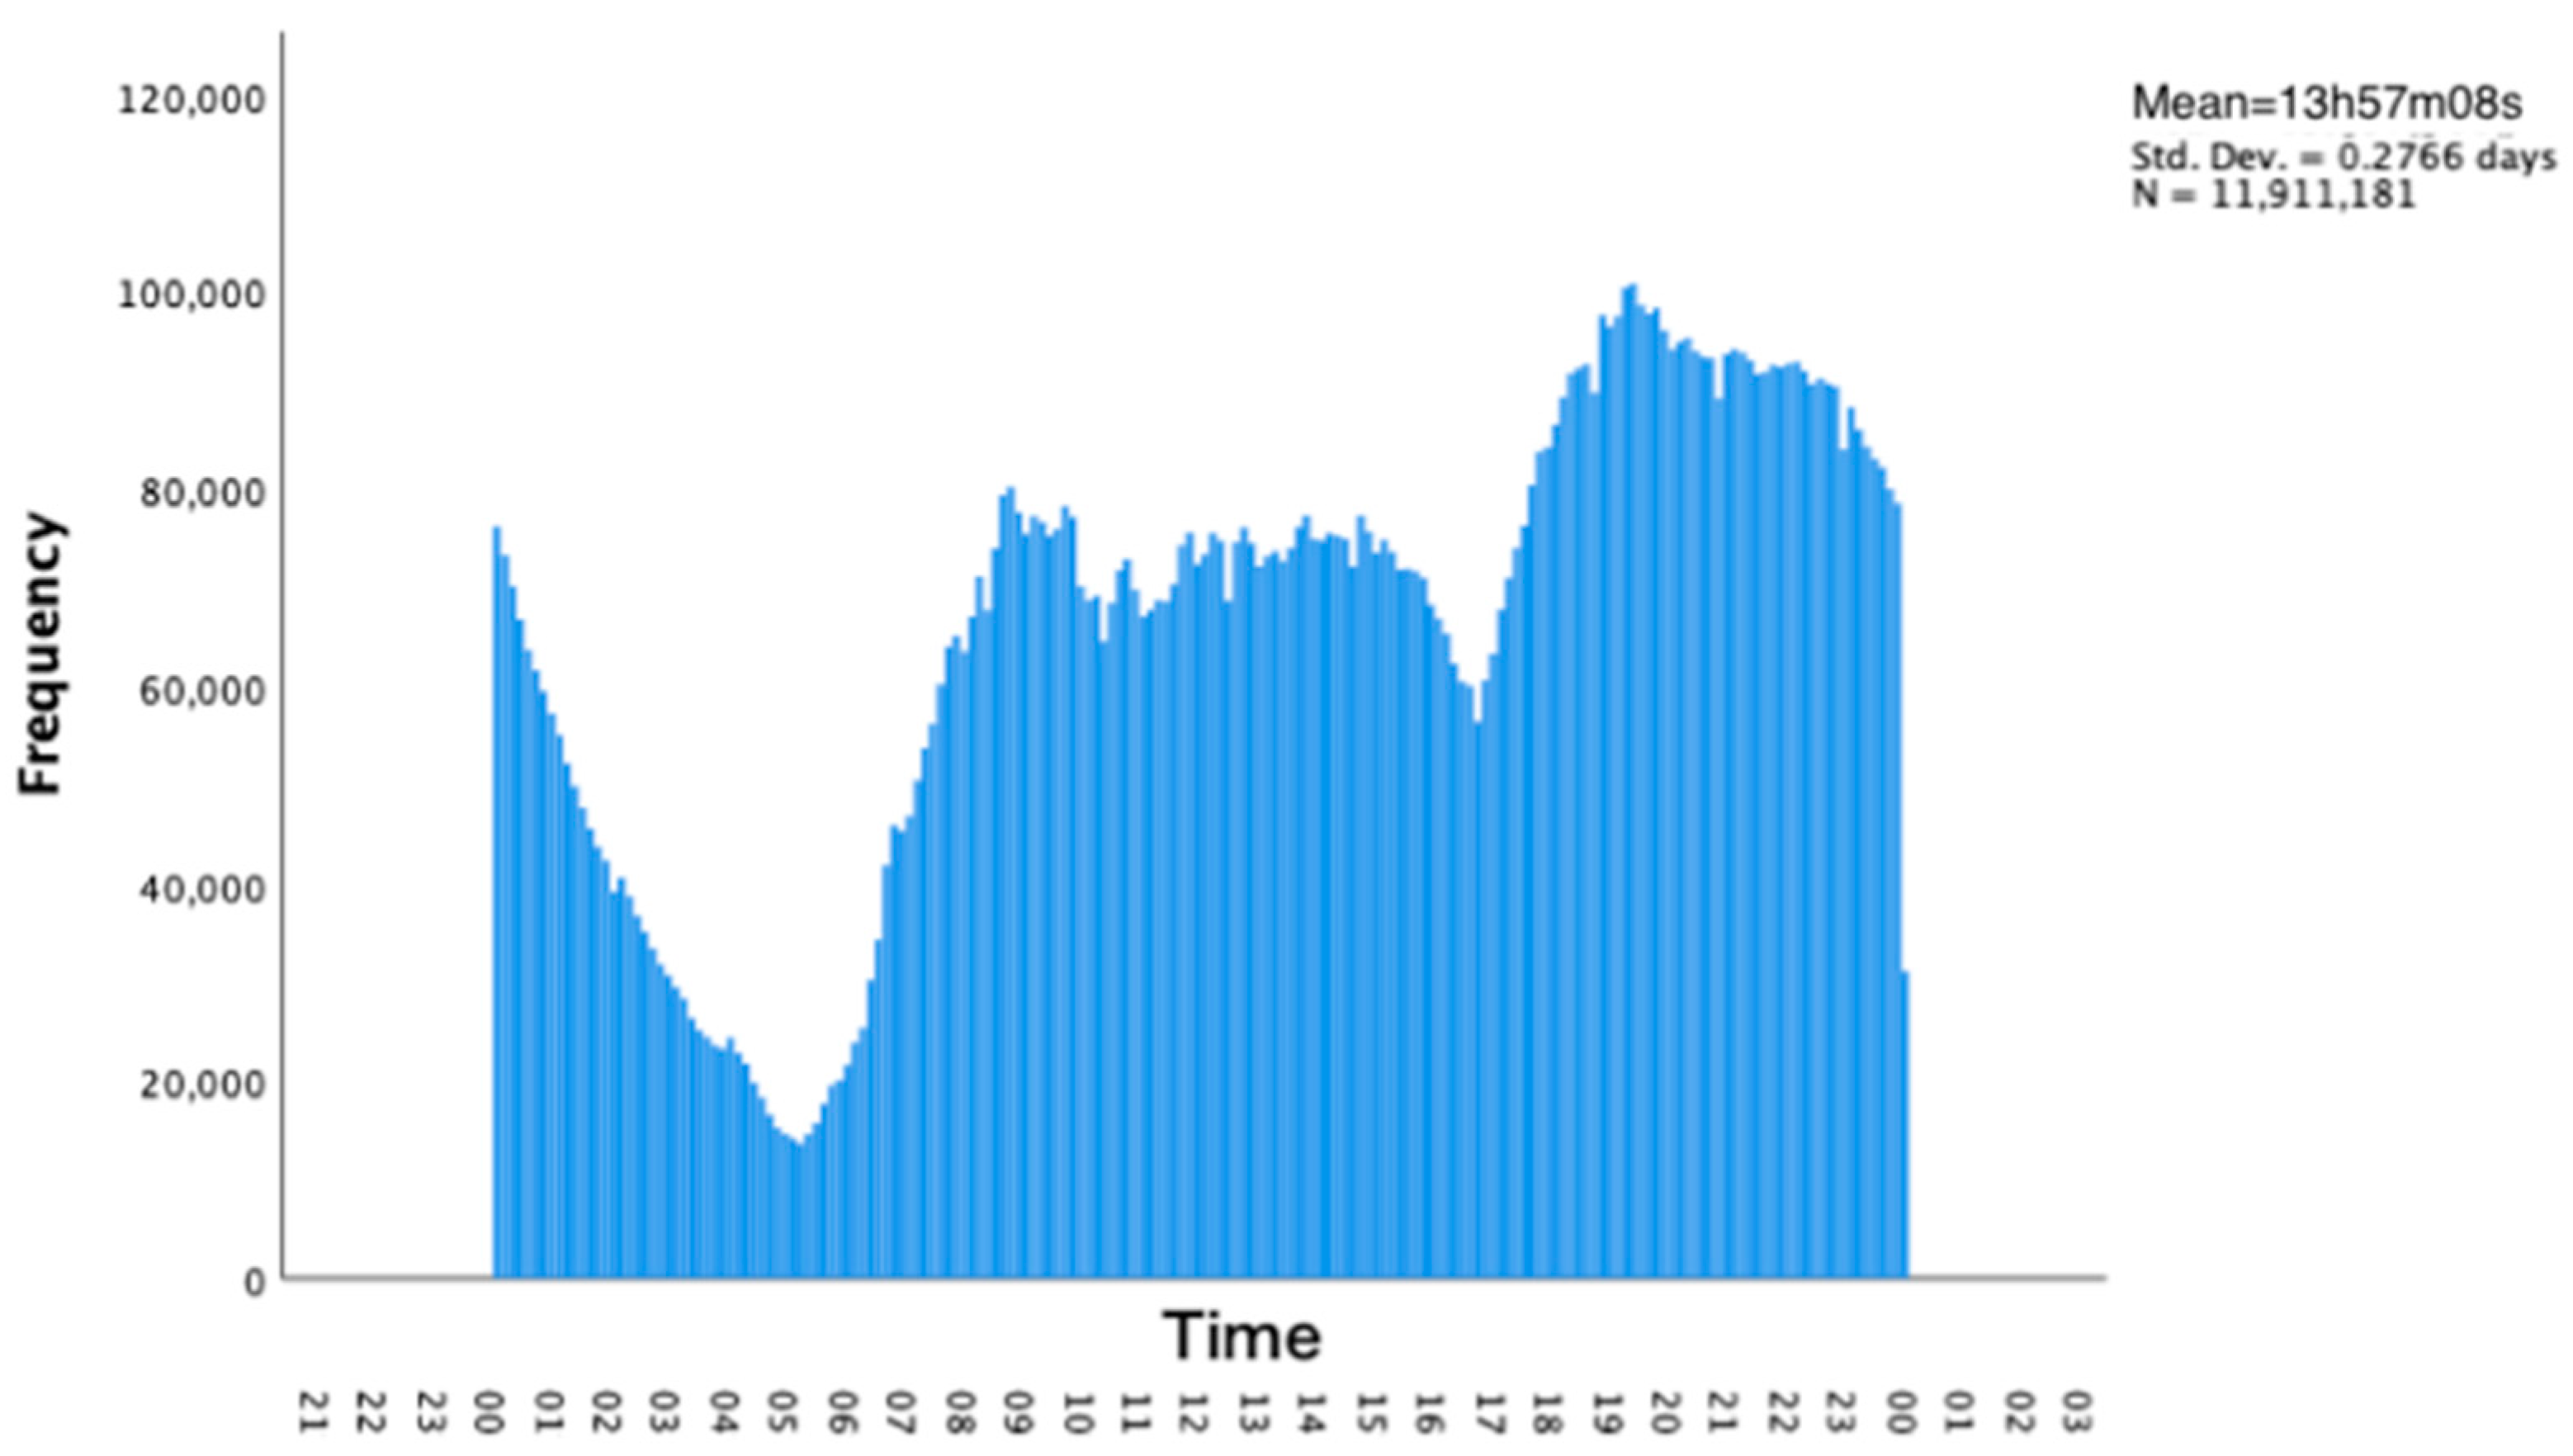
| Group | Other cases | 6,102,083 | 5,809,098 | 11,911,181 | 48.77% |
| Private cases | 304,114 | 653,278 | 957,392 | 68.24% | |
| Total | 6,406,197 | 6,462,376 | 12,868,573 | ||
| Value | df | Asymptotic Significance (2-Sided) | Exact Sig. (2-Sided) | Exact Sig. (1-Sided) | |
|---|---|---|---|---|---|
| Pearson chi-square | 134,305.252 a | 1 | 0.000 | ||
| Continuity Correction b | 134,304.473 | 1 | 0.000 | ||
| Likelihood ratio | 137,288.194 | 1 | 0.000 | ||
| Fisher’s exact test | 0.000 | 0.000 | |||
| Linear-by-linear Association | 134,305.241 | 1 | 0.000 | ||
| N of valid Cases | 12,868,573 |
| One-Sample Kolmogorov–Smirnov Test | |||
|---|---|---|---|
| Project | All Data | Passenger Operating EV Data | |
| N | 984 | 441 | |
| Normal parameters a,b | Mean | 25,603.88 | 19,922.88 |
| Std. deviation | 401,340.611 | 4711.837 | |
| Most extreme differences | Absolute | 0.483 | 0.061 |
| Positive | 0.483 | 0.060 | |
| Negative | −0.475 | −0.061 | |
| Test statistic | 0.483 | 0.061 | |
| Asymp. Sig. (2 tailed) | 0.000 c | 0.200 c,d | |
| Charging Time (min) | Charging Time Frequency Sum | % of Total Sum |
|---|---|---|
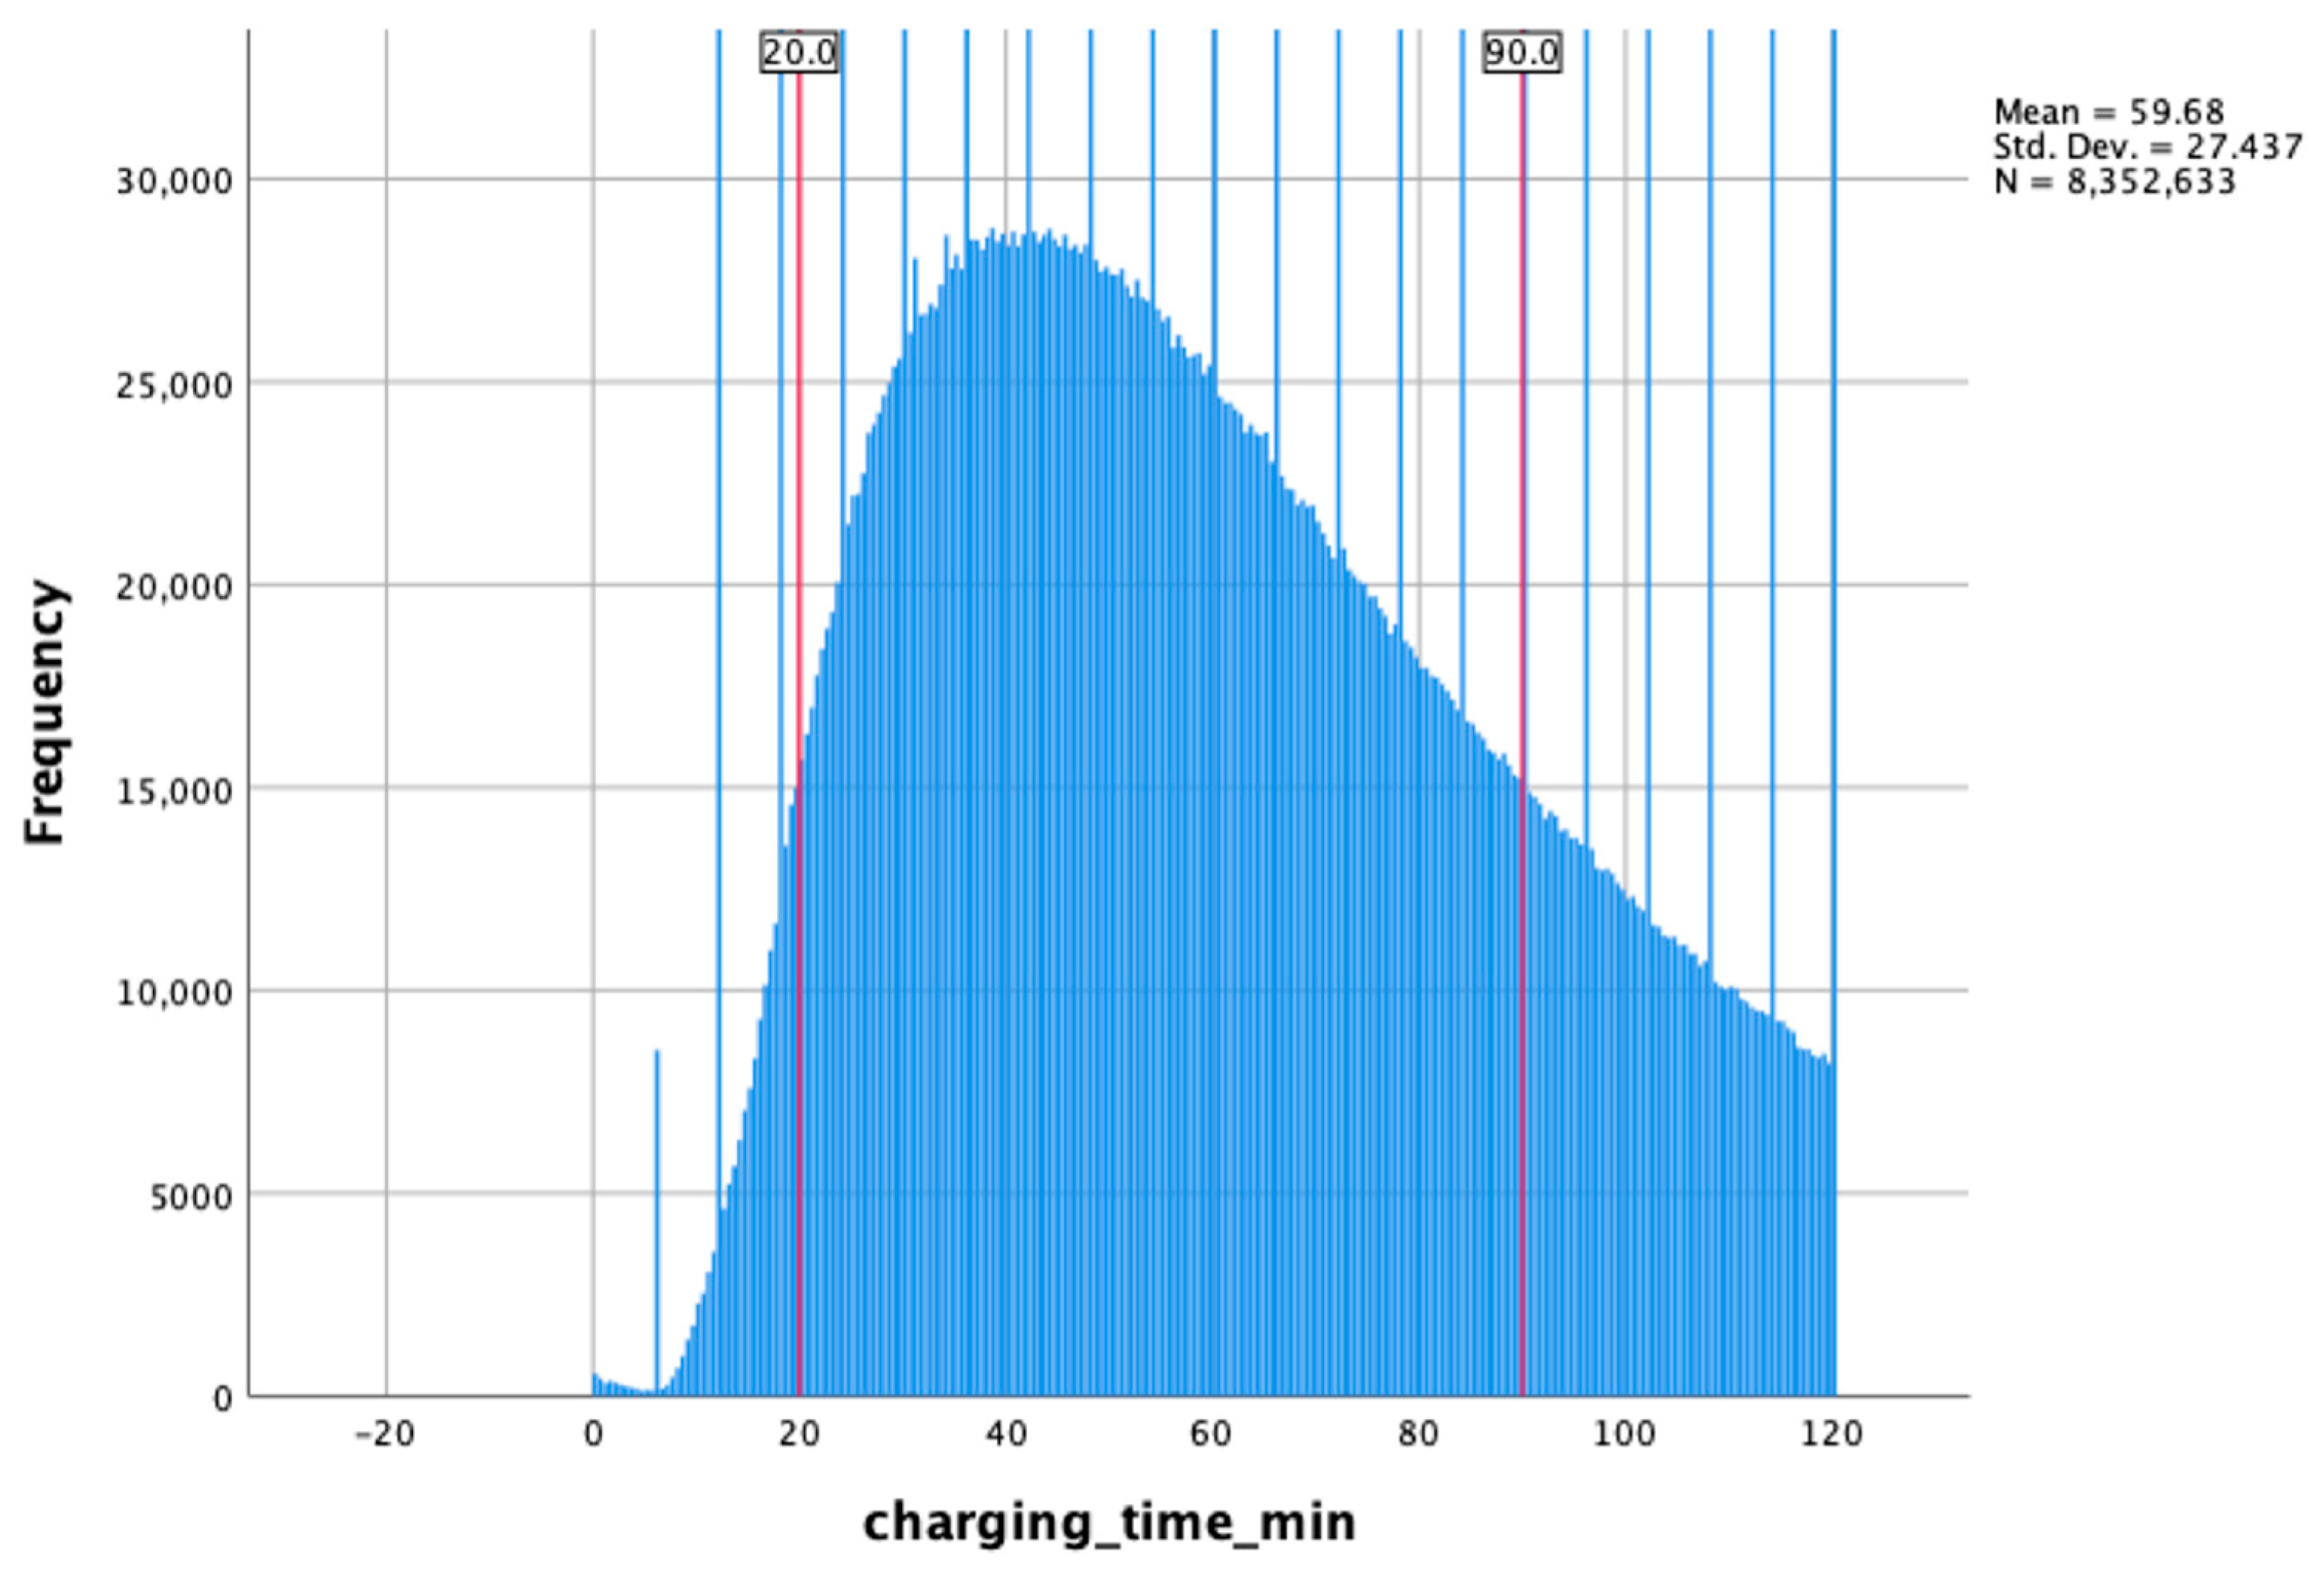
| <20 | 400,127 | 4.8% |
| 20–90 | 6,647,523 | 79.6% |
| >90 | 1,304,983 | 15.6% |
| Total | 8,352,633 | 100.0% |
| Charging Amount (kWh) | Charging Amount Frequency Sum | % of Total Sum |
|---|---|---|
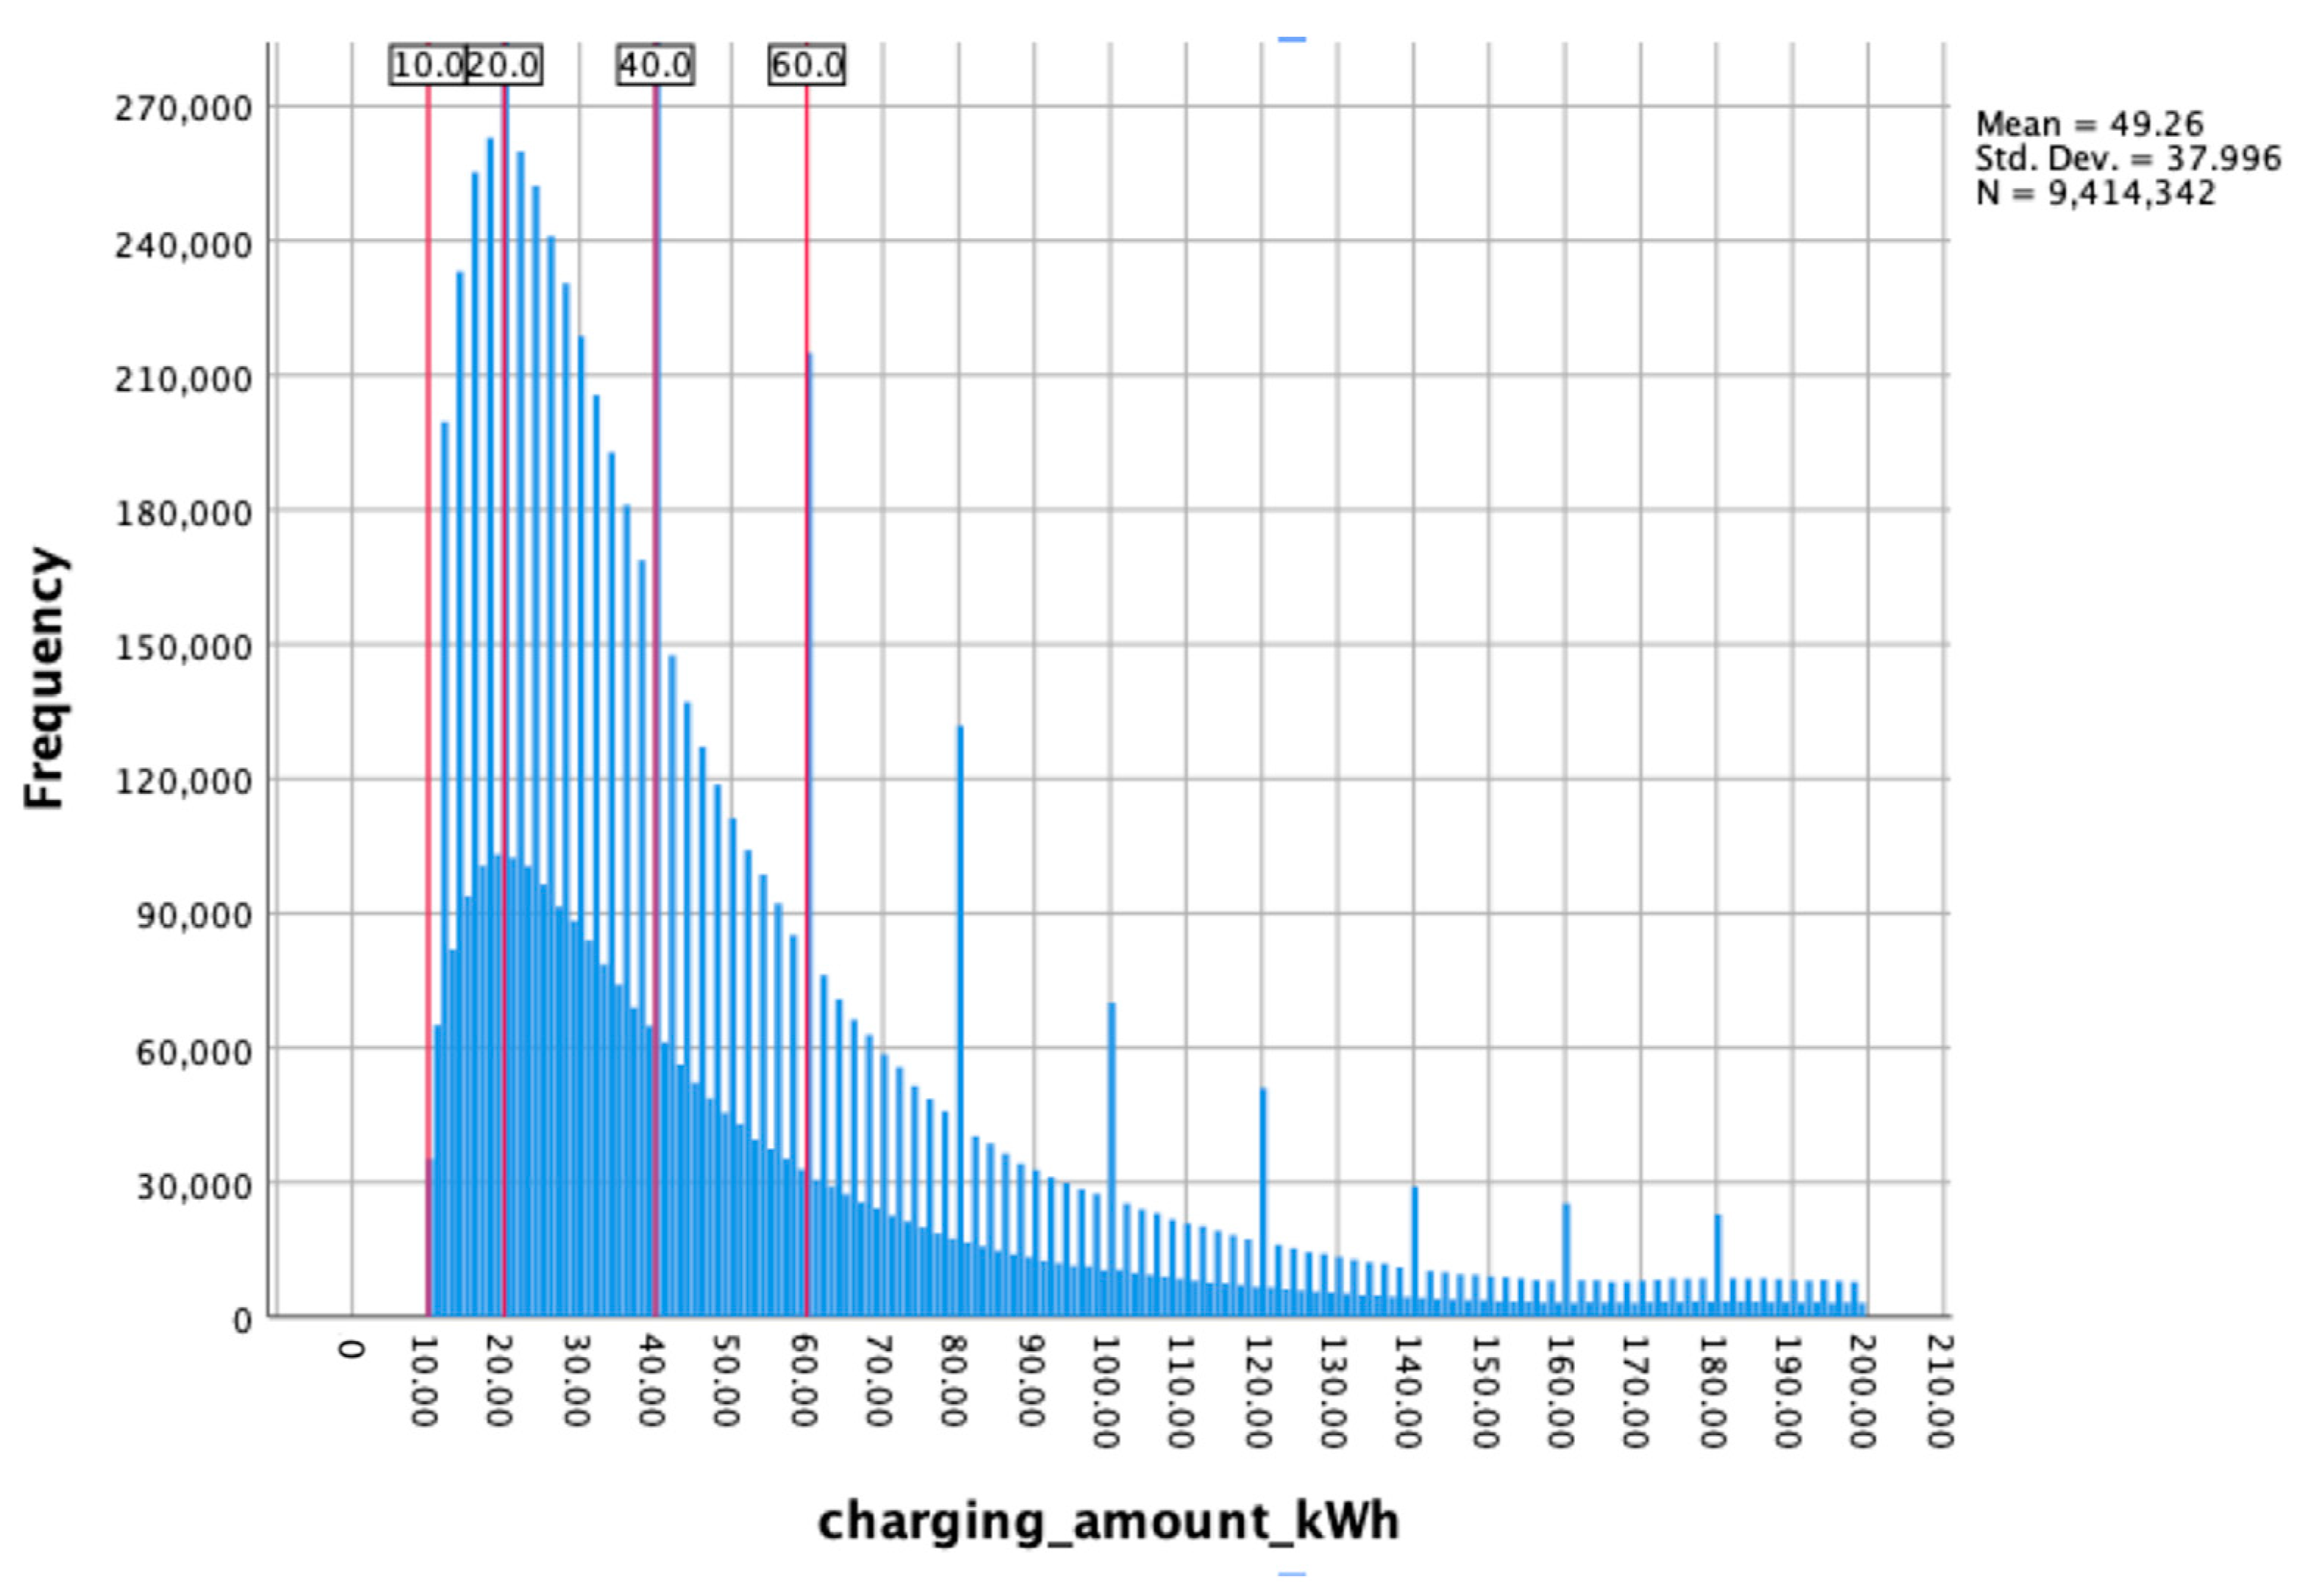
| <10 | 35,243 | 0.4% |
| 10–20 | 1,416,372 | 15.0% |
| 20–40 | 3,896,355 | 41.4% |
| 40–60 | 1,707,807 | 18.1% |
| 60–90 | 1,173,346 | 12.5% |
| >90 | 1,185,219 | 12.6% |
| Total | 9,414,342 | 100.0% |
| No | Time | Electricity CNY/kWh | Service Charge CNY/kWh | Charging Price CNY/kWh |
|---|---|---|---|---|
| 1 | 00:00–8:00 | 0.35 | 0.6 | 0.95 |
| 2 | 8:00–12:00 | 0.88 | 0.52 | 1.4 |
| 3 | 12:00–15:00 | 0.6 | 0.6 | 1.2 |
| 4 | 15:00–21:00 | 0.88 | 0.52 | 1.4 |
| 5 | 21:00–24:00 | 0.6 | 0.6 | 1.2 |
| Time Period Price | N | % of Total N | Frequency Sum | % of Total Sum |
|---|---|---|---|---|
| 0.95 | 539,723 | 51.9% | 7,684,891.44 | 52.1% |
| 1.2 | 187,706 | 18.1% | 2,619,382.24 | 17.8% |
| 1.4 | 312,173 | 30.0% | 4,451,317.88 | 30.2% |
| Total | 1,039,602 | 100.0% | 14,755,591.56 | 100.0% |
Disclaimer/Publisher’s Note: The statements, opinions and data contained in all publications are solely those of the individual author(s) and contributor(s) and not of MDPI and/or the editor(s). MDPI and/or the editor(s) disclaim responsibility for any injury to people or property resulting from any ideas, methods, instructions or products referred to in the content. |
© 2024 by the authors. Licensee MDPI, Basel, Switzerland. This article is an open access article distributed under the terms and conditions of the Creative Commons Attribution (CC BY) license (https://creativecommons.org/licenses/by/4.0/).
Share and Cite
Wu, W.; Wei, J.; Nam, E.-Y.; Zhang, Y.; Chun, D. Data Drive—Charging Behavior of Electric Vehicle Users with Variable Roles. Sustainability 2024, 16, 4842. https://doi.org/10.3390/su16114842
Wu W, Wei J, Nam E-Y, Zhang Y, Chun D. Data Drive—Charging Behavior of Electric Vehicle Users with Variable Roles. Sustainability. 2024; 16(11):4842. https://doi.org/10.3390/su16114842
Chicago/Turabian StyleWu, Weihua, Jieyun Wei, Eun-Young Nam, Yifan Zhang, and Dongphil Chun. 2024. "Data Drive—Charging Behavior of Electric Vehicle Users with Variable Roles" Sustainability 16, no. 11: 4842. https://doi.org/10.3390/su16114842