Article

Using Deficit Irrigation Strategies and Adding Sugarcane Waste Biochar as a Sustainable Material to Sandy Soils for Improving Yield and Water Productivity of Cucumber

by
Mamdouh A. A. Abdou
1,
Mohamed G. Alashram
1,
Ahmed E. Hamza
2,
Younes M. Rashad
3,
Ahmed M. Abd-ElGawad
4,
Mohamed Bourouah
5,
Mohamed Hafez
6,* and
Ramadan Eid Abdelraouf
1,*
1
Water Relation and Field Irrigation Department, Agricultural and Biological Research Institute, National Research Centre, Giza 12622, Egypt
2
Vegetable Research Department, Agricultural and Biological Research Institute, National Research Centre, Giza 12622, Egypt
3
Plant Protection and Biomolecular Diagnosis Department, Arid Lands Cultivation Research Institute (ALCRI), City of Scientific Research and Technological Applications (SRTA-City), New Borg El-Arab City 21934, Egypt
4
Plant Production Department, College of Food & Agriculture Sciences, King Saud University, P.O. Box 2460, Riyadh 11451, Saudi Arabia
5
Hahn-Schickard-Gesellschaft für Angewandte Forschung e.V., Wilhelm-Schickard-Straße, 78052 Villingen-Schwenningen, Germany
6
Land and Water Technologies Department, Arid Lands Cultivation Research Institute (ALCRI), City of Scientific Research and Technological Applications (SRTA-City), New Borg El-Arab 21934, Egypt
*
Authors to whom correspondence should be addressed.
Sustainability 2024, 16(11), 4856; https://doi.org/10.3390/su16114856
Submission received: 7 May 2024 / Revised: 27 May 2024 / Accepted: 1 June 2024 / Published: 6 June 2024
(This article belongs to the Section Waste and Recycling)

Abstract

:
This study investigates the potential of biochar to mitigate drought stress in crops. Biochar amendments are increasingly recognized for their ability to enhance soil properties that promote water retention and plant resilience during dry periods. In a study conducted in Egypt, impacts of the application of sugarcane biochar on cucumber production, water productivity, and quality characteristics under deficient irrigation conditions were evaluated. Increasing the biochar application rate under arid region conditions resulted in significant improvements in cucumber yield, water productivity, vitamin C, soluble sugar content, and total soluble solids. The activated sugarcane biochar exhibited desirable properties, including a large surface area (250 m2g−1) and pore size (0.28 cm3g−1), with a microporous nature. The positive effects observed can be attributed to reduced water volume leaving the root zone, enhanced nutrient absorption, increased water holding capacity, and augmented nutrient availability. Based on the results, it is recommended to implement under-irrigation at 75% of full irrigation and apply a biochar rate of 10 tons per hectare to mitigate the environmental impacts of water scarcity and support the development of sustainable agricultural systems. In conclusion, biochar emerges as a valuable soil amendment for bolstering cucumber production and water use efficiency (WUE) under limited irrigation scenarios. Its potential lies in promoting improved soil moisture retention, enhancing nutrient availability for cucumber plants, and potentially mitigating plant stress.

1. Introduction

Water scarcity poses a significant challenge to crop production in Egypt, necessitating the adoption of methods and techniques that can enhance water efficiency in irrigation and optimize the use of limited water resources [1]. Developing agricultural practices, particularly in arid regions like Egypt, is crucial to compensate the shortage in food production [2]. In Egypt, where irrigation water resources are limited, crop water efficiency (WE) holds great importance. By implementing strategies that slightly decrease grain yield while increasing WE, it is possible to mitigate the negative impact of water scarcity on crop yields [3,4]. In this regard, adopting appropriate irrigation practices that embrace controlled deficit irrigation with minimal yield reduction can play a vital role. Deficit irrigation has been extensively studied and recognized as a sustainability method in arid regions, aiming to maximize crop water productivity. Previous research and experiments have demonstrated the positive and successful effects of deficit irrigation on enhancing crop production and water use in various crops without significantly compromising yield [5,6,7,8].
Deficit irrigation holds significant potential for improving water use efficiency, particularly in regions with limited water resources in agriculture. Understanding the most sensitive stages of crops and the effects of irrigation deficit on plant production is crucial [9,10,11,12,13]. Approximately 47.2% of land areas are classified as dry lands, where agricultural productivity is constrained. However, it is essential to cultivate these soil-poor areas [14]. Sandy soils, often found in such areas, are considered marginal for agriculture [14]. Sandy soils pose several challenges, including limited nutrient availability, reduced organic materials, reduced water-holding ability, rapid organic matter mineralization, and nutrient leaching [15]. To address these limitations, agricultural practices in arid regions with sandy soils heavily depend on external inputs, such as organic and inorganic fertilizers.
Soil and compost application rates have proven beneficial in increasing nutrient availability [16,17]. The use of rice straw as a sustainable resource for addressing water scarcity in arid regions has been highlighted in previous studies [18]. However, organic amendments in sandy soils tend to decompose rapidly, necessitating frequent applications to maintain productivity [19]. Manure has been reported to alleviate water stress under arid and sandy soil conditions [14,15]. In this context, the utilization of stable organic materials that can sustain a sandy soil environment, such as biochar, provides an effective alternative to easily degradable compost [20,21].
Biochar, derived from the pyrolysis of carbonaceous materials under oxygen-limited conditions, offers a potential solution to alleviate the limitations encountered in sandy soil cultivation. Biochar can act as a complementary sustainable material, alongside compost, manure, and mineral fertilizers. When compared to traditional compost, biochar offers several environmental and sustainability advantages. Its unique porous structure and high internal surface area contribute to improved water retention and increased saturated hydraulic conductivity in the topsoil [22].
Research suggests that biochar application in sandy soils can improve properties like water retention and nutrient availability, which are particularly beneficial for cucumber growth under deficient irrigation [23,24]. Physicochemical characteristics of biochar can affect carbon and nutrient availability, protect soil microorganisms, and potentially influence microbial diversity [21]. The growing interest in biochar as a strategy to alleviate global warming is evident [25].
By considering biochar as a sustainable option, it becomes possible to harness its numerous benefits in terms of water retention, hydraulic conductivity, carbon sequestration, and soil health [26]. It is important to tailor the application rates and methods to the specific soil conditions and objectives to maximize its effectiveness.
Biochar can be produced through pyrolysis, a process that involves heating biomass at different temperatures. Low-temperature pyrolysis produces biochar with a higher volatile content, which can provide nutrients and support plant growth [27]. On the other hand, high-temperature pyrolysis yields biochar with a larger surface area and higher aromatic carbon content [28]. This type of biochar exhibits increased adsorption capacity and recalcitrant properties, making it suitable for carbon sequestration [25,26,27,29].
The cucumber is an important and public plant, with a global production of around 93.5 million tons. The area under cucumber production in Egypt was estimated at 19,702 ha in 2019 and produced 433,440.85 tons (FAOSTAT, 2020, https://www.fao.org/faostat/en/#data/QI, accessed on 15 January 2022).
This research was aimed to investigate the potential of deficit irrigation and the utilization of biochar, and enhance water use and improve crop yield in sandy soils, with a particular focus on arid regions, specifically Egypt. The primary goals of the study are to identify the most critical stages of crop growth affected by irrigation deficit, evaluate the effects of deficit irrigation on the plant yield, and assess the effectiveness of biochar in enhancing soil water retention, nutrient availability, and overall crop performance in sandy soils. By providing valuable insights into sustainable agricultural practices, the study aims to optimize water resources as well as alleviate the adverse effects of water deficiency on crop production in arid environments.

2. Methodology

Field experiments were conducted on cucumber plants for two consecutive seasons, namely 2022 and 2023. The study was conducted in the Al-Nubariya Region, Al-Buhayrah Governorate, situated north of Cairo, Egypt. The experimental site was specifically located on sandy soil, with coordinates approximately at 30°26′28″ N and 30°18′0″ E. The elevation of the site was recorded to be around 21 m. The chosen area is known for its arid climate, characterized by cold winters and hot-dry summers. Additional details regarding the location’s climate can be found in Figure 1 and Table 1.
Meteorological parameters monitored included solar radiation (SRAD), maximum air temperature (TMAX), minimum air temperature (TMIN), average precipitation (RAIN), wind speed (WIND), dew/frost point temperature (TDEW), average air temperature (TMean), and average relative humidity (RH).
The soil characteristics of the study area are shown in the table above. The soil texture was sandy at all three depths, with coarse sand percentages ranging from 40.72% to 57.22%. The fine sand content was also high, ranging from 39.52% to 55.44%. The silt and clay contents were relatively low, ranging from 2.51% to 3.84%. The soil density ranged from 1.66 to 1.69 t m−3. The soil organic content decreased with the depth, from 0.65% at 0–15 cm to 0.25% at 30–45 cm.
The chemical parameters of the soil are also shown in the table above. The electrical conductivity (EC) of the soil ranged between 0.55 to 0.58 dS m−1. The pH of the soil was alkaline, ranging from 8.5 to 8.7. The total calcium carbonate (CaCO3) content of the soil decreased with depth, from 7.06% at 0–15 cm to 2.43% at 30–45 cm. The pH of the irrigation water was 7.6 and with an electrical conductivity (EC) of 0.55 ds m−1.
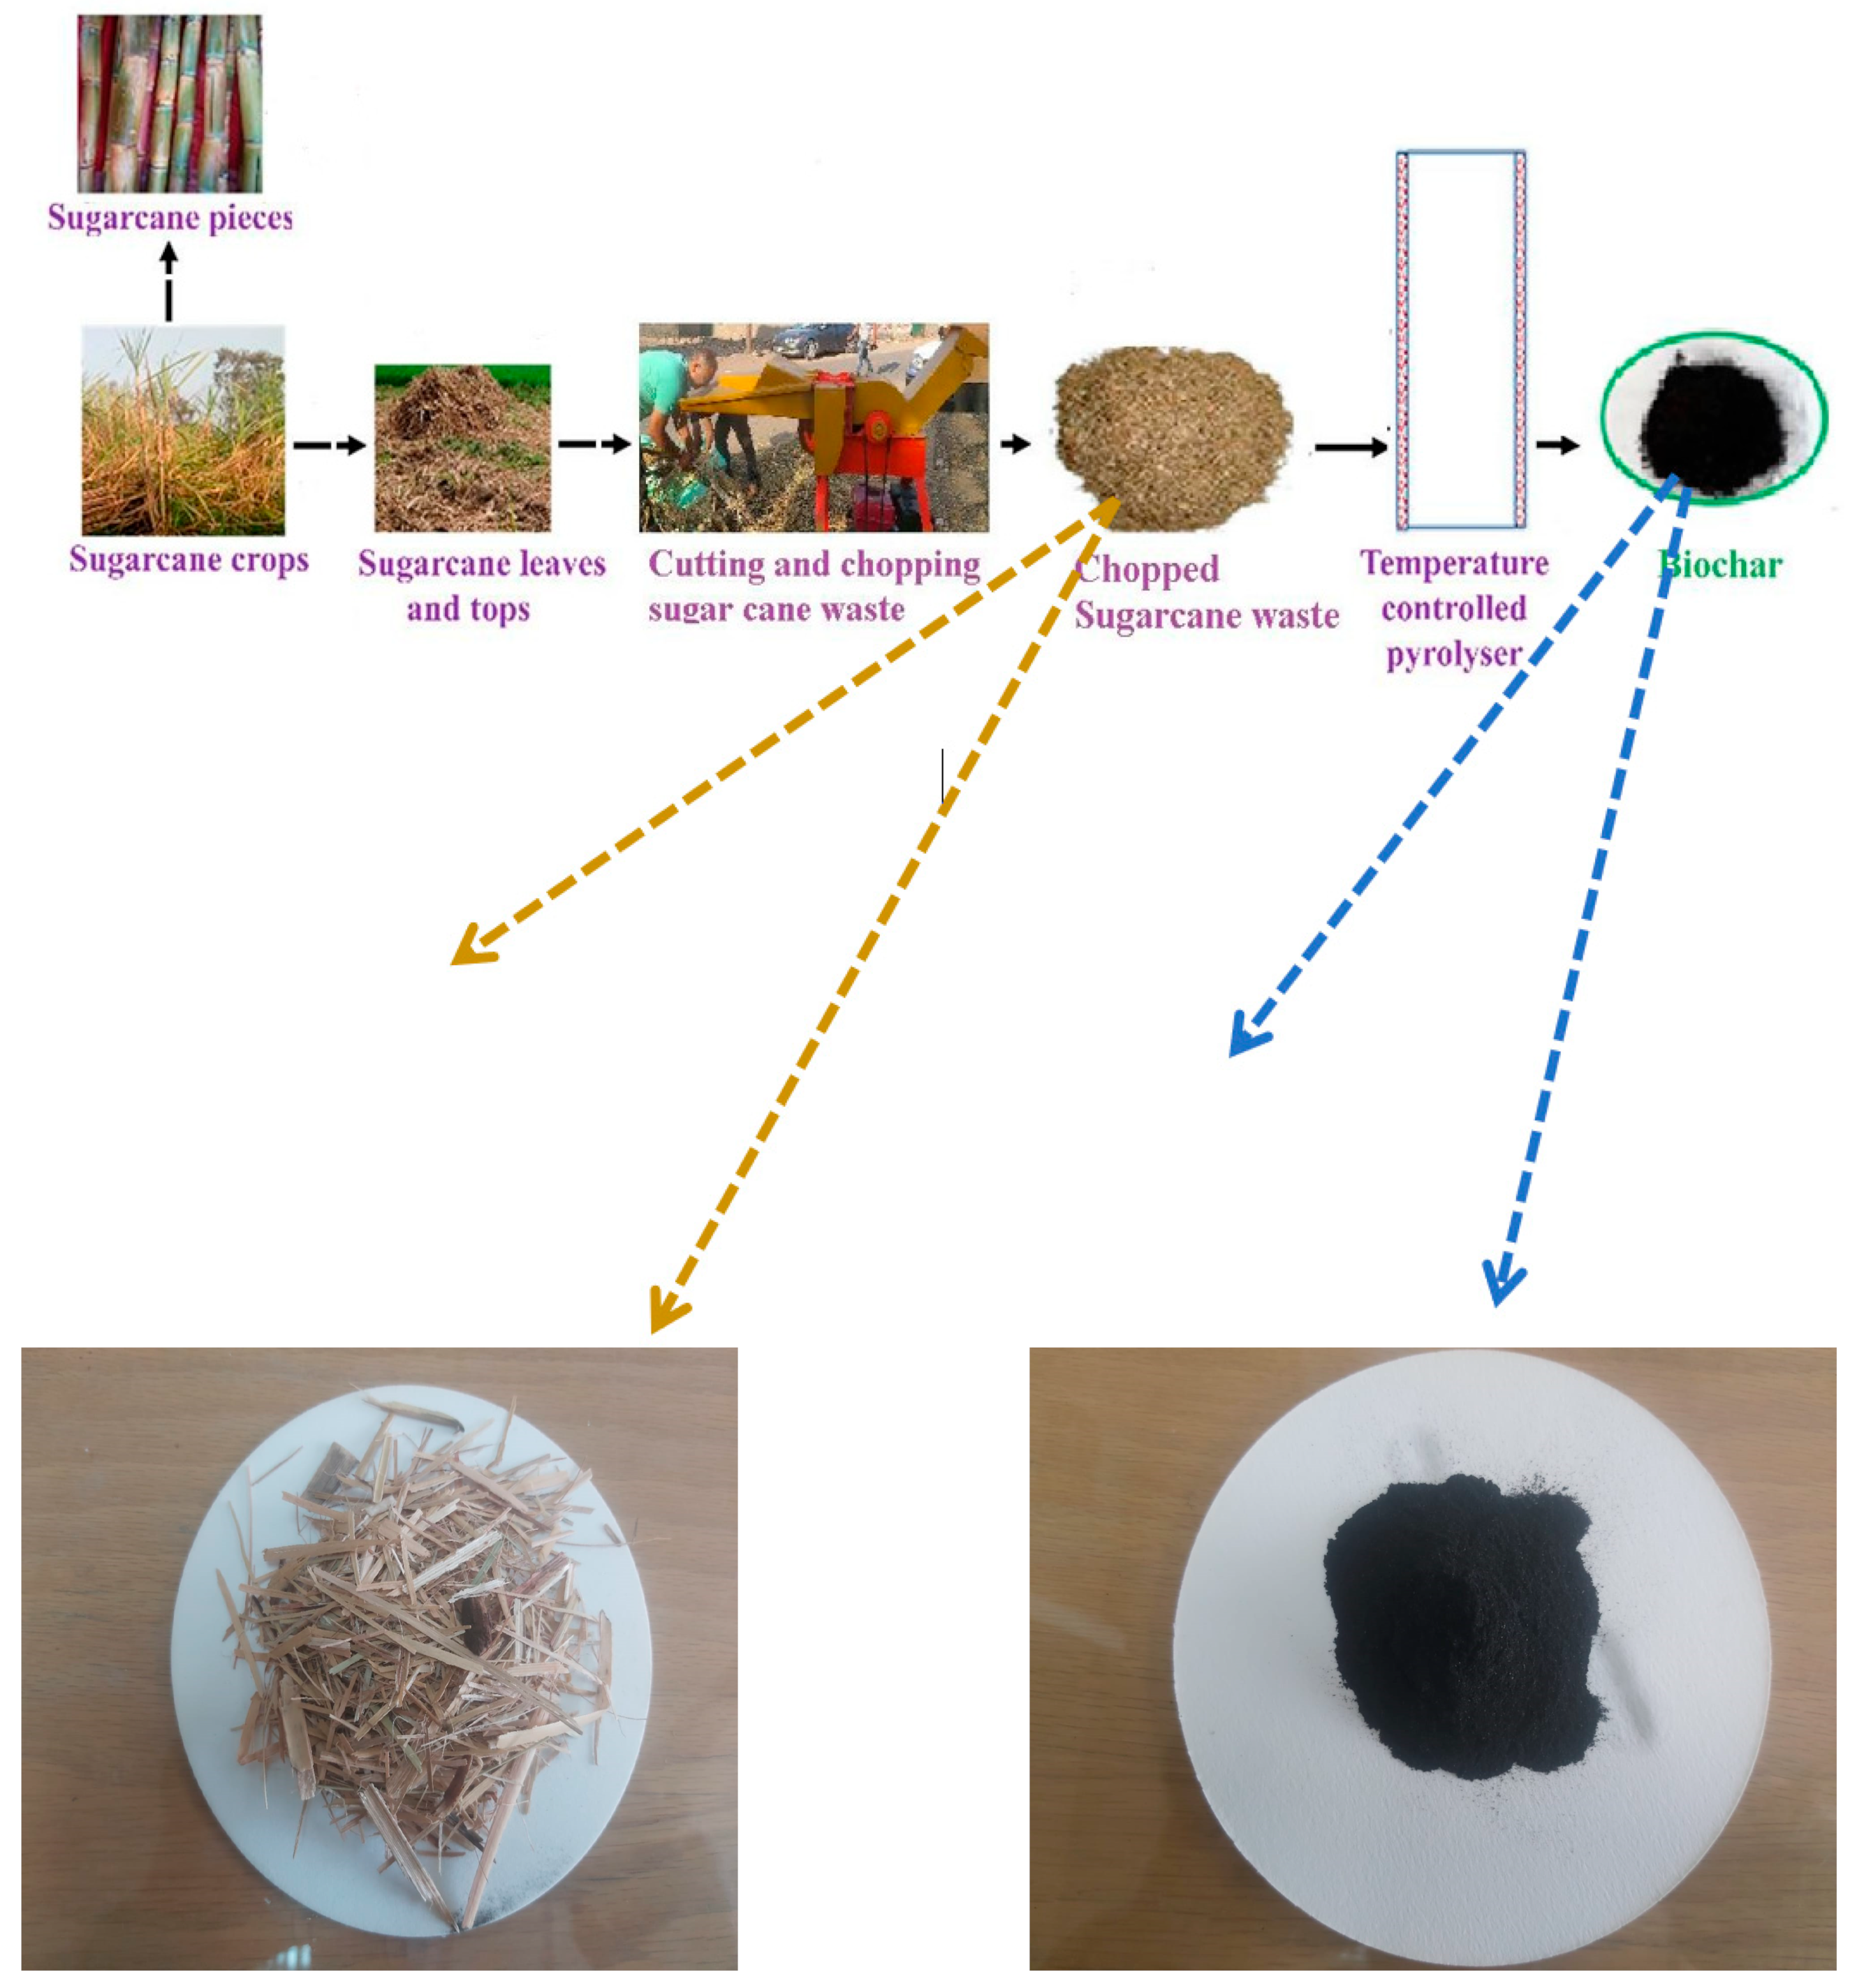
Biochar production: Biochar was produced from sugarcane waste through pyrolysis experiments using metal scrap drums as simple reactors. The sugarcane waste feedstock was introduced into the reactor and subjected to pyrolysis for 6 h at low temperatures (between 300 °C and 500 °C), then it was allowed to cool down to room temperature inside the furnace. The resulting biochar and ash were carefully weighed. A detailed description of the stages involved in biochar production from sugarcane waste can be found in Equation (1) and Figure 2.
Y i e l d % = M a s s   o f   b i o c h a r ( k g ) D r y   m a s s   o f   f e e d s t o c k ( k g ) × 100
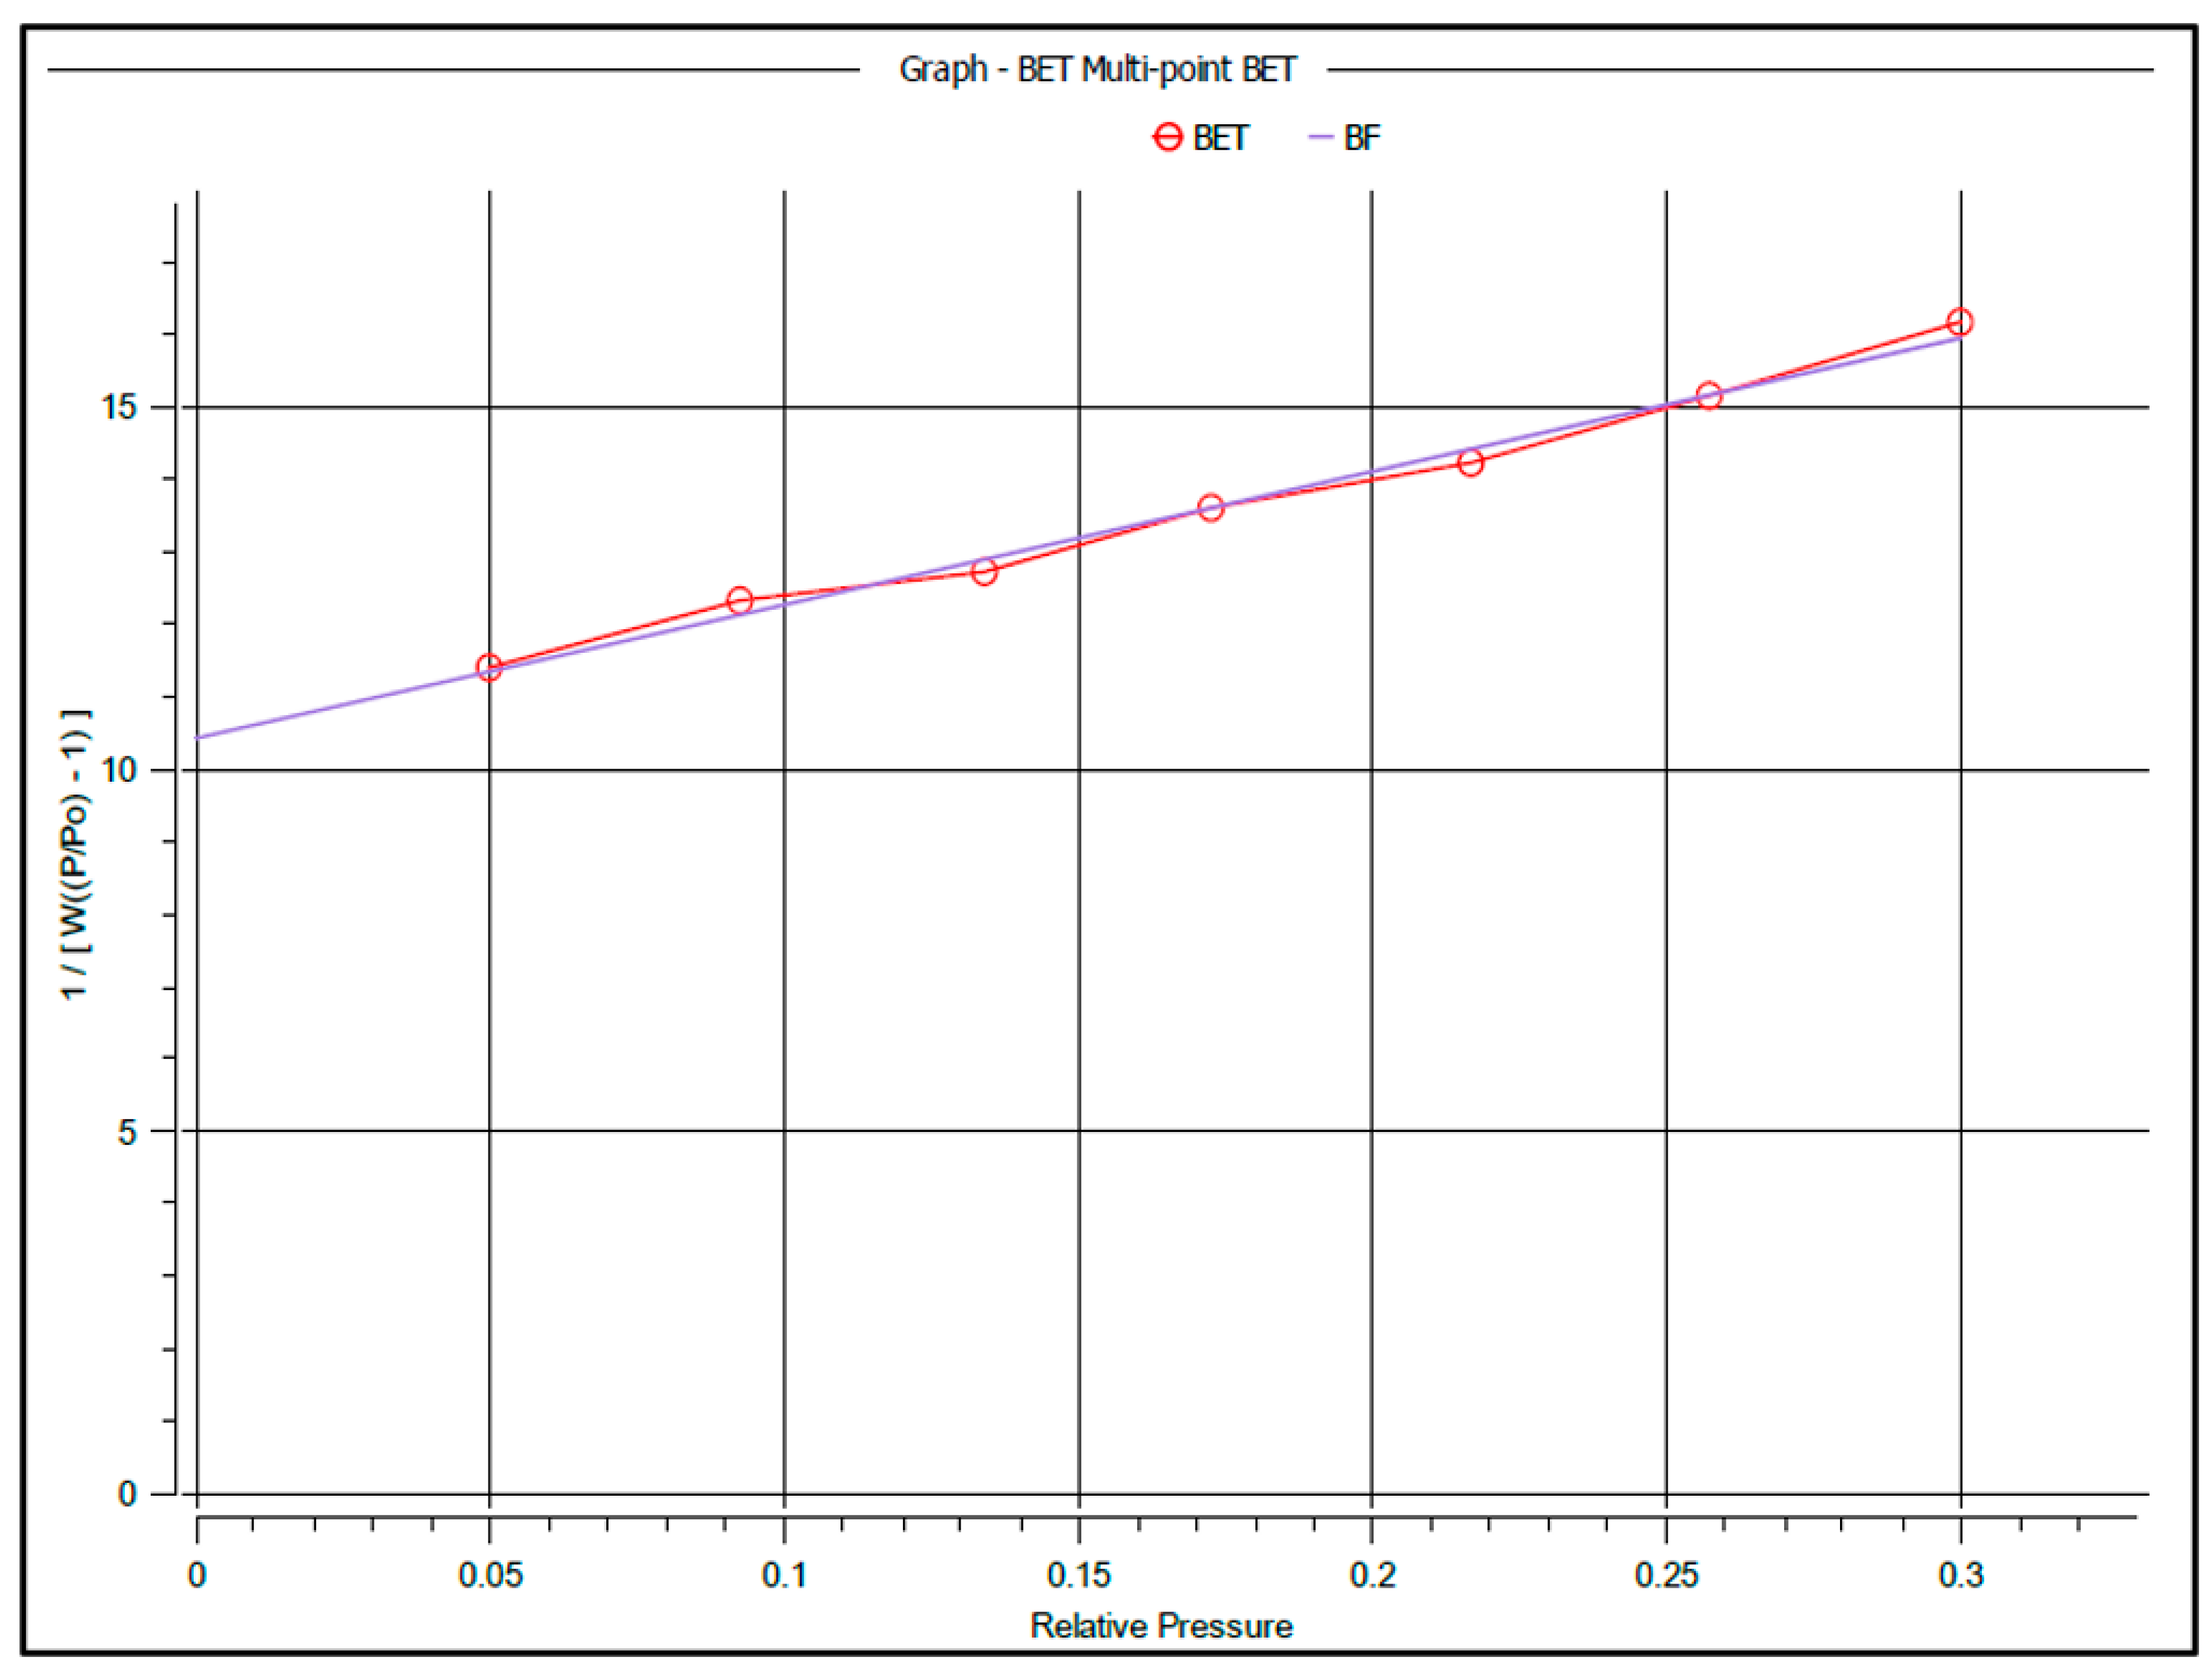
Characterization of biochar: The adsorption–desorption isotherms of nitrogen were assessed using a Tristar II Kr 3020 Micromeritics instrument,(Mönchengladbach, Germany) with measurements conducted at the boiling point of nitrogen. At the first stage, the samples were degassed under a vacuum at 120 °C for a duration of 12 h. The specific surface area was determined using the multipoint technique developed by Brunauer, Emmett, and Teller (BET). Additionally, the pore volume was obtained through the Barret, Joyner, and Halenda (BJH) method [30].
Experimental design: The experimental design incorporated three levels of irrigation water deficit for cucumbers [F1(100%), F2 (80%), and F3 (60%)] as the main plot. In the sub-main plot, 5 levels of sugarcane waste biochar (0 tons/ha as the control, along with 5, 7, 9, and 11 tons/ha) were implemented.
The daily irrigation quantity for cucumbers was measured using Equation (2), and the seasonal irrigation water requirement was determined to be 6100 m3/ha/season for 100% (FI) in 2022 and 6060 m3/ha/season in 2023 under a drip irrigation system.
I R = E T o × K c × K s E i R + L R
where IR refers to the irrigation requirements and ETo represents the reference evapotranspiration in mm/day. ETo can be expressed [30] by calculating it using the following Equation (3):
E T o = 0.408 ( R n G ) + γ 900 T a + 273 u 2 ( e s e a ) + γ 1 + 0.34 u 2  
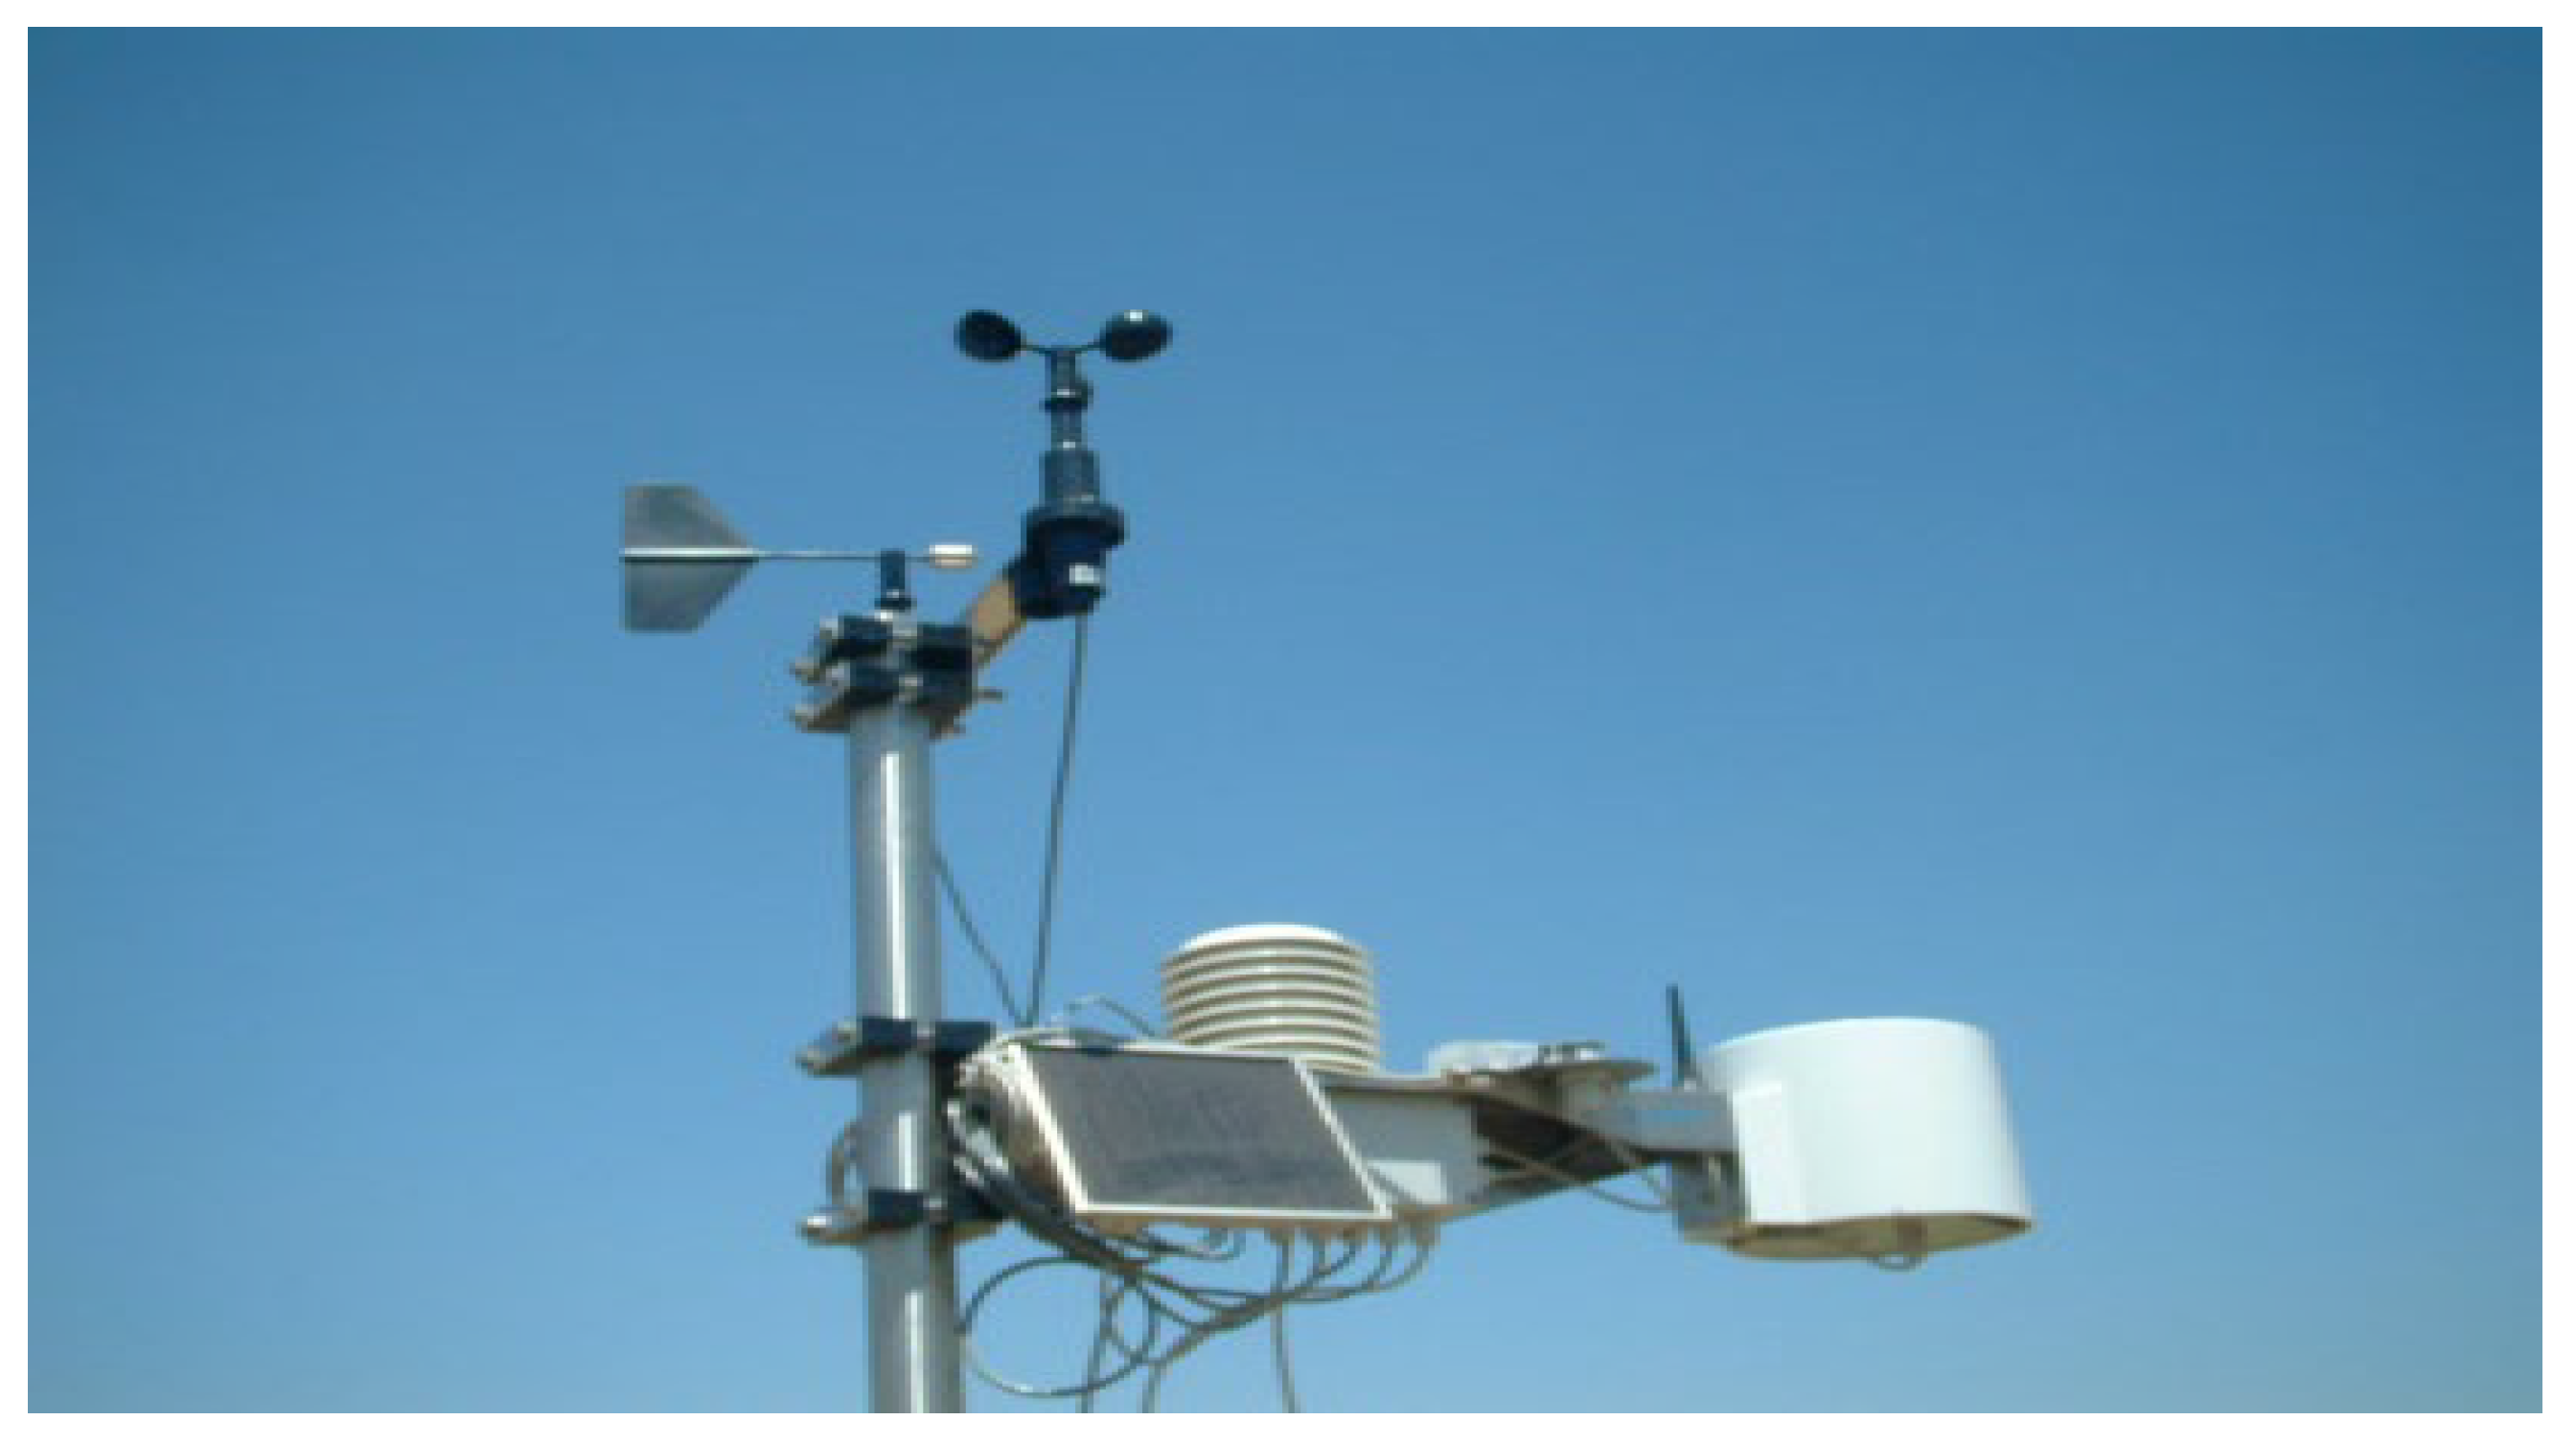
where ETo is the reference crop evapotranspiration (mm day−1), ∆ is the slope of the saturation vapor pressure vs. air temperature curve (kPa °C−1), Rn is the net radiation at the crop surface (MJm−2 day−1), G is the soil heat flux density at the soil surface (MJm−2 day−1), γ is the psychrometric constant (kPa °C−1), Ta is the average daily air temperature at 1.5–2.5 m height (°C), u2 is the mean daily wind speed at 2 m height (m s−1), es is the saturation vapor pressure (kPa), and ea is the actual vapor pressure (kPa). All meteorological parameters were collected by the meteorological station inside Al-Nubariya farm, as shown in Figure 3.
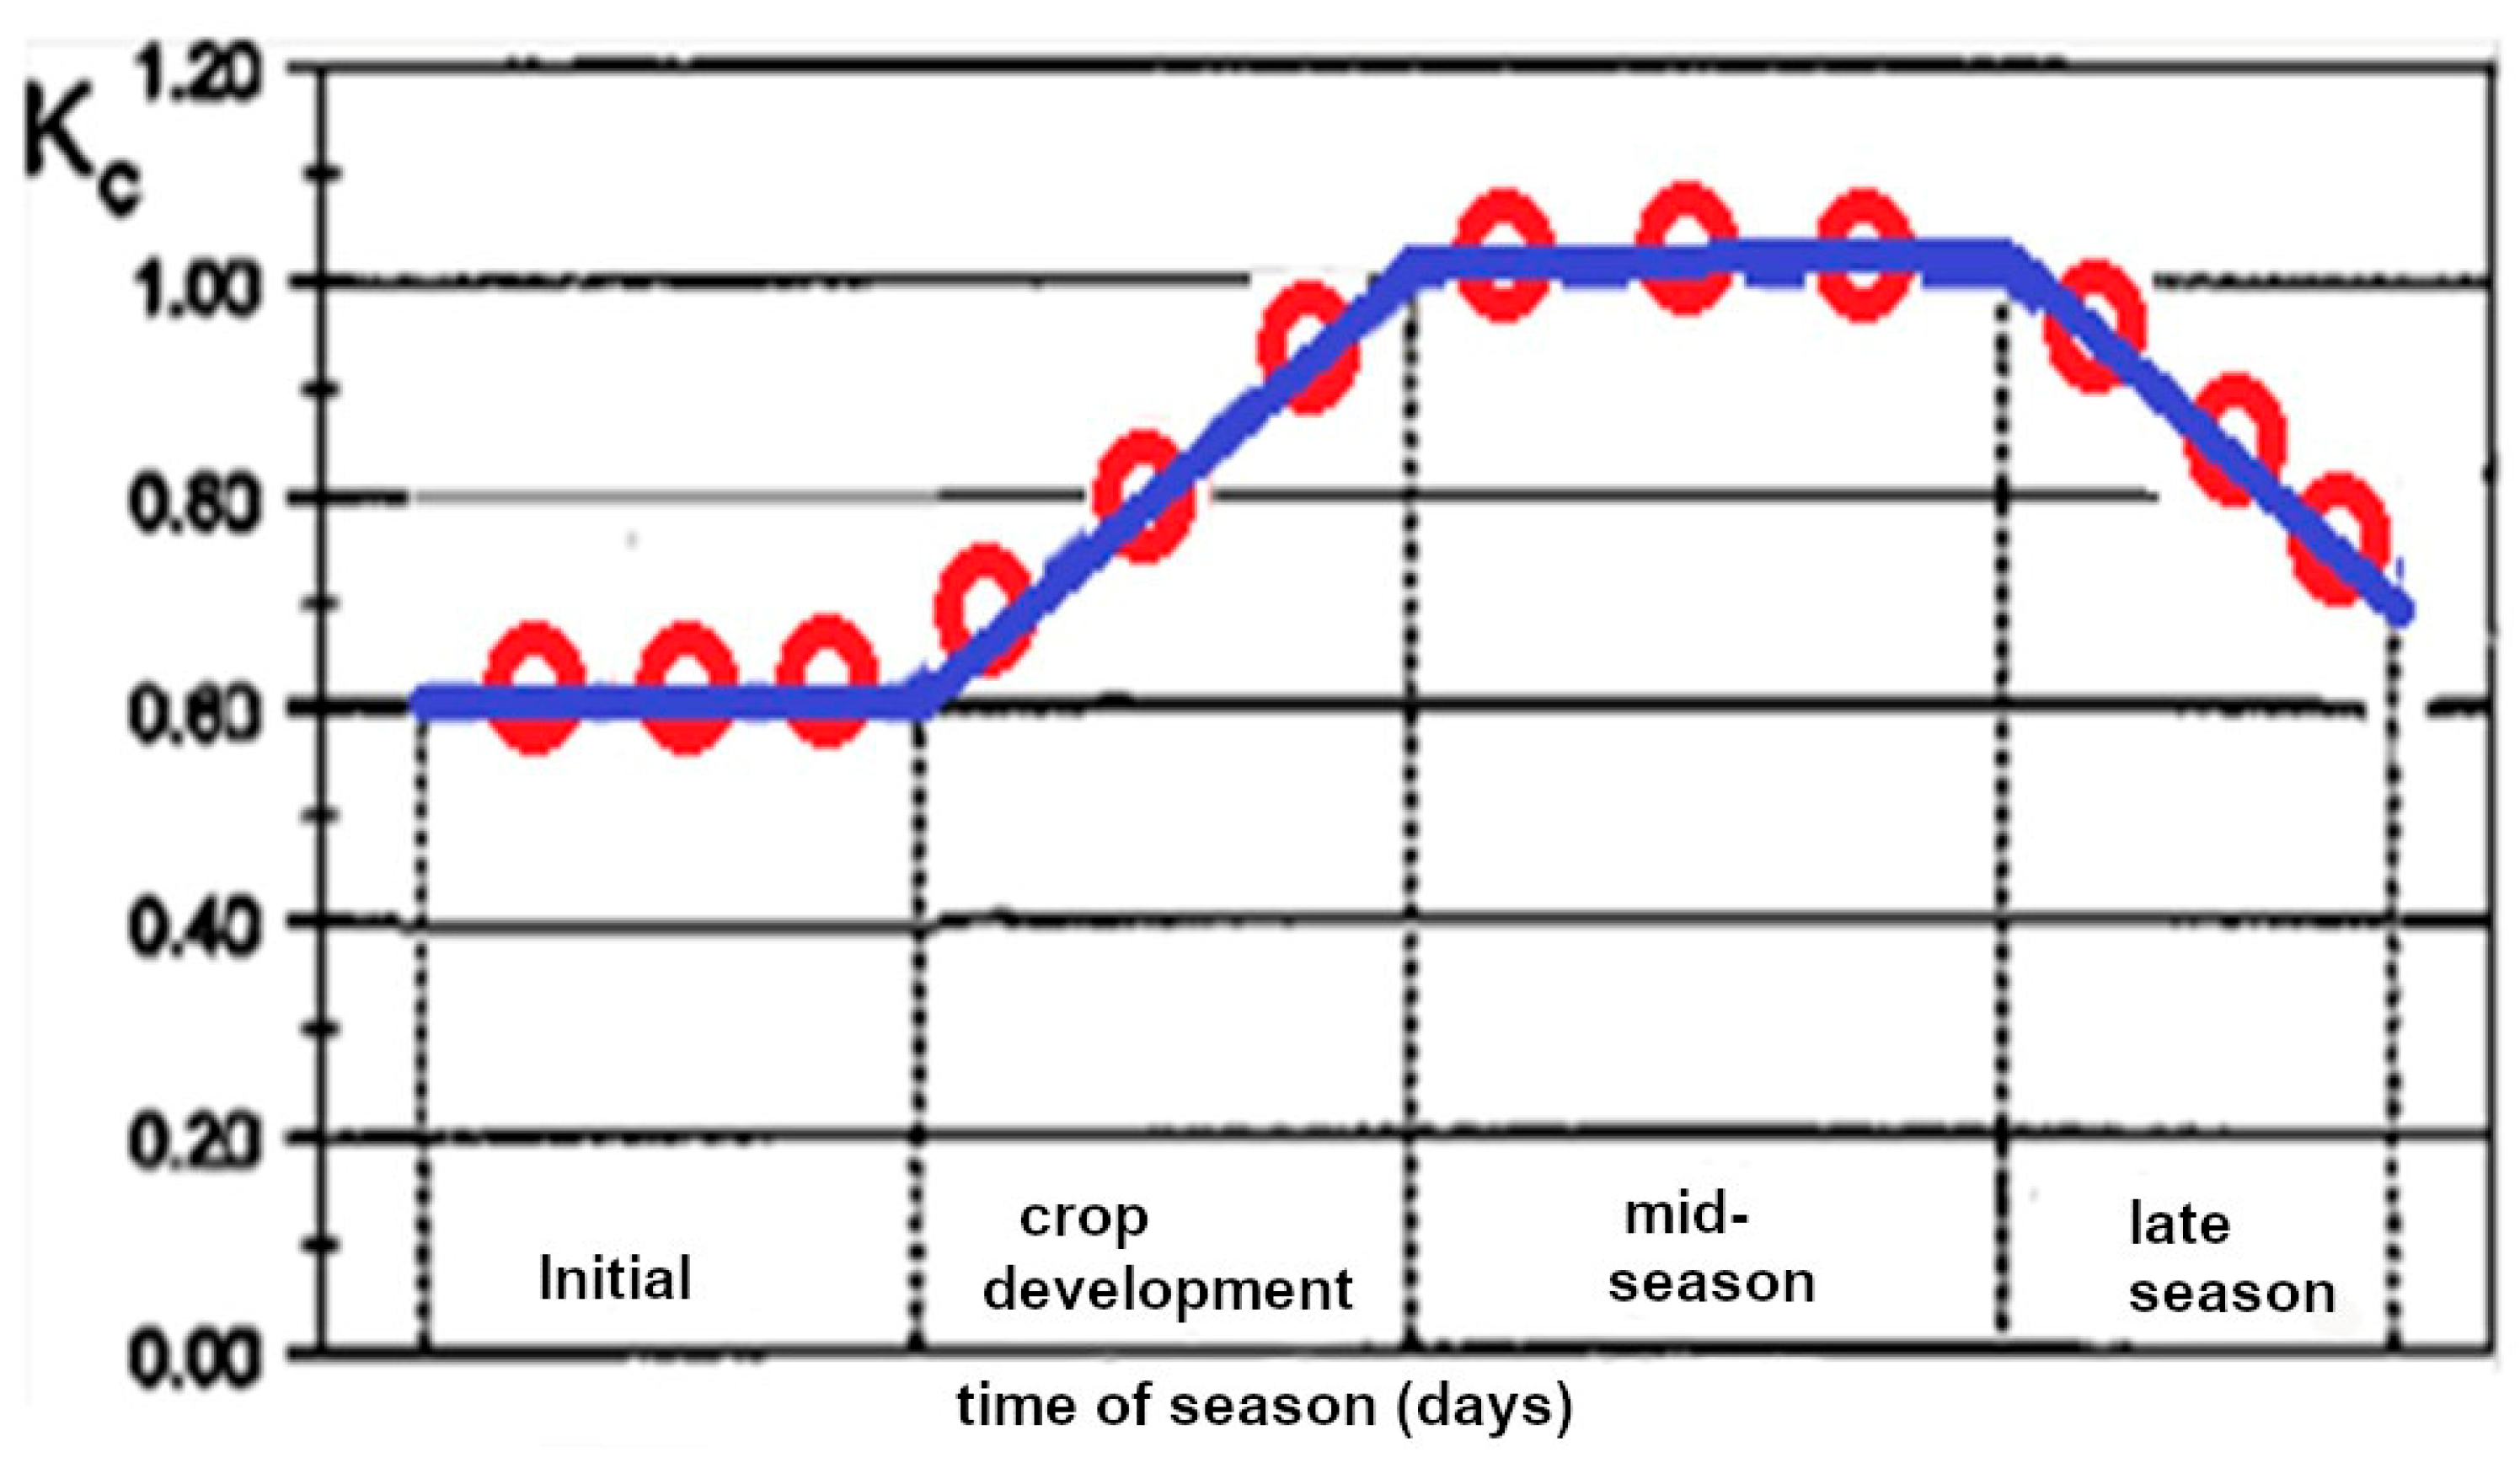
Kc is the crop factor based on the FAO-56 guidelines, and Ks is the water stress coefficient, which is Ks < 1 for soil water limiting conditions. The growth stages lengths were modified according to the actual data collected from the experiment. Rainfall (R) was considered, the irrigation efficiency (Ei) was expressed as a percentage (%), and the amount of water required for leaching salts (LR) was also considered.
The total water volumes for each treatment and biochar application rate can be found in Table 2.

Evaluation Parameters

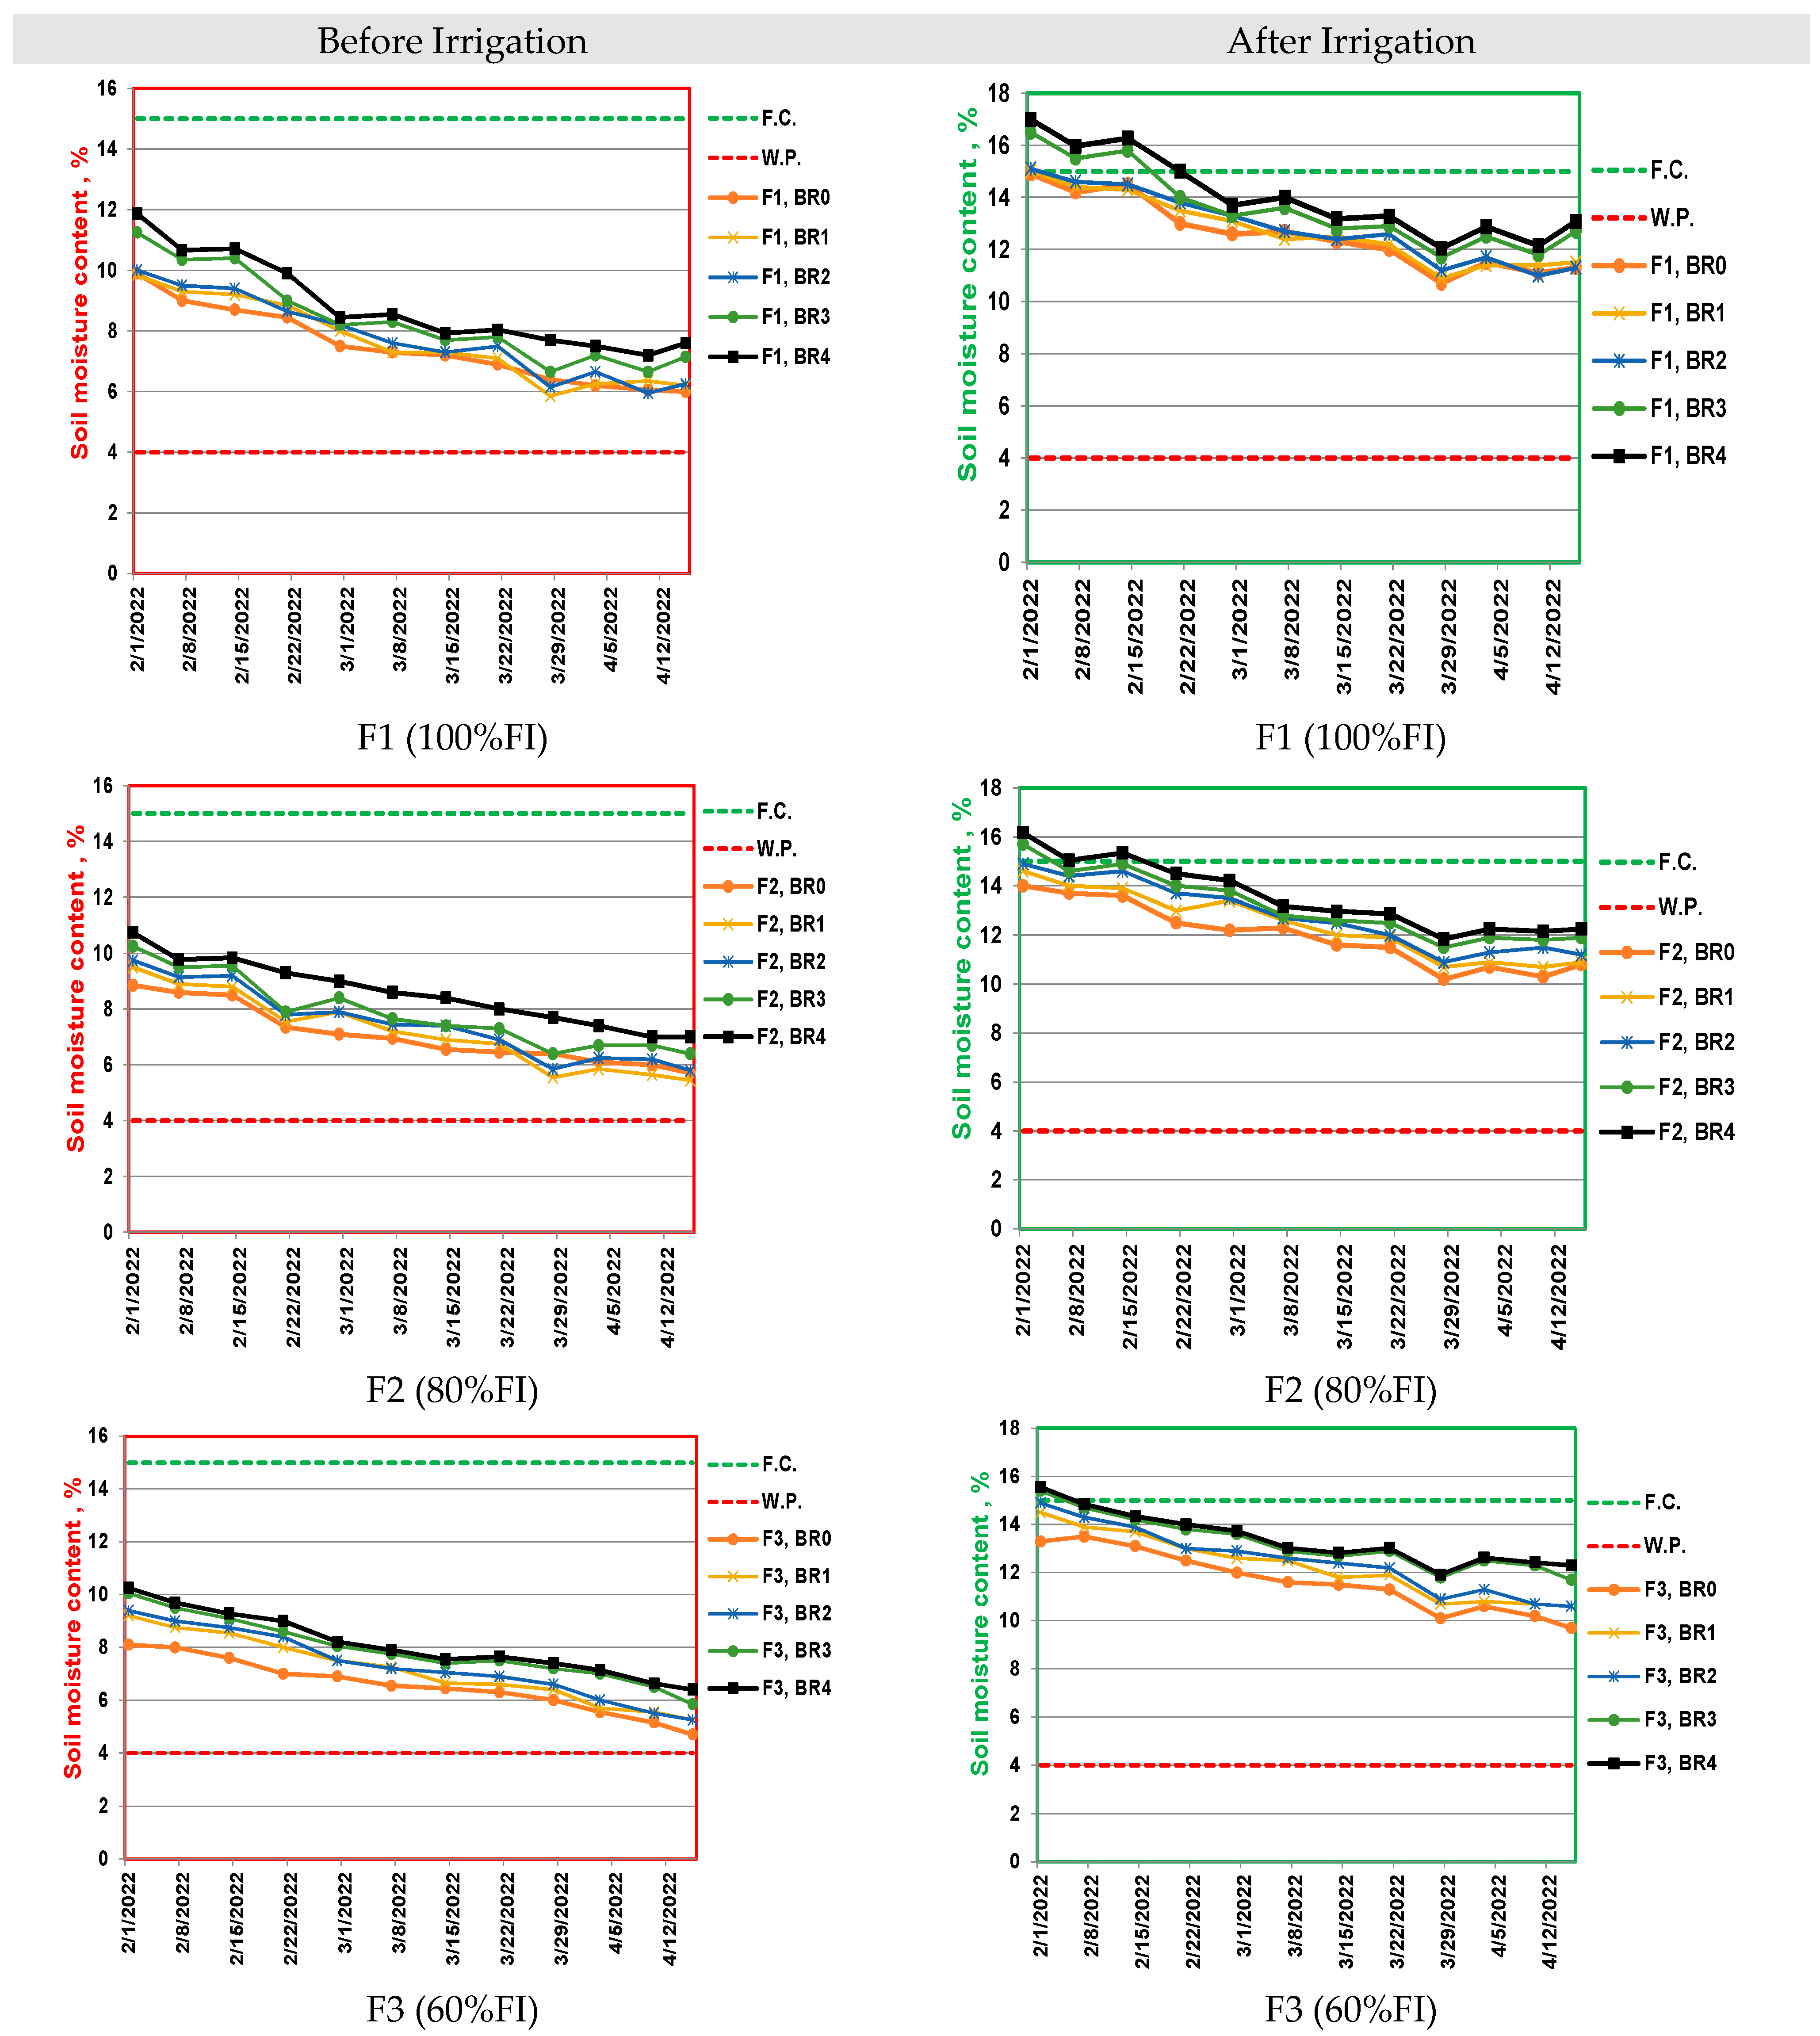
To determine the maximum water availability in the rhizosphere, the disparity between the soil moisture at field capacity (FC) and the soil moisture at the wilting point (PWP) was calculated. Soil moisture in the rhizosphere was taken at different depths and growth stages of the plant, including the initial, development, mid-season, and late-season stages (see Figure 4). A profile probe device (PR2) was used to measure soil moisture. Specifically, measured soil moisture content equivalent to FC was found to be 15%, whereas the PWP was determined to be 4% [1,31].
In order to evaluate the water stress experienced by cucumber plants in their root zone, measurements of soil moisture were conducted before each irrigation occurrence throughout the entire duration of the growing season. The average moisture level was recorded for each treatment prior to irrigation. Water stress in the rhizosphere was quantified by calculating the difference between the soil moisture content before irrigation and the wilting point.
The application efficiency of irrigation water (AEIW) quantifies the effectiveness of storing irrigation water in the rhizosphere to fulfill the crop’s water requirements. Equation (4) was introduced to calculate AEIW as follows:
A E I W   ( % ) = D s D a × 100
In the given context, the following information can be provided with reduced plagiarism:
Da represents the depth of applied water (in cm), depth of stored water in the rhizosphere (Ds) was determined using the equation Ds = (θ1 − θ2) * d * ρ, d represents the soil layer depth (in cm), θ1 represents the soil moisture content after irrigation (in %), θ2 represents the soil moisture content before irrigation (in %), and ρ represents the relative bulk density of the soil (dimensionless).
To determine the soil moisture in the rhizosphere, measurements were taken using a profile probe device. A profile probe device is a scientific instrument used to measure soil moisture content at various depths within the soil profile. It consists of a slender, sealed rod with electronic sensors embedded at specific intervals along its length. These sensors transmit electrical signals that are influenced by the water content of the surrounding soil.
The measurements were conducted at different locations along the horizontal direction (X-direction) at depths of 0–10 cm, 10–20 cm, and 20–30 cm. Additionally, measurements were taken along the vertical direction (Y-direction) at depths of 0–10 cm, 10–20 cm, and 20–30 cm, as shown as in Figure 5. These measurements were performed both before and 2 h after irrigation to assess soil moisture levels at maximum water availability.
Yield of cucumber: At harvest, fruits about 10 cm long were collected at regular intervals, weighed, and the yield was calculated in kg/m2 and ton/ha.
Water productivity of cucumber (WPCucumber) was calculated using James’s equation [32] (5):
WPCucumber = Y/IR
where WPCucumber represents the water productivity of cucumber (kg cucumber/m3 water), Y denotes the economic yield (kg/ha), and IR indicates the applied irrigation water amount (m3 water/ha).
Quality traits of cucumber: At the third picking, representative fruit samples were randomly selected from each treatment to determine vitamin C, soluble sugar content, and total soluble solids (TSS) using a handheld refractometer—A. KRÜSS Optronic GmbH (Hamburg, Germnay)—according to Singh’s method [33].
Statistical analysis was conducted on the data from both study seasons using analysis of variance (ANOVA) [34]. Means were compared using Duncan’s multiple range test [35].

3. Results and Discussion

3.1. BJH, BET, and Isotherms

Figure 1 displays the nitrogen adsorption–desorption isotherms of the activated sugarcane waste biochar with varying amounts of activating agent. These isotherms exhibit a type I pattern, indicating the presence of microporous structures with pore diameters smaller than 2 nm. The corresponding surface areas and pore volumes are presented in Table 3. It is evident that activation with K2CO3 at 800 °C significantly enhanced the textural properties of the sugarcane waste biochar, as higher amounts of activating agent led to an increased surface area and pore volume. Following calcination at 900 °C (Figure 5), the isotherm profile remained unchanged, albeit a reduction in the surface area and pore volume was observed (Table 3).
Table 3 shows that the material has a wide range of pore sizes, from 1.928 nm to 7.550 nm. The largest pore volume is in the 3.713 nm to 5.118 nm range, and the largest pore surface area is in the 5.118 nm to 6.506 nm range. This suggests that the material has a significant number of pores in the 3–5 nm range. The BJH table can be used to infer some information about the properties of the material. For example, the fact that the material has a wide range of pore sizes suggests that it is a mesoporous material, i.e., it has pores with diameters between 2 nm and 50 nm. The large pore volume and surface area in the 3–5 nm range suggest that the material is likely to be a good adsorbent, i.e., it has the ability to adsorb large amounts of molecules onto its surface. These results are consistent with Okasha et al. (2013) [3], who found that the water applied methods enhanced the yield and water use efficiency of maize grown under clay soil conditions.
Figure 6 shows the increment in the BET surface area of the biochar with the increment in the relative pressure. This is because the nitrogen gas molecules are able to adsorb onto the surface of the biochar at higher relative pressures. The BET surface area reaches a plateau at a relative pressure of about 0.95, which indicates that all of the available adsorption sites on the surface of the biochar have been occupied by nitrogen molecules.
The BET surface area of the biochar is a measure of its porosity. A higher BET surface area indicates that the biochar has more pores. This is important because pores allow the biochar to adsorb large amounts of molecules. The BET surface area of the sugarcane waste biochar typically ranged between 100–500 m2/g. This is comparable to the BET surface area of other types of activated carbon.
The BET results suggest that the sugarcane waste biochar is a good adsorbent. This means that it can be used to remove pollutants from water and wastewater, or to store gases. These results are consistent with previous studies [3,12,20].
The BET, BJH, and isotherms of activated sugarcane show that the activated sugarcane has a high surface area and pore volume. The isotherms are type I, which is characteristic of a microporous material. The BJH pore size distribution shows that the activated sugarcane has a wide range of pore sizes, from 1.928 nm to 7.550 nm. The largest pore volume is in the 3.713 nm to 5.118 nm range, and the largest pore surface area is in the 5.118 nm to 6.506 nm range. These results suggest that the activated sugarcane is a good adsorbent, and it can be used to remove pollutants from water and wastewater, or to store gases.
The obtained results are in agreement with those of other studies on activated sugarcane. For example, Mukherjee and Zimmerman (2013) reported that the BET surface area of biochars and biochar–soil mixtures was 210 m2/g and the pore volume was 0.23 cm3/g [36]. El-Meseery (2003) reported that sugarcane waste biochar had a BET surface area of 180 m2/g and a pore volume of 0.20 cm3/g [31].

3.2. Soil Moisture and Water Stress in the Rhizosphere

In Figure 7, it can be observed that soil moisture content (SMC) in the rhizosphere is significantly reduced under under-irrigation conditions. A reduction in irrigation water led to a decrease in the SMC. The highest SMC values were observed at F1, while the lowest ones were seen at F3. This trend may be attributed to the higher volume of water (100% of FI), which results in higher average moisture content compared to smaller volumes (80% or 60% of FI) within the root zone. Consequently, watering with less water than full irrigation leads to greater water stress.
Additionally, Figure 7 reveals that the quantity of biochar applied affects SMC in the rhizosphere of cucumber plants compared to no biochar addition. As the quantity of biochar applied increases, SMC also increases. The highest SMC values were observed at 11 tons ha−1, while the lowest ones were observed in the absence of biochar. This phenomenon is attributed to the water retention capability of biochar within the root zone [37].

3.3. Water Application Efficiency

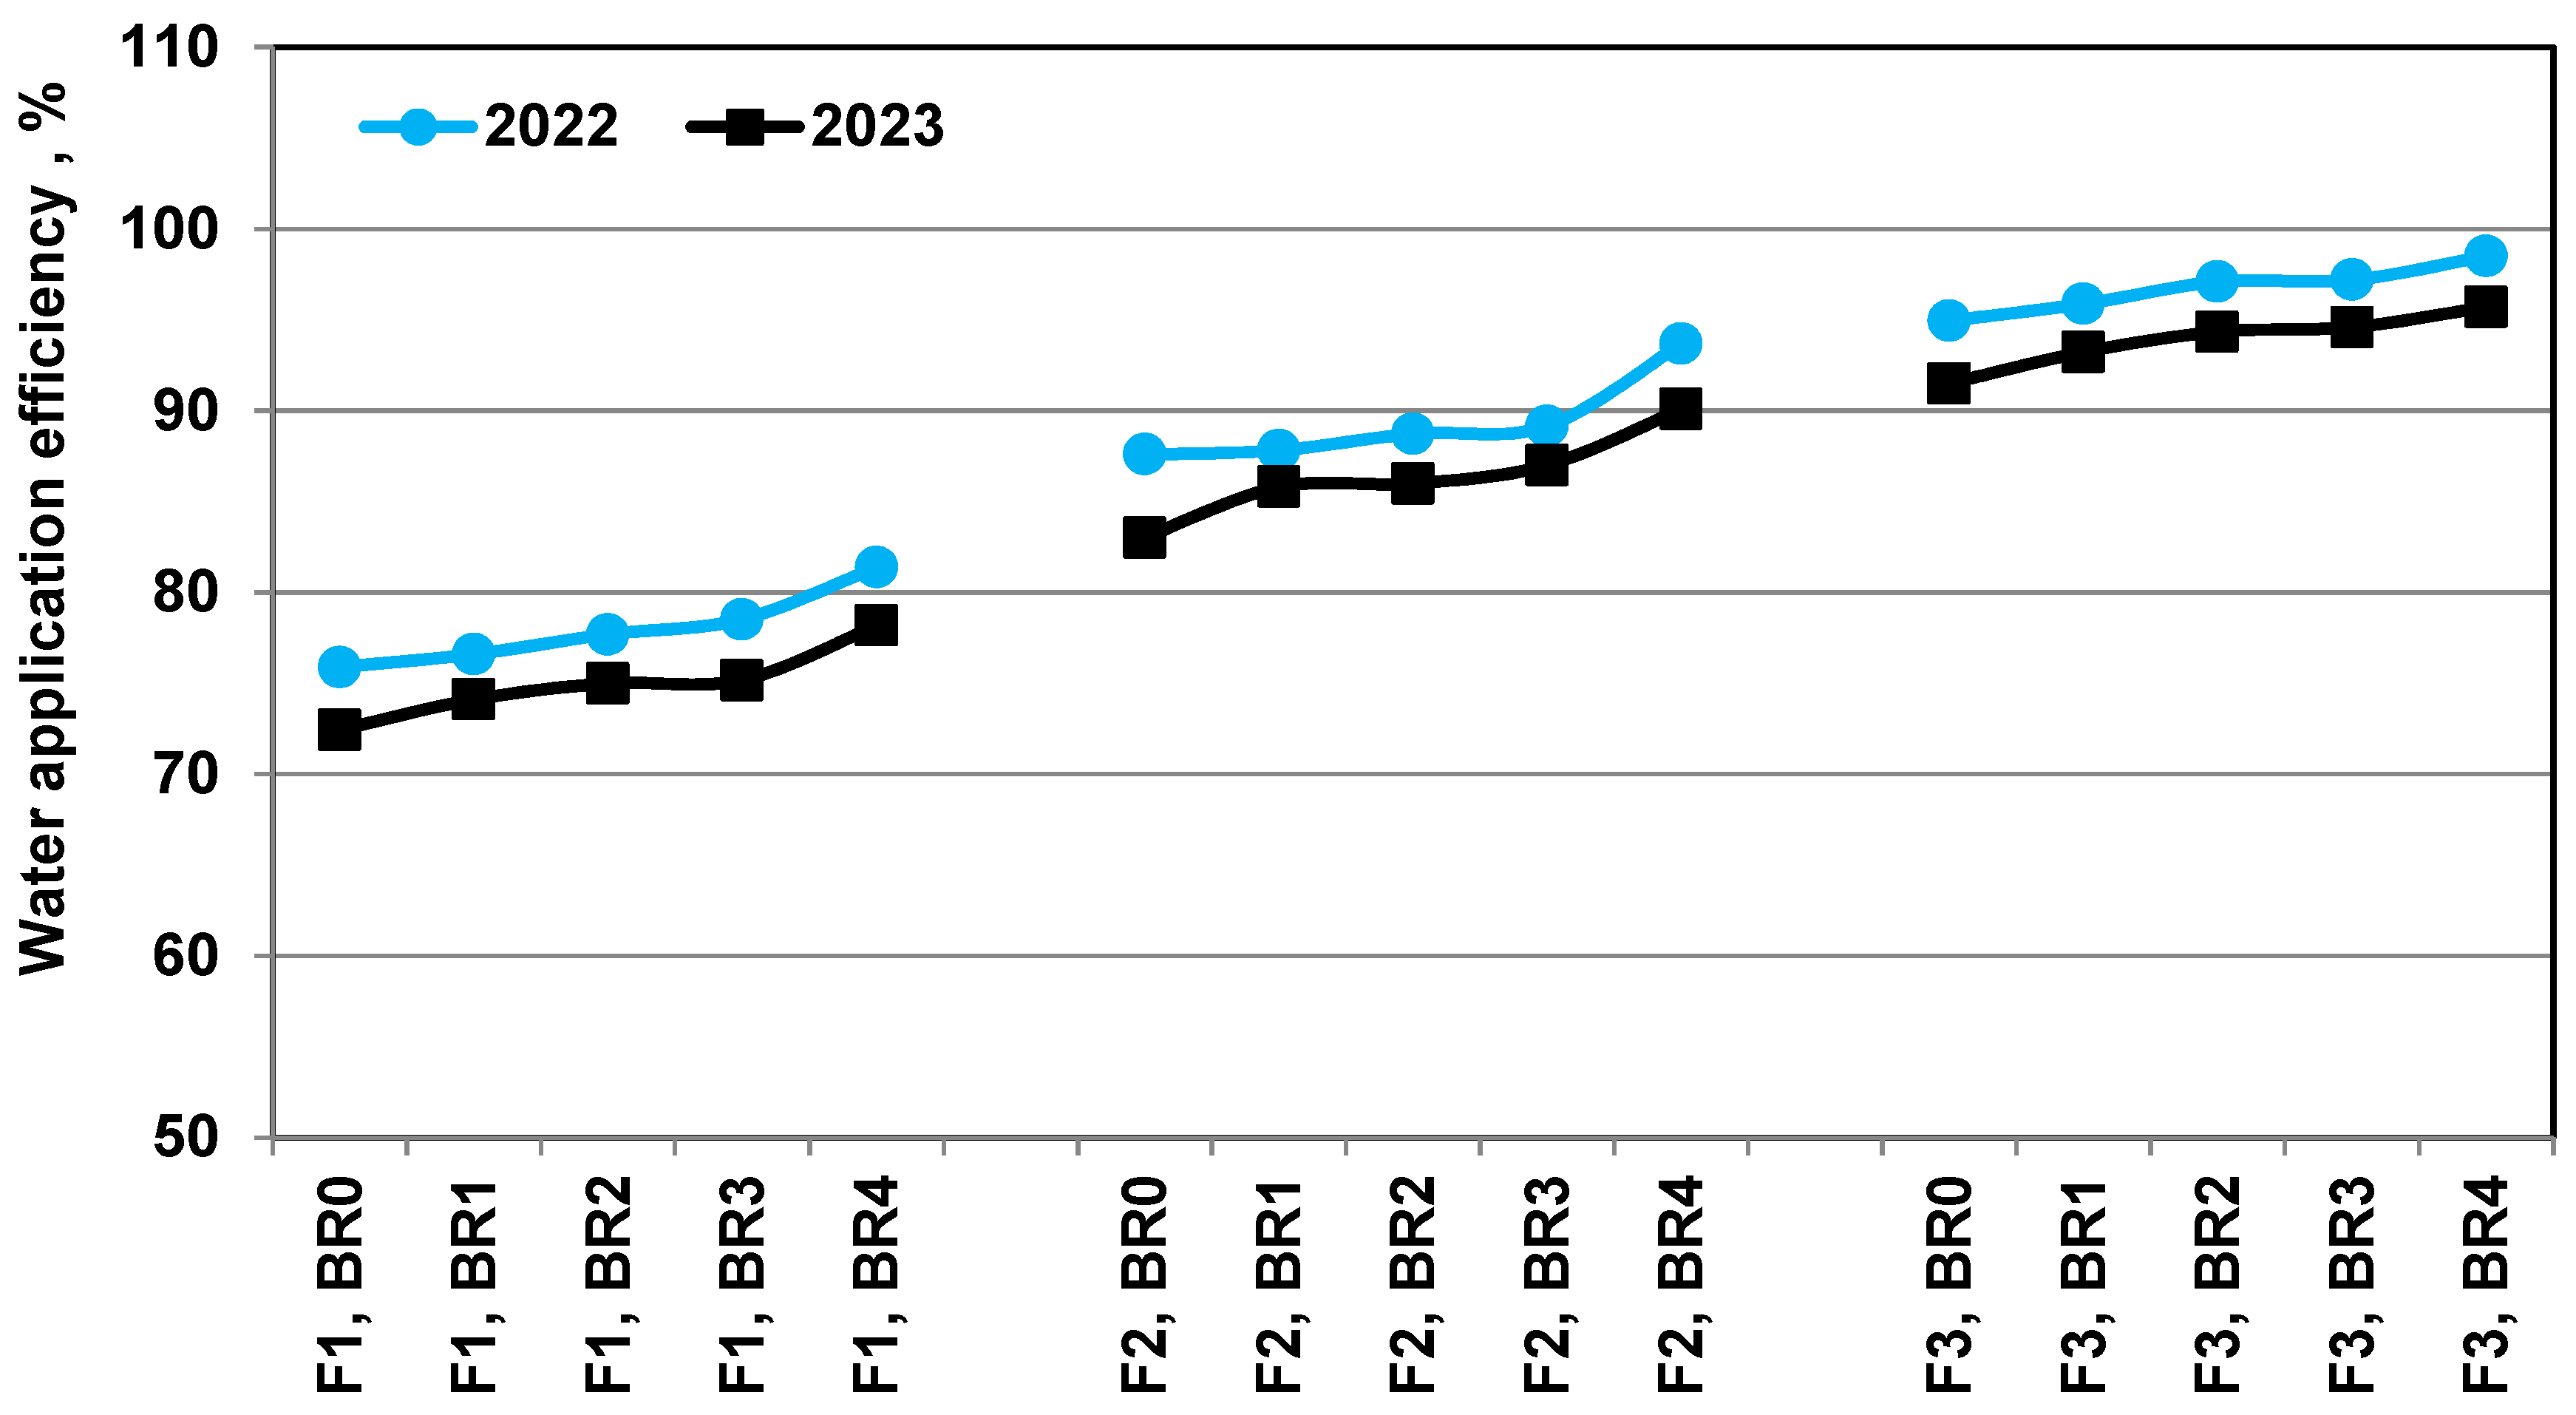
The study results, depicted in Figure 8, demonstrate the positive influence of low irrigation and biochar application rates on the application efficiency of irrigation water (AEIW). Both seasons exhibited an increase in AEIW when the quantity of irrigation water used was reduced and the biochar application rate was increased. The 2022 and 2023 seasons displayed higher AEIW values with 100% full irrigation (FI) and no biochar addition (75.9% and 72.44% for 2022 and 2023, respectively), as well as with 60% FI and an addition of 11 tons ha−1 (98.5% and 95.7% for 2022 and 2023, respectively).
This increase in AEIW can be attributed to two factors: water conservation and reduction of water movement from the rhizosphere (deep percolation). By lowering the quantity of irrigation water within the rhizosphere, both water stress on cucumber plants, caused by inadequate water supply, and the volume of water leaving the root zone via deep percolation, are reduced. Additionally, the increment in the used biochar rate enhances the water holding capacity within the rhizosphere. These findings align with previous studies which discuss the positive effect of biochar on the soil water holding capacity [8,10,11,14,15,27,28,31,37].

3.4. Yield of Cucumber

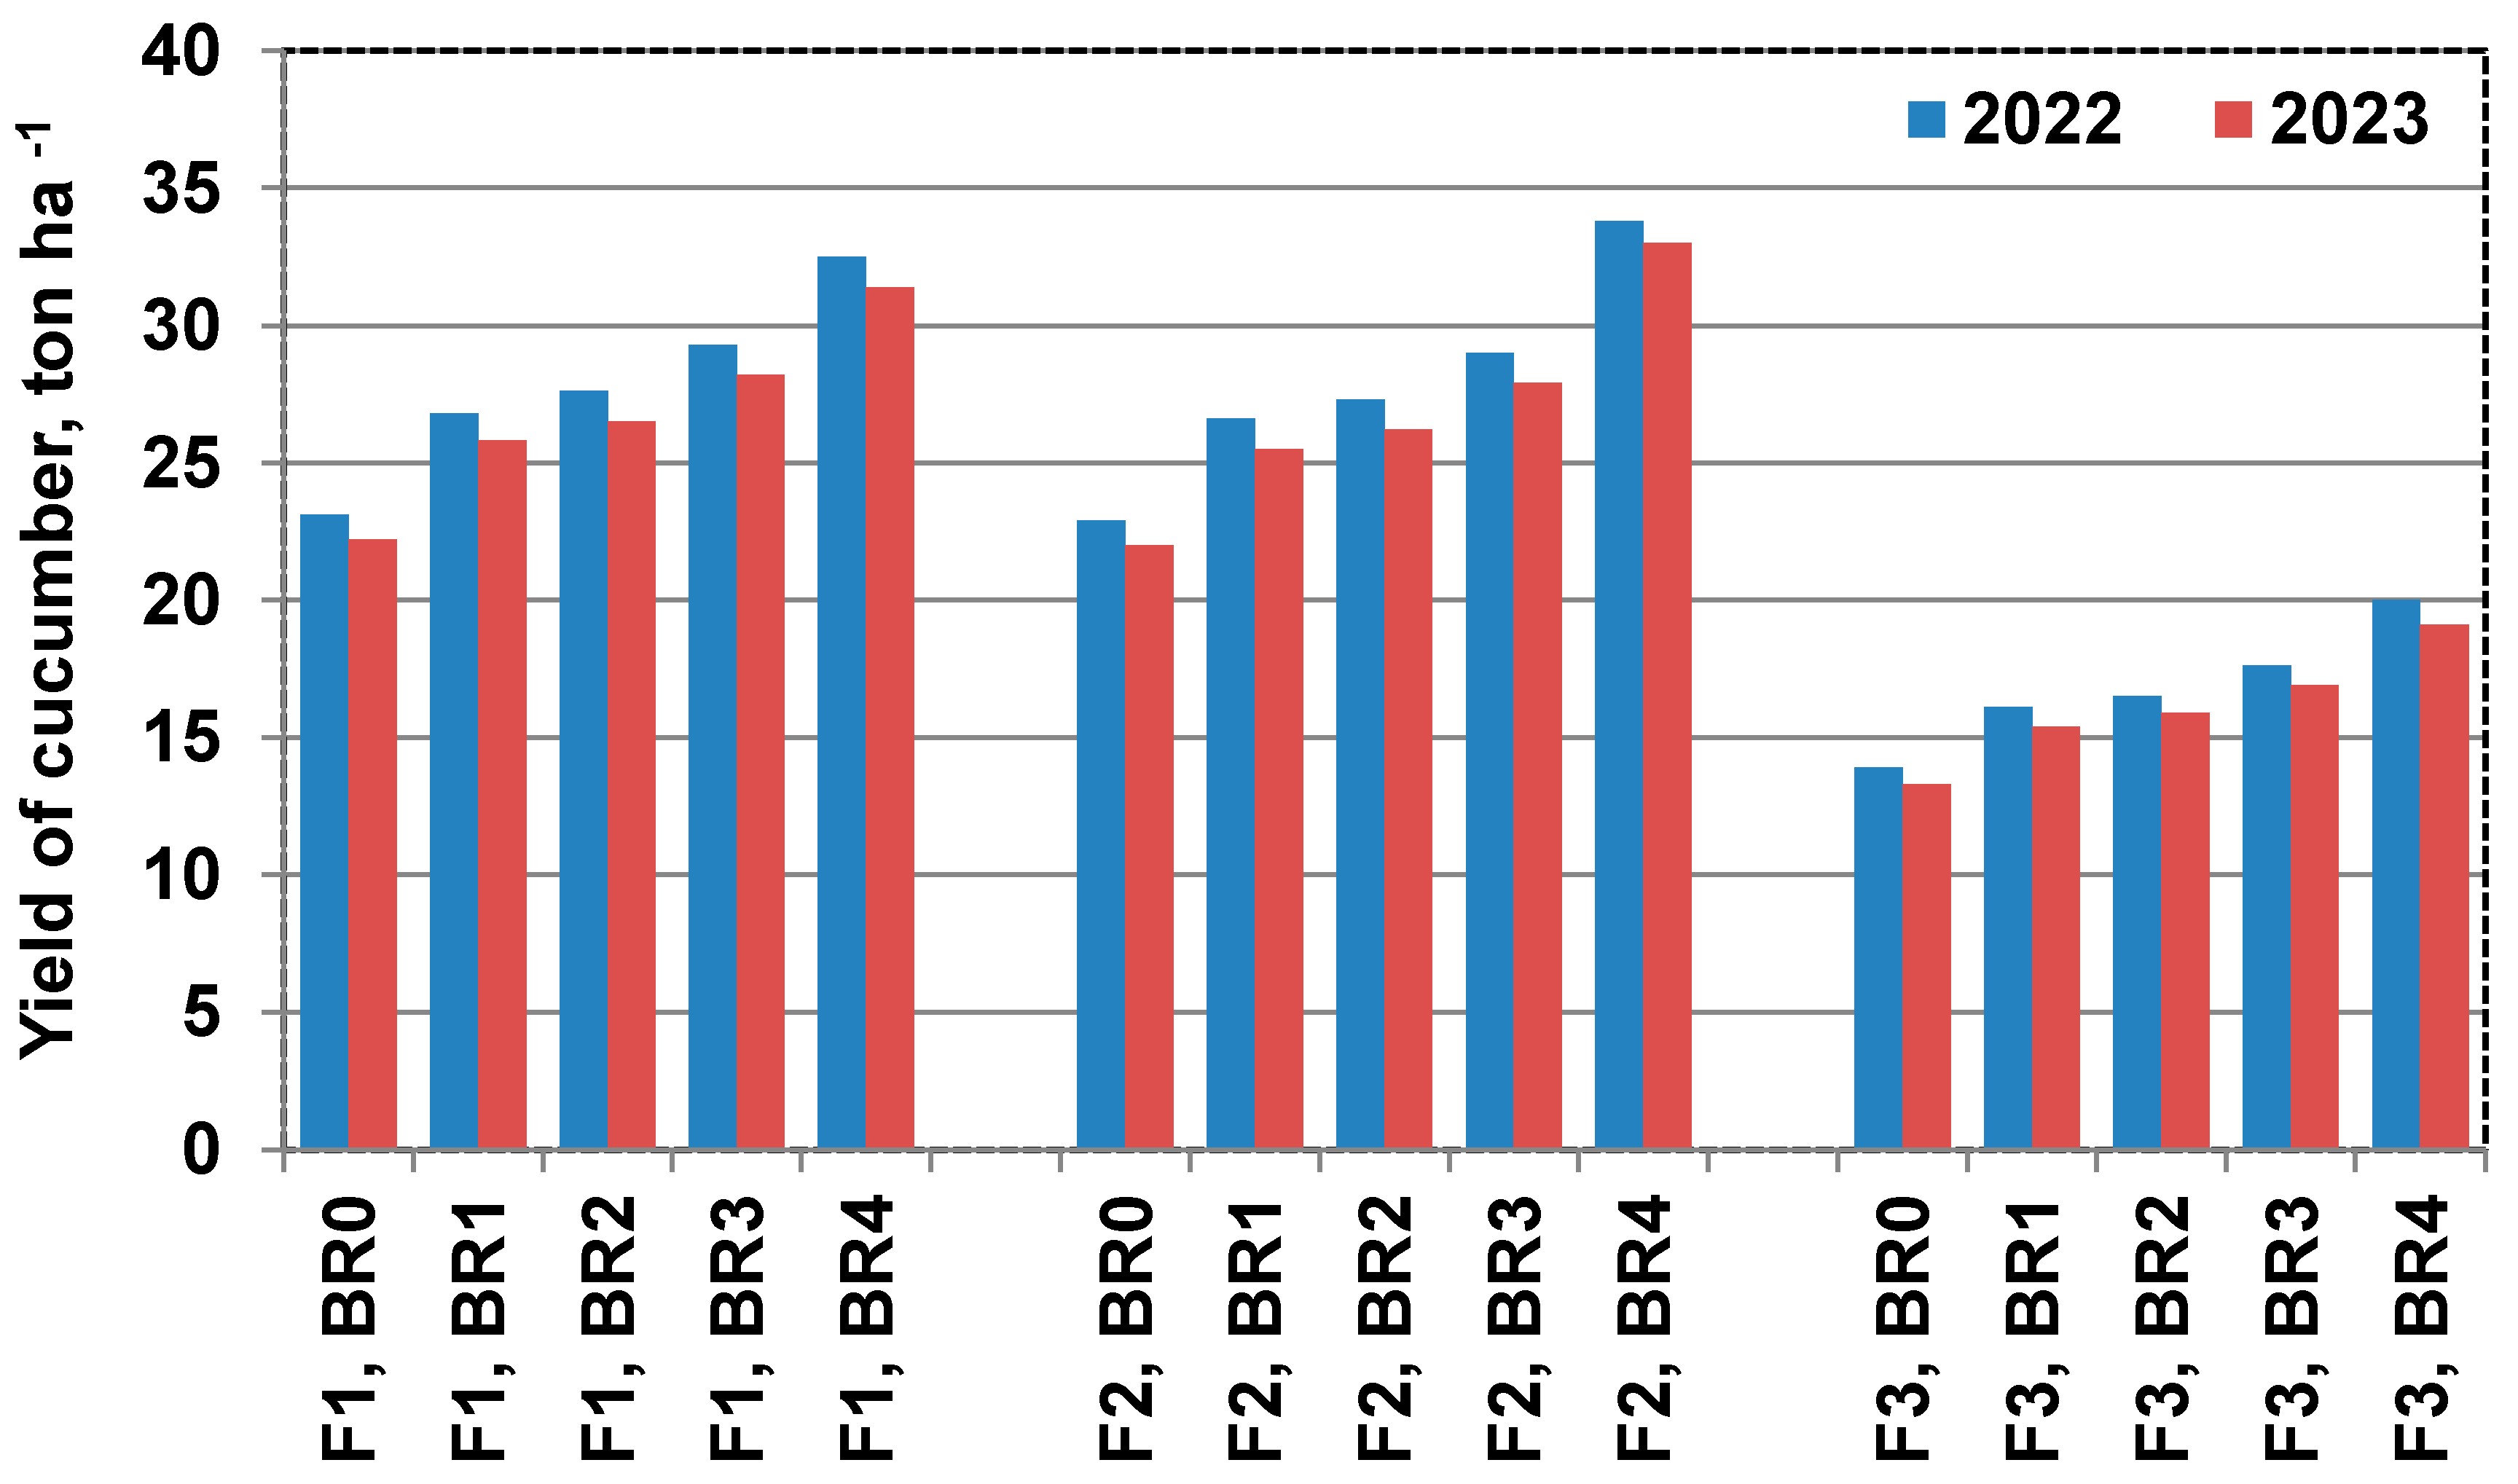
The effect of low irrigation on cucumber yield (“Y”) is presented in Figure 9 and Table 4. The results revealed that reducing irrigation water to 100% or 80% of full irrigation did not significantly affect Y. However, irrigation at 60% of full irrigation during the 2022 and 2023 planting seasons strongly affected Y. No considerable change was recorded in Y values between 100 and 80% full irrigation during both seasons. This convergence in Y values may be attributed to the increased concentration of mineral fertilizers in the rootstock propagation zone of cucumber plants when irrigated with 80% full irrigation. These findings align with previous studies [37,38].
The impact of the utilized biochar rate on Y is depicted in Figure 9 and Table 4. Y values varied significantly based on the rate of biochar application. The best Y values were observed due to biochar application (11 tons per hectare), whilst the lowest ones were observed in the absence of the biochar addition during both 2022 and 2023. The increment in Y can be attributed to two reasons: (1) an elevated biochar application rate improved the sandy soil’s water retention capacity within the rhizosphere, thereby enhancing the available soil water index and lowering the water stress in the cucumber plant’s rhizosphere; and (2) the presence of biochar enhanced the availability of nutrients in the growing medium by mechanically retaining water and mineral fertilizers in the biochar’s pores and pockets. These results are consistent with previous studies [39,40,41].
The interactive effect between levels of irrigation deficiency and biochar rates which were added to sandy soils on cucumber yield (Y) is presented in Figure 9 and Table 4. The results showed that reducing water stress and increasing the biochar application rate positively influenced Y. The highest Y values were achieved at 80% of full irrigation (FI) with 11 tons/ha of biochar, reaching 33.8 tons/ha and 33 tons/ha in the 2022 and 2023 seasons, respectively.
There are several possible explanations for the increase in Y at 80% FI with 11 tons/ha of biochar. Firstly, irrigation at 80% FI reduced the total volume of water lost through deep percolation, resulting in an increment in rates of mineral fertilizers in the root zone. This increased availability of nutrients made them more accessible to cucumber plants, positively impacting their growth and yield. Secondly, the increased biochar levels enhanced the water holding capacity of the root zone, resulting in the improved available extractable irrigation water (AEIW) and reduced water stress for the plants. Lastly, the increased biochar application rate also contributed to enhanced nutrient availability in the growing medium. This was achieved through the retention of water and fertilizers in pores and pockets of biochar, making them more accessible to the cucumber plants.
These results are in agreement with other studies which demonstrated the positive impacts of reducing water stress, increasing biochar application rates, and improving nutrient availability on crop yield [42,43,44,45].

3.5. Water Productivity

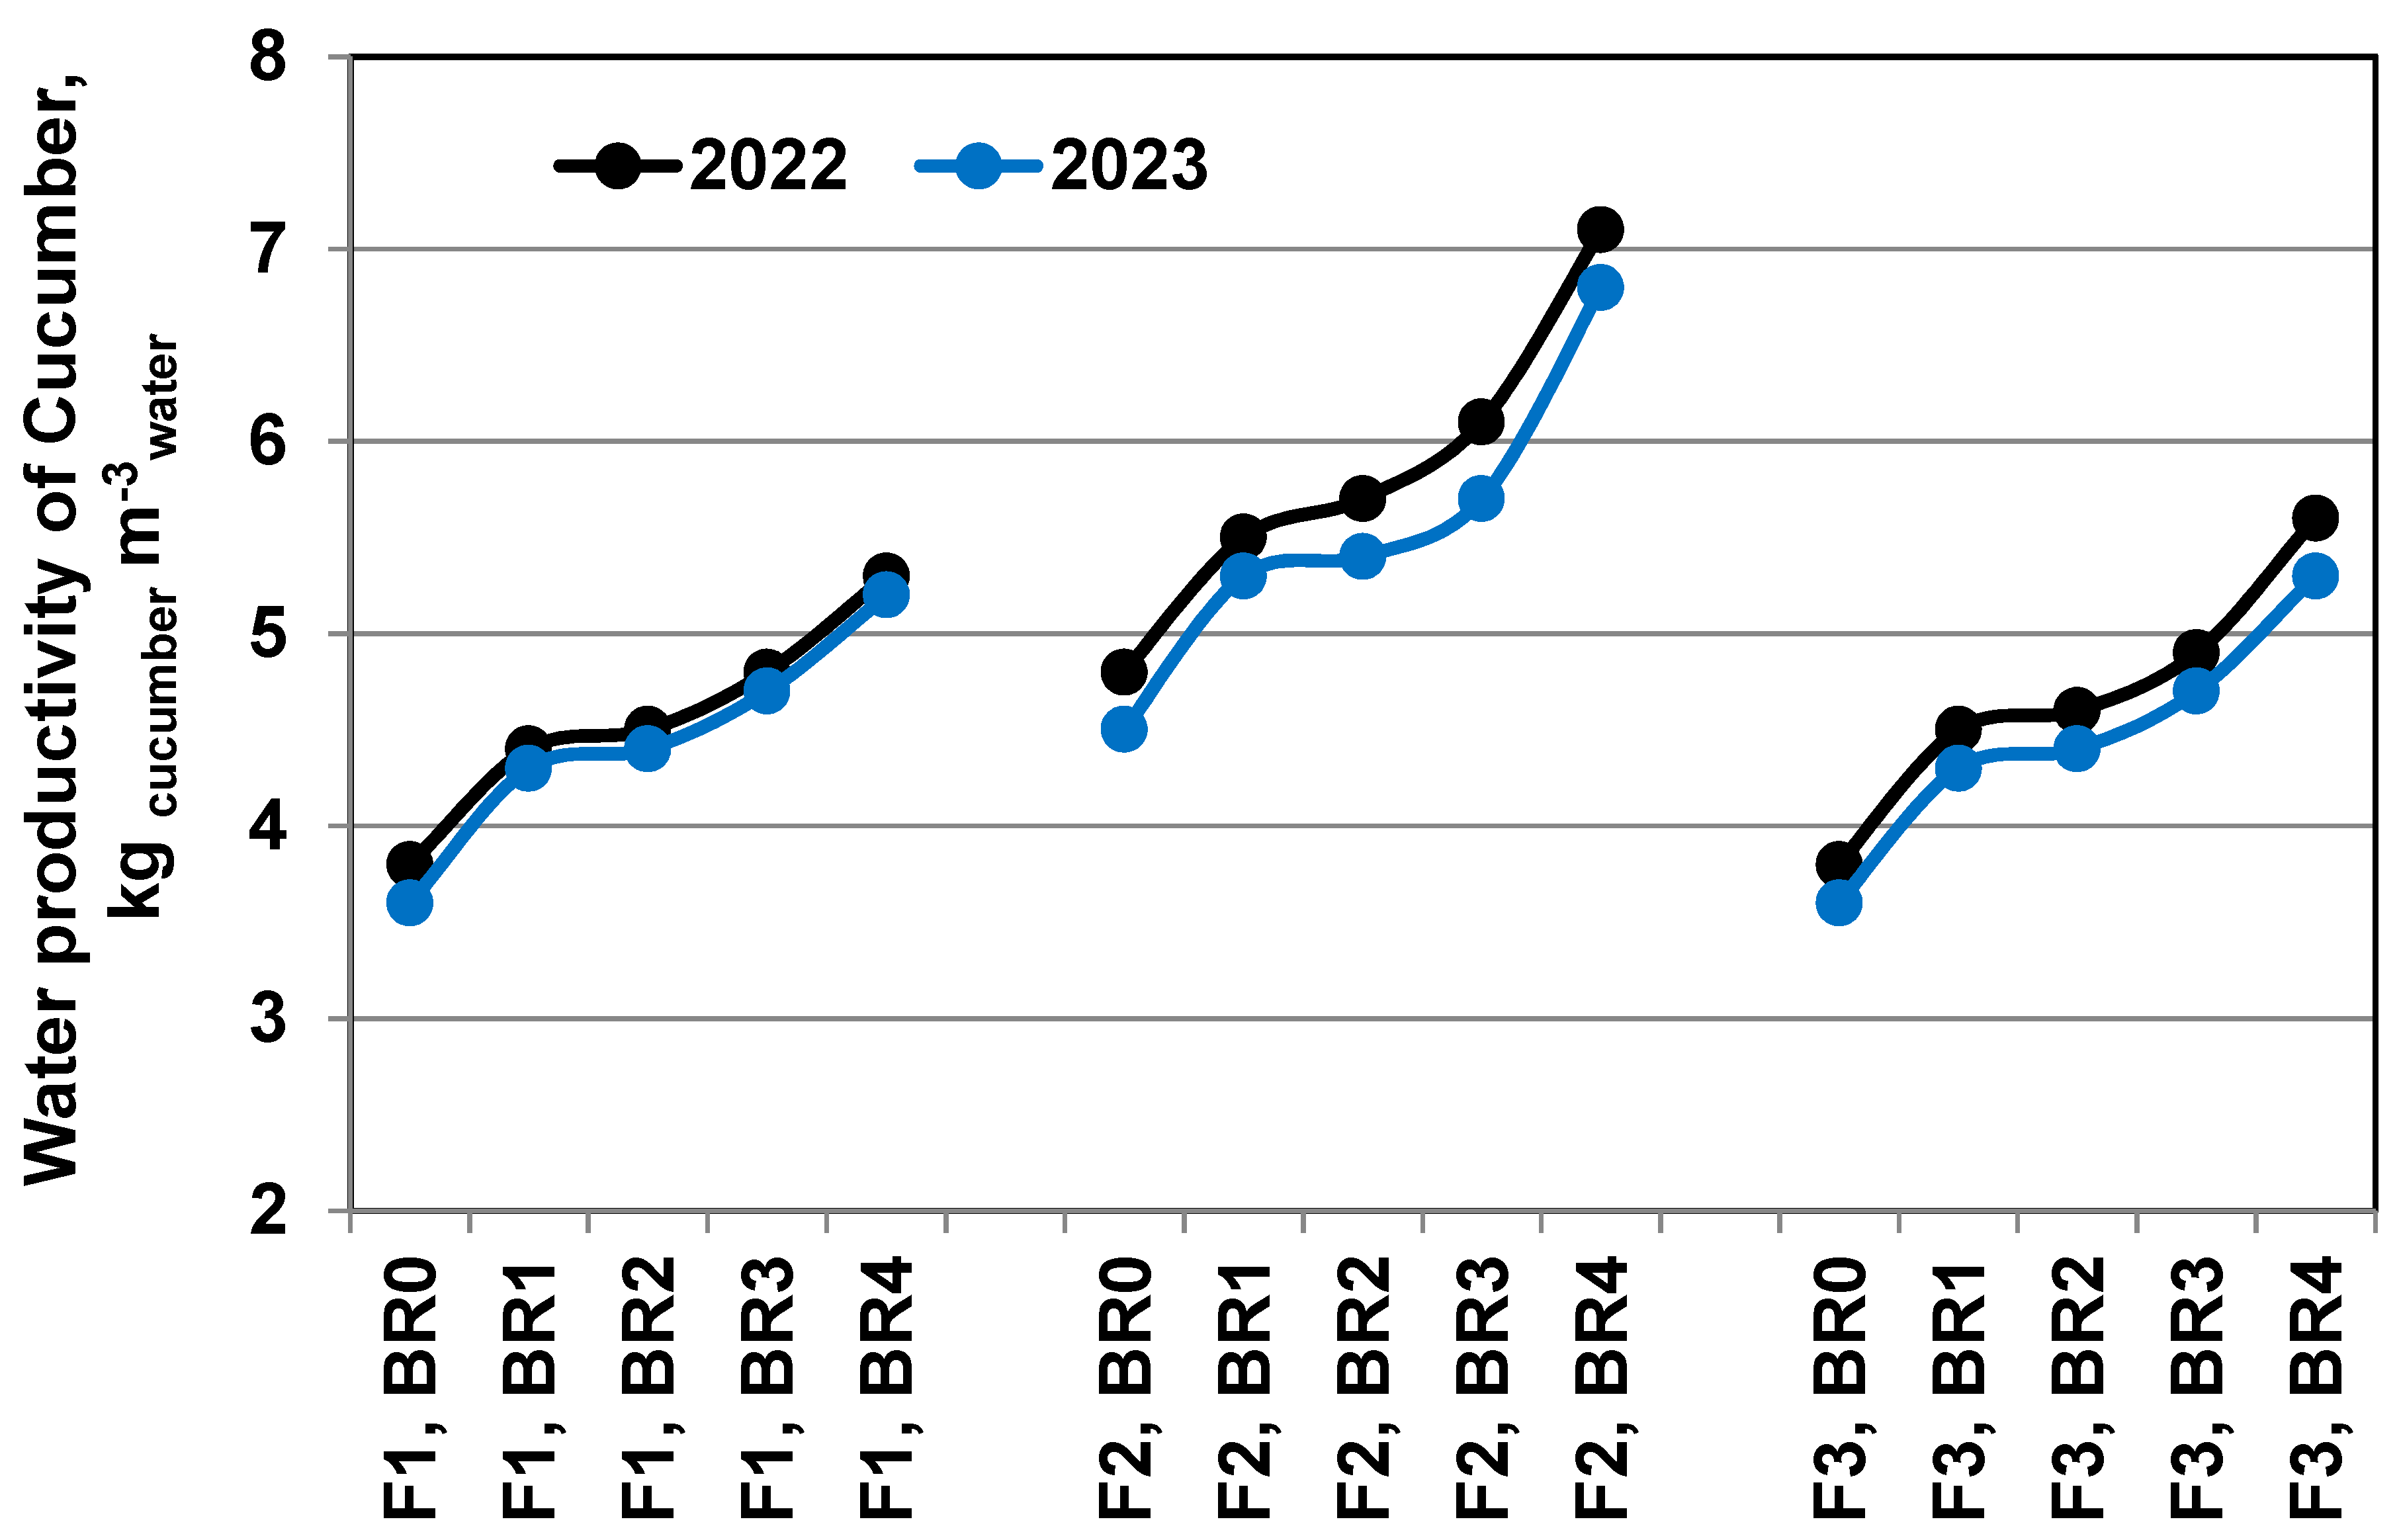
Deficit irrigation increased the water productivity (WP) of cucumbers. Water productivity increased with increasing cucumber crop productivity and decreasing irrigation water use. The highest water productivity for cucumbers was 5.8 and 5.5 kg cucumber m−3 water in the 2022 and 2023 seasons, respectively, at 80% of full irrigation [45].
The relationship between the biochar rate and WPcucumber yield was shown in Figure 10 and Table 4. The yield of WPcucumber varied considerably with the biochar application rate during the 2022 and 2023 seasons. The highest WPcucumber yield was recorded when 11 tons ha−1 of biochar were used, while the lowest yield was recorded when no biochar was applied during the 2022 and 2023 seasons. The increase in the yield of WPcucumber can be attributed to the same reasons reported in the literature [46].
Irrigation deficiency and the biochar application rate had an interactive effect on the water productivity (WP) of cucumbers, as shown in Figure 10 and Table 4. Reducing water stress and increasing the biochar application rate both increased WP. Biochar application at 11 t ha−1 under irrigation at 80% full irrigation (FI) resulted in the best WP values during the 2022 and 2023 seasons, whilst the lowest WP was observed due to irrigation at 60% FI without biochar addition.

3.6. Quality Traits of Cucumber

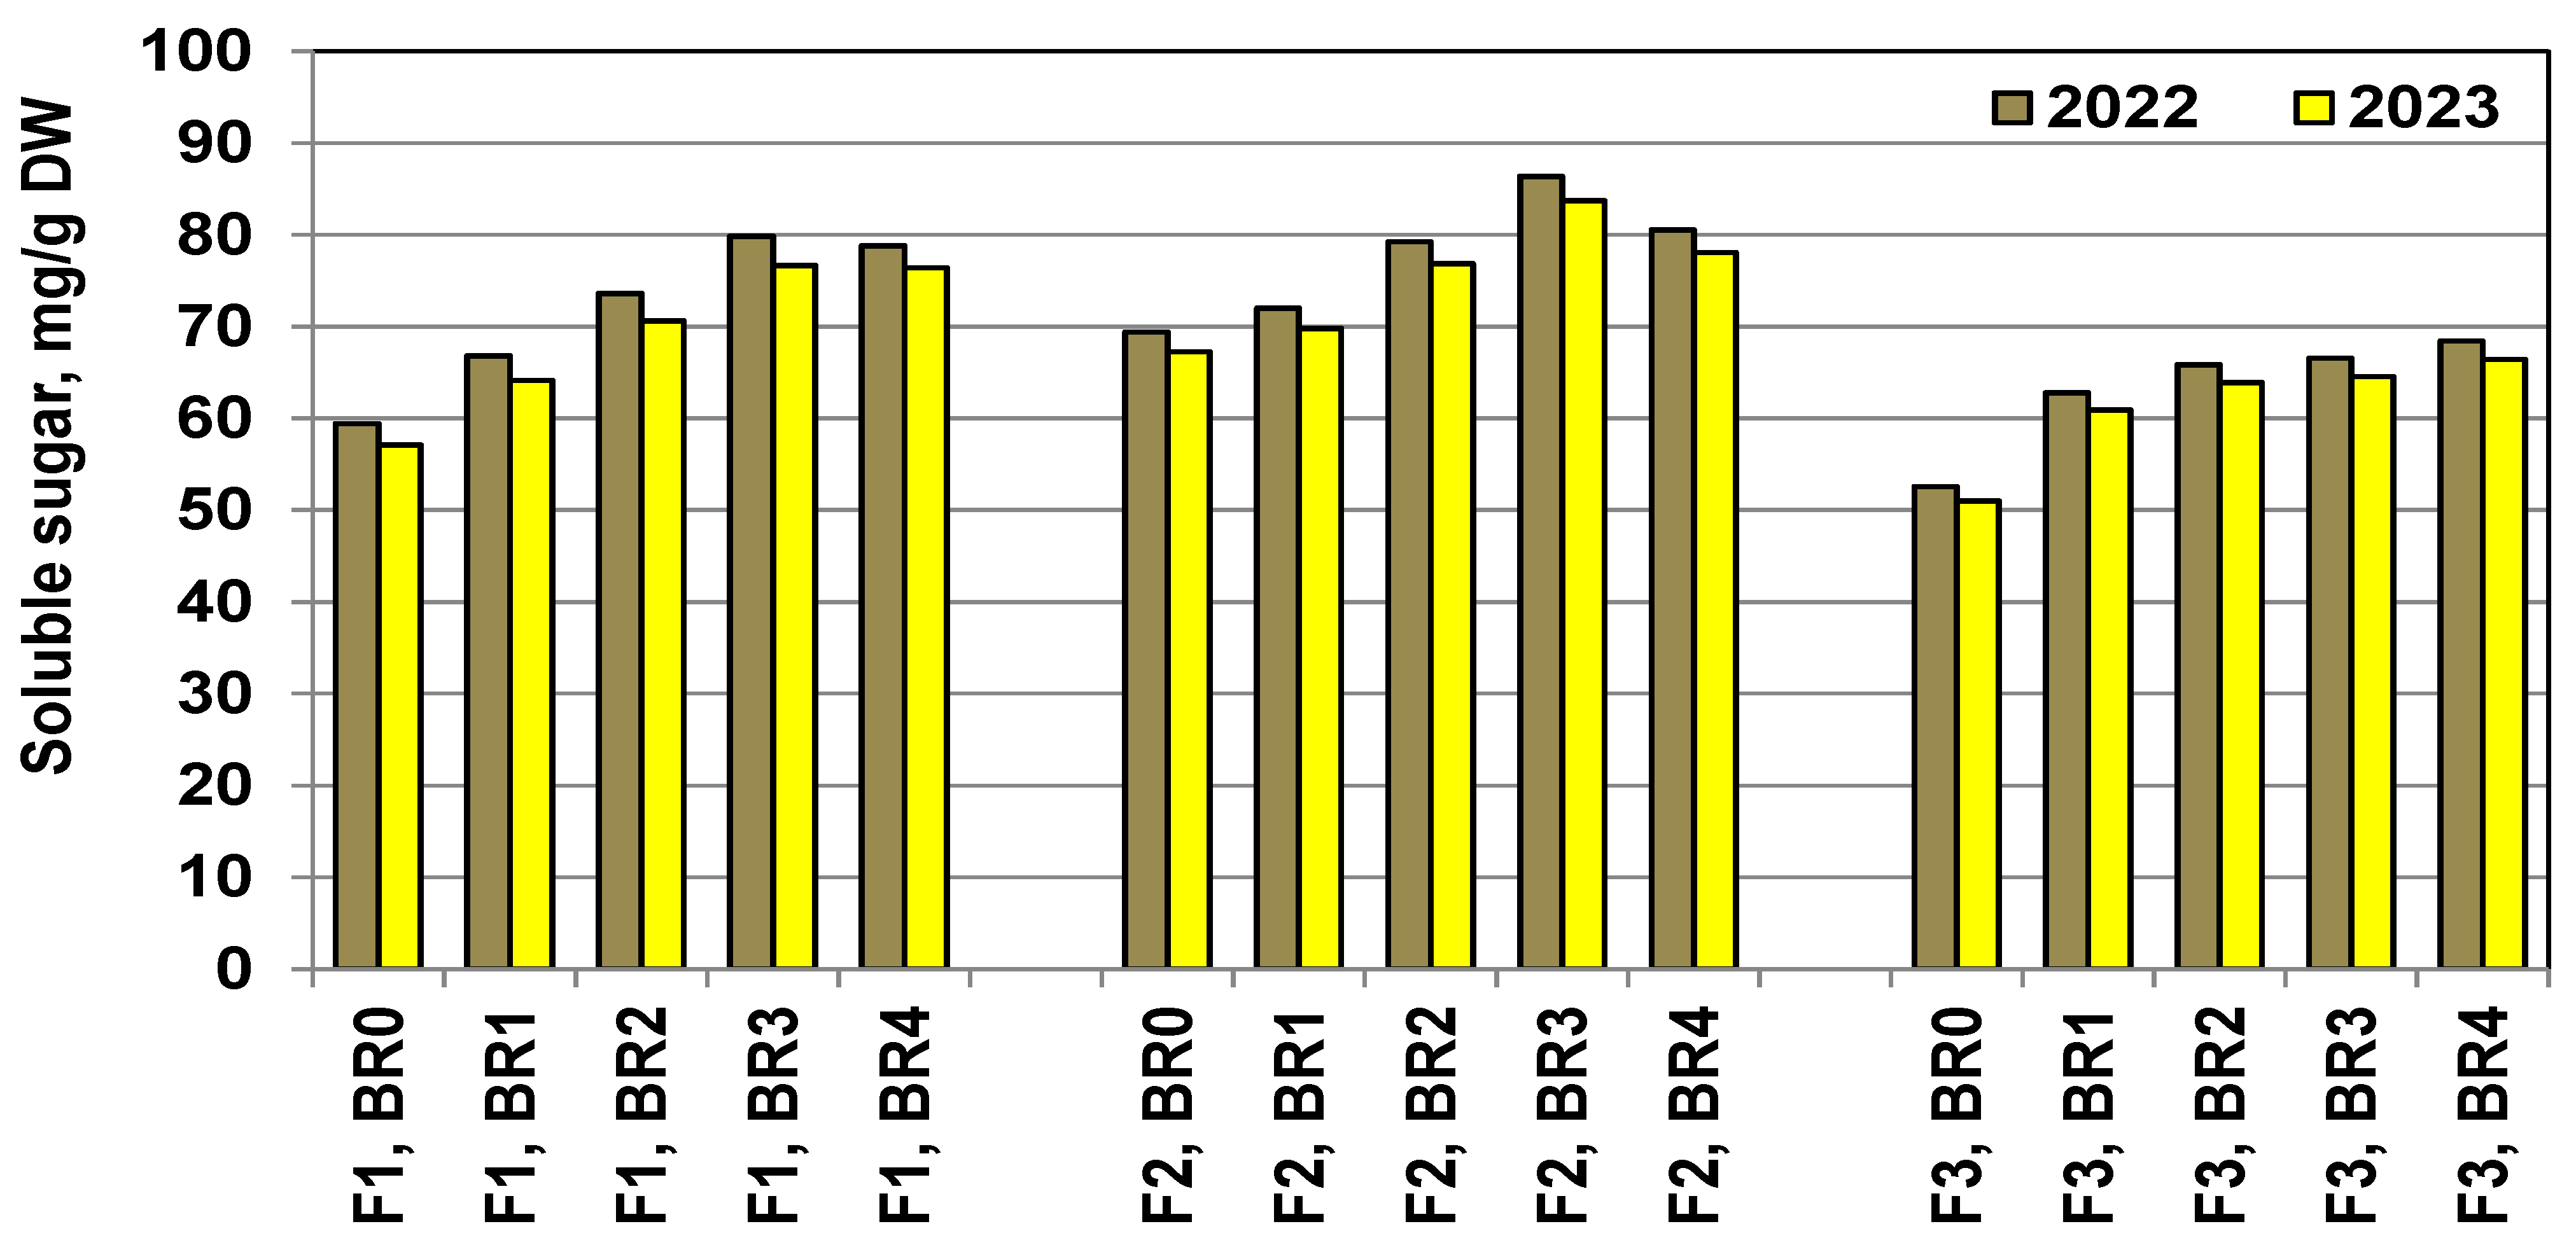
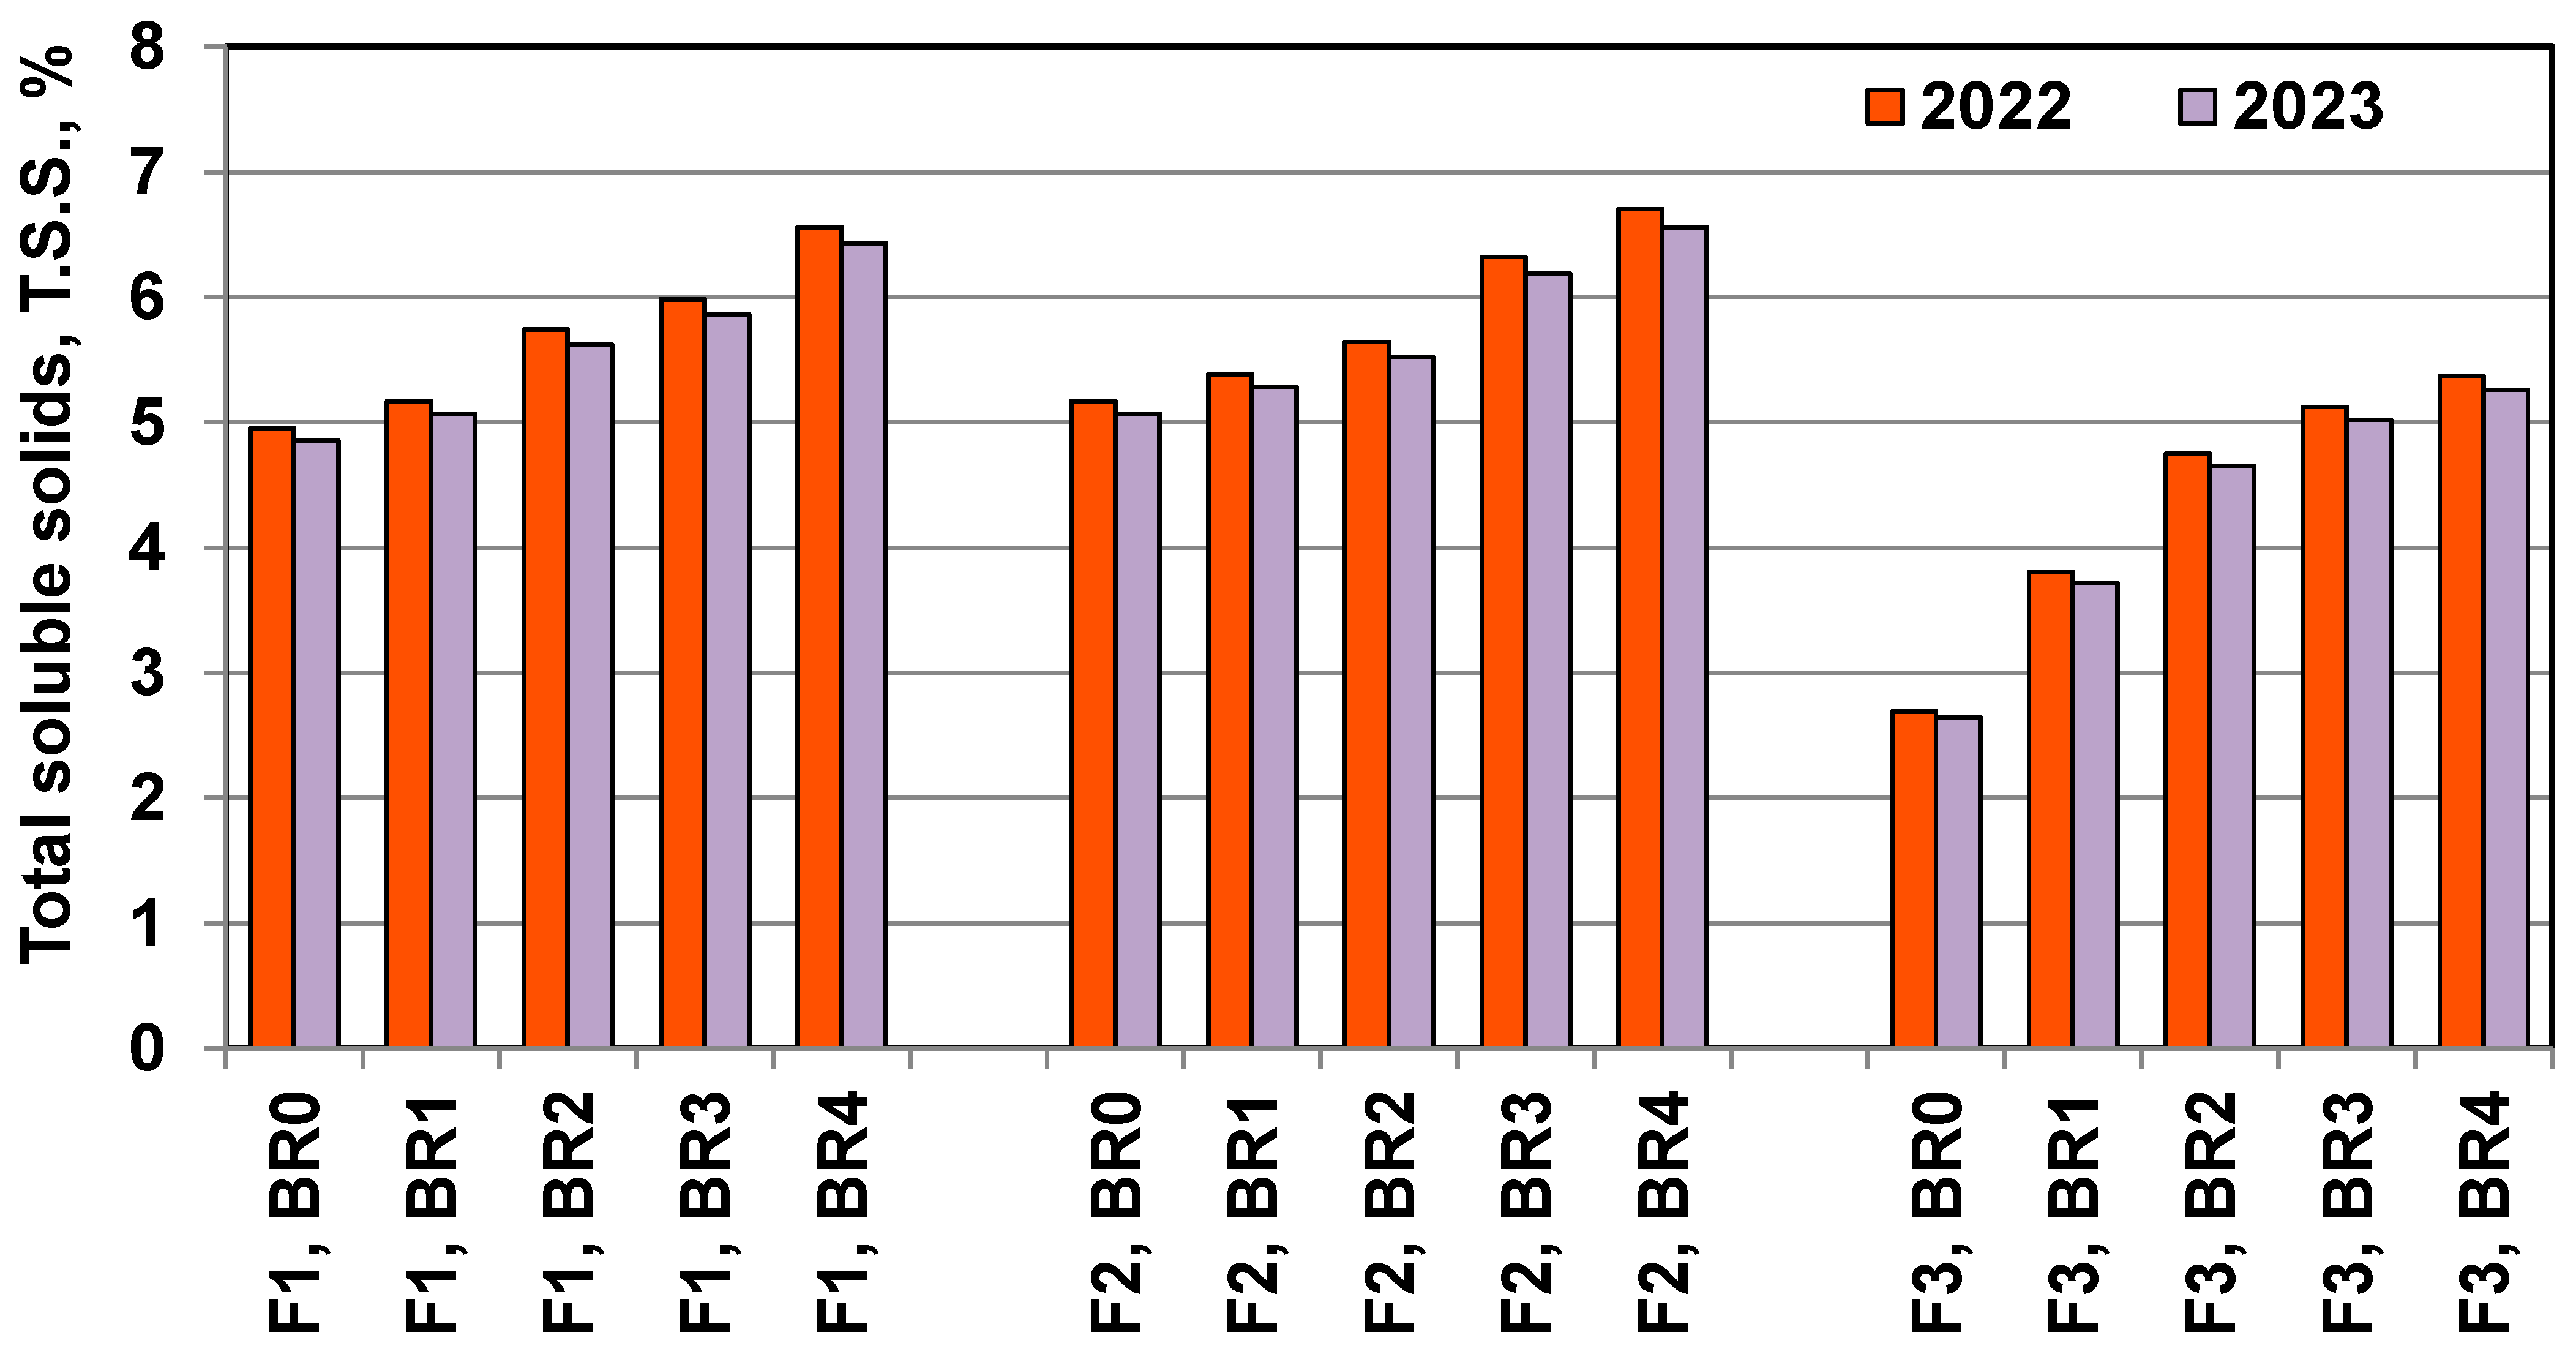
Figure 11, Figure 12 and Figure 13 and Table 5 indicate the effects of deficit irrigation on vitamin C (VC), soluble solids content (SSC), and total soluble solids (TSS) in cucumbers in the 2022 and 2023 growing seasons. The results showed that the highest VC, SSC, and TSS values were generally obtained with 80% field irrigation (FI), while the lowest values were obtained with 60% FI.
The effect of the application rate of biochar on VC, SSC, and TSS of cucumber: Figure 11, Figure 12 and Figure 13 and Table 5 show the effect of the biochar application level on cucumber VC, SSC, and TSS. The biochar application rate significantly affected cucumber vegetative growth, SSC, and TSS. The highest VC, SSC, and TSS were recorded at 11 tons ha−1, whilst the lowest were observed in the absence of biochar in both 2022 and 2023. These increases may be due to biochar’s ability to improve water holding capacity and nutrient availability [47,48,49].
Deficit irrigation (FI) and the biochar application rate had a positive interactive effect on VC, SSC, and TSS in cucumbers (Figure 11, Figure 12 and Figure 13 and Table 5). VC, SSC, and TSS values increased as FI decreased and the biochar application rate increased. This was observed in both the 2022 and 2023 seasons. The highest VC, SSC, and TSS values were recorded with 80% FI and 11 tons ha−1 biochar application in both seasons. While 100% FI with 11 tons ha−1 biochar application also achieved high VC, SSC, and TSS values, 80% FI with 11 tons ha−1 biochar application is recommended because it has the highest water productivity for cucumbers.
The main causes of enhanced VC, SSC, and TSS in cucumbers under 80% FI and 11 tons ha−1 biochar application may be attributed to the following: reduced water loss through deep percolation due to 80% FI, which increased the mineral fertilizer concentration in the root zone and nutrient uptake; increased water holding capacity of the root zone due to the increased biochar application rate, which enhanced water stress mitigation; and increased nutrient availability due to biochar degradation. These results are consistent with previous findings [48,49].

4. Conclusions

Decreasing irrigation and increasing the biochar application rate improved water stress in the rhizosphere, water use efficiency, yield, water productivity, as well as some cucumber quality traits. The highest YC and quality traits were achieved in the 2022 and 2023 seasons with 80% field irrigation and 11 tons ha−1 biochar application. Based on the BET, BJH, and isotherms results, the activated sugarcane has a large surface area and pore volume that is crucial for its applications as an adsorbent. The isotherms are type I, which is characteristic of a microporous material, indicating that the activated sugarcane has pores that are smaller than 2 nm. The main causes of improving cucumber yield (Y) and quality traits under irrigation with 80% field irrigation (FI) and 11 tons ha−1 biochar application may be the following: (1) Reduced deep percolation—applying 80% FI reduces the total water volume that leaves the root zone through deep percolation. This improves the mineral fertilizers level in the rhizosphere and enhances nutrient uptake by the plants. (2) Improved water holding capacity—the increment in the biochar level improves the water holding capacity of the rhizosphere, which leads to the increased available effluent irrigation water (AEIW). (3) Increased nutrient availability—increasing the biochar increases the availability of nutrients to the plants.
The results of this study suggest that an irrigation deficit using 80% FI with a biochar application at 11 tons ha−1 is the most effective treatment for cucumber cultivation in arid Egyptian conditions. It saves 20% of water requirements and can be recommended for adoption by farmers.

Author Contributions

Conceptualization, A.E.H.; Software, M.A.A.A., M.G.A. and A.E.H.; Formal analysis, M.B.; Investigation, M.A.A.A. and R.E.A.; Data curation, A.E.H.; Writing—original draft, M.G.A. and R.E.A.; Writing—review & editing, Y.M.R., A.M.A.-E. and M.H.; Supervision, Y.M.R. and A.M.A.-E. All authors have read and agreed to the published version of the manuscript.

Funding

This work was funded by King Saud University, Riyadh, Saudi Arabia through the Researchers Supporting Project number (RSPD2024R676).

Institutional Review Board Statement

Not applicable.

Informed Consent Statement

Not applicable.

Data Availability Statement

Data that support the findings of this study are available from the corresponding authors upon reasonable request.

Acknowledgments

The authors extend their appreciation to the Researchers Supporting Project number (RSPD2024R676), King Saud University, Riyadh, Saudi Arabia.

Conflicts of Interest

The authors declare no conflicts of interest.

References

  1. Abdelraouf, R.E.; Okasha, E.M.; Tarabye, H.H.H. Modified Design for Drip Irrigation System to Improve the Productivity of Irrigation Water and Fertilizers Distribution. Int. J. ChemTech Res. 2016, 9, 40–52. Available online: http://www.sphinxsai.com/2016/ch_vol9_no9/1/(40-52)V9N9CT.pdf (accessed on 1 January 2020).
  2. Bakari, R.; Kivevele, T.; Huang, X.; Jande, Y.A.C. Simulation and optimisation of the pyrolysis of rice husk: Preliminary assessment for gasification applications. J. Anal. Appl. Pyrolysis 2020, 150, 104891. [Google Scholar] [CrossRef]
  3. Okasha, E.M.; Abdelraouf, R.E.; Abdou, M.A.A. Effect of Land Leveling and Water Applied Methods on Yield and Irrigation Water Use Efficiency of Maize (Zea mays L.) Grown under Clay Soil Conditions. World Appl. Sci. J. 2013, 27, 183–190. [Google Scholar]
  4. Hafez, M.; Sally, F.; Abo El-Ezz Popov, A.I.; Rashad, M. Organic Amendments Combined with Plant Growth-Promoting Rhizobacteria (Azospirillum brasilense) as an Eco-Friendly By-Product to Remediate and Enhance the Fertility of Saline Sodic-Soils in Egypt. Commun. Soil Sci. Plant Anal. 2021, 52, 1416–1433. [Google Scholar] [CrossRef]
  5. Adeyemi, O.; Keshavarz-Afshar, R.; Jahanzad, E.; Battaglia, M.L.; Luo, Y.; Sadeghpour, A. Effect of wheat cover crop and split nitrogen application on corn yield and nitrogen use efficiency. Agronomy 2020, 10, 1081. [Google Scholar] [CrossRef]
  6. Adnan, M.; Fahad, S.; Zamin, M.; Shah, S.; Mian, I.A.; Danish, S.; Zafar-ul-Hye, M.; Battaglia, M.L.; Naz, R.M.M.; Saeed, B.; et al. Coupling phosphate-solubilizing bacteria with phosphorus supplements improve maize phosphorus acquisition and growth under lime induced salinity stress. Plants 2020, 9, 900. [Google Scholar] [CrossRef] [PubMed]
  7. Diatta, A.A.; Fike, J.H.; Battaglia, M.L.; Galbraith, J.; Baig, M.B. Effects of biochar on soil fertility and crop productivity in arid regions: A review. Arab. J. Geosci. 2020, 13, 595. [Google Scholar] [CrossRef]
  8. Diatta, A.A.; Thomason, W.E.; Abaye, O.; Thompson, T.L.; Battaglia, M.L.; Vaughan, L.J.; Lo, M.; Leme, J.F.D.C. Assessment of nitrogen fixation by mungbean genotypes in different soil textures using 15N natural abundance method. J. Soil Sci. Plant Nutr. 2020, 20, 2230–2240. [Google Scholar] [CrossRef]
  9. Robertson, J. Diamond-like amorphous carbon. Mater. Sci. Eng. R Rep. 2002, 37, 129–281. [Google Scholar] [CrossRef]
  10. Seleiman, M.F.; Almutairi, K.F.; Alotaibi, M.; Shami, A.; Alhammad, B.A.; Battaglia, M.L. Nano fertilization as an emerging fertilization technique: Why modern agriculture can benefit from its use? Plants 2021, 10, 2. [Google Scholar] [CrossRef]
  11. Seleiman, M.F.; Alotaibi, M.A.; Alhammad, B.A.; Alharbi, B.M.; Refay, Y.; Badawy, S.A. Effects of ZnO nanoparticles and biochar of rice straw and cow manure on characteristics of contaminated soil and sunflower productivity, oil quality, and heavy metals uptake. Agronomy 2020, 10, 790. [Google Scholar] [CrossRef]
  12. Seleiman, M.F.; Kheir, A.M.S. Maize productivity, heavy metals uptake and their availability in contaminated clay and sandy alkaline soils as affected by inorganic and organic amendments. Chemosphere 2018, 204, 514–522. [Google Scholar] [CrossRef] [PubMed]
  13. Bhagyawant, R.G.; Gorantiwar, S.D.; Dahiwalkar, S.D. Effect of Deficit Irrigation on Crop Growth, Yield and Quality of Onion under Surface Irrigation. Am.-Eurasian J. Agric. Environ. Sci. 2015, 15, 1672–1678. [Google Scholar]
  14. Lal, R. Carbon sequestration in dryland ecosystems. Environ. Manag. 2004, 33, 528–544. [Google Scholar] [CrossRef] [PubMed]
  15. Lehmann, J. Bio-energy in the black. Front. Ecol. Environ. 2003, 5, 381–387. [Google Scholar] [CrossRef]
  16. Guiller, K.E.; Cádiz, J.; Ehaloitis, C.; Sácala, W.D.; Mafongoya, P.L. Building soil nitrogen capital in Africa. In Replenishing Soil Fertility in Africa; Buresh, R.J., Sanchez, P.A., Eds.; SSSA Special Publication; Soil Science Society of America, Inc.: Madison, WI, USA, 1997; Volume 51, pp. 151–192. [Google Scholar]
  17. Goyal, S.; Chander, K.; Mundra, M.C.; Kapoor, K.K. Influence of inorganic fertilizers and organic amendments on soil organic matter and soil microbial properties under tropical conditions. Biol. Fertil. Soils 1999, 29, 196–200. [Google Scholar] [CrossRef]
  18. Gregg, S.J.; Sing, K.S.W. Adsorption, Surface Area and Porosity; Academic: London, UK, 1982. [Google Scholar]
  19. Abdelraouf, R.E.; Abou-Hussein, S.D.; Abd-Alla, A.M.; Abdallah, E.F. Effect of Short Irrigation Cycles on Soil Moisture Distribution in Root Zone, Fertilizers Use Efficiency and Productivity of Potato in New Reclaimed Lands. J. Appl. Sci. Res. 2012, 8, 3823–3833. Available online: http://www.aensiweb.com/jasr/jasr/2012/3823-3833.pdf (accessed on 1 January 2020).
  20. Glaser, B.; Lehmann, J.; Zech, W. Ameliorating physical and chemical properties of highly weathered soils in the tropics with charcoal—A review. Biol. Fertil. Soils 2002, 35, 219–230. [Google Scholar] [CrossRef]
  21. Glaser, B.; Bol, R.; Preedy, N.; McTiernan, K.B.; Clark, M.; Amelung, W. Short term sequestration of slurry-derived carbon and nitrogen in temperate grassland soil using 13C and 15N natural abundance. J. Plant Nutr. Soil Sci. 2001, 164, 467–474. [Google Scholar] [CrossRef]
  22. Lehmann, J.; Rillig, M.C.; Thies, J.; Masiello, C.A.; Hockaday, W.C.; Crowley, D. Biochar effects on soil biota—A review. Soil Biol. Biochem. 2011, 43, 1812–1836. [Google Scholar] [CrossRef]
  23. Asai, H.; Samson, B.K.; Stephan, H.M.; Songyikhangsuthor, K.; Homma, K.; Kiyono, Y.; Inoue, Y.; Shiraiwa, T.; Horie, T. Biochar amendment techniques for upland rice production in Northern Laos: 1. Soil physical properties, leaf SPAD and grain yield. Field Crops Res. 2009, 111, 81–84. [Google Scholar] [CrossRef]
  24. Beesley, L.; Moreno-Jiménez, E.; Gomez-Eyles, J.L.; Hrris, E.; Robinson, B.; Sizmur, T. A review of biochars’ potential role in the remediation, revegetation and restoration of contaminated soils. Environ. Pollut. 2011, 159, 3269–3282. [Google Scholar] [CrossRef] [PubMed]
  25. Ghorbani, M.; Konvalina, P.; Neugschwandtner, R.W.; Soja, G.; Bárta, J.; Chen, W.; Amirahmadi, E. How do different feedstocks and pyrolysis conditions effectively change biochar modification scenarios? A critical analysis of engineered biochars under H2O2 oxidation. Energy Convers. Manag. 2024, 300, 117924. [Google Scholar] [CrossRef]
  26. Cabrera, A.; Cox, L.; Spokas, K.A.; Celis, R.; Hermosín, M.C.; Cornejo, J.; Koskinen, W.C. Comparative sorption and leaching study of the herbicides fluometuron and 4-chloro-2 methylphenoxyacetic acid (MCPA) in a soil amended with biochars and other sorbents. J. Agric. Food Chem. 2011, 14, 12550–12560. [Google Scholar] [CrossRef] [PubMed]
  27. Hafez, M.; Mohamed, E.A.; Rashad, M.; Popov, A.I. The efficiency of application of bacterial and humic preparations to enhance of wheat (Triticum aestivum L.) plant productivity in the arid regions of Egypt. Biotechnol. Rep. 2021, 29, e00584. [Google Scholar] [CrossRef] [PubMed]
  28. Ramadan, A.R.E.; Ragab, R. Effect of Fertigation Frequency and Duration on Yield and Water Productivity of Wheat: Field and Modelling Study Using the Saltmed Model. Irrig. Drain. 2018, 67, 414–428. [Google Scholar] [CrossRef]
  29. Ghorbani, M.; Amirahmadi, E.; Konvalina, P.; Moudrý, J.; Bárta, J.; Kopecký, M.; Teodorescu, R.I.; Bucur, R.D. Comparative Influence of Biochar and Zeolite on Soil Hydrological Indices and Growth Characteristics of Corn (Zea mays L.). Water 2022, 14, 3506. [Google Scholar] [CrossRef]
  30. Hafez, M.; Popov, A.I.; Rashad, M. Influence of Agro-industrial wastes and Azosirillum on Nutrient Status and Grain Yield under Corn plant Growth in Arid Regions. Biosci. Res. 2019, 16, 2119–2130. [Google Scholar]
  31. Robertson, S.J.; Rutherford, M.P.; López-Gutiérrez, J.C.; Massicotte, H.B. Biochar enhances seedling growth and alters rootvsymbioses and properties of sub-boreal forest soils. Can. J. Soil Sci 2012, 92, 329–340. [Google Scholar] [CrossRef]
  32. El-Meseery, A.A. Effect of Different Drip Irrigation Systems on Maize Yield in Sandy Soil; John Willey & Sons. Inc.: Chichester, UK, 1988; pp. 152–153, 350–351. [Google Scholar]
  33. Singh, U. Antinutritional factors of chickpea and pigeonpea and their removal by processing. Plant Foods Hum. Nutr. 1988, 38, 251–261. [Google Scholar] [CrossRef]
  34. Snedecor, G.W.; Cochran, W.G. Statistical Methods, 7th ed.; Iowa State University Press: Ames, IA, USA, 1980; 593p. [Google Scholar]
  35. Duncan, D.B. Multiple range and multiple F tests. Biometrics 1955, 11, 1–42. [Google Scholar] [CrossRef]
  36. Mukherjee, A.; Zimmerman, A. Organic carbon and nutrient release from a range of laboratory-produced biochars and biocharsoil mixtures. Geoderma 2013, 193, 122–130. [Google Scholar] [CrossRef]
  37. Ghorbani, M.; Amirahmadi, E.; Neugschwandtner, R.W.; Konvalina, P.; Kopecký, M.; Moudrý, J.; Perná, K.; Murindangabo, Y.T. The Impact of Pyrolysis Temperature on Biochar Properties and Its Effects on Soil Hydrological Properties. Sustainability 2022, 14, 14722. [Google Scholar] [CrossRef]
  38. Ghorbani, M.; Neugschwandtner, R.W.; Konvalina, P.; Asadi, H.; Kopecký, M.; Amirahmadi, E. Comparative effects of biochar and compost applications on water holding capacity and crop yield of rice under evaporation stress: A two-years field study. Paddy Water Env. 2023, 21, 47–58. [Google Scholar] [CrossRef]
  39. Abdelraouf, R.E.; Ragab, R. The benefit of using drainage water of fish farms for irrigation: Field and modelling study using the SALTMED model. Irrig. Drain. 2017, 66, 758–772. [Google Scholar] [CrossRef]
  40. Sabra, D.M.; Reda, A.M.; El-Shawy, E.A.; El-Refaee, Y.Z.; Abdelraouf, R.E. Improving barley production under deficient irrigation water and mineral fertilizers conditions. SABRAO J. Breed. Genet. 2023, 55, 211–229. [Google Scholar] [CrossRef]
  41. Ramadan, A.; Ghanem, H.G.; Bukhari, N.A.; El-Zaidy, M. Field and modeling study on manual and automatic irrigation scheduling under deficit irrigation of greenhouse cucumber. Sustainability 2020, 12, 9819. [Google Scholar] [CrossRef]
  42. Weber, K.; Quicker, P. Properties of biochar. Fuel 2018, 217, 240–261. [Google Scholar] [CrossRef]
  43. Association of Official Agricultural Chemists. Official Methods of Analysis, 4th ed; Association of Official Agricultural Chemists: Washington, DC, USA, 1990; pp. 495–510. [Google Scholar]
  44. Ayarza, M.L.; Raucher, F.; Vilela, L.; Amezquita, E.; Barrios, E.; Rondon, M.; Rao, I. Sustainable intensification of crop-livestock systems on sandy soils of Latin America: Trade-offs between production and conservation. In Proceedings of the Management of Tropical Sandy Soils for Sustainable Agriculture “A Holistic Approach for Sustainable Development of Problem Soils in the Tropics”, Khon Kaen, Thailand, 27 November–2 December 2005; pp. 406–413. [Google Scholar]
  45. Bakry, A.B.; Ibrahim, O.M.; Abdelraouf, R.E.; Badr, E.A. Effect of Humic Acid, Mycorrhiza Inoculation, and Biochar on Yield and Water Use Efficiency of Flax under Newly Reclaimed Sandy Soil. Agric. Sci. 2014, 5, 1427–1432. [Google Scholar] [CrossRef]
  46. Eid, A.R.; Negm, A. Improving Agricultural Crop Yield and Water Productivity via Sustainable and Engineering Techniques. In Conventional Water Resources and Agriculture in Egypt; The Handbook of Environmental Chemistry; Springer International Publishing AG: Berlin/Heidelberg, Germany, 2019; Volume 74, pp. 561–591. [Google Scholar] [CrossRef]
  47. Reynolds, J.F.; Stafford Smith, D.M.S. Do humans cause deserts? In Global Desertification: Do Humans Cause Deserts? Reynolds, J.F., Stafford Smith, D.M., Eds.; Dahlem University Press: Berlin, Germany, 2002; pp. 1–21. [Google Scholar]
  48. Rashad, Y.M.; Hafez, M.; Rashad, M. Diazotrophic Azotobacter salinestris YRNF3: A probable calcite-solubilizing bio-agent for improving the calcareous soil properties. Sci. Rep. 2023, 13, 20621. [Google Scholar] [CrossRef]
  49. Fekry, W.M.E.; Rashad, Y.M.; Ibrahim, O.M. Modeling the combined effect of fulvic acid, effective microorganisms, and micro-carbon on olive yield. Asian J. Plant Sci. 2023, 22, 394–405. [Google Scholar]
Figure 1. The location of the study site in the Al-Nubariya Region of Egypt. Source: www.maphill.com/egypt accessed on (15 January 2022).
Sustainability 16 04856 g001
Figure 2. Biochar production stages from sugarcane waste.
Sustainability 16 04856 g002
Figure 3. The meteorological station inside Al-Nubariya farm.
Sustainability 16 04856 g003
Figure 4. Locations for measuring average moisture content within the root zone before and after irrigation during the four stages of cucumber plant growth.
Sustainability 16 04856 g004
Figure 5. Locations of soil moisture content measurements using a profile probe with the drip irrigation system.
Sustainability 16 04856 g005
Figure 6. Nitrogen adsorption–desorption isotherms of the sugarcane waste biochar.
Sustainability 16 04856 g006
Figure 7. The impact of deficit irrigation and the biochar application rate on soil moisture content and water stress within the root zone of cucumber plants throughout the four stages of average growth in seasons 2022 and 2023.
Sustainability 16 04856 g007
Figure 8. Impact of low irrigation and biochar rate on the water application efficiency in 2022 and 2023.
Sustainability 16 04856 g008
Figure 9. Impact of deficit irrigation and the biochar application rate on cucumber yield during the seasons of 2022 and 2023.
Sustainability 16 04856 g009
Figure 10. Impact of deficit irrigation and the biochar application rate on the water productivity of cucumbers during the seasons 2022 and 2023.
Sustainability 16 04856 g010
Figure 11. Impact of deficit irrigation and the biochar application level on vitamin C in cucumbers during the 2022 and 2023 seasons.
Sustainability 16 04856 g011
Figure 12. Impact of deficit irrigation and the biochar application level on soluble sugars in cucumbers during the 2022 and 2023 seasons.
Sustainability 16 04856 g012
Figure 13. Impact of deficit irrigation and the biochar application level on total soluble solids in cucumbers during the 2022 and 2023 seasons.
Sustainability 16 04856 g013
Table 1. Mean temperature, relative humidity, and wind speed data in the study area.
Climatic Mean Values, 2022
MonthsSRADTMAXTMINRAINWINDTDEWTMeanRH
kWh/m2°Cmmm/S°C°C%
January11.4018.828.7034.485.335.9513.0767.83
February14.0319.738.9817.605.676.8813.9867.00
March17.9521.5510.709.636.127.6815.9061.00
April21.0423.212.620.007.148.9418.7457.11
Climatic mean values, 2023
January10.9218.848.7435.516.006.0014.0068.13
February14.0419.938.8818.445.936.8913.9969.04
March18.1520.5911.109.786.917.8016.8262.11
April22.3222.9512.410.007.548.8518.0958.05
Note: Solar radiation (SRAD), maximum air temperature (TMAX), minimum air temperature (TMIN), average precipitation (RAIN), wind speed (WIND), dew/frost point temperature (TDEW), average air temperature (TMean), and average relative humidity (RH).
Table 2. The total water volumes and biochar application rates applied to each treatment during the 2022 and 2023 seasons.
Deficit Irrigation, m3Irrigation Volumes, m3 ha −1Biochar Application rates, ton ha.−1Symbol
20222023
F1(100% FI)610060600BR0
F2 (80% FI)480048485BR1
F3 (60% FI)360036367BR2
9BR3
11BR4
FI: Full irrigation; BR: biochar rate.
Table 3. BJH pore diameter, volume, and surface area of activated carbon.
BJH Pore Size Distribution Adsorption Results
Surface Area: 52.0957 m2/g
Pore Volume: 0.100036 cc/g
Pore Radius Dv(r): 1.92827 nm
Pore Radius Pore VolumePore Surf. (Area)dv (r)ds ®dv (log r)ds (log r)
nm cc/g m2/g cc/nm/g m2/nm/g cc/g m2/g
1.928271.92 × 10−21.99 × 1013.74 × 10−23.88 × 1011.65 × 10−11.71 × 10²
2.567663.91 × 10−23.54 × 1012.59 × 10−22.02 × 1011.52 × 10−11.19 × 10²
3.713885.90 × 10−24.61 × 1001.31 × 10−27.04 × 1001.10 × 10−15.94 × 101
6.506917.55 × 10−25.12 × 1014.06 × 10−31.25 × 1005.89 × 10−21.81 × 101
53.65521.00 × 10−15.21 × 1012.72 × 10−41.01 × 10−22.31 × 10−28.60 × 10⁻¹
Table 4. Impact of deficit irrigation and the biochar application level on the yield and water productivity of cucumbers.
Irrigation DeficitBiochar Rate,
ton ha−1
Yield of Fruits,
(ton ha−1)
Water Productivity
(kgcucumber m−3water)
2022202320222023
F1 (100%FI) 27.926.84.64.4
F2 (80% FI) 27.926.95.85.5
F3(60% FI) 16.816.14.74.4
LSD at 0.050.440.56
020.019.24.23.9
523.122.24.84.6
723.822.94.94.7
925.324.35.35.0
1128.827.86.05.7
LSD at 5%0.730.74
F1 (100% FI)023.122.23.83.6
526.825.84.44.3
727.626.54.54.4
929.328.24.84.7
1132.531.45.35.2
F2 (80% FI)022.922.04.84.5
526.625.55.55.3
727.326.25.75.4
929.027.96.15.7
1133.833.07.16.8
F3(60% FI)013.913.33.83.6
516.115.44.54.3
716.515.94.64.4
917.616.94.94.7
1120.019.15.65.3
LSD at 0.051.271.28
FI: Full irrigation (complete water irrigation).
Table 5. Impact of deficit irrigation and the biochar application level on vitamin C, soluble sugar content, and total soluble solids in cucumbers.
Irrigation DeficitBiochar Rate, ton. ha−1Vitamin CSoluble Sugar, mg/g DWT.S.S., %
202220232022202320222023
F1 (100%FI) 114.3112.371.7068.985.685.57
F2 (80% FI) 110.1108.077.5075.145.845.72
F3(60% FI) 85.583.863.2361.344.354.26
090.288.460.4758.454.274.18
5102.7100.767.1964.944.794.69
7104.1102.072.9170.465.385.27
9107.3105.277.5674.965.815.69
11112.1110.575.9273.626.216.08
F1 (100%FI)0100.298.259.4557.074.954.85
5114.1111.866.8264.155.175.07
7115.7113.373.5970.645.745.62
9119.2116.879.8276.635.985.86
11122.5121.278.7976.396.566.43
F2 (80% FI)095.293.369.3967.295.175.07
5108.4106.371.9669.775.385.28
7109.9107.779.2776.865.645.52
9113.3111.086.3483.726.326.19
11123.5121.880.5278.076.706.56
F3 (80% FI)075.173.752.5650.982.692.64
585.683.962.7860.903.803.72
786.785.065.8663.894.754.65
989.487.666.5364.535.125.02
1190.488.668.4466.395.375.26
FI: Full irrigation; DW: dry weight; T.S.S.: total soluble solids.
Disclaimer/Publisher’s Note: The statements, opinions and data contained in all publications are solely those of the individual author(s) and contributor(s) and not of MDPI and/or the editor(s). MDPI and/or the editor(s) disclaim responsibility for any injury to people or property resulting from any ideas, methods, instructions or products referred to in the content.