Abstract
The current global scenario of unequal access to water and electricity motivates the search for solutions based on available resources, such as renewable energies and desalination. Additionally, adequate sizing of renewables requires extensive and reliable time series, which are usually unavailable. Reanalysis models are an option to consider, but only after evaluating their local accuracy, generally through performance metrics. This study evaluated the performance of the solar radiation, temperature, and wind speed products from MERRA2 and ERA5-Land in comparison to ground data, as well as their influence on the optimal initial configuration of a renewable energy system for desalination in La Guajira, Colombia. HOMER Pro was the software tool employed to establish the best arrangements for the resulting renewable power systems, and the study included a sensitivity analysis considering different annual capacity shortages, operating hours, and energy needs for desalting. ERA5-Land performed better than MERRA2 in matching the time series from the local station. The relative error of the cost of electricity of systems dimensioned from reanalysis was less than 3% compared to systems from ground measurements, with a renewable fraction above 98%. For the study area, ERA5-Land reanalysis represents a reliable alternative to address the scarcity of solar resource records, but both reanalyses failed to reproduce the wind speed regime.
1. Introduction
The long-term planning of cities and their public services, such as energy and water supply, requires considering current world challenges related to sustainability and minimizing the effects of global warming. In the present-day scenario of increasing energy demands, using renewable energy sources is essential to mitigate the harmful effects of anthropogenic global climate change [1,2,3,4]. Because of the intrinsic variability in renewable sources such as solar and wind, efficiently determining the feasibility of these projects is directly related to the available datasets and their reliability [5,6,7]. However, high-quality ground measurements are usually unavailable in the target areas, especially in developing countries, increasing the uncertainty regarding the likely performance of wind and solar farm projects [8,9].
Datasets produced by reanalysis models are among the alternatives that researchers and planners use to overcome this scarcity of reliable data, mainly because of their large-scale spatiotemporal coverage and availability at low or no cost [5,10,11,12,13]. However, these models have limitations, and the accuracy of climate variable estimation varies depending on each reanalysis dataset’s data assimilation technique and the study area’s location and topography [14]. Therefore, they should not be considered direct measurements but a result of a model subject to bias [9,11,15]. Reanalyses can commonly replicate the general seasonal patterns of meteorological variables, but they are usually less successful in accurately reproducing magnitudes and spatial variability [9,16].
The evaluation through performance metrics of the accuracy of reanalysis products based on weather station records is a current research topic aimed at reducing uncertainty and improving understanding of the behavior of weather variables worldwide. For instance, recent studies include the paper by Aliana et al. [17], who evaluated the performance of solar data radiation models for three large-scale solar thermal systems in Denmark and assessed the economic impact of using inaccurate models. By employing the root mean square error (RMSE) and the mean biased error, they found that satellite-based models perform better than reanalysis and that the latter is more accurate than the reference year provided by the Danish Meteorological Institute. Doddy Clarke et al. [14] used four skill scores to evaluate the performance of two global (MERRA2 and ERA5) and one high-resolution regional reanalysis for renewable energy planning purposes, comparing them with observations at seven meteorological stations across Ireland. Their conclusions highlight that results vary on a case-by-case basis, depending on the meteorological variable, spatial characteristics of the study area, and the timescale.
Gruber et al. [18] evaluated the quality of MERRA2 and ERA5 reanalyses through correlation coefficients and error metrics of multiple locations with wind potential in both inland and coastal regions in Brazil, the United States, New Zealand, and South Africa. Their findings indicate that ERA5 performed better than MERRA2, especially considering aggregated time scales. These results regarding the better performance of ERA5 over MERRA2 when modeling wind farms are also supported by Olauson [19], as he compared the performance of these two reanalysis datasets in Germany, Denmark, France, Sweden, and the Northwestern USA.
In Latin America, studies evaluating the performance of reanalysis sets for renewable energy sources include that of Thomas et al. [20]. They determined that the higher spatial resolution of ERA5 allows it to present a better accuracy than its predecessor ERA5-Interim and MERRA2 for representing wind speed time series in Mexico. However, even if ERA5 exhibits the highest correlations, it also presents higher biases. In Chile, Ramírez Camargo et al. [21] employed Pearson correlation and error metrics to validate the feasibility of employing ERA5-Land and MERRA2 to generate one-hour resolution time series for its use in solar projects compared with individual data from 23 large PV plants.
Because of its vast solar and wind power potential, the Guajira, in the northern Caribbean region of Colombia, has been the subject of many studies on renewable energies [22,23]. Regarding the assessment of reanalysis datasets, the works by Gil-Ruiz et al. [24,25] evaluate the performance of ERA5 to reproduce the behavior of wind time series recorded at meteorological stations in the region. Their key findings point out that ERA5 performs better in areas directly subjected to trade winds and that accuracy diminishes in areas of complex topography.
Drinkable water scarcity is another characteristic of La Guajira [26,27]. This paper assesses how ERA5-Land and MERRA2 reanalysis datasets impact the optimal preliminary configuration of a renewable power system for potable water production, considering a desalting plant in this Colombian region, conducting a sensitivity analysis on the energy consumption for water desalination and allowable annual capacity shortage. One of the contributions of this research to filling the literature gap is that it uses inferential statistics to test the hypothesis that a good fit in terms of performance metrics between reanalysis products and ground measurements results in an equivalent sizing and performance of renewable energy systems based on these time series.
The motivation for conducting this study is linked to two critical challenges facing cities: sustainable development and access to essential services like energy and water. There is a pressing need to explore renewable energy sources to serve increasing energy demands and to fight global warming. However, obtaining reliable data for planning renewable energy projects, especially in regions with limited ground measurements, poses a significant challenge. By evaluating reanalysis datasets offering large-scale spatiotemporal coverage, this study aims to assess their value as tools to overcome data scarcity and uncertainty, particularly in planning renewable energy systems for water desalination, using La Guajira, Colombia, as a relevant case study.
This research employs the HOMER Pro Microgrid Analysis Tool [28] to determine the optimal power systems configurations in terms of the cost of electricity, while it also allows performing sensitivity analyses subject to constraints. The results obtained in the software model are mostly considered a first approximation to see future projects’ economic and technical feasibility. Because of the software’s maturity, versatility, and easy-to-use interface, this model has been employed in diverse assessments that include integrating renewable energy systems into the grid [29,30], providing energy to isolated rural communities and small grids [31,32,33,34], or supplying energy to public service facilities, such as desalting plants and water supply [35,36,37].
2. Materials and Methods
2.1. Study Area
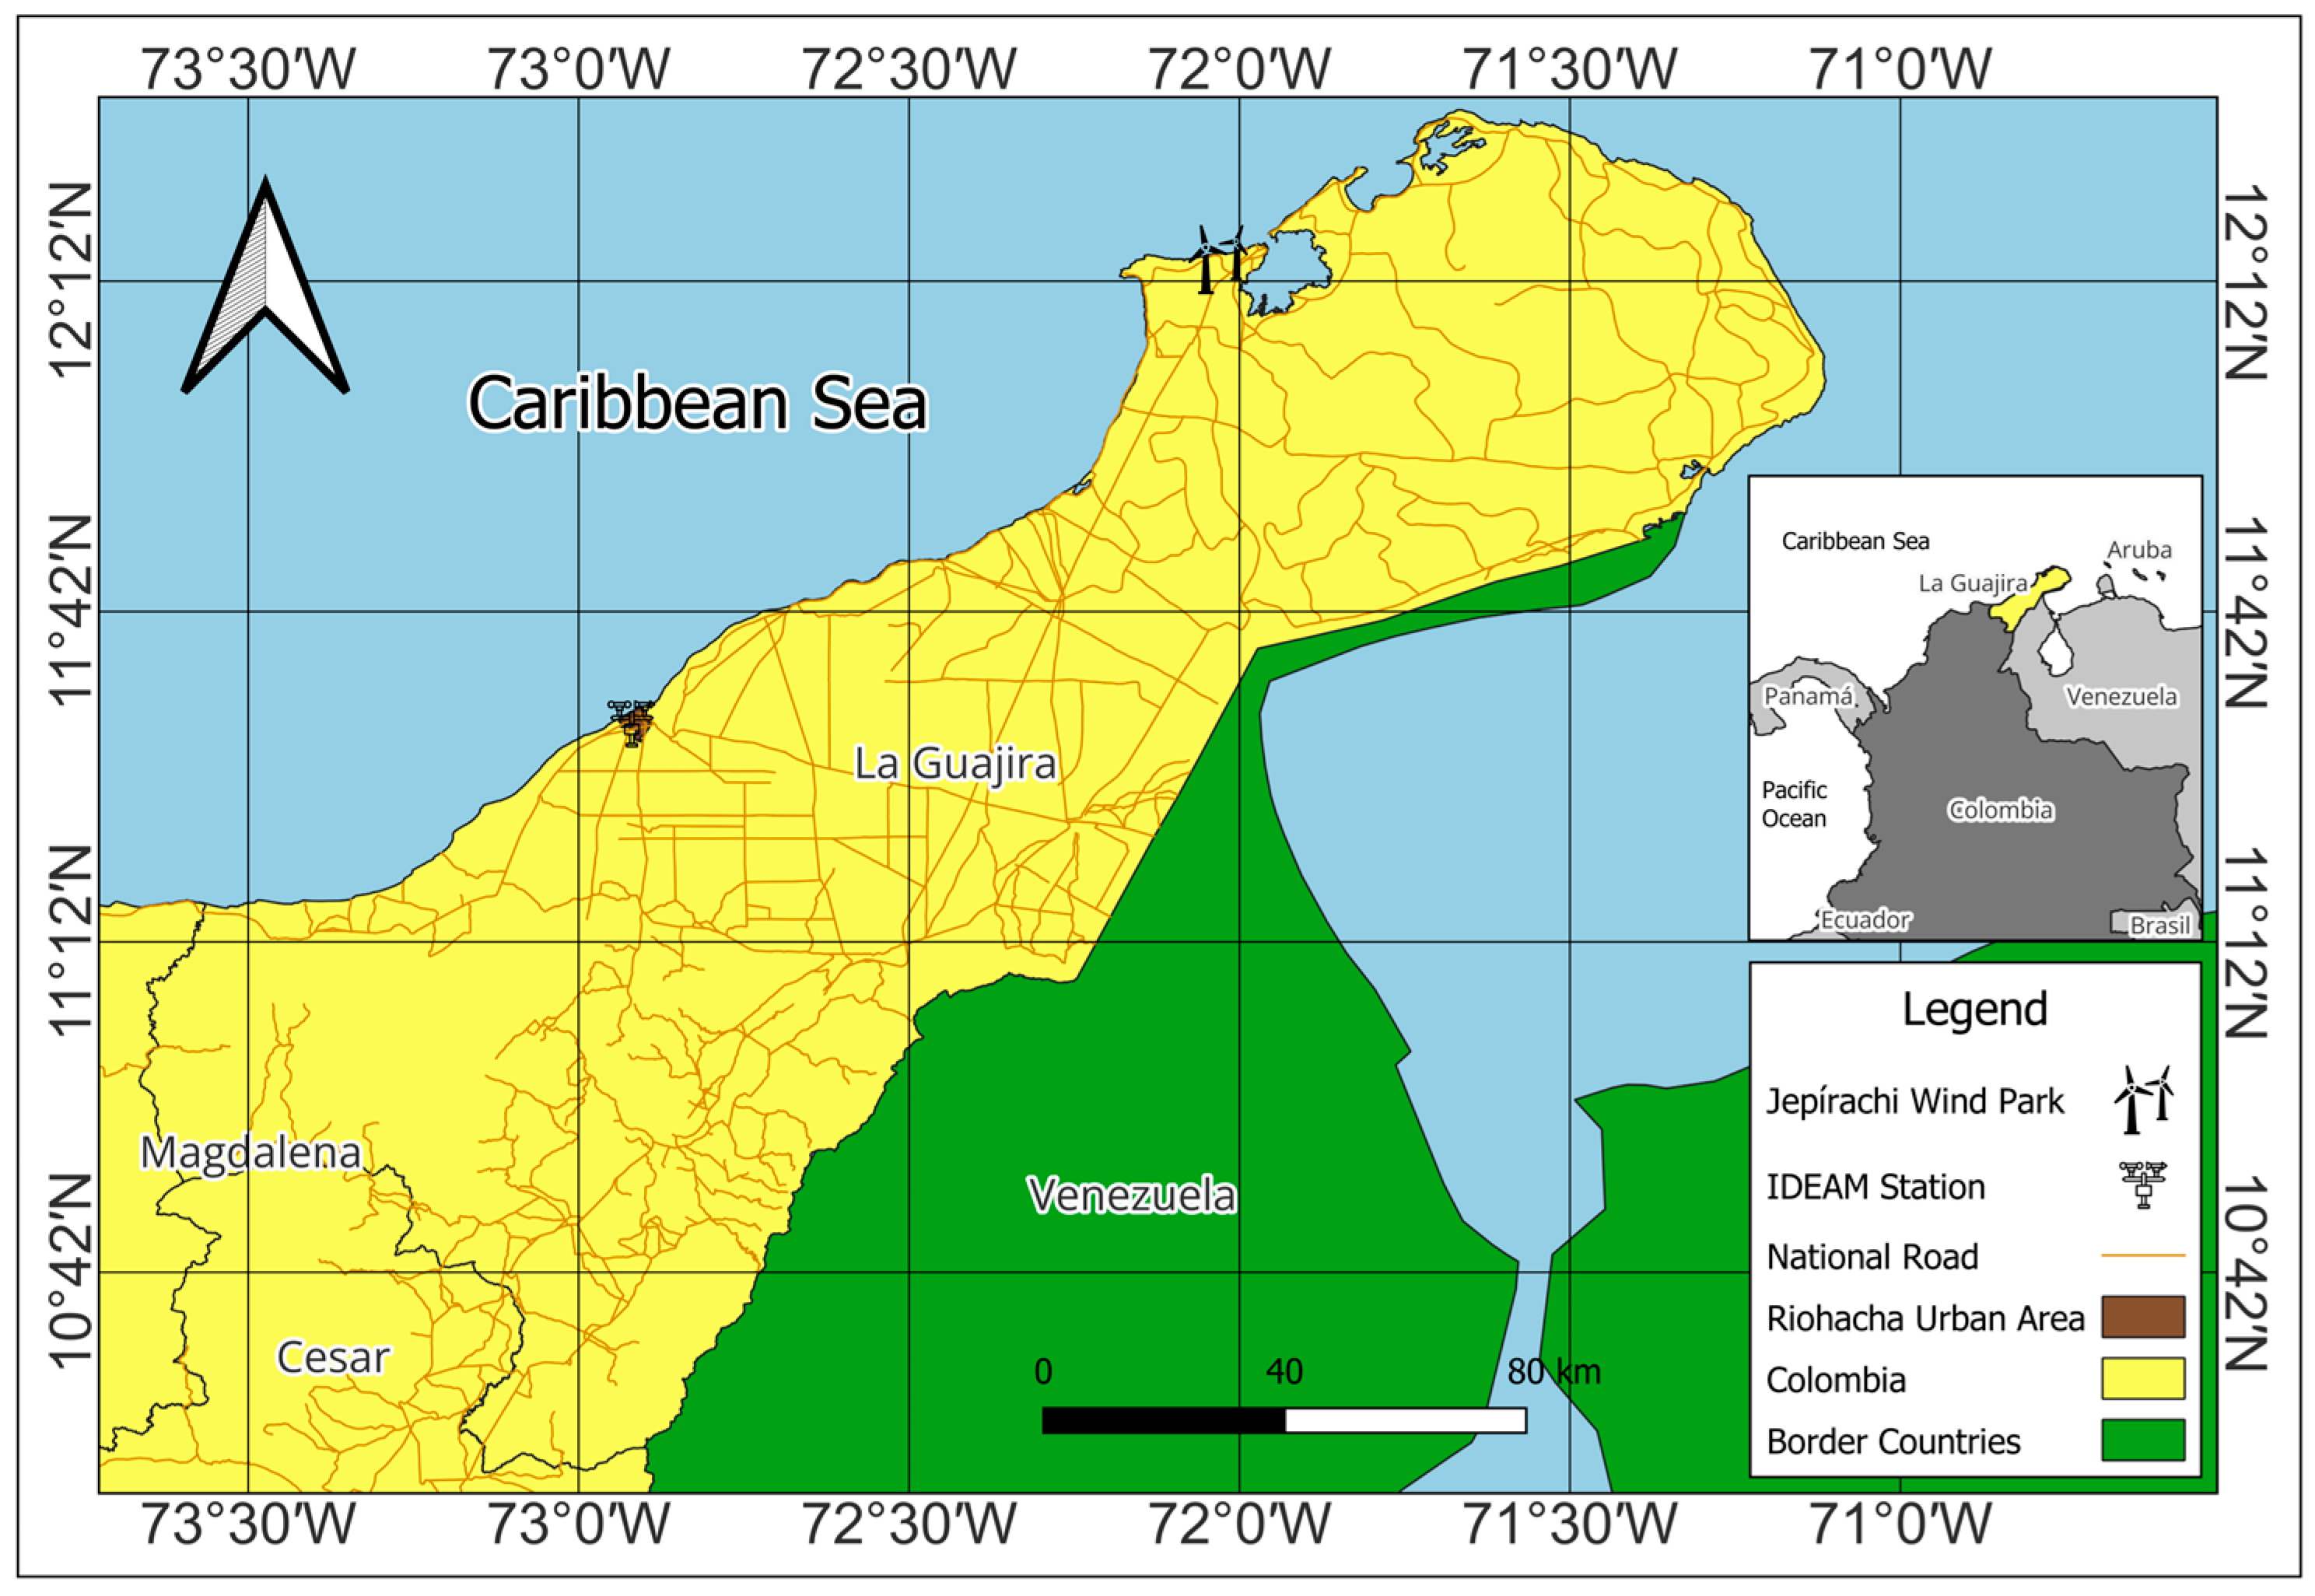
This paper uses La Guajira, the northernmost Department of Colombia, to assess the MERRA2 and ERA5-Land datasets’ performance and impact on optimal renewable power system configuration. As shown in Figure 1, its geographic location is between latitudes 10°20′ N and 12°30′ N and longitudes 71°00′ W and 74°00′ W, with an extension of 20,848 km2 [38]. Its capital is Riohacha, with an average altitude of 5 m above sea level [39]. The Department is divided into Upper Guajira (a semi-desertic region), Middle Guajira (semi-arid with agricultural potential but scarce groundwater resources), and Lower Guajira (dry tropical forest) [26,40]. In general, the region presents arid-zone characteristics, with a low average annual precipitation (<500 mm/year) and high average temperatures (between 35 °C and 42 °C) [26,41].
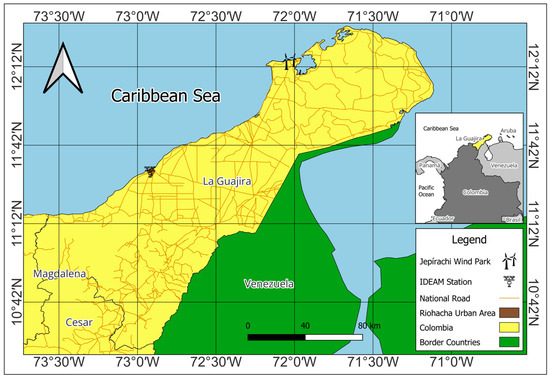
Figure 1.
Location of the study area: La Guajira.
By 2020, the population of La Guajira was over one million inhabitants [42], with the Wayúu indigenous group comprising approximately 46% of this total. La Guajira has several socioeconomic issues, including corruption, child malnourishment, and deep poverty [41]. According to the literature, 53.7% of the population lives below the poverty line, and 26.7% live in extreme poverty [40]. The combination of these climate and socioeconomic issues leads to a problem of drinkable water scarcity, a persistent problem previously identified in the newspapers and scientific literature [26,27,43,44]. Additionally, some initiatives to mitigate water scarcity in this region have failed or achieved only partial or limited success [45,46,47,48]. Previous studies have identified that renewable sources in this region might be able to supply Colombia’s load demands [23].
2.2. Datasets
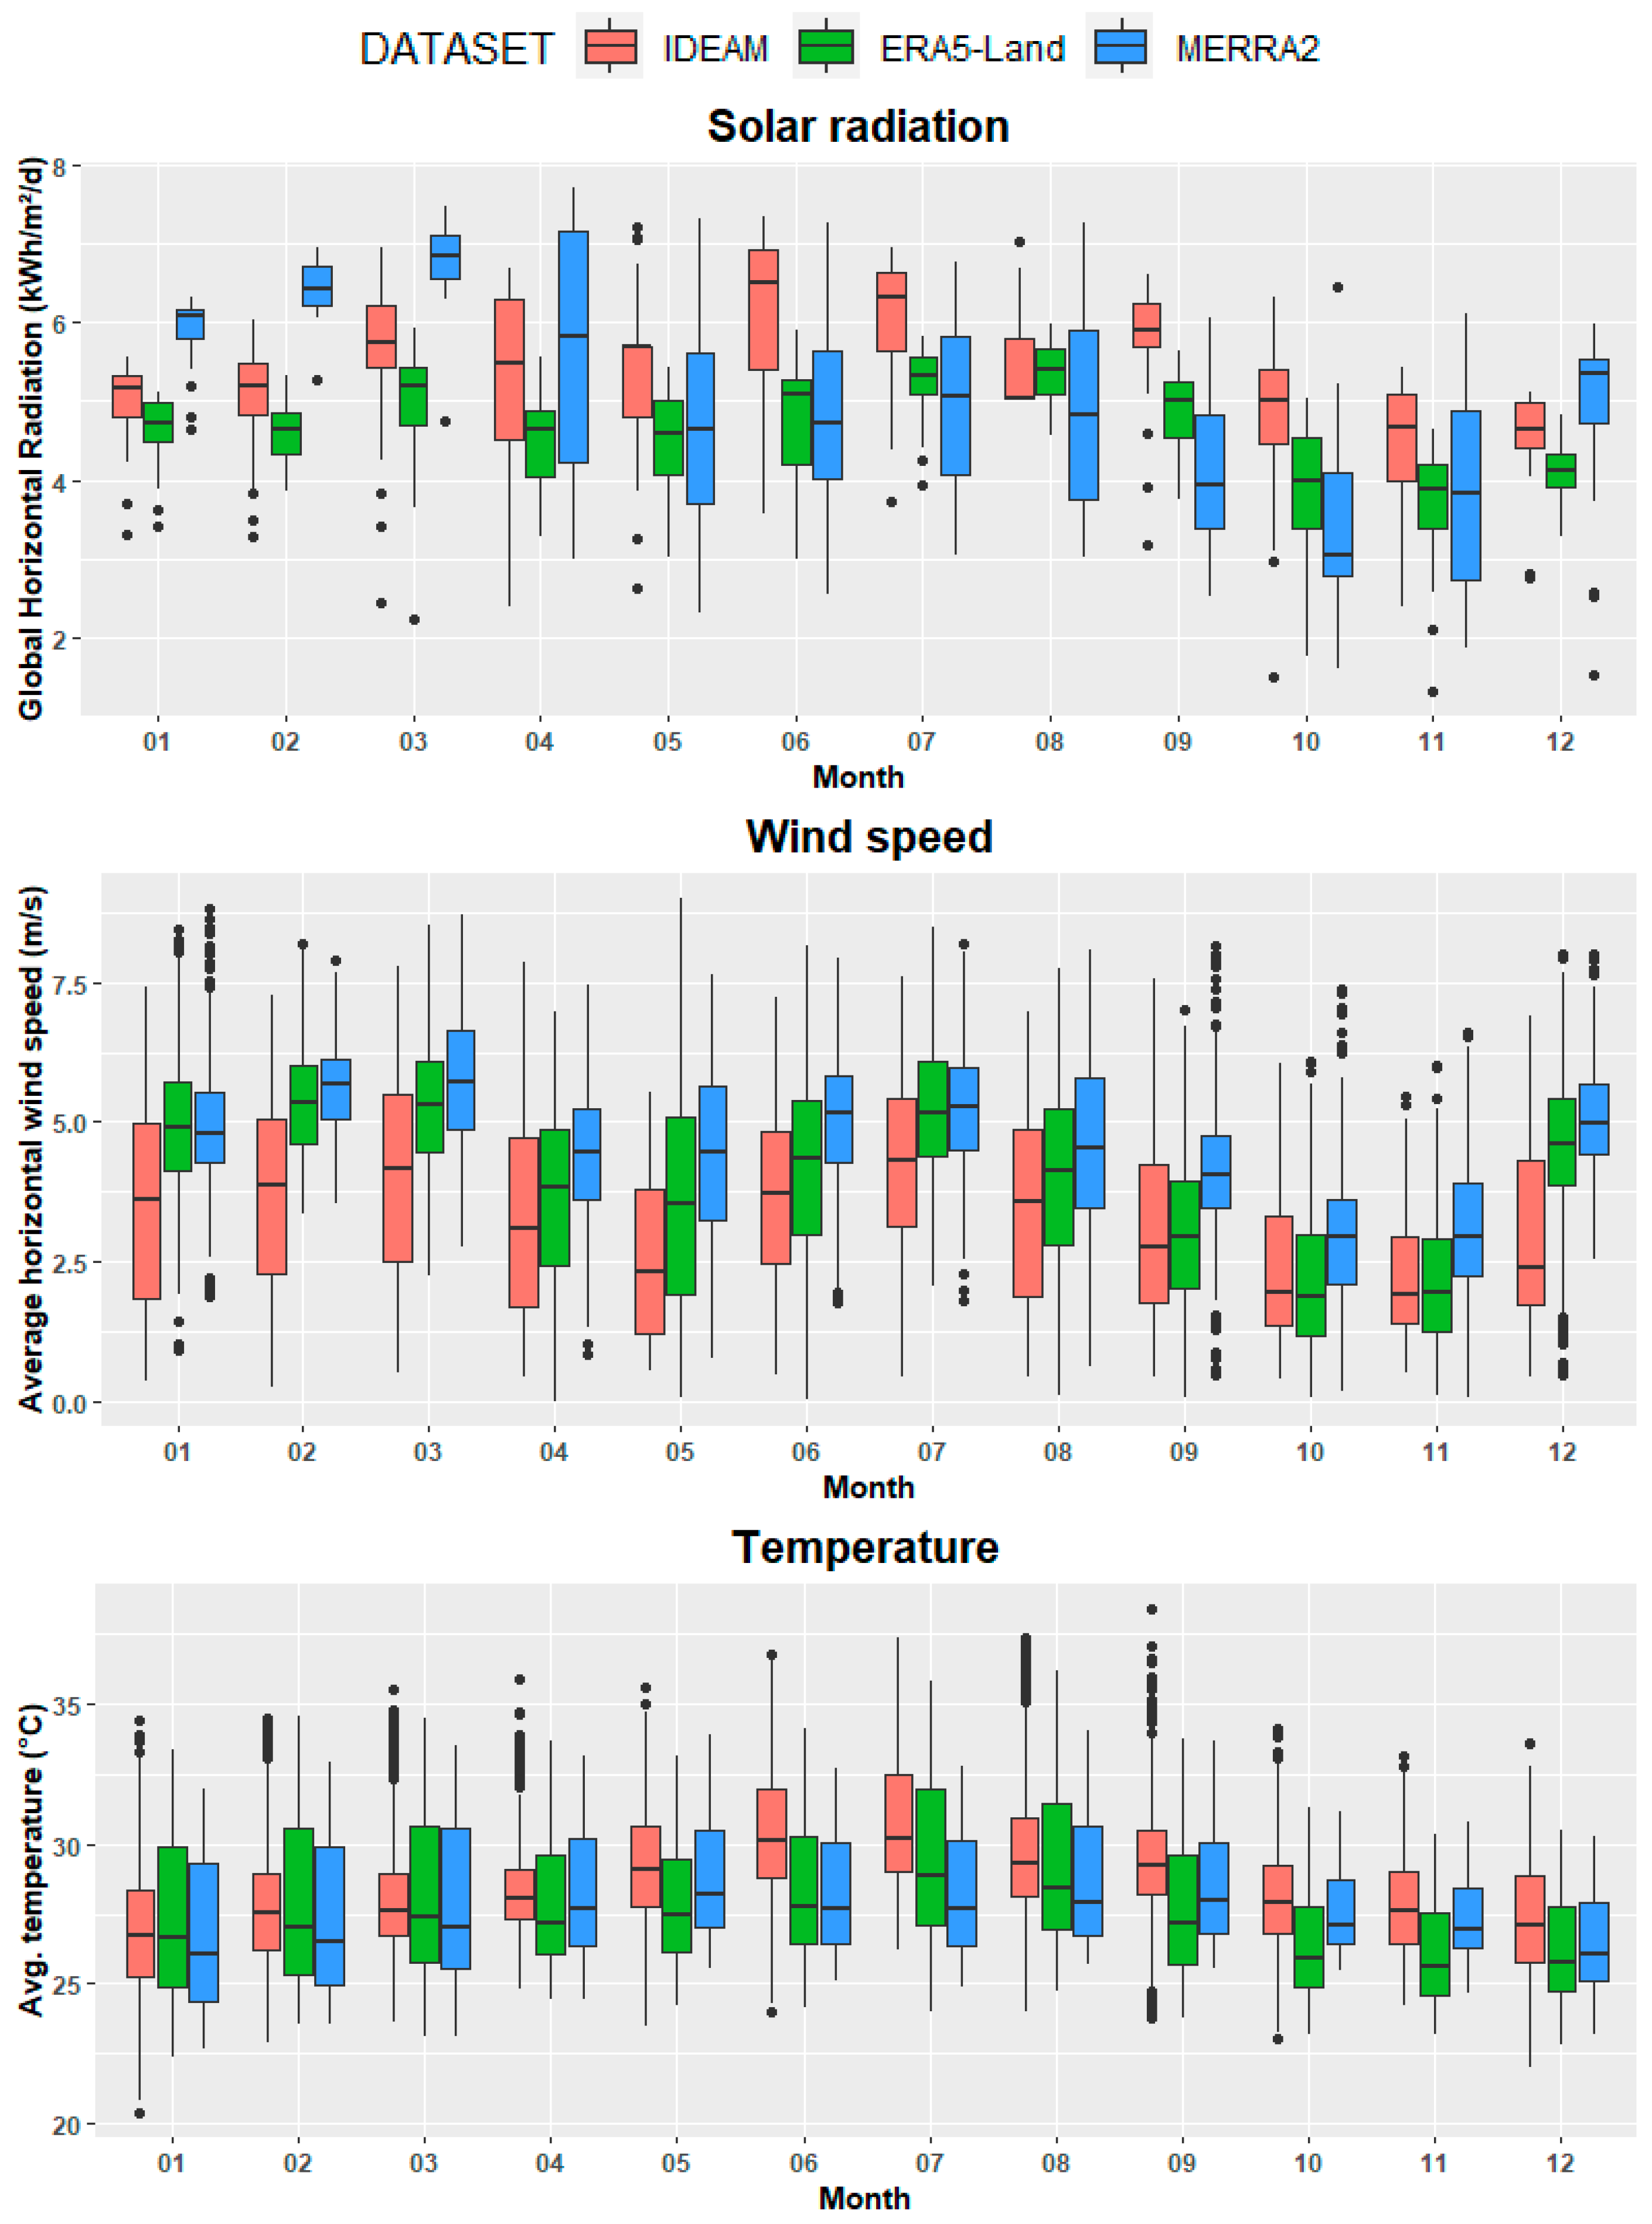
Figure 2 shows the boxplots for solar radiation, wind speed, and temperature according to IDEAM records and ERA5-Land and MERRA2 reanalysis of 2016 at Aeropuerto Almirante Padilla Station [Id: 15065180].
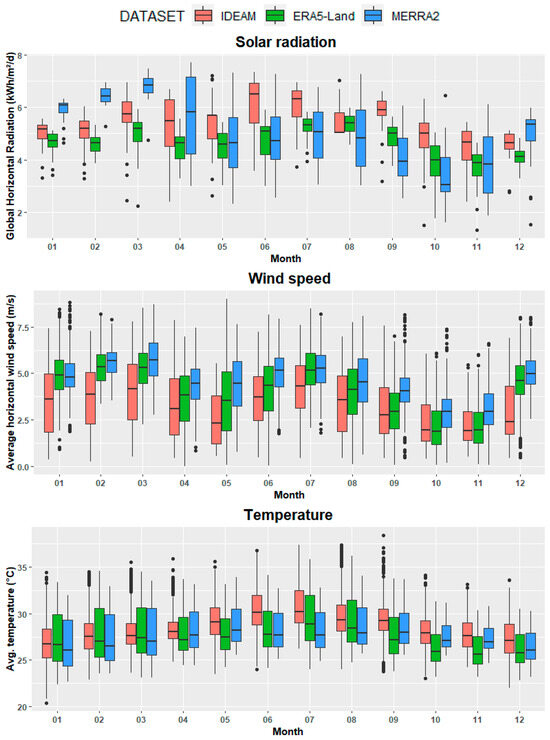
Figure 2.
Boxplots for solar radiation, wind speed, and temperature from IDEAM records from 2016 and ERA5-Land and MERRA2 reanalysis at Aeropuerto Almirante Padilla Station. The extremes of the box encompass values between quartiles Q1 and Q3; the bar denotes the median; the whiskers correspond to Q1-1.5 IQR (interquartile range) and Q3 + 1.5 IQR. The points are potential outliers.
2.2.1. Ground Measurements
The wind speed, solar radiation, and temperature time series correspond to station Aeropuerto Almirante Padilla’s hourly records for 2016. This information is available at the Institute of Hydrology, Meteorology, and Environmental Studies (IDEAM) site [49]. This year was selected because it presented the fewest data gaps over the last decade for the variables mentioned above, required in the HOMER Software version 3.11 simulations, and used to generate this study’s baseline case.
2.2.2. MERRA2
Introduced in 2016 to replace the original Modern-Era Retrospective Analysis for Research and Applications (MERRA) dataset, MERRA Version 2 (MERRA2) estimates historic climate variables datasets from 1980 to the present, with a temporal resolution of one hour or lower. It employs the Goddard Earth Observing System (GEOS) model to estimate the historical time series based on the parameterization of initial conditions conducted from ground measurements at hydrometeorological stations worldwide, satellite observations, and general circulation models [50,51,52]. MERRA2 is a product of NASA’s Global Modeling and Assimilation Office (GMAO), and the datasets were obtained from the Soda-Pro website [53].
2.2.3. ERA5-Land
With a spatial resolution of 9 km × 9 km, the ERA5-Land reanalysis dataset was introduced in July 2019 by the Copernicus Climate Change Service (C3S) [21]. While it shares most parameterizations with ERA5, the ERA5-Land simulation uses atmospheric forcing based on ERA5 atmospheric variables and a “lapse rate correction” to improve accuracy on water and energy cycles [54], making it helpful in assessing land surface phenomena such as floods or droughts. It provides hourly estimates for over 50 land variables from 1950 to the present, and these datasets are available for download at the Copernicus Climate Data Store (CDS) [55].
2.2.4. Load Data
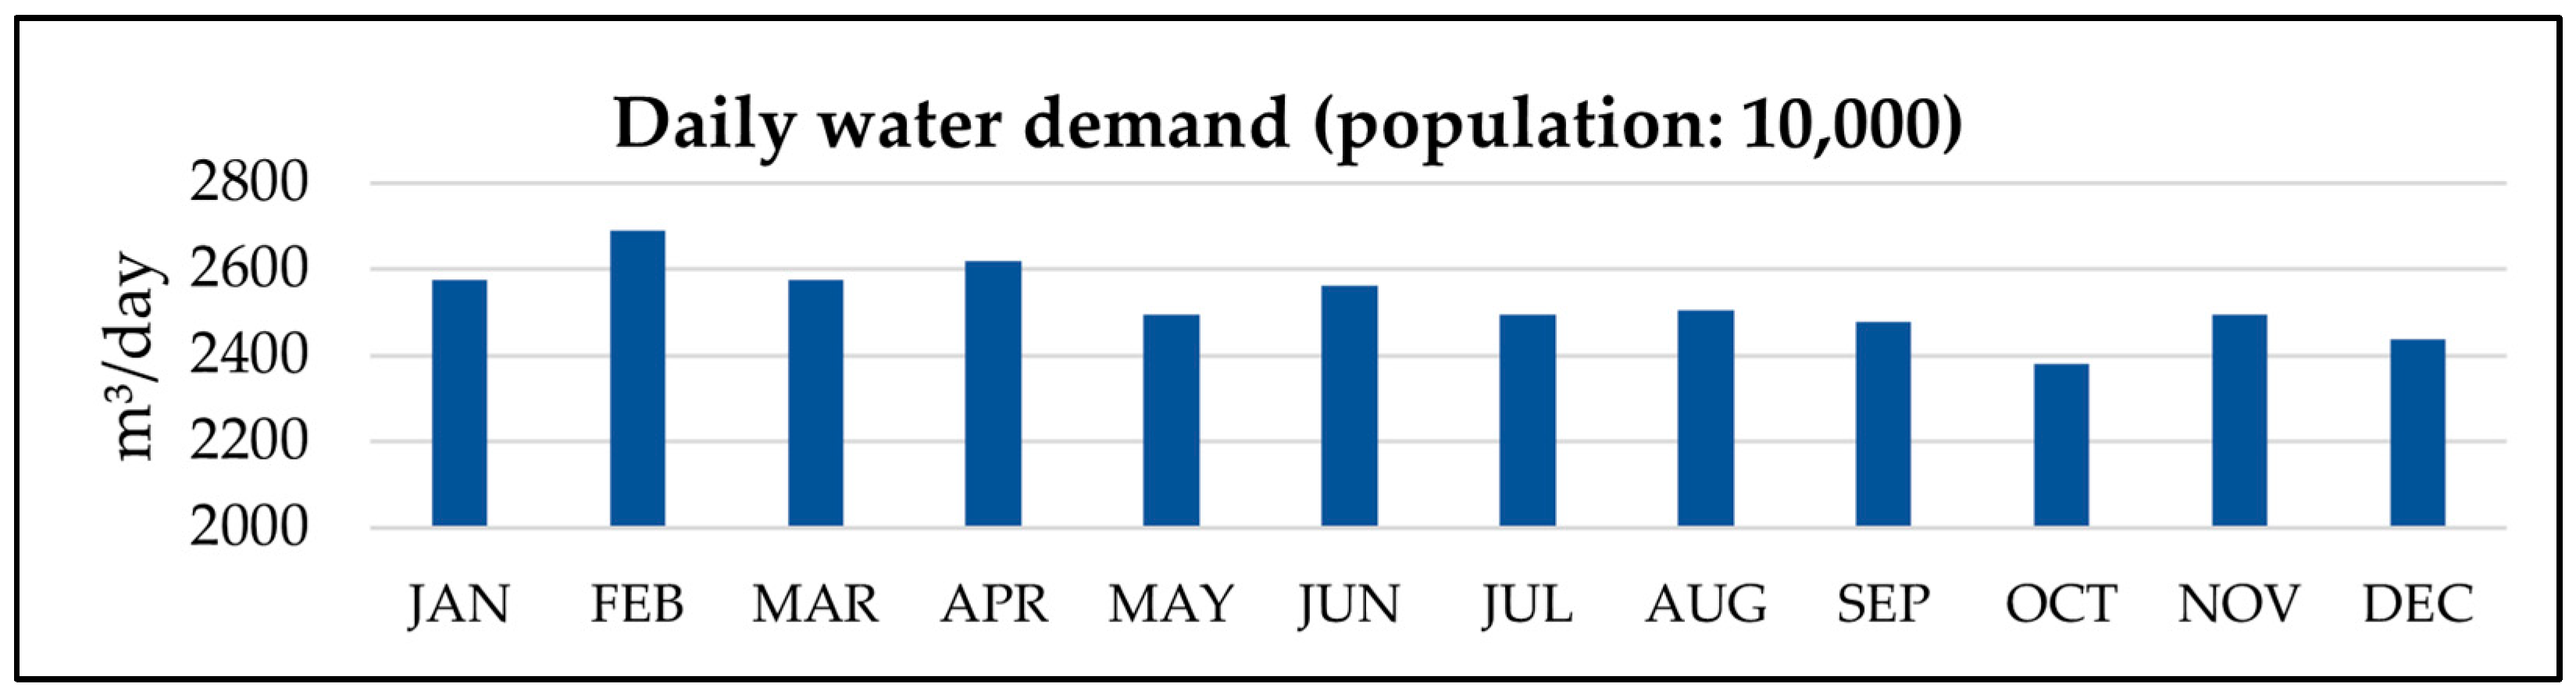
The water demand was estimated assuming a design population of 10,000 persons and based on the Colombian technical norms related to potable water and sanitation [56]. Based on the technical norms, the residential water supply equals 140 L per person per day, losses were considered 25% of the supply, and safety factors K1 and K2 were set as 1.2. After that, the monthly consumption was scaled based on long-term data records provided by VEOLIA [57], a water supply network operator in the Colombian Caribbean, as shown in Figure 3. This paper evaluates two operational regimes (8 h and 24 h), with the daily water demand evenly distributed during the working hours.

Figure 3.
Daily water demand for the case study for an assumed population of 10,000 persons.
Access to potable water is one of the main issues in the La Guajira region and other coastal regions of Latin America [58]. Even if this paper does not explicitly present the design of a reverse osmosis desalination plant, it helps to explore the feasibility of using reanalysis data to overcome the scarcity of ground measurement records in these regions aiming at effectively dimensioning large-scale utility infrastructure powered by renewables. Based on the recent review by Feria-Diaz et al. [59], this study considers three energy consumption values for reverse osmosis seawater desalination (SWRO): 2.5 kWh/m3, 4.0 kWh/m3, and 8.5 kWh/m3.
2.3. Method
2.3.1. Performance Metrics
This paper employs the four statistical metrics used by Vega-Durán et al. [9] to assess the performance of MERRA2 and ERA5-Land to match the time series of wind speed, solar radiation, and temperature recorded by the IDEAM station in 2016. These metrics are the normalized root mean square error (NRMSE), bias (BIAS), Spearman correlation coefficient (ρS), and Nash–Sutcliffe efficiency coefficient (NSE), and their selection is supported by similar previous studies on the performance of reanalysis datasets [60,61,62,63,64]. Table 1 presents the formulas for calculating these performance metrics and their ranges and optimal values.

Table 1.
Details of the performance metrics employed, where O indicates reference data (IDEAM), E indicates the reanalysis dataset (MERRA2 or ERA5-Land), and N is the available data.
2.3.2. Optimal Configuration of the Renewable Energy-Based Power System
This research employed the HOMER Pro Microgrid Analysis Tool to determine the optimal configuration of the renewable energy-based power system described by the schematic in Figure 4. This software is considered an adequate and versatile tool for microgrid optimization in all sectors, providing a first approximation of future projects’ economic and technical feasibility [33]. The optimization process involves using the available technologies and considering the various constraints to model and simulate a series of hybrid renewable energy system alternatives. Then, each option is validated by examining whether the load is satisfied, and the model performs an energy–economy–ecology simulation/optimization analysis to obtain the optimal size of each element. The optimization results include the overall and categorized rankings of the least-cost feasible systems [37]. HOMER Pro incorporates an optimizer consisting of a proprietary derivative-free algorithm that searches for the least costly system, automatically finding the optimal size for the converter, storage, fuel-based generator, PV, and wind turbine components [28].
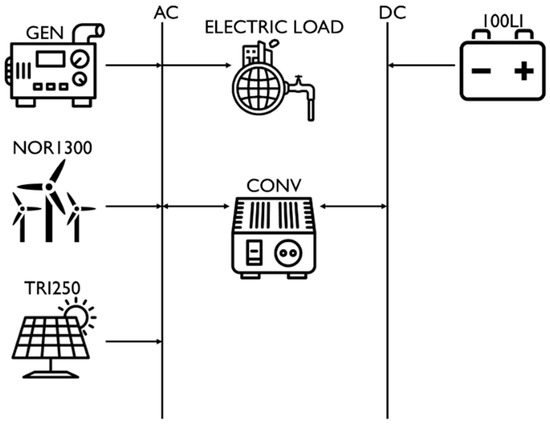
Figure 4.
Schematic of the proposed renewable energy system for this study.
Based on the existing literature, Table 2 presents the technical and economic specifications of the components used in HOMER to conduct the simulations. Table 2 shows that besides comparing the optimal configuration based on ground measurements and reanalysis datasets, this study includes three energy consumption values for obtaining one cubic meter of potable water from desalination and three annual capacity shortage (ACS) values. This capacity shortage is the shortfall between the required operating capacity and available operating capacity [28]. As the system is not designed to provide baseload electricity, relaxing this constraint allows for the observation of the impact of this variable on project costs [65], as excess energy periods inherent to renewable-based systems can be used to offset water production deficits. Furthermore, based on this consideration, the design constraints in HOMER for this study employ the HOMER defaults for the operating reserve as a percentage of load [66] and as 25% of the renewable output for both solar and wind power [67]. This assumption is conservative compared to other studies, such as Dawoud et al. [32]. Besides the information in Table 2, it is worth providing additional clarifications regarding the model setup. There are no constraints for the renewable fraction; however, considering a relatively high diesel fuel cost aims to maximize renewables’ penetration. HOMER estimates the lifetime throughput of the battery based on the information entered in the lifetime curve, and the suggested value is equal to the average value of the lifetime throughput values that fall within the allowable range of depth of discharge [68]. The Nordex N60-1300 wind turbine was selected for the case study as it is employed in Jepirachi Wind Park, in the same coastal line and approximately 120 km northeast of Aeropuerto Almirante Padilla station [69]. The default slope (11.5°) and azimuth angles (0°) were adopted for Trina Solar250TSM-250PA05A PV panels.
Table 2.
Technical and economic specification of hybrid system elements.
3. Results
3.1. Performance Metrics Results
Table 3 presents the performance results for the ERA5-Land and MERRA2 reanalysis products to match the time series of wind speed, solar radiation, and temperature recorded by the IDEAM station in 2016.
Table 3.
Performance results for the ERA5-Land and MERRA2 reanalysis products for solar radiation, wind speed, and temperature estimations at station Aeropuerto Almirante Padilla for 2016.
According to the literature, both ERA5-Land and MERRA2 indicate a good fit for solar radiation based on the performance metrics comparing reanalysis products with the IDEAM station, with relatively small biases. It is worth mentioning that night hours were excluded when quantifying the solar resource metrics. Spearman correlations above 0.8 are considered strong [21,80], NRMSEs below 0.5 are deemed reliable, as they indicate less residual variance [60], and NSE values greater or equal to 0.65 can be defined as very good [63]. On the other hand, Table 3 shows a different outcome for wind speed at 10 m and temperature. For instance, ERA5-Land presents moderate-to-strong correlations [80] and low biases, and the NRMSE suggests some reliability and capacity for representing variations; however, the NSE values close to zero or negative indicate that the mean of the observations might be a better predictor than the reanalysis model for these two variables. The moderate to weak correlations and the negative NSE found for MERRA2 denote that MERRA2 fails to accurately follow the overall behavior of the data series. These results are consistent with the findings by Carvalho [81] for regions near the Intertropical Convergence Zone, which indicates that MERRA2 faces issues like limitations in assimilating observational data and model parameterization, leading to low accuracy and considerable biases for these variables.
3.2. Homer Simulations
The time series of the three variables for 2016 from the three datasets were employed as inputs in the HOMER model represented in Figure 4. As previously stated, the optimal configurations obtained based on IDEAM records are considered the baseline cases. Table 4 summarizes the sensitivity analysis results for the optimal systems found by HOMER for different operational regimes, energy consumptions (kWh/m3), and annual capacity shortages (ACS) based on IDEAM data. The three datasets produced similar results regarding included element types, with PV being the dominating renewable source. Even when ACS is not allowed, the assumed generator’s fuel price and operational conditions lead to optimal systems, with more than 98% of their generation coming from renewables.
Table 4.
Results of the sensitivity analysis for the optimal system design for different operational regimes, energy consumption (kWh/m3), and annual capacity shortage (ACS) based on IDEAM data. Abbreviations: COE—cost of electricity, PV—PV installed capacity, Excess—excess electricity, NPC—net present cost.
For the simulation using IDEAM records, the 8 h operating regime results in significantly lower COE than the 24 h regime for the same energy consumption per cubic meter and ACS, with reductions between 27% and 46%. The different energy consumptions per cubic meter of water had a practically linear impact on the sizing of the components (except for the converter) and the net present cost (NPC) of the system, resulting in a similar COE for the same operating regimes and especially when some ACS is allowed. Restricting ACS to zero values leads to greater installed capacity requirements, with the corresponding higher COE and electricity production excess or curtailment.
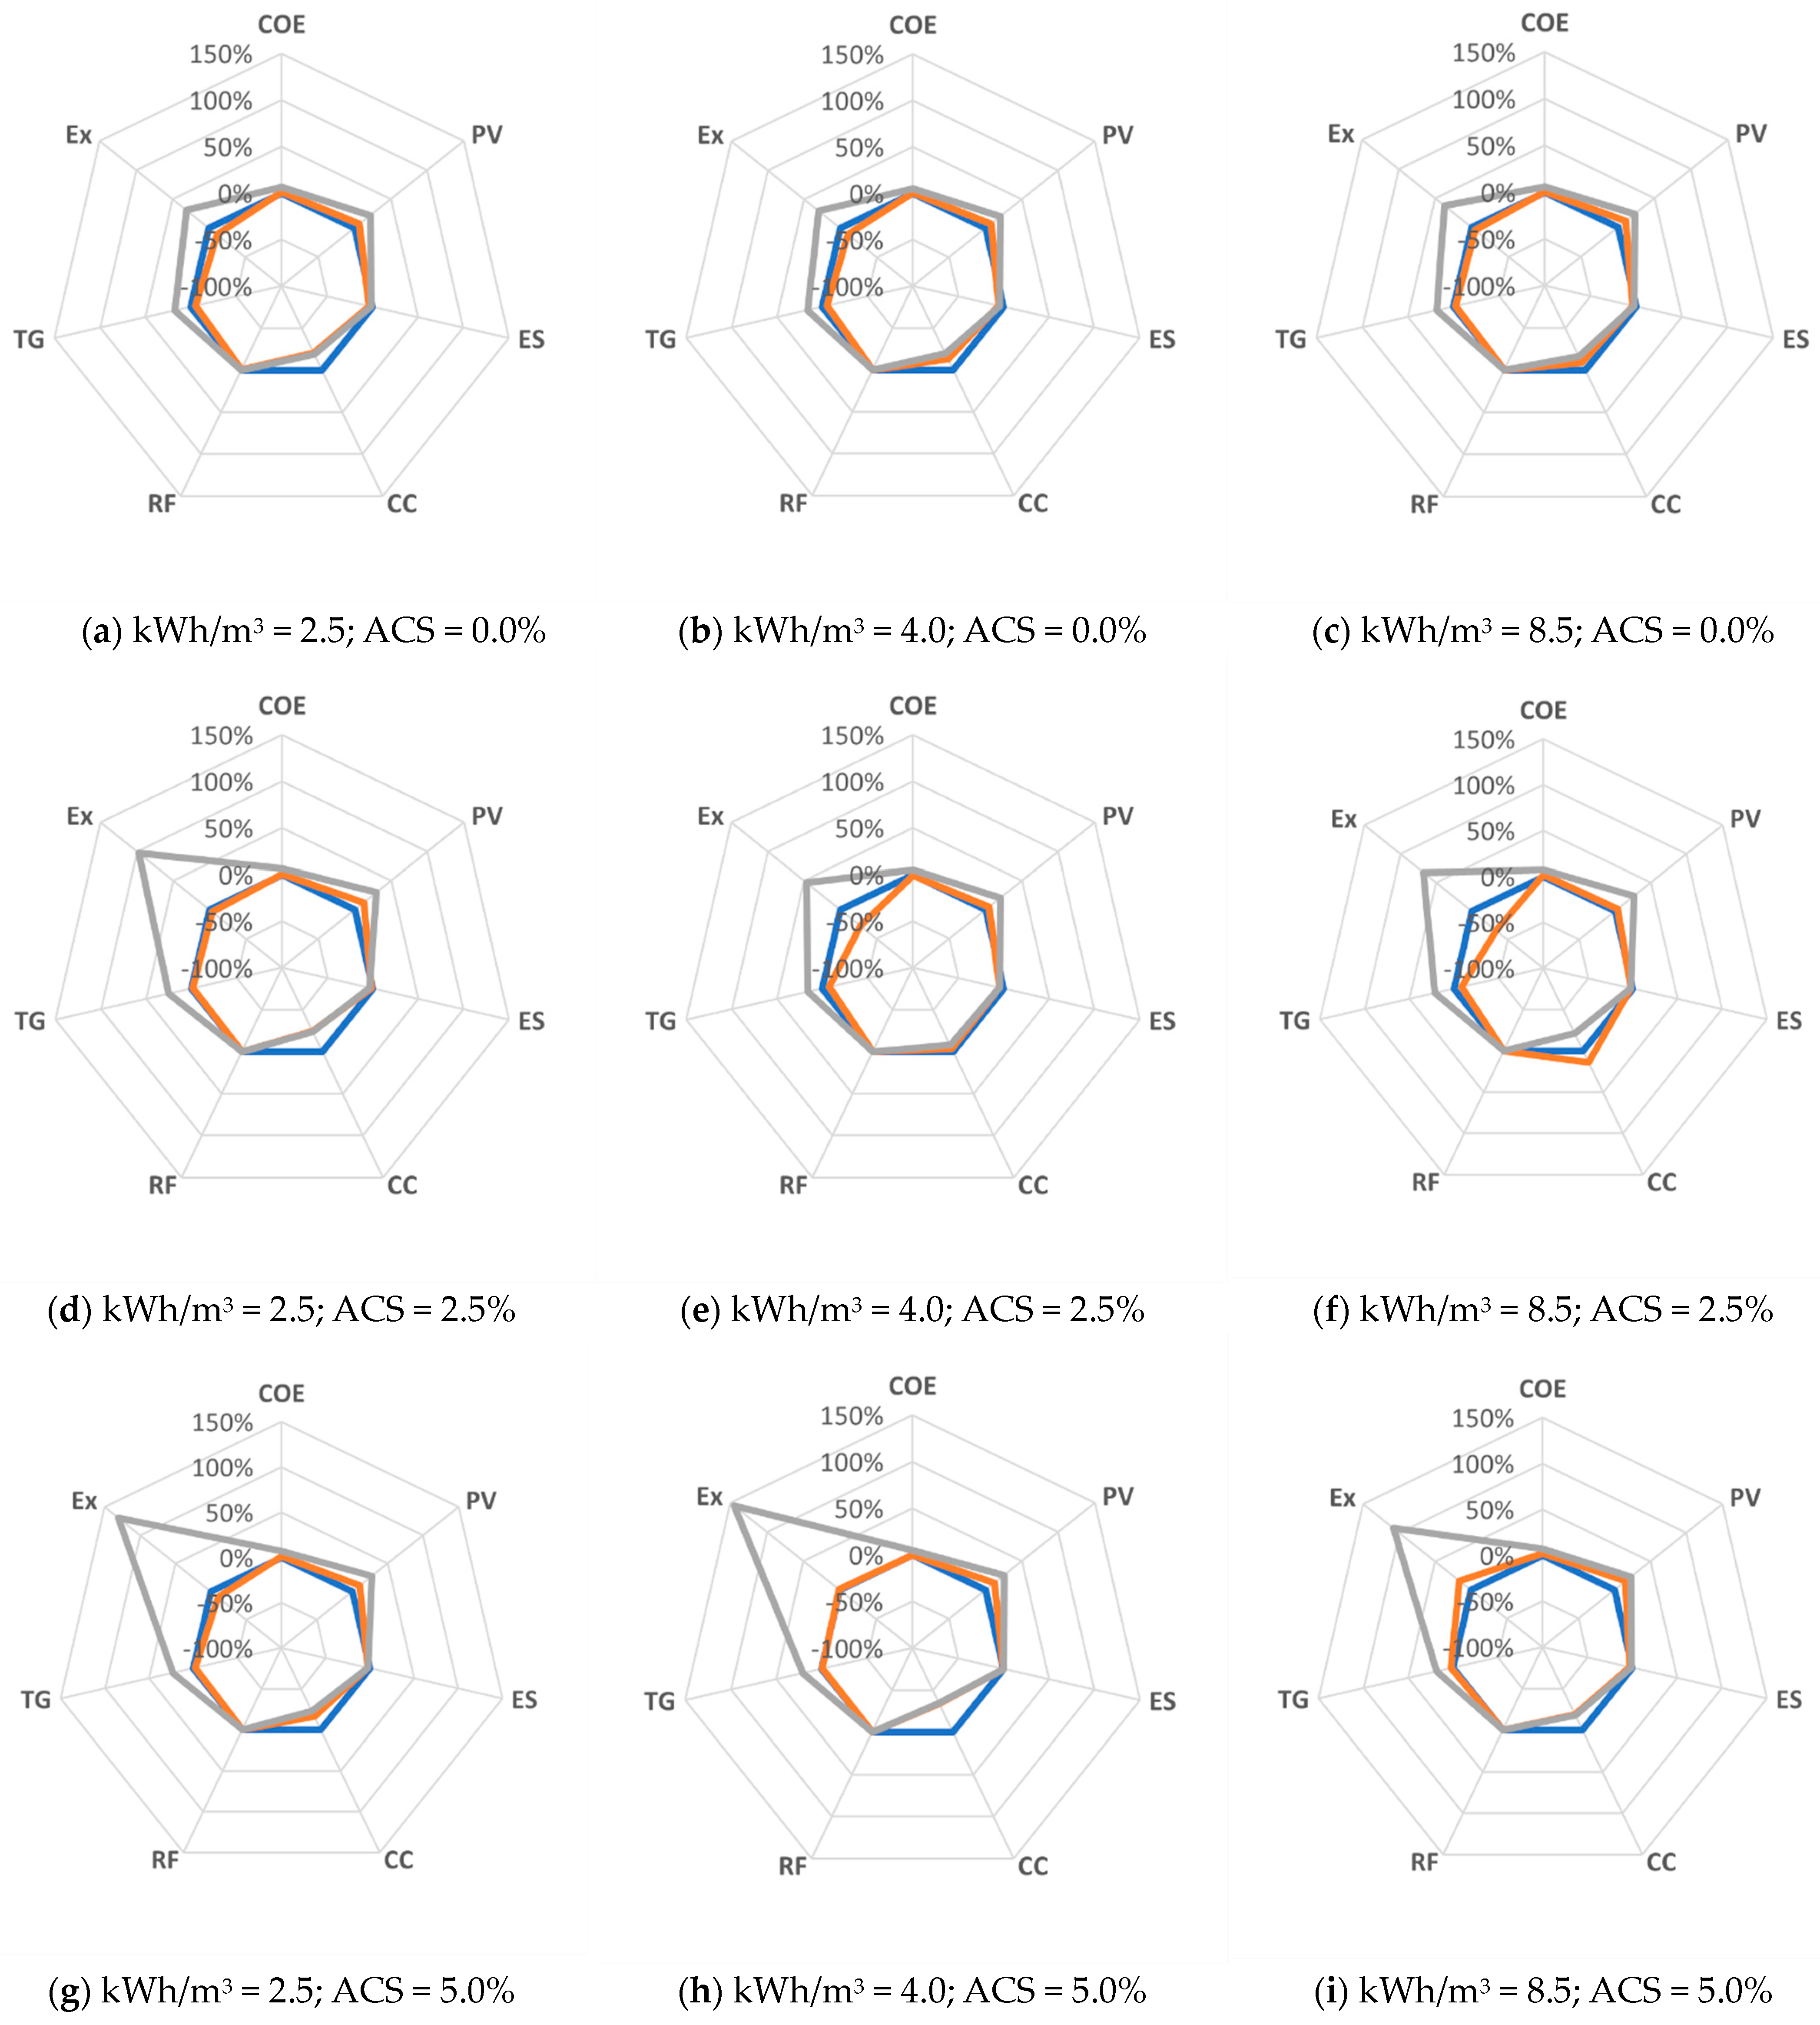
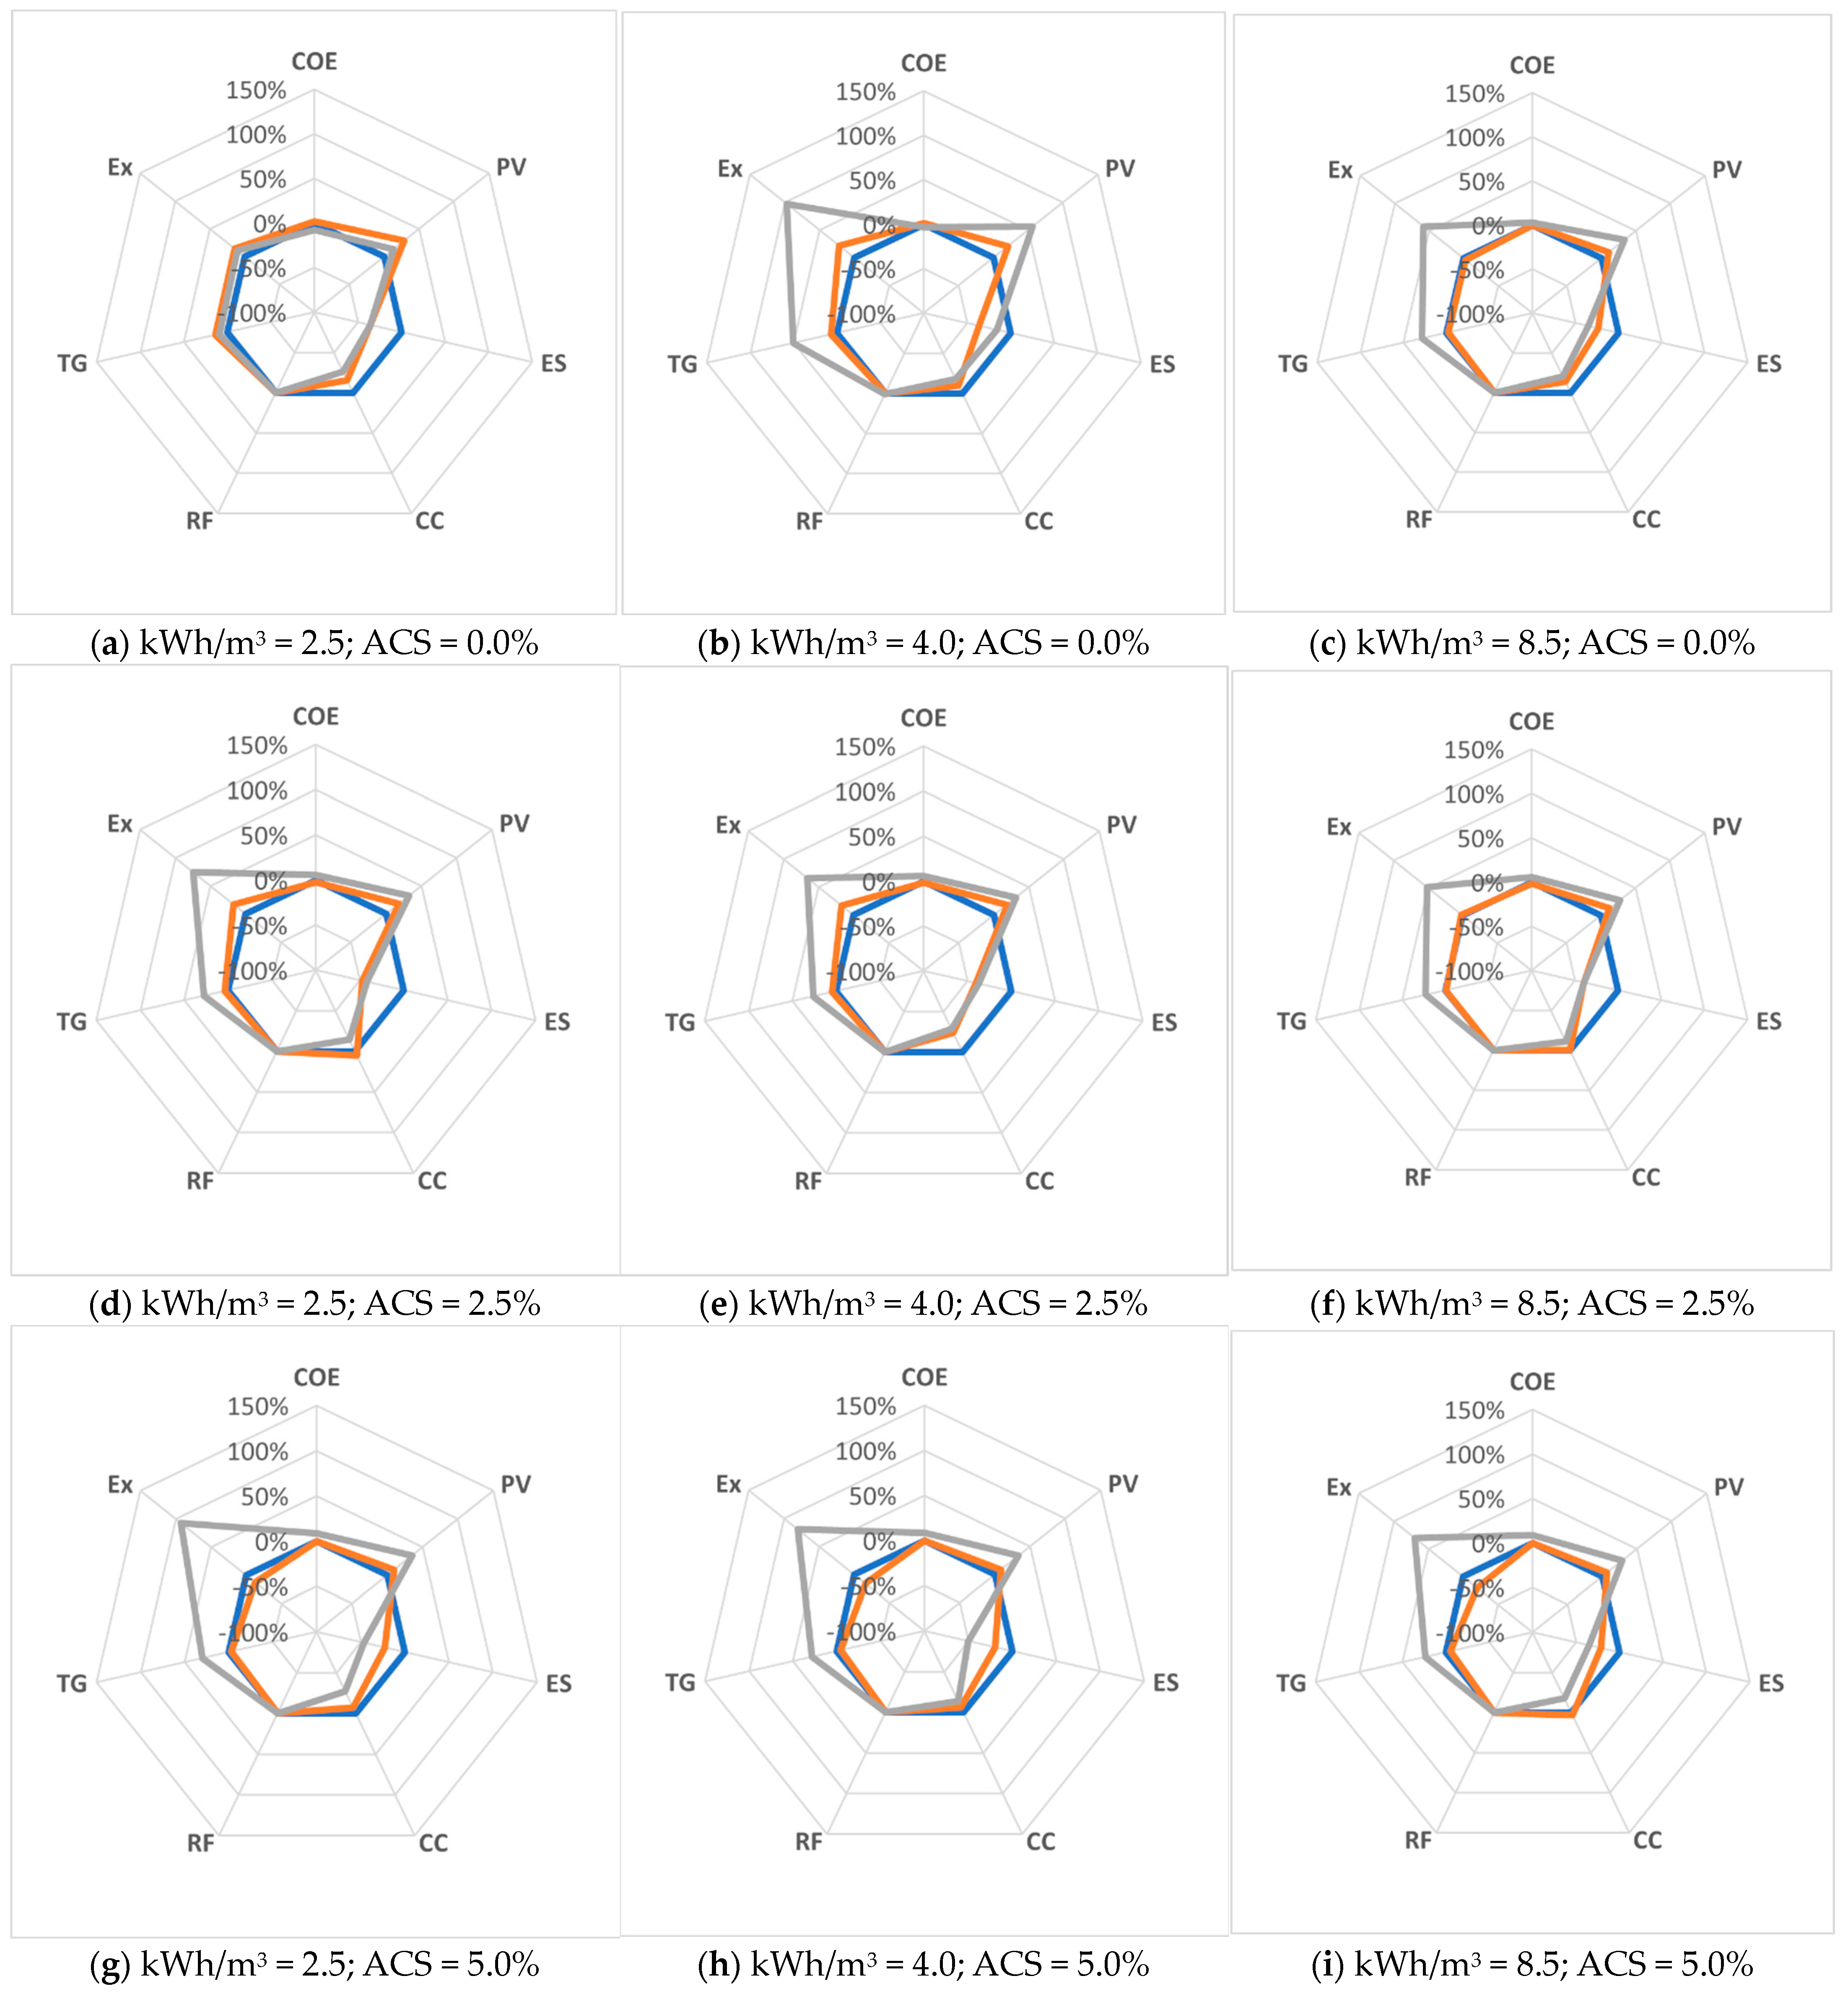
The radar plots in Figure 5 (24 h regime of operation) and Figure 6 (8 h regime of operation) present the relative error of the main variables from the optimal systems dimensioned based on reanalysis using as baseline the optimum based on ground measurements. For each condition evaluated in the sensitivity analysis, COE did not exceed 3% of the absolute relative error for ERA5-Land and 10% for MERRA2. Analogous to Table 4, the renewable fraction surpasses 98% in all the optimal systems, with the subsequent absence of diesel generators in the arrangements.
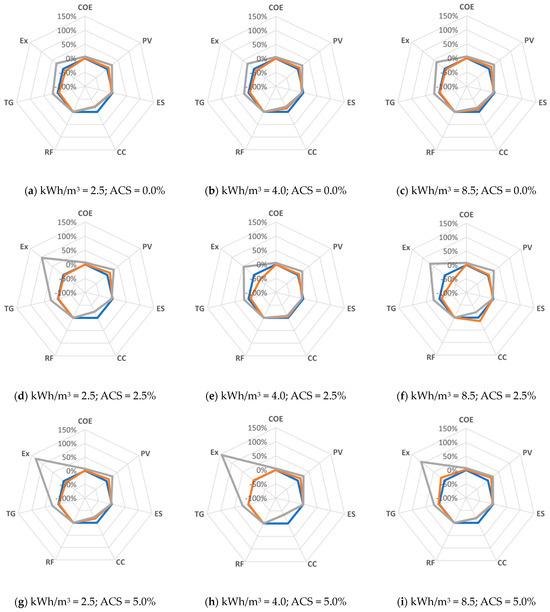
Figure 5.
Relative error of variables from the optimal systems dimensioned based on ground measurements and reanalysis under the 24 h regime of operation. Blue: IDEAM (baseline scenario), orange: ERA5-Land, gray: MERRA2. Variables: COE—cost of electricity, PV—PV installed capacity, ES—energy storage capacity, CC—converter size, RF—renewable fraction of electricity production, TG—total generation from the system, Ex—excess electricity.
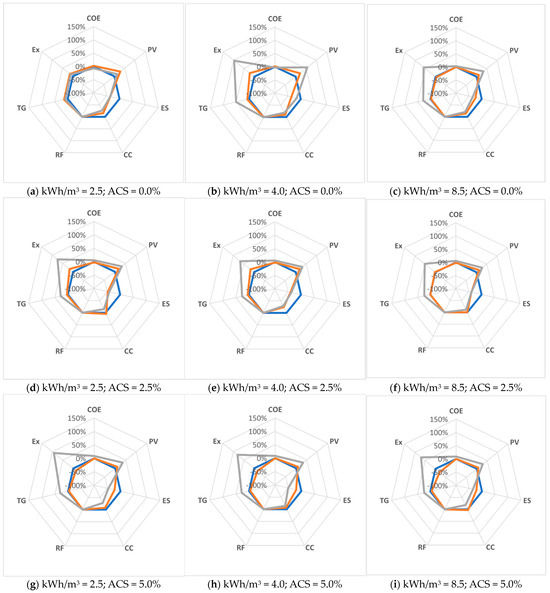
Figure 6.
Relative error of variables from the optimal systems dimensioned based on ground measurements and reanalysis under the 8 h regime of operation. Blue: IDEAM (baseline scenario), orange: ERA5-Land, gray: MERRA2. Variables: COE—cost of electricity, PV—PV installed capacity, ES—energy storage capacity, CC—converter size, RF—renewable fraction of electricity production, TG—total generation from the system, Ex—excess electricity.
The good match based on the performance metrics between ERA5-Land and IDEAM records for solar radiation seems to translate into a relatively accurate sizing of the main components of the system: PV panels, batteries, and converter, with none of the variables exceeding a relative error of 50%. The relative error associated with the converter is below 35% for all the examined conditions in the sensitivity analysis. Because of its size, this component does not impact the COE as much as the other two principal components (see Table 4).
For a desalting plant operating continuously, the relative error regarding the PV plant size corresponds to an overestimation ranging between 4% and 16% for systems calculated with ERA5-Land records and 20% and 30% for those based on MERRA2. For a plant operating only during daylight, these ranges are between 7% and 29% for ERA5-Land records and 14% and 57% for MERRA2. In contrast, these systems modeled based on reanalysis tend to underestimate the energy storage requirements compared to those from optimal systems based on IDEAM time series. The relative error for the batteries of systems operating 24 h is under 5% for both reanalysis datasets, but this number drastically increases to a range between 16% and 50% for an 8 h operation regime. An additional inspection found no strong correlation between PV and batteries’ relative errors. This behavior could be due to moderate NRMSEs and negative biases in solar radiation and temperature, which causes considerable differences in the PV panel area. Future studies could focus on evaluating the effect that possible corrections using methods described in the literature [15,18,81] would have on these estimates and the precision of these corrected series. The highest relative errors among all variables correspond to the electricity excess of optimal system configurations based on MERRA2, especially for the 24 h operation regime and relaxed ACS conditions.
The sensitivity analysis found no wind turbines as part of any optimal configuration. However, HOMER calculates the feasible systems comprising at least one N60-1300 turbine, and Table 5 displays the COE results for these arrangements based on the records from the three datasets under consideration. Based on the average minimum COE in Table 5, when the system includes at least one N60-1300 turbine, the kWh is 23% more expensive for a continuous operation and 37% for the 8 h regime when compared with those of the COE column in Table 4.
Table 5.
Cost of energy (COE) in EUR/kWh for feasible systems that include Nordex N60-1300 wind turbines. Abbreviations: Avg.—average, SD—standard deviation.
Regarding these findings on the absence of wind turbines in the optimal configuration, it is worth noting that the data series considered are limited to the location of the meteorological station used. Additionally, the calculations are based on a wind turbine model previously utilized in the region, which could be replaced with another model that could offer a higher capacity factor. Conducting more comprehensive studies could pinpoint sites with a higher wind potential or explore alternative and more efficient technologies. However, these efforts would be contingent upon the availability and quality of data, which is the primary focus of this research.
3.3. Hypothesis Testing Comparing Simulation Results
For a further assessment of the feasibility of using the one-hour resolution time series of MERRA2 and ERA5-Land to substitute ground measurements, the paired t-test and its nonparametric version (Wilcoxon test) allow testing the null hypothesis that the use of reanalysis does not produce statistically significant differences in system costs and configurations [82,83]. The included variables for the 18 optimal systems according to the conditions evaluated in the sensitivity analysis were the scaled values of COE, PV size, energy storage requirements, and electricity excess. Other variables, such as total generation and NPC, were deemed redundant as they directly correlate with some other set variables. Table 6 presents the results of these statistical hypothesis tests. The p-values in Table 6 indicate that we cannot reject the null hypothesis that ERA5-Land produced similar system configurations to those from IDEAM. On the other hand, the results suggest that arrangements obtained from MERRA2 are statistically significantly different from those obtained based on IDEAM records. In simpler words, the results from paired comparisons showed that ERA5-Land produced similar outcomes to IDEAM, while MERRA2 produced considerably different outcomes, indicating a significant difference between the two data sources.
Table 6.
Paired t-test and Wilcoxon signed-rank test results, comparing optimal systems from IDEAM records and reanalysis products.
4. Discussion
Using alternative datasets to address the lack of ground measurements, such as reanalysis products, is only possible after establishing the reliability and goodness of fit with field observations. For this purpose, performance metrics, such as those presented in Table 1, have been extensively used in the literature. Previous research has already assessed the performance of ERA5 and MERRA2 in different locations in Colombia, with varying results. In terms of bias, Table 3 shows that for 2016, ERA5-Land slightly underestimates solar radiation, contrary to Cano et al. [85] and Duarte et al. [39], who found that ERA5 tends to overestimate the observations in Colombian coastal and inland regions. Similarly, the NRMSE values suggest that ERA5-Land is deemed reliable for solar radiation in the study area, whereas Cano et al. [85] found that ERA5 was unreliable for this variable in an area far from the coast, with NRMSE values greater than 50%. Both ERA5-Land and MERRA2 overestimate wind speed, and the literature shows that this variable exhibits a wide range of positive and negative biases in various locations in the Colombian Caribbean, with correlations between IDEAM records and reanalysis as low as 0.23 [24,25]. In general terms, the results in Table 3 show that ERA5-Land is more reliable than MERRA2, similar to findings in previous studies for Colombia and other coastal areas of the world [7,9]. Especially for wind estimations, some authors suggest that this might be explained due to the higher spatial model resolution and the larger amount of observed data employed in the data assimilation process [18].
According to criteria from the literature [60,63,80], performance metrics in Table 3 indicate adequate goodness of fit for solar radiation both for ERA5-Land and MERRA2, similar to results from previous studies [12,21,86]. However, this does not automatically translate into a good fit for the optimal configuration of the renewable energy system derived from using these datasets, as observed from the results shown in Table 6 corresponding to the paired t-test and Wilcoxon test. Although the specific accuracy of reanalysis products varies significantly depending on the dataset, geographical characteristics, or across seasons, the spatiotemporal resolution, multiplicity of variables, and consistency of the models used to generate the time series motivate their application in research related to renewable energies, especially regarding large spatial [13,87,88] and temporal scales [12,89,90]. In general terms, reanalysis datasets reproduce the temporal patterns of climatological variables, making them a valuable asset for long-term planning [2], though with reduced application in small-scale and short-term studies without proper statistical validation [9,14,91] or calibration [17,89].
It is worth mentioning that the literature indicates the possibility of correcting systematic errors and biases in reanalysis models, thus improving their accuracy. These site adaptation measures include bias correction based on ground measurements, downscaling to finer spatial resolution, spatial interpolation, and variable-specific adjustments through physically based methods, regression models, or Measure–Correlate–Predict methods [6]. In any case, they require quality control and validation against independent observations. Additionally, the accuracy of the data series estimated through reanalysis can be influenced by local conditions like elevation and wind regimes, as discussed in detail by Muñoz-Sabater et al. [92] for ERA5-Land.
Similar to previous studies [8,13], reanalysis products exhibited positive biases of up to 40% (in the case of MERRA2) for wind speeds. Nevertheless, considering slight underestimations for solar radiation, the optimal configurations were consistent with those from IDEAM by not including wind turbines, with a relative error for COE below 10%. Follow-up studies in regions with higher wind power potential and performing a sensitivity analysis on the initial cost of renewable energy technologies would provide further insight regarding the impact and the applicability of global and regional reanalysis products on the optimal system configuration.
The COE range between 83 EUR/MWh and 199 EUR/MWh observed in Table 4 for both operational regimes is consistent with the results reported in recent studies evaluating renewable generation in Colombia. For instance, Villada et al. [93] found that the levelized COE for solar panel technologies in Colombia was around 121 EUR/MWh without considering government incentives; a similar approach is followed in this paper. Castillo-Ramírez et al. [94] presented their computational tool, GeoLCOE, and geospatially analyzed the LCOE for renewable projects in Colombia. Their findings indicate LCOE values above 150 EUR/MWh for small PV projects in the La Guajira region. Contrary to our findings related to those least-cost systems that include wind turbines, shown in Table 5, Villada et al. [93] and Castillo-Ramírez et al. [94] indicate that wind power might be a more attractive option in terms of COE than PV for utility-scale projects in coastal areas of Colombia.
Based on the information in Table 2 and the COE results in Table 4, the cost of one cubic meter of desalted water ranges between 0.40 EUR/m3 and 1.60 EUR/m3 considering a continuous operating regime and between 0.20 EUR/m3 and 1.10 EUR/m3 for the 8 h regime, with lower prices corresponding to higher ACS. To provide some perspective from recent studies, the review by Bhojwani et al. [95] assessed small and utility-scale projects for SWRO desalting plants, and they found that based on the electrical energy required to produce water, these costs can be between 0.20 EUR/m3 and 0.40 EUR/m3. Saleh and Mezher [96] used the information from fourteen projects to determine that, without considering externalities, the operational cost of producing potable water using SWRO ranges between 0.50 EUR/m3 and 2.00 EUR/m3. The review by Feria-Díaz et al. [59], who indicates a range from approximately 0.20 EUR/m3 to 1.70 EUR/m3, highlights that the cost of freshwater from SWRO is a function of the temperature and water source quality, process scale, and, as evidenced by the results in Table 4, also the operating conditions and energy source.
In Colombia, the cost of drinking water for homes in cities with full access to public services ranges between approximately 0.20 EUR/m3 and 1.20 EUR/m3, depending on the socioeconomic stratum [97]. However, this is not the situation in many areas of La Guajira, where residents often have to rely on alternative water sources, such as water tanker trucks, due to scarcity, with prices above 6 EUR/m3 [43,44]. In some cases, due to high demand, each family can buy a maximum of 80 L [43]. Non-conventional solutions such as the one evaluated in this paper are options to be considered to solve this social problem in the study region [41,98].
According to Ong et al. [99], the total area of a small PV project with fixed panels, similar to the configuration considered for the present study, corresponds to approximately 3 Ha/MW. Therefore, the optimal systems of the present study would require an area of between 6 and 27 hectares for the solar park. To provide some context within La Guajira, the Jepirachi wind farm, with an installed capacity of 19.5 MW from 15 NORDEX N60-1300 turbines, covers an area of approximately 120 Ha (1 km wide and 1.2 km along the coastline) [69]. The Potreritos PV project, approved in December 2021 by the National Environmental Licensing Authority, is planned to have an installed capacity of 168 MW, covering an area of 278 Ha.
The excess of energy for all optimal configurations from IDEAM data was at least 10%, with higher proportions corresponding to more restrictive ACS levels. Figure 5 and Figure 6 show clear differences between the two reanalyses concerning this variable, with MERRA2 exhibiting pronounced overestimations in all cases and ERA5-Land presenting a better fit with the IDEAM baseline. This surplus from isolated systems is a common discussion topic in this type of research, as minimizing the curtailment is a critical strategy for integrating renewable resources into the power grids, improving economic performance, and reducing greenhouse gas emissions. Besides selling this surplus from stand-alone systems to the interconnected grid, other options include energy storage, electric vehicle charging, hydrogen fuel, and renewable gas production [1,78]. The quality of the data sources might directly impact the accuracy and feasibility of these spin-off projects.
5. Conclusions
Using renewable energy sources is necessary to serve the growing electricity demand and mitigate the effects of anthropogenic global warming caused by fossil fuels. In addition to the socioeconomic reality of developing countries, dealing with the possibility of using renewable energy for potable water production systems and other basic needs is of paramount importance to science and human societies’ well-being. The present article assessed the performance of ERA5-Land and MERRA2 reanalysis data compared to ground measurements in the preliminary optimization of a renewable energy-based water desalination plant, seeking to improve understanding and decision making while contributing to more sustainable and efficient energy planning for water production in data-scarce regions.
Based on performance metrics and results from a sensibility analysis conducted in HOMER Pro, statistical analysis through hypothesis testing supports the feasibility of using ERA5-Land data as an alternative solar resource input in the coastal zone of La Guajira, Colombia, as it produced statistically similar optimal systems as those calculated from IDEAM data. Considering this region’s water scarcity, the hypothetical system proposed for sizing the load corresponds to a desalination plant, using representative energy and water consumption data from the recent literature. Even if the performance metrics evaluating MERRA2 produced relatively accurate results according to the literature, this failed to translate into a system with no statistically significant differences from that sized from IDEAM data. In addition, although both MERRA2 and ERA5-Land overestimate wind speed by more than 20%, none of the optimal configurations in the sensitivity analysis included wind turbines, even if the study area is in the vicinity of the Jepirachi Wind Farm, indicating heterogeneity in the wind regime along the La Guajira coast.
Consequently, the 8 h operating regime produced lower electricity costs than the continuous one. In addition, and considering that the system is not intended to serve baseload, relaxing the ACS constraint to 5% allows the COE to be up to 40% lower than in cases where no outages are allowed. While different nearby locations or wind turbine models could result in different configurations with lower COE and curtailments, the outcomes depend on data availability and quality, which is the focus of this research.
All optimal configurations of the sensitivity analysis resulted in renewable energy fractions above 98%, with COE values close to those observed in the region. Although the results indicate that the cost of producing water from SWRO in the region may be higher than what is observed in other similar studies, they are significantly lower than the current alternative for many people in the region who have to purchase water directly from water tanker trucks.
The main limitation and cautionary note of this research is that it is based on records from a single year due to the scarcity of data in the study area, which in turn was one of the motivations of this work to assess the feasibility of using reanalysis data. Future research directions might include considering a system for attending to the community’s water production and electricity supply, employing longer time series in areas with higher wind power potential within the region, and employing correction methods to improve the accuracy of reanalysis datasets.
Author Contributions
Conceptualization, F.A.C.; methodology, F.A.C. and A.B.; software, F.A.C. and J.V.-B.; validation, F.A.C. and F.C.M.d.M.F.; formal analysis, F.A.C., J.V.-B. and F.C.M.d.M.F.; investigation, J.V.-B., S.H.-C. and J.A.; writing—original draft preparation, F.A.C., J.V.-B., S.H.-C. and F.C.M.d.M.F.; writing—review and editing, F.A.C. and A.B.; visualization, J.A.; supervision, A.B. All authors have read and agreed to the published version of the manuscript.
Funding
This research received no external funding.
Institutional Review Board Statement
Not applicable.
Informed Consent Statement
Not applicable.
Data Availability Statement
The original data presented in the study are openly available in Mendeley Data at https://doi.org/10.17632/2kyf6yvsbh.1.
Acknowledgments
The authors are grateful for the support received by their institutions for the research work that resulted in this paper. The corresponding author would like to acknowledge the ideas of Daniela Ojeda and John Grimaldo from Universidad de la Costa that allowed setting the direction of this research paper.
Conflicts of Interest
The authors declare that they have no known competing financial interests or personal relationships that could have appeared to influence the work reported in this paper.
References
- Wang, S.; Tarroja, B.; Schell, L.S.; Shaffer, B.; Samuelsen, S. Prioritizing among the End Uses of Excess Renewable Energy for Cost-Effective Greenhouse Gas Emission Reductions. Appl. Energy 2019, 235, 284–298. [Google Scholar] [CrossRef]
- Arribas, L.; Lechón, Y.; Perula, A.; Domínguez, J.; Ferres, M.; Navarro, J.; Zarzalejo, L.F.; Barquero, C.G.; Cruz, I. Review of Data and Data Sources for the Assessment of the Potential of Utility-Scale Hybrid Wind–Solar Pv Power Plants Deployment, under a Microgrid Scope. Energies 2021, 14, 7434. [Google Scholar] [CrossRef]
- Mendoza-Fandiño, J.M.; Rhenals-Julio, J.D.; Ávila-Gómez, A.E.; Martínez-Guarín, A.R.; De la Vega González, T.D.; Durango-Padilla, E.R. Heat Absorption Cooling with Renewable Energies: A Case Study with Photovoltaic Solar Energy and Biogas in Cordoba, Colombia. Inge. Cuc. 2021, 17, 21–30. [Google Scholar]
- Canales, F.A.; Jurasz, J.; Kies, A.; Beluco, A.; Arrieta-Castro, M.; Peralta-Cayón, A. Spatial Representation of Temporal Complementarity between Three Variable Energy Sources Using Correlation Coefficients and Compromise Programming. MethodsX 2020, 7, 100871. [Google Scholar] [CrossRef] [PubMed]
- Wang, Y.-H.; Walter, R.K.; White, C.; Farr, H.; Ruttenberg, B.I. Assessment of Surface Wind Datasets for Estimating Offshore Wind Energy along the Central California Coast. Renew. Energy 2019, 133, 343–353. [Google Scholar] [CrossRef]
- Polo, J.; Wilbert, S.; Ruiz-Arias, J.A.; Meyer, R.; Gueymard, C.; Súri, M.; Martín, L.; Mieslinger, T.; Blanc, P.; Grant, I.; et al. Preliminary Survey on Site-Adaptation Techniques for Satellite-Derived and Reanalysis Solar Radiation Datasets. Sol. Energy 2016, 132, 25–37. [Google Scholar] [CrossRef]
- Gualtieri, G. Analysing the Uncertainties of Reanalysis Data Used for Wind Resource Assessment: A Critical Review National Centers for Environmental Prediction. Renew. Sustain. Energy Rev. 2022, 167, 112741. [Google Scholar] [CrossRef]
- Chadee, X.T.; Clarke, R.M. Large-Scale Wind Energy Potential of the Caribbean Region Using near-Surface Reanalysis Data. Renew. Sustain. Energy Rev. 2014, 30, 45–58. [Google Scholar] [CrossRef]
- Vega-Durán, J.; Escalante-Castro, B.; Canales, F.A.; Acuña, G.J.; Kaźmierczak, B. Evaluation of Areal Monthly Average Precipitation Estimates from MERRA2 and ERA5 Reanalysis in a Colombian Caribbean Basin. Atmosphere 2021, 12, 1430. [Google Scholar] [CrossRef]
- Boilley, A.; Wald, L. Comparison between Meteorological Re-Analyses from ERA-Interim and MERRA and Measurements of Daily Solar Irradiation at Surface. Renew. Energy 2015, 75, 135–143. [Google Scholar] [CrossRef]
- Tahir, Z.R.; Asim, M.; Azhar, M.; Moeenuddin, G.; Farooq, M. Correcting Solar Radiation from Reanalysis and Analysis Datasets with Systematic and Seasonal Variations. Case Stud. Therm. Eng. 2021, 25, 100933. [Google Scholar] [CrossRef]
- Pfenninger, S.; Staffell, I. Long-Term Patterns of European PV Output Using 30 Years of Validated Hourly Reanalysis and Satellite Data. Energy 2016, 114, 1251–1265. [Google Scholar] [CrossRef]
- Piasecki, A.; Jurasz, J.; Kies, A. Measurements and Reanalysis Data on Wind Speed and Solar Irradiation from Energy Generation Perspectives at Several Locations in Poland. SN Appl. Sci. 2019, 1, 865. [Google Scholar] [CrossRef]
- Doddy Clarke, E.; Griffin, S.; McDermott, F.; Monteiro Correia, J.; Sweeney, C. Which Reanalysis Dataset Should We Use for Renewable Energy Analysis in Ireland? Atmosphere 2021, 12, 624. [Google Scholar] [CrossRef]
- Staffell, I.; Pfenninger, S. Using Bias-Corrected Reanalysis to Simulate Current and Future Wind Power Output. Energy 2016, 114, 1224–1239. [Google Scholar] [CrossRef]
- Ahmad, M.; Zeeshan, M. Validation of Weather Reanalysis Datasets and Geospatial and Techno-Economic Viability and Potential Assessment of Concentrated Solar Power Plants. Energy Convers. Manag. 2022, 256, 115366. [Google Scholar] [CrossRef]
- Aliana, A.; Chang, M.; Østergaard, P.A.; Victoria, M.; Andersen, A.N. Performance Assessment of Using Various Solar Radiation Data in Modelling Large-Scale Solar Thermal Systems Integrated in District Heating Networks. Renew. Energy 2022, 190, 699–712. [Google Scholar] [CrossRef]
- Gruber, K.; Regner, P.; Wehrle, S.; Zeyringer, M.; Schmidt, J. Towards Global Validation of Wind Power Simulations: A Multi-Country Assessment of Wind Power Simulation from MERRA-2 and ERA-5 Reanalyses Bias-Corrected with the Global Wind Atlas. Energy 2022, 238, 121520. [Google Scholar] [CrossRef]
- Olauson, J. ERA5: The New Champion of Wind Power Modelling? Renew. Energy 2018, 126, 322–331. [Google Scholar] [CrossRef]
- Thomas, S.R.; Nicolau, S.; Martínez-Alvarado, O.; Drew, D.J.; Bloomfield, H.C. How Well Do Atmospheric Reanalyses Reproduce Observed Winds in Coastal Regions of Mexico? Meteorol. Appl. 2021, 28, e2023. [Google Scholar] [CrossRef]
- Ramirez Camargo, L.; Schmidt, J. Simulation of Multi-Annual Time Series of Solar Photovoltaic Power: Is the ERA5-Land Reanalysis the next Big Step? Sustain. Energy Technol. Assess 2020, 42, 100829. [Google Scholar] [CrossRef]
- Mora, S.; Tinjacá, F. Statistical Analysis of Wind Speed and Direction Based on the Rayleigh Distribution Model. LADEE 2021, 2, 32–39. [Google Scholar] [CrossRef]
- Carvajal-Romo, G.; Valderrama-Mendoza, M.; Rodríguez-Urrego, D.; Rodríguez-Urrego, L. Assessment of Solar and Wind Energy Potential in La Guajira, Colombia: Current Status, and Future Prospects. Sustain. Energy Technol. Assess. 2019, 36, 100531. [Google Scholar] [CrossRef]
- Gil Ruiz, S.A.; Barriga, J.E.C.; Martínez, J.A. Wind Power Assessment in the Caribbean Region of Colombia, Using Ten-Minute Wind Observations and ERA5 Data. Renew. Energy 2021, 172, 158–176. [Google Scholar] [CrossRef]
- Gil Ruiz, S.A.; Cañón Barriga, J.E.; Martínez, J.A. Assessment and Validation of Wind Power Potential at Convection-Permitting Resolution for the Caribbean Region of Colombia. Energy 2022, 244, 123127. [Google Scholar] [CrossRef]
- Contreras, D. The Integrated Spatial Pattern of Child Mortality during the 2012-2016 Drought in La Guajira, Colombia. Sustainability 2019, 11, 7190. [Google Scholar] [CrossRef]
- Daza-Daza, A.R.; Serna-Mendoza, C.A.; Carabalí-Angola, A. El Recurso Agua En Las Comunidades Indígenas Wayuu de La Guajira Colombiana. Parte 2: Estudio Cualitativo de Las Condiciones de Higiene, Aseo y Disponibilidad de Agua. Inf. Tecnol. 2018, 29, 25–32. [Google Scholar] [CrossRef]
- HOMER Energy HOMER Pro—Microgrid Software for Designing Optimized Hybrid Microgrids. Available online: https://www.homerenergy.com/products/pro/index.html (accessed on 11 July 2022).
- Das, B.K. Optimal Sizing of Stand-Alone and Grid-Connected Solar PV Systems in Bangladesh. Int. J. Energy A Clean Environ. 2020, 21, 107–124. [Google Scholar] [CrossRef]
- Podder, A.K.; Supti, S.A.; Islam, S.; Malvoni, M.; Jayakumar, A.; Deb, S.; Kumar, N.M. Feasibility Assessment of Hybrid Solar Photovoltaic-Biogas Generator Based Charging Station: A Case of Easy Bike and Auto Rickshaw Scenario in a Developing Nation. Sustainability 2021, 14, 166. [Google Scholar] [CrossRef]
- Johannsen, R.M.; Østergaard, P.A.; Hanlin, R. Hybrid Photovoltaic and Wind Mini-Grids in Kenya: Techno-Economic Assessment and Barriers to Diffusion. Energy Sustain. Dev. 2020, 54, 111–126. [Google Scholar] [CrossRef]
- Dawoud, S.M.; Lin, X.N.; Sun, J.W.; Okba, M.I.; Khalid, M.S.; Waqar, A. Feasibility Study of Isolated PV-Wind Hybrid System in Egypt. Adv. Mat. Res. 2015, 1092–1093, 145–151. [Google Scholar] [CrossRef]
- Veilleux, G.; Potisat, T.; Pezim, D.; Ribback, C.; Ling, J.; Krysztofiński, A.; Ahmed, A.; Papenheim, J.; Pineda, A.M.; Sembian, S.; et al. Techno-Economic Analysis of Microgrid Projects for Rural Electrification: A Systematic Approach to the Redesign of Koh Jik off-Grid Case Study. Energy Sustain. Dev. 2020, 54, 1–13. [Google Scholar] [CrossRef]
- Kamesh, M.R.; Girish Kumar, G.S.; Kiran, C. Sustainable Energy Solutions for Community Housing. IOP Conf. Ser. Earth Environ. Sci. 2020, 573, 012035. [Google Scholar] [CrossRef]
- Elmaadawy, K.; Kotb, K.M.; Elkadeem, M.R.; Sharshir, S.W.; Dán, A.; Moawad, A.; Liu, B. Optimal Sizing and Techno-Enviro-Economic Feasibility Assessment of Large-Scale Reverse Osmosis Desalination Powered with Hybrid Renewable Energy Sources. Energy Convers. Manag. 2020, 224, 113377. [Google Scholar] [CrossRef]
- Maisanam, A.K.S.; Podder, B.; Biswas, A.; Sharma, K.K. Site-Specific Tailoring of an Optimal Design of Renewable Energy System for Remote Water Supply Station in Silchar, India. Sustain. Energy Technol. Assess. 2019, 36, 100558. [Google Scholar] [CrossRef]
- Kotb, K.M.; Elkadeem, M.R.; Khalil, A.; Imam, S.M.; Hamada, M.A.; Sharshir, S.W.; Dán, A. A Fuzzy Decision-Making Model for Optimal Design of Solar, Wind, Diesel-Based RO Desalination Integrating Flow-Battery and Pumped-Hydro Storage: Case Study in Baltim, Egypt. Energy Convers. Manag. 2021, 235, 113962. [Google Scholar] [CrossRef]
- Orfila, A.; Urbano-Latorre, C.P.; Sayol, J.M.; Gonzalez-Montes, S.; Caceres-Euse, A.; Hernández-Carrasco, I.; Muñoz, Á.G. On the Impact of the Caribbean Counter Current in the Guajira Upwelling System. Front. Mar. Sci. 2021, 8, 128. [Google Scholar] [CrossRef]
- Duarte, L.; Revollo, J.; Betancur, D.; Lopez, G.; Isaac, I.; Cardona, H.; Ortega, S. Placement of Weather Stations in Colombia for Future Applications in Solar and Wind Energy Forecasting Models. In Proceedings of the 2019 FISE-IEEE/CIGRE Conference—Living the energy Transition (FISE/CIGRE), Medellin, Colombia, 4–6 December 2019; IEEE: Piscataway, NJ, USA, 2019; pp. 1–6. [Google Scholar]
- Gilbert, J.E.; Gilbertson, T.; Jakobsen, L. Incommensurability and Corporate Social Technologies: A Critique of Corporate Compensations in Colombia’s Coal Mining Region of La Guajira. J. Polit. Ecol. 2021, 28, 434–452. [Google Scholar] [CrossRef]
- Acosta Cubides, L.D.; Herrera Quintero, S. Metodología Para El Uso de Captadores de Rocío. Una Aproximación a Una Solución Sostenible para el Recurso Hídrico en Maicao, La Guajira. 2021. Available online: https://hdl.handle.net/20.500.11839/8594 (accessed on 11 November 2022).
- Cámara de Comercio de La Guajira. Informe Socioeconómico de La Guajira 2021; Cámara de Comercio de La Guajira: Riohacha, Colombia, 2021. [Google Scholar]
- La Realidad Del Hambre: Cada Seis Días Ha Muerto Un Niño En La Guajira En 2022. La Opinión, 22 May 2022.
- Mejía Ospino, E. Habitantes de Barrancas Denuncian Que Llevan Más de Un Mes Sin Agua. El Tiempo, 28 December 2021. [Google Scholar]
- Guerrero, S. El Agua de Camarones No Es Apta Para El Consumo Humano. El Heraldo, 15 October 2021. [Google Scholar]
- Barrios Florez, E.A. Indígenas Wayú Realizan Bloqueos En La Guajira, En Protesta Por La Falta de Agua. RCN Radio, 28 June 2022. [Google Scholar]
- La Guajira Hoy. En La Guajira, Comunidad Indígena Se Beneficia Con Planta Desalinizadora de Agua. La Guajira Hoy, 1 April 2022.
- La Guajira Hoy. En Extremo Norte de La Guajira No Hay Agua Para Consumo Humano. La Guajira Hoy, 3 May 2022.
- IDEAM Consulta y Descarga de Datos Hidrometeorológicos. Available online: http://dhime.ideam.gov.co/atencionciudadano/ (accessed on 10 October 2020).
- Quagraine, K.A.; Nkrumah, F.; Klein, C.; Klutse, N.A.B.; Quagraine, K.T. West African Summer Monsoon Precipitation Variability as Represented by Reanalysis Datasets. Climate 2020, 8, 111. [Google Scholar] [CrossRef]
- Pedreira, A.L.; Biudes, M.S.; Machado, N.G.; Vourlitis, G.L.; Geli, H.M.E.; Dos Santos, L.O.F.; Querino, C.A.S.; Ivo, I.O.; Neto, N.L. Assessment of Remote Sensing and Reanalysis Estimates of Regional Precipitation over Mato Grosso, Brazil. Water 2021, 13, 333. [Google Scholar] [CrossRef]
- Gelaro, R.; McCarty, W.; Suárez, M.J.; Todling, R.; Molod, A.; Takacs, L.; Randles, C.A.; Darmenov, A.; Bosilovich, M.G.; Reichle, R.; et al. The Modern-Era Retrospective Analysis for Research and Applications, Version 2 (MERRA-2). J. Clim. 2017, 30, 5419–5454. [Google Scholar] [CrossRef] [PubMed]
- Global Modeling and Assimilation Office (GMAO). MERRA-2 Tavg1_2d_slv_Nx: 2d,1-Hourly, Time-Averaged, Single-Level, Assimilation, Single-Level Diagnostics V5.12.4. Available online: https://www.soda-pro.com/web-services/meteo-data/merra (accessed on 12 December 2021).
- Zou, J.; Lu, N.; Jiang, H.; Qin, J.; Yao, L.; Xin, Y.; Su, F. Performance of Air Temperature from ERA5-Land Reanalysis in Coastal Urban Agglomeration of Southeast China. Sci. Total Environ. 2022, 828, 154459. [Google Scholar] [CrossRef] [PubMed]
- Muñoz Sabater, J.; ERA5-Land Hourly Data from 1981 to Present. Copernicus Climate Change Service (C3S) Climate Data Store (CDS). Available online: https://cds.climate.copernicus.eu/cdsapp#!/dataset/reanalysis-era5-land (accessed on 10 October 2021).
- Minvivienda. Republic of Colombia: Minvivienda. Resolución 0330 de 2017. 2017. Available online: https://www.minvivienda.gov.co/sites/default/files/documentos/0330-2017.pdf (accessed on 11 April 2022).
- Veolia Sabana, S.A.E.S.P. Veolia Colombia. Available online: https://www.veolia.com.co/sabana/ (accessed on 2 February 2022).
- Hagen, I.; Huggel, C.; Ramajo, L.; Chacón, N.; Ometto, J.P.; Postigo, J.C.; Castellanos, E.J. Climate Change-Related Risks and Adaptation Potential in Central and South America during the 21st Century. Environ. Res. Lett. 2022, 17, 033002. [Google Scholar] [CrossRef]
- Feria-Díaz, J.J.; Correa-Mahecha, F.; López-Méndez, M.C.; Rodríguez-Miranda, J.P.; Barrera-Rojas, J. Recent Desalination Technologies by Hybridization and Integration with Reverse Osmosis: A Review. Water 2021, 13, 1369. [Google Scholar] [CrossRef]
- Lemma, E.; Upadhyaya, S.; Ramsankaran, R.A.A.J. Investigating the Performance of Satellite and Reanalysis Rainfall Products at Monthly Timescales across Different Rainfall Regimes of Ethiopia. Int. J. Remote Sens. 2019, 40, 4019–4042. [Google Scholar] [CrossRef]
- Yu, Z.; Wu, J.; Chen, X. An Approach to Revising the Climate Forecast System Reanalysis Rainfall Data in a Sparsely-Gauged Mountain Basin. Atmos. Res. 2019, 220, 194–205. [Google Scholar] [CrossRef]
- Chawla, I.; Mujumdar, P.P. Evaluating Rainfall Datasets to Reconstruct Floods in Data-Sparse Himalayan Region. J. Hydrol. 2020, 588, 125090. [Google Scholar] [CrossRef]
- Wang, N.; Liu, W.; Sun, F.; Yao, Z.; Wang, H.; Liu, W. Evaluating Satellite-Based and Reanalysis Precipitation Datasets with Gauge-Observed Data and Hydrological Modeling in the Xihe River Basin, China. Atmos. Res. 2020, 234, 104746. [Google Scholar] [CrossRef]
- Springer, A.; Eicker, A.; Bettge, A.; Kusche, J.; Hense, A.; Mahto, S.S.; Pandey, A.C.; Huang, B.; Cubasch, U.; Li, Y.; et al. Evaluation of the Water Cycle in the European COSMO-REA6 Reanalysis Using GRACE. Water 2017, 9, 289. [Google Scholar] [CrossRef]
- Mehrjerdi, H. Modeling and Optimization of an Island Water-Energy Nexus Powered by a Hybrid Solar-Wind Renewable System. Energy 2020, 197, 117217. [Google Scholar] [CrossRef]
- Canales, F.A.; Beluco, A.; Mendes, C.A.B. Modelling a Hydropower Plant with Reservoir with the Micropower Optimisation Model (HOMER). Int. J. Sustain. Energy 2017, 36, 654–667. [Google Scholar] [CrossRef]
- Movahediyan, Z.; Askarzadeh, A. Multi-Objective Optimization Framework of a Photovoltaic-Diesel Generator Hybrid Energy System Considering Operating Reserve. Sustain. Cities Soc. 2018, 41, 1–12. [Google Scholar] [CrossRef]
- HOMER Energy Suggested Lifetime Throughput. Available online: https://www.homerenergy.com/products/pro/docs/latest/suggested_lifetime_throughput.html (accessed on 3 March 2022).
- Pinilla, A.; Rodriguez, L.; Trujillo, R. Performance Evaluation of Jepirachi Wind Park. Renew. Energy 2009, 34, 48–52. [Google Scholar] [CrossRef]
- Barrientos Marín, J.; Villada, F. Regionalized Discount Rate to Evaluate Renewable Energy Projects in Colombia. Int. J. Energy Econ. Policy 2020, 10, 332–336. [Google Scholar] [CrossRef]
- Bitar, S.; Chamas, F. Estudio de Factibilidad Para La Implementacion de Sistemas Fotovoltaicos Como Fuente de Energía En El Sector Industrial de Colombia. Master’s, Thesis, Colegio de Estudios Superiores de Administración (CESA), Bogotá, Colombia, 2017. [Google Scholar]
- Baek, S.; Park, E.; Kim, M.-G.; Kwon, S.J.; Kim, K.J.; Ohm, J.Y.; del Pobil, A.P. Optimal Renewable Power Generation Systems for Busan Metropolitan City in South Korea. Renew. Energy 2016, 88, 517–525. [Google Scholar] [CrossRef]
- Lacal Arantegui, R.; Jaeger-Waldau, A.; Vellei, M.; Sigfusson, B.; Magagna, D.; Jakubcionis, M.; Del Mar Perez Fortes, M.; Moles, C.; Lazarou, S.; Giuntoli, J.; et al. ETRI 2014—Energy Technology Reference Indicator Projections for 2010–2050; Publications Office of the European Union: Petten, The Netherlands, 2014; ISBN 9789279444036. [Google Scholar]
- Guezgouz, M.; Jurasz, J.; Bekkouche, B.; Ma, T.; Javed, M.S.; Kies, A. Optimal Hybrid Pumped Hydro-Battery Storage Scheme for off-Grid Renewable Energy Systems. Energy Convers. Manag 2019, 199, 112046. [Google Scholar] [CrossRef]
- California Energy Comission PV Modules. Available online: http://www.gosolarcalifornia.ca.gov/equipment/pv_modules.php (accessed on 12 December 2017).
- Kim, I.; James, J.A.; Crittenden, J. The Case Study of Combined Cooling Heat and Power and Photovoltaic Systems for Building Customers Using HOMER Software. Electr. Power Syst. Res. 2017, 143, 490–502. [Google Scholar] [CrossRef]
- Nordex N60/1300 KW Specifications. Available online: http://www.nordex-online.com/fileadmin/MEDIA/Produktinfos/EN/Nordex_N60_EN.pdf (accessed on 10 October 2021).
- Canales, F.A.; Jurasz, J.K.; Guezgouz, M.; Beluco, A. Cost-Reliability Analysis of Hybrid Pumped-Battery Storage for Solar and Wind Energy Integration in an Island Community. Sustain. Energy Technol. Assess. 2021, 44, 101062. [Google Scholar] [CrossRef]
- Ramli, M.A.M.; Hiendro, A.; Sedraoui, K.; Twaha, S. Optimal Sizing of Grid-Connected Photovoltaic Energy System in Saudi Arabia. Renew. Energy 2015, 75, 489–495. [Google Scholar] [CrossRef]
- Akoglu, H. User’s Guide to Correlation Coefficients. Turk. J. Emerg. Med. 2018, 18, 91–93. [Google Scholar] [CrossRef]
- Carvalho, D. An Assessment of NASA’s GMAO MERRA-2 Reanalysis Surface Winds. J. Clim. 2019, 32, 8261–8281. [Google Scholar] [CrossRef]
- Canales, F.A.; Beluco, A.; Mendes, C.A.B. A Matter of Cost. Int. Water Power Dam Constr. 2008, 60, 43–45. [Google Scholar]
- Karimi, L.; Abkar, L.; Aghajani, M.; Ghassemi, A. Technical Feasibility Comparison of Off-Grid PV-EDR and PV-RO Desalination Systems via Their Energy Consumption. Sep. Purif. Technol. 2015, 151, 82–94. [Google Scholar] [CrossRef]
- Goss-Sampson, M.A. Statistical Analysis in JASP: A Guide for Students, 2nd ed.; University of Amsterdam: Amsterdam, The Netherlands, 2019. [Google Scholar]
- Cano, L.M.; Carmona, M.A.; Martínez, J.A.; Arias, P.A. Estimación y Pronóstico de Radiación Solar En El Valle de Aburrá—Colombia. Rev. Acad. Colomb. Cienc. Exactas Fis. Nat. 2022, 46, 529–549. [Google Scholar] [CrossRef]
- Khatibi, A.; Krauter, S. Validation and Performance of Satellite Meteorological Dataset Merra-2 for Solar and Wind Applications. Energies 2021, 14, 882. [Google Scholar] [CrossRef]
- Zhang, H.; Cao, Y.; Zhang, Y.; Terzija, V. Quantitative Synergy Assessment of Regional Wind-Solar Energy Resources Based on MERRA Reanalysis Data. Appl. Energy 2018, 216, 172–182. [Google Scholar] [CrossRef]
- Kapica, J.; Canales, F.A.; Jurasz, J. Global Atlas of Solar and Wind Resources Temporal Complementarity. Energy Convers. Manag. 2021, 246, 114692. [Google Scholar] [CrossRef]
- Anastasiades, G.; McSharry, P.E. Extreme Value Analysis for Estimating 50 Year Return Wind Speeds from Reanalysis Data. Wind Energy 2014, 17, 1231–1245. [Google Scholar] [CrossRef]
- Cannon, D.J.; Brayshaw, D.J.; Methven, J.; Coker, P.J.; Lenaghan, D. Using Reanalysis Data to Quantify Extreme Wind Power Generation Statistics: A 33 Year Case Study in Great Britain. Renew. Energy 2015, 75, 767–778. [Google Scholar] [CrossRef]
- Ramirez Camargo, L.; Gruber, K.; Nitsch, F. Assessing Variables of Regional Reanalysis Data Sets Relevant for Modelling Small-Scale Renewable Energy Systems. Renew. Energy 2019, 133, 1468–1478. [Google Scholar] [CrossRef]
- Muñoz-Sabater, J.; Dutra, E.; Agustí-Panareda, A.; Albergel, C.; Arduini, G.; Balsamo, G.; Boussetta, S.; Choulga, M.; Harrigan, S.; Hersbach, H.; et al. ERA5-Land: A State-of-the-Art Global Reanalysis Dataset for Land Applications. Earth Syst. Sci. Data 2021, 13, 4349–4383. [Google Scholar] [CrossRef]
- Villada, F.; Saldarriaga-Loaiza, J.D.; López-Lezama, J.M. Incentives for Renewable Energies in Colombia. Renew. Energy Power Qual. J. 2021, 19, 24–26. [Google Scholar] [CrossRef]
- Castillo-Ramirez, A.; Mejia-Giraldo, D.; Giraldo-Ocampo, J.D. Geospatial Levelized Cost of Energy in Colombia: GeoLCOE. In Proceedings of the 2015 IEEE PES Innovative Smart Grid Technologies Latin America (ISGT LATAM), Montevideo, Uruguay, 5–7 October 2015; IEEE: Piscataway, NJ, USA, 2015; pp. 298–303. [Google Scholar]
- Bhojwani, S.; Topolski, K.; Mukherjee, R.; Sengupta, D.; El-Halwagi, M.M. Technology Review and Data Analysis for Cost Assessment of Water Treatment Systems. Sci. Total Environ. 2019, 651, 2749–2761. [Google Scholar] [CrossRef] [PubMed]
- Saleh, L.; Mezher, T. Techno-Economic Analysis of Sustainability and Externality Costs of Water Desalination Production. Renew. Sustain. Energy Rev. 2021, 150, 111465. [Google Scholar] [CrossRef]
- Fernández, D.; Saravia Matus, S.; Gil, M. Políticas Regulatorias y Tarifarias En El Sector de Agua Potable y Saneamiento En América Latina y El Caribe; Comisión Económica para América Latina y el Caribe (CEPAL): Santiago, Chile, 2021; Volume 205. [Google Scholar]
- Párraga Meneses, M.; Fajardo Jaimes, A.; Vuelvas Quintana, J. An Optimized Management Model of the Resources Embedded on an Isolated Water-Energy Microgrid for a Ranchería. In Proceedings of the 2021 IEEE 5th Colombian Conference on Automatic Control (CCAC), Ibague, Colombia, 19–22 October 2021; IEEE: Ibagué, Colombia, 2021; pp. 98–103. [Google Scholar]
- Ong, S.; Campbell, C.; Denholm, P.; Margolis, R.; Heath, G. Land-Use Requirements for Solar Power Plants in the United States; National Renewable Energy Laboratory (NREL): Golden, CO, USA, 2013. [Google Scholar]

Disclaimer/Publisher’s Note: The statements, opinions and data contained in all publications are solely those of the individual author(s) and contributor(s) and not of MDPI and/or the editor(s). MDPI and/or the editor(s) disclaim responsibility for any injury to people or property resulting from any ideas, methods, instructions or products referred to in the content. |
© 2024 by the authors. Licensee MDPI, Basel, Switzerland. This article is an open access article distributed under the terms and conditions of the Creative Commons Attribution (CC BY) license (https://creativecommons.org/licenses/by/4.0/).