Article

Carbon Emissions Drivers and Reduction Strategies in Jiangsu Province

1
Business School, Hohai University, Nanjing 210098, China
2
Low Carbon Economy Research Institute, Hohai University, Nanjing 210098, China
3
Statistics and Data Science Research Institute, Hohai University, Nanjing 210098, China
4
School of Public Administration, Hohai University, Nanjing 210098, China
*
Author to whom correspondence should be addressed.
Sustainability 2024, 16(13), 5276; https://doi.org/10.3390/su16135276
Submission received: 30 May 2024 / Revised: 16 June 2024 / Accepted: 19 June 2024 / Published: 21 June 2024
(This article belongs to the Section Air, Climate Change and Sustainability)

Abstract

:
China embarked on the implementation of a comprehensive national strategy aimed at reducing greenhouse gas (GHG) emissions in 2020, with ambitious targets to achieve peak emissions by 2030 and attain carbon neutrality by 2060. Given the challenges, thoroughly investigating China’s carbon emissions status and outlining reduction pathways for each province is crucial. Based on calculating carbon emissions in Jiangsu Province, this article uses the Logarithmic Mean Divisia Index (LMDI) model to decompose and analyze the factors that affect carbon emissions. This article starts with provincial carbon emissions to find the core factors and then narrows the research scope to the city level to make carbon reduction policies more targeted. When decomposing carbon emissions, this article not only selects energy structure, energy efficiency, economic development, population size, and industrial structure factors commonly used in the LMDI model but also adds the factor of external electricity to research indirect carbon emissions. The final conclusions mainly include the following: firstly, the economic development and energy efficiency factors in Jiangsu Province are the core influencing factors for carbon emissions. The former promotes carbon emissions, while the latter reduces it, and the impact gradually weakens. The energy structure and industrial structure have reduced carbon emissions, while population size and electricity transfer have increased carbon emissions. Furthermore, notable disparities in carbon emissions exist among cities within Jiangsu Province, with varying impacts stemming from diverse driving factors. Upon comprehensive evaluation of the collective carbon reduction impact, Nanjing and Suzhou emerge as cities with a low contribution rate attributable to their industrial structure. Wuxi, Zhenjiang, and Xuzhou, on the other hand, exhibit a low contribution rate associated with their energy structure. Taizhou and Nantong demonstrate a low contribution rate in energy efficiency, while Changzhou, Huai’an, and Yangzhou display a low contribution rate in both industry and energy structure. Lianyungang, Suqian, and Yancheng present low contribution rates across all three factors. Recognizing the distinctive energy and industrial profiles of each city, governmental policies should be formulated with uniformity, fairness, and flexibility, effectively realizing the dual carbon objectives.

1. Introduction

1.1. Research Background

The escalating concentration of greenhouse gases, primarily carbon dioxide, and their catastrophic consequences have been highly valued around the world [1]. Mitigating carbon emissions has not only emerged as a focal point of scientific research but has also risen to become a global political, economic, and social dimension [2]. China, as a significant carbon emitter among developing countries, faces significant pressure to reduce carbon emissions, particularly when compared to developed countries that have already reached a carbon peak. To address the greenhouse effect and control carbon emissions at the source, China has proposed and implemented a goal of ‘carbon peaking and carbon neutrality’ [3,4]. However, significant differences exist across areas, including geography, economic growth, and industrial structure [5]. Therefore, to achieve this goal nationwide, local governments need to develop appropriate strategies based on their conditions. While the Chinese government has articulated representative dual carbon strategy goals, the refinement of carbon reduction policies at the provincial level remains imperative to align with these overarching objectives.
Jiangsu Province, the study area for this paper, is a national economically developed region located on the eastern coast of China; with large-scale manufacturing clusters [6], it is also a major emitter of carbon dioxide. Jiangsu Province, despite its relatively small land area constituting only 1.12% of the nation’s total territory, commands a significant economic footprint, contributing approximately 10.2% to the country’s overall GDP. Given its stature as a major economic hub, the achievement of Jiangsu Province’s carbon emissions reduction targets carries profound implications for the entire nation. The nascent stages of economic development were characterized by heavy reliance on fossil energy sources. However, the combustion of these fuels resulted in the emissions of considerable volumes of greenhouse gases and pollutants, including carbon dioxide and sulfur dioxide. Such emissions have significantly contributed to pressing environmental concerns such as global climate change and the proliferation of acid rain. In addition, fossil fuels are finite, non-renewable resources. With the continuous development of the economy in Jiangsu Province and the increasing demand for energy, the pressure on fossil fuels is escalating. Depletion of these resources would severely impact Jiangsu Province’s energy security and economic growth. The total consumption of fossil energy in Jiangsu Province has surged from 89 million tons in 2000 to 292 million tons in 2021, with an average annual growth rate of 150%. Moreover, consumption of raw coal and coke has consistently outpaced other fossil energy sources. From an energy structure perspective, coal consumption comprised 56.2% of the total energy consumption in 2021, while non-fossil energy sources accounted for a mere 13.5%. In alignment with the imperative of achieving the “dual carbon” objectives within the designated timeframe, Jiangsu Province has set forth ambitious targets aimed at bolstering energy utilization efficiency and output efficiency by 2025. These targets encompass clear benchmarks for reducing energy consumption intensity across diverse regions and industries. Concurrently, the “Jiangsu Province Carbon Peak Implementation Plan” delineates a suite of policies geared towards expediting the green transformation of industrial structures and fostering the emergence of advanced manufacturing clusters. Due to the province’s large amount of energy consumption, limited supply of clean energy, and the heavy task of improving the ecological environment, Jiangsu Province is confronting significant pressures in navigating a transition towards low-carbon practices and fostering high-quality development. Presently, the volume of carbon emissions has exhibited minimal fluctuation, signaling an era of sluggish transformation. This trend is not exclusive to Jiangsu Province but extends to other provinces akin to Jiangsu, such as Zhejiang Province, which grapple with analogous challenges. This collective experience underscores the pivotal juncture at which the imperative of attaining a carbon peak has now arrived [7].
Moreover, developmental disparities among different regions in Jiangsu Province exert significant pressure on energy structure transformation and carbon reduction efforts. This province comprises 13 cities, with significant differences in the economic development of cities in the southern and northern parts of the province. Notably, southern cities typified by Nanjing boast developed economies, boasting a per capita GDP of CNY 178,000, whereas their northern counterparts, represented by Xuzhou, exhibit comparatively underdeveloped economic landscapes with a per capita GDP of CNY 93,700. In addition to economic development, these cities differ in factors such as industrial structure and energy structure. In terms of industrial structure, Nanjing’s industrial development focuses on high-tech industries, such as artificial intelligence, semiconductors, hydrogen energy storage, etc., and is similar to Suzhou. Changzhou and Yangzhou represent cities with traditional manufacturing industries as the backbone, mainly including Wuxi and Zhenjiang, which are focusing on the development of advanced manufacturing industries such as new-energy automobiles and new material. Suqian represents the remaining cities in Jiangsu province that are still continuously undergoing industrial restructuring and have not shown obvious structural advantages. In terms of energy structure, most of the cities are still using coal as their main consumption resource. However, Suqian, Lianyungang, Yancheng, and Huai’an are all developing photovoltaic power generation, with Lianyungang building China’s largest offshore photovoltaic power plant. This paper posits that disparities in economic development, industrial composition, and energy infrastructure will inevitably influence the efficacy of each factor in driving carbon emissions. Consequently, there is a pressing need to dissect the driving forces operating within different cities and formulate policies that concurrently prioritize uniformity, fairness, and flexibility. As Jiangsu Province serves as a quintessential example of a region grappling with substantial carbon emissions and notable regional variations, its study holds broader implications for the entire East China region and the nation at large in achieving carbon peak and carbon neutrality objectives.

1.2. Literature Review

Before delving into the underlying factors driving carbon emissions and the potential for reduction, it is essential to calculate carbon emissions. Currently, there are two primary methods for this calculation: the life cycle method and the carbon emissions factor method. The life cycle method provides a comprehensive account of an activity in terms of carbon emissions from beginning to end. This approach is widely applied to measure global carbon emissions [8], and can also be used to quantity emissions from specific national sectors or even individual activities [9,10]. Due to the focus of this research method on the entire process, the smaller the research scope, the more obvious the advantages of this research. On the other hand, the carbon emissions factor method is simpler to calculate and does not require the establishment of a complex full-process model. It only requires obtaining energy consumption data for calculation. Therefore, when conducting research at the national or government level, this method is commonly used [11,12].
Based on calculating carbon emissions, the next step is to decompose the driving factors. The purpose of decomposing is to understand the different roles that different factors play in carbon emissions, identify the core factors through comparative analysis, and then analyze the potential for carbon emissions. In terms of carbon emissions factor decomposition, scholars have attempted several different decomposition methods. One is the Structural Decomposition Approach (SDA), based on the idea that changes in the dependent variable in an economic system can be replaced by changes in other independent variables [13,14,15]. The other is the Index Decomposition Analysis [16,17,18], which can calculate the contribution of the main factors influencing regional carbon emissions. Early exponential decomposition models were mainly based on simple arithmetic or geometric mean decomposition methods, which had the problem of not fully decomposing variables. The Logarithmic Mean Divisia Index (LMDI) was proposed by Ang based on the IDA method and has been widely used since then [19]. From the perspective of research scope, the LMDI model was first applied to decompose the driving factors of national carbon emissions. Earlier (2007), based on LMDI, Liu et al. analyzed the change of industrial carbon emissions from 36 industrial sectors in China and decomposed it into energy intensity, industrial structural shift, industrial activity, and final fuel shift [20]. Scholars such as De used the LMDI method to study the impact of power generation capacity factors on electricity carbon emissions intensity in Latin America and the Caribbean region; the results showed that the capacity factors of fossil-based generation in Venezuela, Mexico, and Brazil are relevant in driving the increase [21]. In recent years, the application scope of this method has narrowed down to regions, such as Chen et al. and Meng et al. introducing the model into the Yangtze River Delta region and the Yellow River Basin [22,23]. These studies have developed more generalized policy recommendations from a regional perspective and have not taken into account the specificities of the cities in the region [24,25]. And when analyzing the factors affecting carbon emissions, most of the literature considers energy efficiency, industrial structure, and economic growth [26,27].
The previous research on the driving factors of carbon emissions has great reference value. However, there remain few systematic studies on the carbon emissions of cities within the province. The formulation and implementation of carbon emissions reduction policies in China operate at the city level, necessitating a nuanced consideration of each city’s unique circumstances. Indeed, disparities in energy and industrial structures, among other aspects, exist among the cities within Jiangsu Province. However, the existing research predominantly adopts a provincial-level perspective, thereby yielding limited comparative insights into the diverse cities within the same province. So, the focus of research should be shifted to provinces and cities in order to formulate targeted policies to help reduce carbon emissions. Additionally, most of the research results mainly examined five major factors: industrial structure, energy efficiency, demographic factors, energy structure, and economic development. This provides a reference for this paper to set the indicators of carbon emissions drivers. In addition, the existing research has mainly considered the influencing factors of direct carbon emissions, without considering the impact of the input power factor representing indirect carbon emissions on carbon emissions. As the flow of electricity becomes increasingly frequent, its impact on carbon emissions should not be ignored. Therefore, this article considers this factor in the LMDI model, filling the research gap in this area.
The main problem that this article aims to address is to further narrow the research scope, starting from the characteristics of carbon emissions driving factors in different cities, and to address the current problem of vague carbon emissions reduction policy formulation and neglect of the uniqueness of each city due to the large research scope. In addition, this article will consider indirect carbon emissions represented by the inflow of electricity, analyze the impact of this factor on overall carbon emissions, and achieve better carbon reduction effects by coordinating the inflow of electricity. The contributions of this article are twofold. Firstly, cross-provincial and city electricity transfers are very common. However, there is relatively little research on the impact of electricity inflow on carbon emissions. Therefore, the factor of electricity transfer has been added. Electricity is an important energy component, and considering its impact on carbon emissions, this article for the first time incorporates the factor of electricity inflow into the process of driving factor decomposition. Secondly, due to the significant gap in development and carbon emissions within Jiangsu Province, to provide more targeted recommendations with uniformity, fairness, and flexibility, this article analyzes the decomposition results from a spatiotemporal perspective. It is hoped that different suggestions can be proposed for cities with different carbon emissions characteristics so that each city can formulate more targeted carbon reduction strategies.

1.3. Paper Structure

Focusing on Jiangsu Province, this study delves into analyzing how the different factors influence the carbon emissions and where the potential to reduce the emissions is, following the approach of raising questions, solving problems, and drawing conclusions. Firstly, in the Section 1, the current status of carbon emissions and research results are analyzed to identify the issues that should be studied. Secondly, in the Section 2, the data sources and methods are introduced. Then, in the Section 3 and Section 4, the results are analyzed and discussed to draw conclusions and policy recommendations. By quantifying the carbon emissions, the paper grasps the differences in carbon emissions drivers and then delves into the carbon emissions reduction potential in the province. Moreover, this paper aims to provide decision-makers with valuable suggestions for formulating targeted carbon emissions reduction policies. It contributes to the province’s efforts in achieving sustainable development and mitigating the impacts of climate change.

2. Materials and Methods

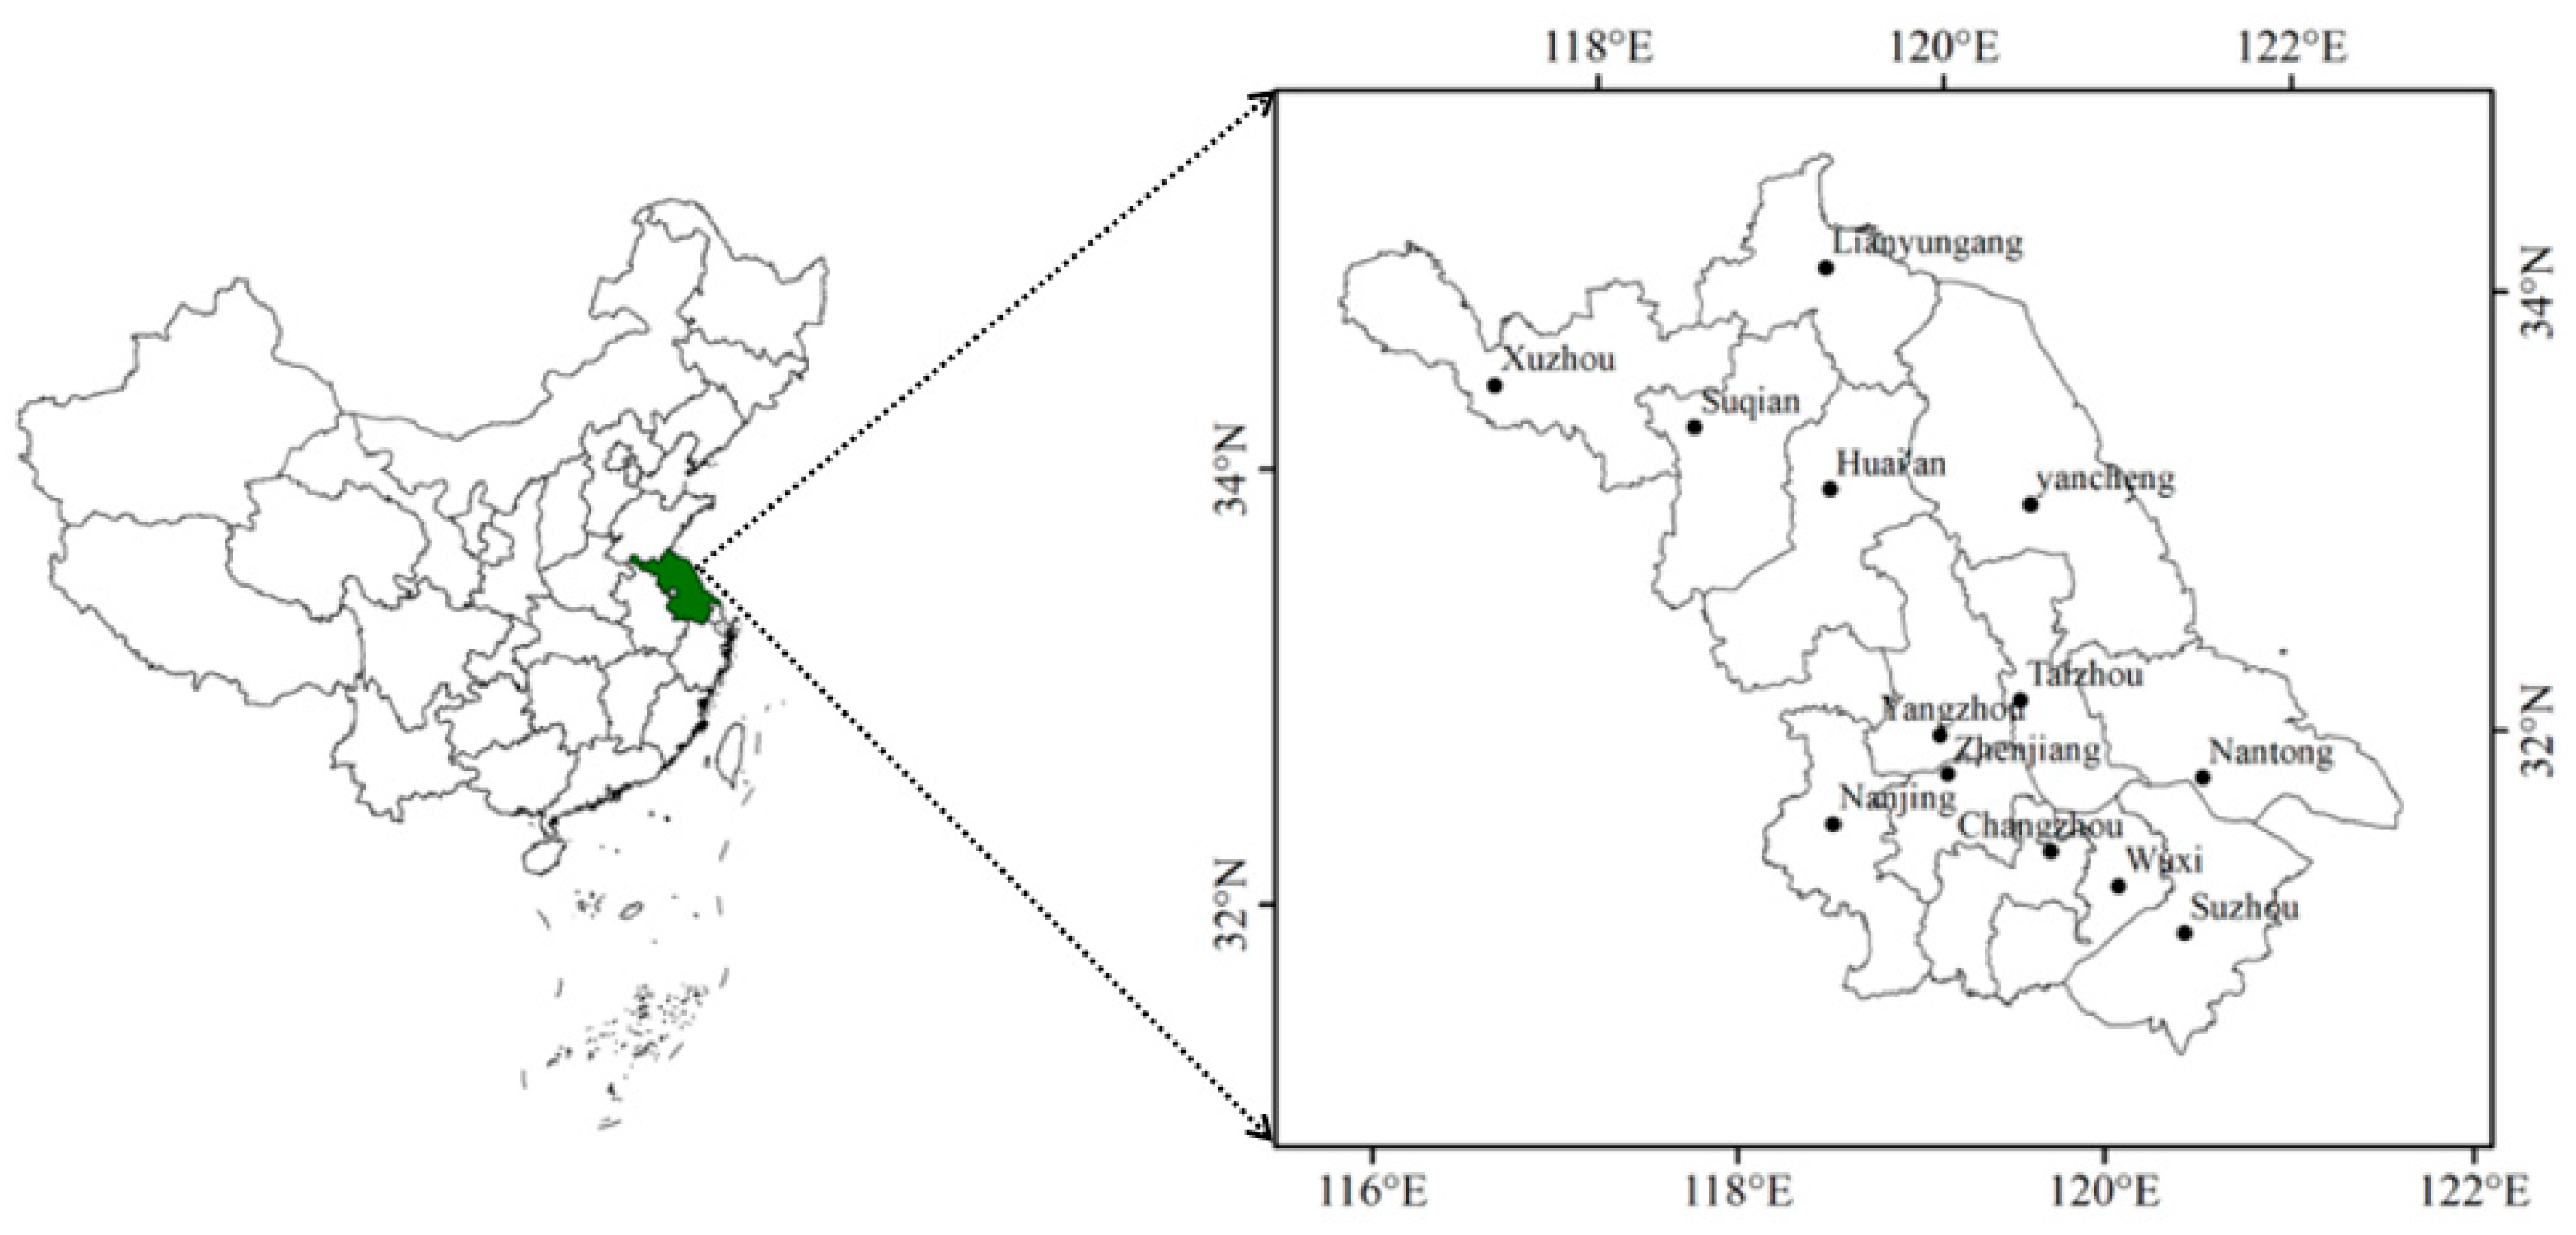
2.1. Research Scheme

The research sequence of this paper is as follows:
Firstly, we collect and process the data to obtain the basic data needed for calculating carbon emissions. Secondly, we construct the carbon emissions calculation model, and the collected data are substituted into the model to calculate carbon emissions to analyze the historical trend and current situation of carbon emissions in Jiangsu Province, and we provide basic data for the mentioned calculation. Thirdly, we analyze the carbon emissions situation, and then, according to the characteristics of each city, we select appropriate factors and build the LMDI model, decompose carbon emissions so as to analyze the different roles played by different factors in different cities, and thus provide a basis for the subsequent carbon reduction potential mining of different cities. Fourthly, according to the model decomposition results, the emissions reduction potential of each city is analyzed. Finally, according to the carbon emissions reduction potential of different cities, specific emissions reduction suggestions are obtained.

2.2. Sources of the Data

To calculate carbon emissions, this article collected energy consumption data and selected nine types of energy from two aspects: data disclosure and energy use. The energy includes raw coal, coke, crude oil, gasoline, kerosene, diesel fuel, fuel oil, liquefied petroleum gas, and electric power. There is an inconsistency in the unit of energy consumption in the statistical yearbook. We have converted it to 10,000 tons and converted it into standard coal according to the energy conversion coefficients in the “China Energy Statistical Yearbook 2020”. The carbon emissions factors used in carbon emissions accounting in the article are obtained from the IPCC emissions inventory. In addition, this article also uses economic and demographic data, allowing for the decomposition of carbon emissions through the LMDI model, mainly including various energy consumption factors, regional GDP, the amount of imported electricity, and the number of people in each region. Part of the data come from the 2001–2021 Statistical Yearbook of Jiangsu Province and 13 cities. For some missing data in the yearbook, this article uses the median method to supplement it; that is, the median of the previous and following two years of data is added in the blank space.
Jiangsu Province is located in the Yangtze River Delta and on the eastern coast of China (Figure 1). The total area is 107,200 square kilometers, with a total of 13 districts and cities. At the end of 2022, the permanent population of the province was 85.15 million. All prefecture-level cities under its jurisdiction have entered the top 100 in the country, with the development and livelihood index ranking first in the province. Additionally, it has the largest manufacturing industry group in the country, and the per capita GDP is the first in China.

2.3. Carbon Emissions Calculation Model

Carbon emissions calculation is the basic content of this article and also the basis for subsequent decomposition analysis. There are currently two ways to calculate carbon emissions. The lifecycle model calculates the carbon emissions generated in each stage of an activity from the beginning to the end, which is a complex calculation activity commonly used in small-scale carbon emissions calculation processes. The carbon emissions factor calculation model calculates carbon emissions through energy consumption and emissions factors, which is suitable for a more macro research scope, such as countries or regions. Carbon emissions calculation mainly includes direct carbon dioxide generated by fossil energy consumption and indirect carbon emissions from electricity consumption. Carbon also comes from non-energy activities, such as industrial production processes, land-use change, and forestry [28]. However, considering the small proportion of carbon emissions from non-energy activities and the comparability of carbon emissions in different regions, regional carbon emissions are mainly calculated by direct and indirect carbon emissions.
The calculation boundaries for carbon emissions in Jiangsu Province and various cities in this article are defined as follows:
(1)
Carbon emissions refer to CO2 emissions, excluding other greenhouse gas emissions;
(2)
The energy used to calculate carbon emissions mainly refers to nine types of energy, including raw coal and coke. Other types of energy are not included in the calculation range due to their relatively low usage and unavailability of data;
(3)
External electricity is included in the indirect carbon emissions of the inflow area. China has set carbon emissions factors for electricity in various regions, and Jiangsu Province belongs to the eastern region. Therefore, this value adopts the unified value of the eastern region.
The following expressions can define how it is calculated [29].
C = C a + C b
C a = i = 1 n S Q i × C E C i
C b = j = 1 m E j × E F j
where the direct carbon emissions = Ca, indirect carbon emissions = Cb, types of energy = i, the consumption of the corresponding energy = SQi, the carbon emissions index of the corresponding energy = CECi (shown in Table 1), the types of electricity = j, the value of the external electricity = Ej, and the carbon emissions index of the corresponding electricity = EFj.
The type of external electricity is usually determined based on the carbon emissions factor of electricity transfer. China has updated this data in various regions, and Jiangsu Province belongs to the East China region, with a value of 0.525 tCO2/MWh. Therefore, there is only one type of external electricity in Jiangsu Province, which means m equals 1.

2.4. The Logarithmic Mean Divisia Index (LMDI) Model

The LMDI (Logarithmic Mean Divisia Index) model is a model that can decompose the factors of energy consumption or emissions changes. Its fundamental principle involves constructing a comprehensive decomposition model to assess the contributions of individual factors to the overall growth of energy consumption or emissions, thus offering insights into the drivers of change. The model is characterized by avoiding the problem of residuals during the decomposition process and remains stable in the presence of zero or negative values. The previous literature review mentioned that in addition to the LMDI model, the STIRPAT model is commonly used to conduct impact factor analysis. Compared with the LMDI model, the STIRPAT model requires the use of a large amount of inputoutput data, which is more difficult for provincial carbon emissions research. Conversely, the LMDI method does not require that data and has the advantage of no residual terms after decomposition. In addition, compared with other exponential decomposition models, the LMDI model also has the characteristic of fully decomposing carbon emissions data, making it more suitable for decomposing carbon emissions driving factors [30]. The model has been widely used in a number of research fields, including energy, environment, and economy, and has been recognized by the academic community [31,32,33].
Japanese scholar Yoichi Kaya proposed the Kaya equation to decompose the driving factors of carbon emissions. This equation mainly considers the influence of energy consumption, economic development, and population scale on carbon emissions. Its basic expression can be shown as follows [34,35].
C = C E × E G D P × G D P P × P
C represents the total carbon emissions in Jiangsu Province, E means the quantity of the consumption of energy, GDP represents gross domestic product, and P represents the population of the city. So, C E represents the coefficient of carbon emissions, which means the carbon generated by consuming each unit of energy; E G D P represents the efficiency of energy; and G D P P represents GDP per person.
Based on the Kaya equation, the expression of calculating the total carbon emissions can be written as:
C = C a E × E G D P × G D P P × P + C b
There are significant differences in energy consumption structure, industrial structure, and other factors among different regions. Taking Nanjing and Suqian in Jiangsu Province as examples, in 2020, the proportion of coal consumption to total energy consumption was 25% and 36%, respectively. The proportion of added value of the secondary industry to regional GDP was 30% and 42%, respectively. In terms of permanent population, Nanjing has 4.34 million more people than Suqian. If we only analyze the driving factors based on regional GDP, population, energy consumption, and energy efficiency, it is difficult to accurately reflect the differences in driving factors of carbon emissions among different regions [36,37]. This article mainly considers the impact of energy and economy on carbon emissions, introducing two structural factors, energy structure and industrial structure, which refer to the impact of energy structure adjustment and changes in the secondary industry structure on carbon emissions, respectively. In addition, considering the increasing frequency of electricity flow between regions, the indirect carbon emissions it generates are also gradually receiving attention. This article also introduces the power factor into the LMDI model. Therefore, we add E i E and G D P G D P and construct a carbon emissions driving factor analysis model, as shown in Formula (6).
C = i C a i E i × E i E × E G D P × G D P G D P × G D P P × P + C b
Cai (unit: 104 tons) is the CO2 that comes from the consumption of the i-th energy, Ei (unit: 104 tons of standard coal) means the quantity of the i-th energy, E means the quantity of all energy, and GDP’ (unit: billion CNY) means the GDP of the industry.
Then, we use C a i E i = F C i as the index of the carbon emissions of the i-th energy; E i E = C E i , which means the proportion of the i-th energy in energy consumption, to represent the energy structure factor; E G D P = E E , which denotes the energy consumption per unit of GDP, to represent the energy efficiency factor; G D P G D P = E S , which means the proportion of the industry’s GDP in the total GDP, to represent the industrial structure; and G D P P = E G , which means the GDP per person, to represent the economy structure. The Equation (6) can be converted to:
C = i F C i × C E i × E E × E S × E G × P + C b = i F C i × C E i × E E × E S × E G × P + j E j × E F j
Due to the impact of electricity consumption on carbon emissions, this paper also adds external electricity to calculate the decomposition of indirect carbon emissions. The following formula can be used to determine these impacts through the LMDI method using data from all the variables from the start year(t − 1) to the end year(t).
Δ C = Δ F C + Δ C E + Δ E E + Δ E S + Δ E G + Δ P + Δ E + Δ E F
Δ F C means the coefficient of the carbon emissions, Δ C E means the effect of energy structure, Δ E E means the effect of energy efficiency, Δ E S means the effect of industrial structure, Δ E G means the effect of economic development, Δ P means the effect of population scale, Δ E means the effect of external electricity, and Δ E F means the coefficient of the carbon emissions about using electricity. Here are the calculation formulas for calculating the impact of various factors on carbon emissions.
Δ F C = i W i ln F C i t F C i t 1 ; Δ C E = i W i ln C E i t C E i t 1 ; Δ E E = i W i ln E E i t E E i t 1 ;
Δ E S = i W i ln E S i t E S i t 1 ; Δ E G = i W i ln E G i t E G i t 1 ; Δ P = i W i ln P t P t 1 ;
Δ E = j V j ln E t E t 1 ; Δ E F = j V j ln E F t E F t 1
wherein the formulas of calculating W and V are written as follows:
W i = C a i t C a i t 1 ln ( C a i t / C a i t 1 ) ; V j = C b j t C b j t 1 ln ( C b j t / C b j t 1 )
Due to the coefficient of carbon emissions and electricity carbon emissions [38,39], Δ F C and Δ F C are always 0.

3. Results

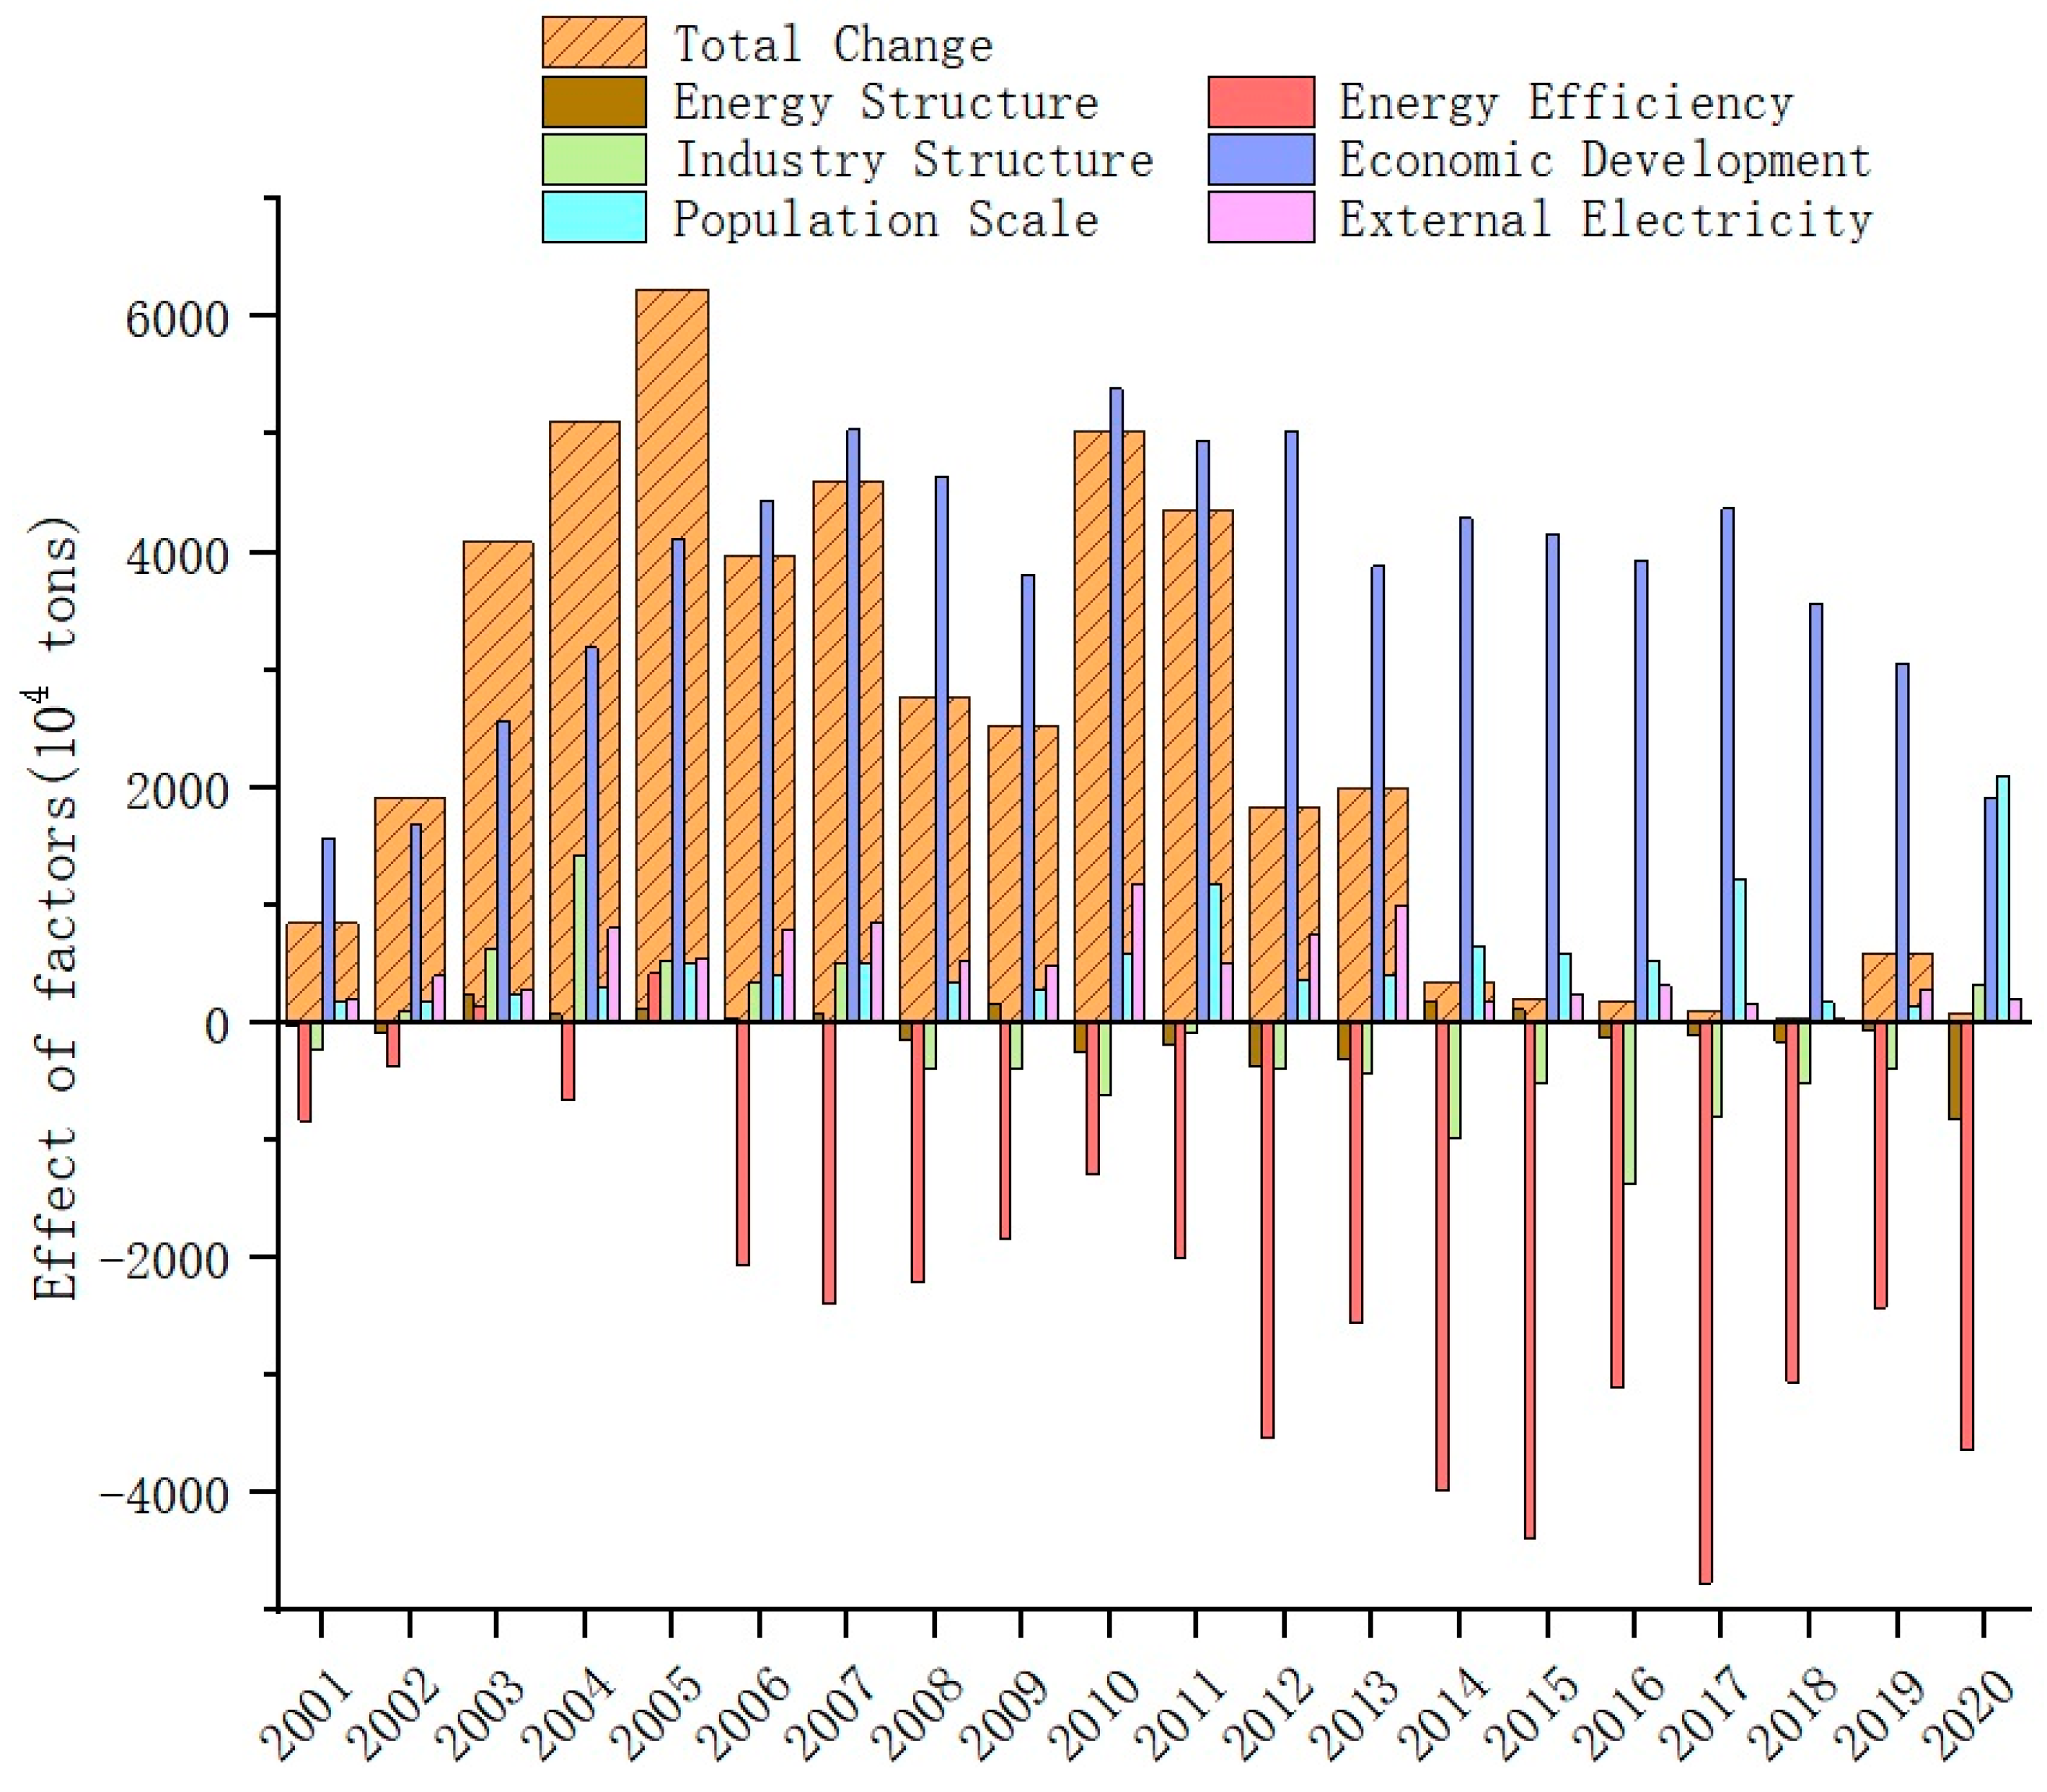
3.1. Results from the Province’s Perspective

Based on the energy consumption data and the decomposition model of influencing factors, the driving effect of carbon emissions can be calculated. The decomposition results of carbon emissions in Jiangsu Province are shown in the following Figure 2.
Firstly, this paper analyzes the carbon-increasing factors: economic development, population scale, and external electricity [40]. (1) Economic development has significantly contributed to the rise in carbon emissions. However, as Jiangsu Province attached great importance to prioritizing transitioning its economic development mode, the promotional effect began to exhibit fluctuation. The bar represented by this factor indicates that its effect has shown a decreasing trend in general, especially after 2010. (2) The effect of the population scale factor steadily increased during the first 10 years. By 2020, driven by population growth, the carbon emissions driving effect reached a second peak, 21 million tons, which is still much smaller than the economic scale. (3) In terms of external electricity, there have been certain fluctuations in the amount of electricity consumption, leading to the dynamic change in the carbon emissions driving effect of electricity consumption. In recent years, the amount of electricity in Jiangsu Province has been increasing, but the carbon emissions have not generated synchronous growth.
Secondly, this paper analyzes the carbon-decreasing factors: energy efficiency, energy structure, and industry structure. (1) Energy efficiency is the main force for suppressing carbon emissions. From 2001 to 2005, the values and positive/negative changes in the effect of energy efficiency changed frequently. Since 2006, this kind of change has been replaced by continuous inhibitory effects. In recent years, the carbon reduction effect of this factor has shown a decreasing trend, so it is necessary for Jiangsu Province to develop new carbon reduction pathways. (2) The other factor decreasing carbon emissions is energy. After 2008, the carbon emissions driving effect fluctuated repeatedly around 0, indicating that the factor began to show a certain inhibitory effect. With the promotion of clean and green energy in the province, the reduction effect was gradually reflected and then reached its maximum value in 2020. The above phenomenon implies that the carbon reduction effect generated by this factor has shown a significant growth trend in recent years. (3) Regarding industrial structure, except for occasional suppression of carbon emissions in 2001, it continued to increase carbon emissions from 2002 to 2007. In the following five years, the inhibitory effect of this factor gradually emerged and displayed an increasing trend of fluctuation. Since then, its inhibitory effects gradually weakened and even reappeared as a promoting effect in 2020. For Jiangsu Province, which has significant differences in industrial structure among cities, such adjustment constitutes a lengthy task and an effective tool for curbing carbon emissions [41].
Overall, the factors that have the greatest impact on carbon emissions in Jiangsu Province are economic development and energy efficiency. However, due to the development of the economy, carbon reduction cannot be promoted through economic regression, and the carbon reduction space of energy efficiency factors is gradually narrowing. Jiangsu Province still needs to start from the energy structure and industrial structure to formulate carbon reduction policies.

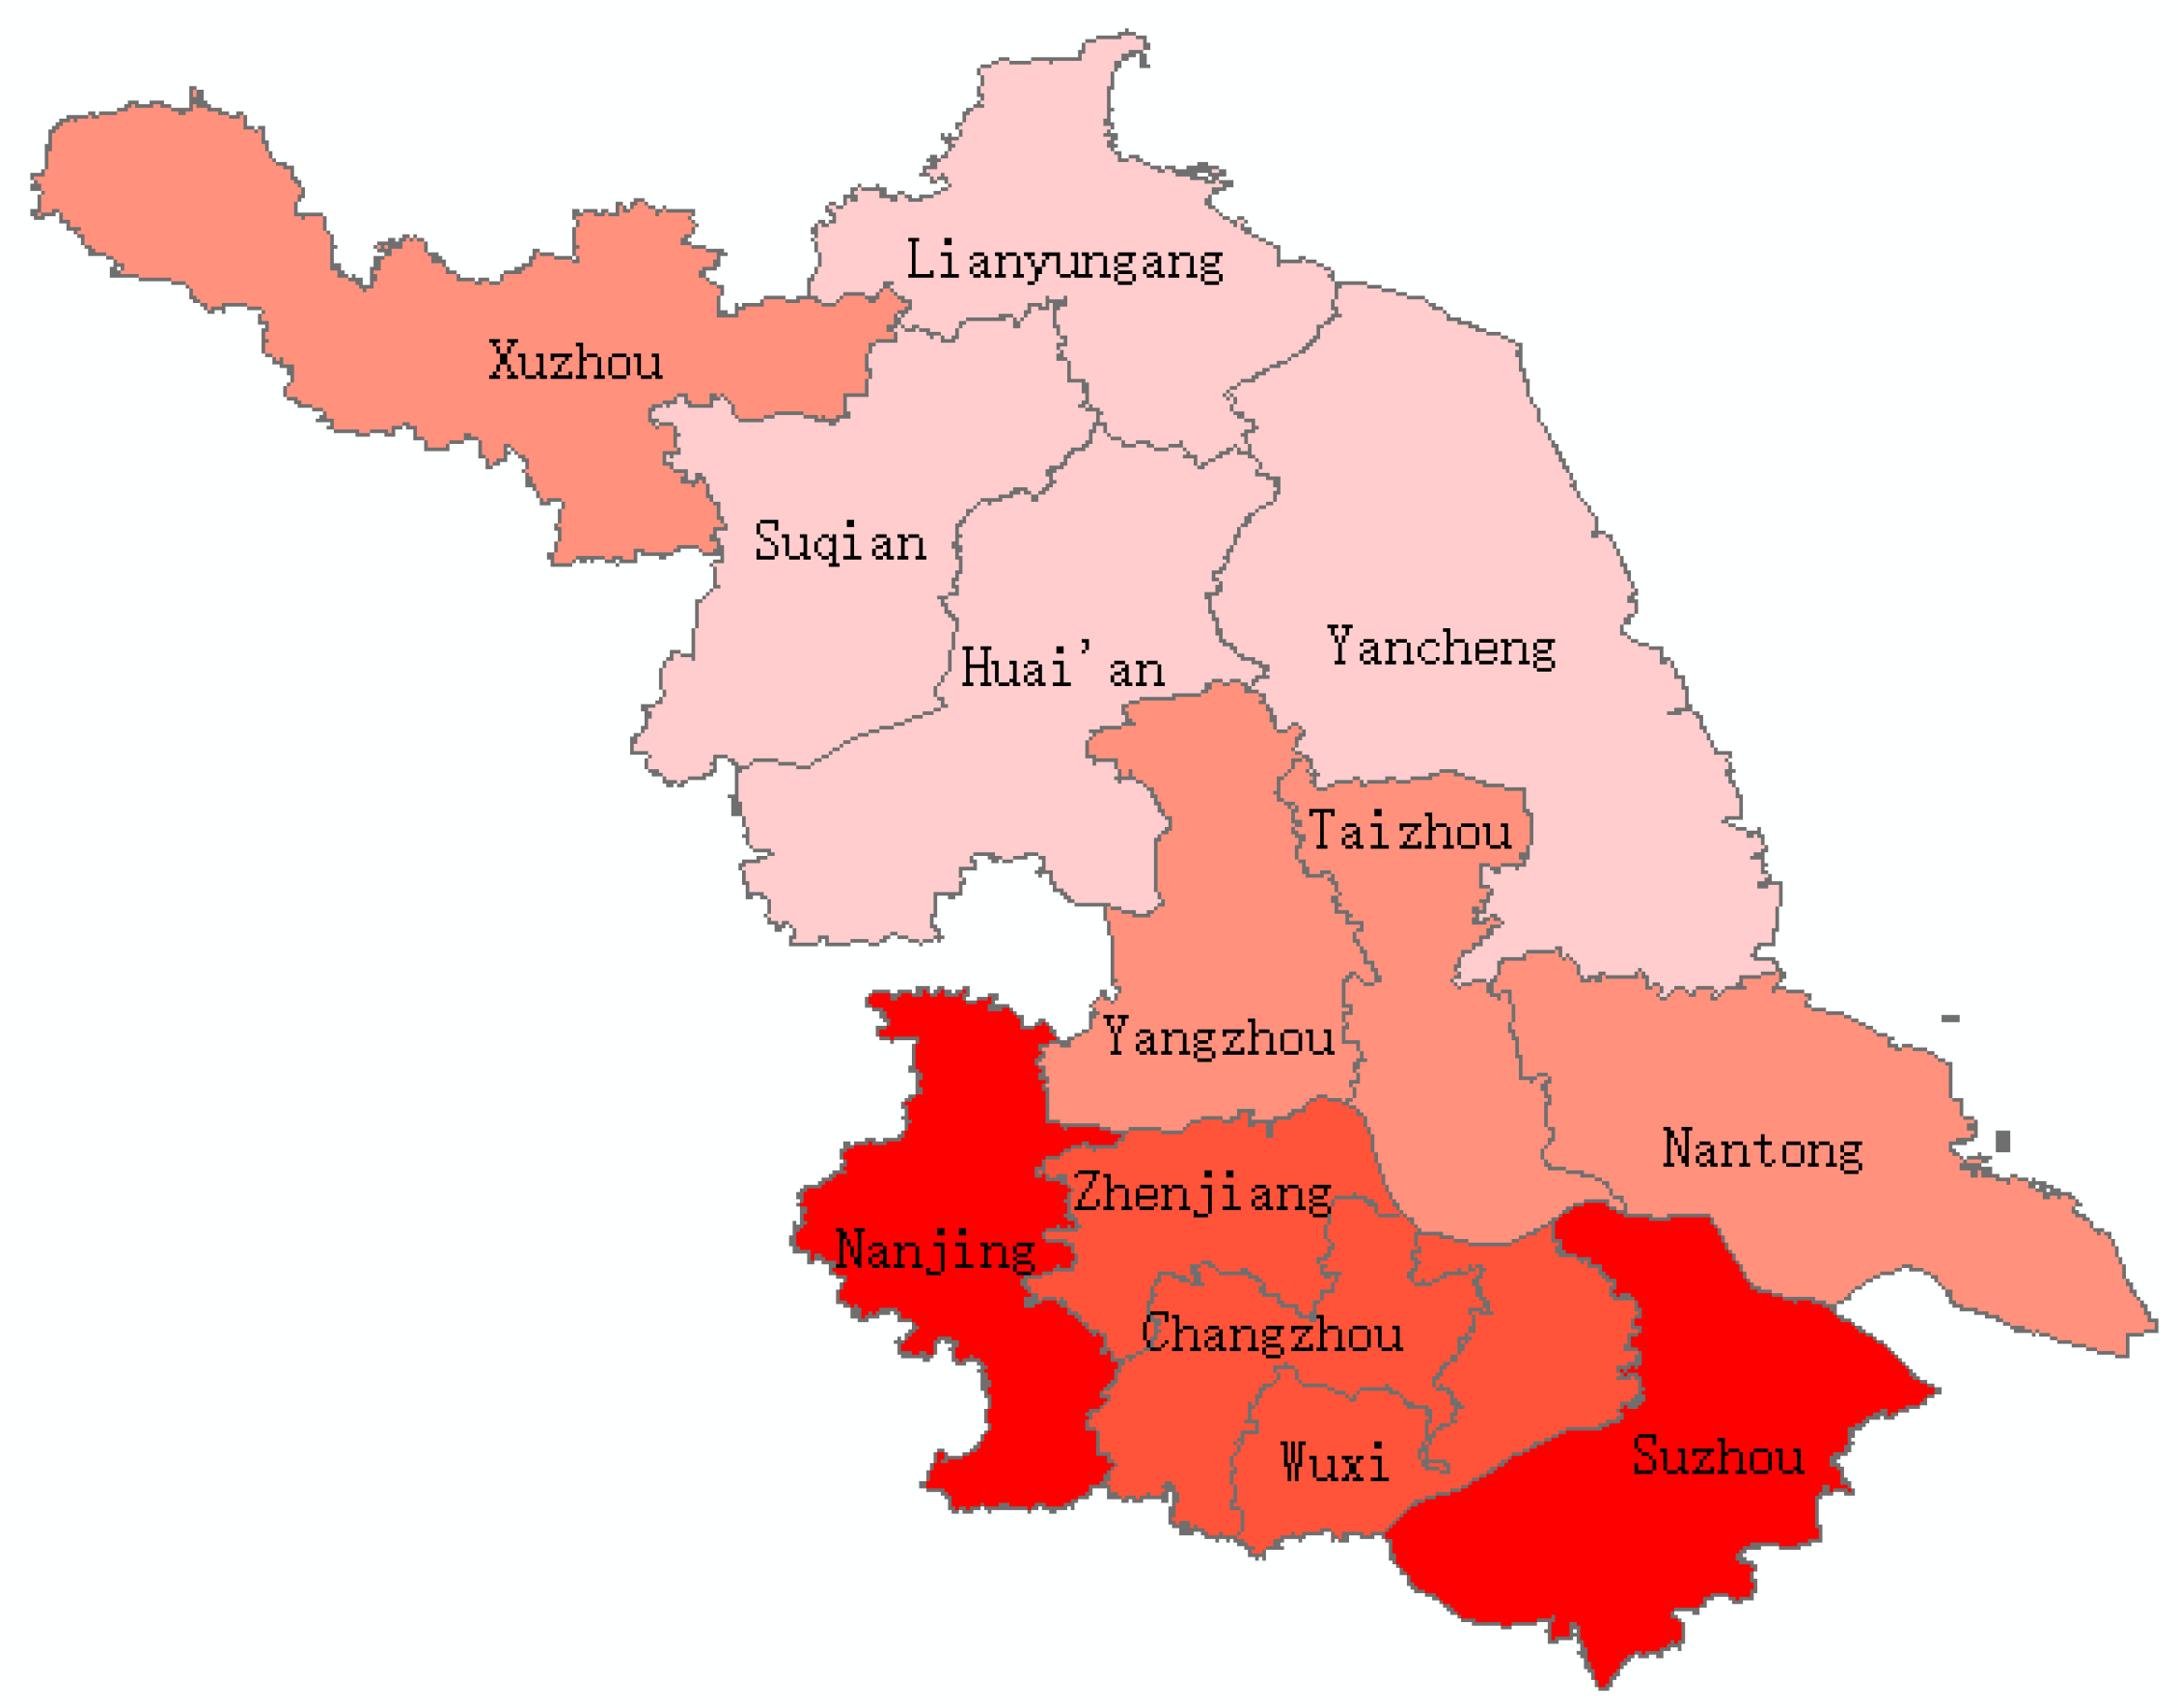
3.2. Results from the Cities’ Perspective

We draw a hierarchical carbon emissions map of Jiangsu Province, which facilitates readers’ understanding of the differences in carbon emissions among cities in Jiangsu Province, as shown in Figure 3.
The darker the color in the image, the more carbon emissions it represents. It can be seen that carbon emissions in Jiangsu Province gradually decrease from south to north, and the clustering trend is relatively significant. There is a significant difference in carbon emissions among cities in Jiangsu Province. Cities with high carbon emissions are concentrated in the southern part of Jiangsu Province, while those with low carbon emissions are concentrated in the northern part.
The formulation and implementation of carbon reduction initiatives in China are customized at the provincial level, highlighting the imperative to account for the distinctive characteristics of individual municipalities. We speculate that these differences will result in varying effects of various factors on carbon emissions. The following part will analyze the carbon emissions decomposition results of different cities in Jiangsu Province, hoping to provide reference for formulating policies that consider uniformity, fairness, and flexibility simultaneously. Uniformity entails that irrespective of the specific carbon reduction measures adopted, the overarching objective remains the reduction in carbon emissions. Fairness involves analyzing the areas for improvement in various cities based on their carbon reduction effectiveness, rather than solely relying on vertical comparisons of contribution rates to assess the scope for carbon reduction. Flexibility entails offering tailored recommendations for cities with distinct characteristics to avoid a one-size-fits-all approach.
To verify this hypothesis, in this paper, we divide the value of the driving effect of each factor by the change in total carbon emissions of the corresponding city to derive the contribution of each factor in different cities. Specific results are shown in Table 2 below.

3.3. Carbon Reduction Strategy

Jiangsu Province has formed three major types of carbon emissions with distinct spatial characteristics, exhibiting multipolar characteristics. Obviously, for cities with different carbon emissions types, fairness and efficiency factors should be taken into account equally, and their carbon emissions potential should be tailored to local conditions and explored separately.
Among the cities in the first category, Nanjing and Suzhou have the most favorable carbon reduction effects. With reference to Jiangsu Province’s plan to reduce the proportion of industry to 25% in the future, these two cities will inevitably have to make industrial adjustments in the future, so the emissions reduction policy is mainly targeted at this factor. Wuxi and Zhenjiang’s energy structure contributes significantly less than their counterparts in Nanjing and Suzhou, so they need to adjust their energy structure in the short term. In the second group of cities, Changzhou and Yangzhou have smaller industrial and energy structures than the other two cities, so they need to adjust their industrial and energy structures. The energy efficiency contribution of Taizhou and Nantong is also much smaller than that of Changzhou and Yangzhou, so these two cities need to further improve their energy utilization efficiency. In the third group of cities, the energy structure factors all contribute to carbon emissions, and the industrial structure of the four cities except Xuzhou also increases carbon emissions. Therefore, most of the cities need to adjust both industrial structure and energy structure factors. Lianyungang, Suqian, and Yancheng also have much lower energy efficiency contribution rates than Xuzhou and Huaian in the group and therefore need to improve energy efficiency. Overall, Xuzhou needs to adjust its industrial structure, Huai’an needs to adjust its industrial and energy structure, and Lianyungang, Suqian, and Yancheng need to adjust their industrial structure, energy structure, and energy efficiency. We analyze the future carbon emissions potential of each city based on its carbon emissions driving factors and the development situation of each city and summarize the results in Table 3 below.
In summary, the cities that need to adjust only the industrial structure are Nanjing and Suzhou; the cities that need to adjust the energy structure are Wuxi, Zhenjiang, and Xuzhou; the cities that need to adjust the energy efficiency are Taizhou and Nantong; the cities that need to adjust both the industrial and the energy structure are Changzhou, Yangzhou, and Huai’an; and the cities that need to adjust all three factors are Lianyungang, Suqian, and Yancheng. In addition, the contribution of transferred electricity to most cities is small, but the impact on Nanjing and Suzhou is large. Since Nanjing and Suzhou are Jiangsu’s two biggest electricity consumers, their robust urban operations, tourism, and manufacturing sectors heavily rely on electricity. This leads to a higher volume of external electricity, significantly affecting carbon emissions. Therefore, these two cities also need to consider the issue of power dispatch and develop their own clean power generation industry to reduce the transfer of electricity while saving electricity.
Since the total carbon emissions of each city have increased, a positive contribution rate indicates that the factor promotes carbon emissions, while a negative value indicates that it reduces carbon emissions. For Jiangsu Province, industrial structure, energy structure, and energy efficiency are all carbon reduction factors, which is also a criterion for judging whether each factor plays a normal role in reducing carbon emissions in each city.
(1) The first type of cities are those with ideal carbon reduction effects, including Nanjing, Suzhou, Wuxi, and Zhenjiang. All three carbon-decreasing factors helped reduce the carbon emissions. Although the increase in carbon emissions brought about by the economic development of these cities accounts for a large proportion of the increase in carbon emissions, the energy structure, energy efficiency, and industrial structure factors have contributed a good carbon reduction effect, to a large extent offsetting the increase in carbon emissions brought about by economic development. The contribution of these factors can be ranked among the top for the province. Due to the strong economic strength, these cities began to exert their role in suppressing carbon emissions as early as 2000. After experiencing a significant improvement in energy efficiency that occurred nearly a decade ago, the space for carbon reduction through improving energy efficiency has been gradually shrinking. However, energy structure and industry structure factors have not fully realized their potential, and their impact on carbon emissions is far less significant than energy efficiency factors. (2) The second category is the cities with a medium carbon reduction effect, mainly including Changzhou, Yangzhou, Taizhou, and Nantong. The energy structure, industrial structure, and energy efficiency factors of these cities all have effects in reducing carbon emissions. But, the contribution rate is not large enough compared with that of the first group of cities, so the carbon reduction effects of these cities belong to the middle of the province. (3) The third category is the cities to be improved in terms of carbon emissions reduction, mainly including Xuzhou, Huai’an, Lianyungang, Suqian, and Yancheng. These cities are characterized by the fact that energy structure or industrial structure factors do not play a corresponding role in reducing carbon emissions; Xuzhou’s energy structure contributes to carbon emissions, while Huai’an, Lianyungang, Suqian, and Yancheng’s energy structure and industrial structure factors all increase carbon emissions. The contribution rate of energy efficiency factors in these cities is also lower than that of other cities.

4. Discussion

In the study of the driving factors of carbon emissions in Jiangsu Province, we used the carbon emissions factor method and LMDI to explore the core driving factors of carbon emissions in depth and formulate targeted carbon reduction policies. Through this study, we have successfully identified the main drivers of carbon emissions in Jiangsu Province and compared and discussed them with the previous literature to further validate the reliability and accuracy of our findings. This article finds that the core driving factors of carbon emissions in Jiangsu Province are economic development and energy efficiency. Although economic development drives the increase in carbon emissions to a certain extent, the decomposition results for carbon emissions obtained through the LMDI method in this study show that the facilitating role of economic development is gradually weakening. This finding is consistent with the findings of Kong et al. [42]. In addition to this, the phenomenon suggests that economic development in Jiangsu Province may be shifting towards a trend of carbon decoupling, which means the relationship between economic development and carbon emissions is constantly weakening, and achieving economic development is no longer at the cost of increasing carbon emissions. This conclusion needs to be verified and can be used as a future research direction. The conclusion that energy structure, energy efficiency, and industrial structure have a suppressive effect on carbon emissions has also been verified in the research of Wu [43] and Zhang [44], who studied China and different provinces, respectively, and reached conclusions consistent with this article. By improving energy efficiency, it is possible to reduce carbon intensity and achieve green and sustainable development while maintaining economic development.
The external electricity is a new factor that is different from other studies in this paper. In terms of contribution, as considered earlier, the transfer of electricity has a greater impact than the population size factor, so it is necessary to include it in the study of the decomposition of the drivers of carbon emissions. The external power in Jiangsu Province is very large and fluctuates greatly, and this factor also increases the carbon emissions of Jiangsu Province to a certain extent. At present, many scholars have not included the incoming electricity in the analysis scope of the LMDI model. But, there was some discussion about transferring power and generating power on their own. The research of Macdonald et al. has confirmed that wind and solar power generation systems have the effect of reducing carbon emissions, and in order to play their role more efficiently, the country needs to achieve the regional dispatch of electricity [45]. However, Jin et al. have discussed the electricity consumption structure, believing that an increase in electricity use will inevitably lead to an increase in carbon emissions [46]. Therefore, in the future, how to adjust the proportion of external power and self-generated power can be the subject of research.
Another core contribution of this study is to discover that the factors influencing carbon emissions among cities in Jiangsu Province have significant differences. Before using the model for calculation, we hypothesized that variations in energy and industrial structures among cities in Jiangsu Province would result in differing impacts of each factor on carbon emissions. The conclusive findings indicate observable disparities in the decomposition of carbon emissions across cities, thereby validating our initial conjecture. The presence of these variations underscores the inadequacy of implementing a uniform carbon emissions reduction policy province-wide. Instead, it necessitates the government to devise a policy framework that integrates elements of uniformity, fairness, and divergence. This finding provides strong support for the government to formulate carbon reduction strategies. Current studies on the driving factors are mostly based on the national and regional perspectives to formulate carbon reduction policies, and this paper argues that the roles of various factors affecting carbon emissions will be different among cities due to the differences in energy structure, energy consumption, and industrial structure among different cities. This finding echoes that of Zhang et al.’s research on regional differences in carbon emissions, emphasizing the need to tailor carbon emissions reduction policies to the local context and to take into full consideration the actual situation and emissions reduction potential of each [47]. While it cannot be guaranteed that all provinces have the same differences in the contribution rates of different drivers between cities as Jiangsu Province, these findings can provide lessons for other provinces. Therefore, when proposing suggestions, we focused on considering the development characteristics of different cities, and combined with the decomposition results obtained from the LMDI model, we proposed different suggestions for different types of cities. This will enable the government and various industrial sectors to pursue more targeted policy formulation and adjust their development direction

5. Conclusions and Policy Suggestions

5.1. Conclusions

Based on the calculation of carbon emissions in Jiangsu Province, this paper uses the LMDI model to decompose the carbon emissions of the province and each city in order to identify the core driving factors. On this basis, starting from the decomposition results of each city, we identify the characteristics of its driving factors and put forward targeted carbon emissions reduction suggestions. The results show the following conclusions.
(1)
The driving factors of carbon emissions in Jiangsu Province can be divided into two categories: carbon increase and carbon reduction. Among the factors contributing to carbon increase, economic development is the core factor leading to the growth of carbon emissions in Jiangsu Province. However, its influence is gradually weakening, meaning that the economic development mode of the area is moving towards the direction of high-quality development. The impact of external electricity on carbon emissions fluctuates greatly, but overall it still promotes carbon emissions. The population scale has the smallest promoting effect on carbon emissions, and the magnitude of change is also the smallest. The contribution of industrial structure and energy structure to reducing carbon emissions is smaller than that of energy efficiency factors. Although it is not very stable, its carbon reduction effect has become increasingly evident in recent years.
(2)
The driving factors of carbon emissions in various cities in Jiangsu Province have different roles and similarities. On the basis of a comprehensive consideration of uniformity, fairness, and flexibility, each category has its corresponding carbon reduction strategy. Nanjing and Suzhou need to adjust their industrial structure; Wuxi, Zhenjiang, and Xuzhou need to adjust their energy structure; Taizhou and Nantong need to adjust their energy efficiency; Changzhou, Yangzhou, and Huai’an need to adjust their energy and industrial structure at the same time; and the remaining cities, such as Lianyungang, need to adjust the three factors.
This paper has some limitations, mainly including the following: (1)When calculating carbon emissions data, the emissions factor method is widely regarded as a carbon emissions calculation method, but its calculation results still have some gaps with the actual carbon emissions. (2) There is a certain subjectivity in selecting which ones to analyze. This article mainly focuses on industry, so the selected factors are mostly related to industry. (3) The LMDI model cannot consider the interaction between factors. Once these properties change, their urban classification will change, too. (4) The model can only derive the amount of the contribution of each factor, not the pathway of each factor in carbon emissions or their interactions with each other. Future research can be conducted in the following directions: (1) Selecting specific factors and investigating their specific relationship with carbon reduction. Economic development, as the main factor promoting carbon emissions, has been valued and studied by many experts and scholars. However, there is still limited research on the deeper impact of energy efficiency and energy structure, which are two major factors inhibiting carbon emissions. In the future, detailed research can be conducted on the mechanisms by which these two factors inhibit carbon emissions, as well as how they can play a greater role in reducing carbon emissions. (2) Applying machine learning and deep learning, which are widely used in various fields, can be performed to analyze the impact of different factors on carbon emissions and to predict carbon emissions. For example, neural networks can accurately predict future values through continuous learning processes. Can multiple influencing factors and carbon emissions data be utilized? This method can become a future research direction for carbon emissions prediction. (3) This article did not consider policy factors such as the impact of energy and economic policies on carbon emissions and did not include them in the LMDI model, which is also a direction for improvement.

5.2. Policy Suggestions

Finally, the following carbon emissions reduction countermeasures and suggestions are proposed:
Economic development plays the most important role in promoting carbon emissions. Jiangsu Province is located in the Yangtze River Economic Belt, and the cities along the river, such as Nantong, Yancheng, and Lianyungang, can synchronize their ecological protection tasks while increasing the coverage of monastic forests to enhance the carbon sink capacity of the ecosystem. In addition, the government should encourage and support the growth of low-carbon and environmentally friendly industries and guide the green transformation of enterprises through financial subsidies and the development of green finance.
Due to the differences in carbon emissions and driving factors in different cities, the government should enhance the top-level design, establish a regional coordination mechanism. (1) For Nanjing and Suzhou, which only need to adjust their industrial structure, they have the advantages of large-scale manufacturing and talents in universities, so they can realize the transformation of their industrial structure through the development of high-tech industries. In addition to this, the two cities need to adjust their electricity consumption structure to reduce the transfer of inward electricity. (2) Wuxi, Zhenjiang, and Xuzhou, which need to adjust their energy structure should propose countermeasures separately. Wuxi and Zhenjiang are important new energy industry bases in Jiangsu Province and therefore need to continue to adhere to the zero-carbon strategy in the future and continue to reform the energy structure. Xuzhou, where the coal industry is the pillar industry, should continue to regulate the development of the coal industry, reduce environmental pollution in the process of coal mining, and at the same time, it should also increase the financial investment to support the development of new energy sources in order to prepare for the transformation of the energy structure. (3) Taizhou and Nantong need to focus on improving energy efficiency by developing more efficient energy conversion technologies, promoting the use of energy-efficient equipment and products and developing renewable energy technologies. (4) Changzhou, Yangzhou, and Huai’an all need to change their energy and industrial structures. Changzhou and Yangzhou are industrial cities with a long history in Jiangsu Province and need to develop more low-energy-consuming industries, such as the photovoltaic industry and chip industry. Huai’an has the advantage of new energy sources, so it can develop wind power and hydroelectric power and change energy and industrial structure by introducing new energy sources. (5) The remaining cities are less effective in reducing carbon emissions. Their energy structure, industrial structure, and energy efficiency need to be adjusted. Lianyungang is a key city in China for the development of nuclear energy, hydrogen energy, and photovoltaic energy, so it is necessary to seize this development opportunity to realize green and low-carbon development. Suqian, on the other hand, can capitalize on its strengths in solid waste management to build a “waste-free city”, changing its energy and industrial structure through the synergistic effect of reducing pollution and carbon emissions while improving energy efficiency. Yancheng can rely on its advantages in hydraulic resources to promote energy conservation while promoting the deep integration of new energy industries and high technology and continue to promote low-carbon development.

Author Contributions

Conceptualization, J.D. and C.M.; Methodology, J.D. and C.L.; Data Curation, C.L.; Writing—original draft preparation, J.D. and C.L.; Writing—review and editing, C.M.; Supervision, J.D. All authors have read and agreed to the published version of the manuscript.

Funding

This research was funded by the National Social Science Foundation of China (NO. 20AGL036) and the Fundamental Research Funds for the Central Universities (NO. B220207021).

Institutional Review Board Statement

Not applicable.

Informed Consent Statement

Not applicable.

Data Availability Statement

All the data are publicly available, and proper sources have been cited in the text.

Acknowledgments

The authors are grateful to Jiangsu Provincial Bureau of Statistics for the data, as well as to all the editors and reviewers for their hard work.

Conflicts of Interest

The authors declare no conflict of interest.

References

  1. Jiang, L.; Hu, X.K.; Zhang, G.F.; Chen, Y.Q.; Zhong, H.L.; Shi, P.J. Carbon Emission Risk and Governance. Int. J. Disaster Risk Sci. 2022, 13, 249–260. [Google Scholar] [CrossRef]
  2. Chang, M.C. Carbon tax effect difference on net-zero carbon emissions target and social welfare level promotion. Carbon Manag. 2022, 13, 581–593. [Google Scholar] [CrossRef]
  3. Liu, L.Y.; Xun, L.L.; Wang, Z.Y.; Liu, H.W.; Huang, Y.; Bedra, K.B. Peak Carbon Dioxide Emissions Strategy Based on the Gray Model between Carbon Emissions and Urban Spatial Expansion for a Built-Up Area. Appl. Sci. 2023, 13, 187. [Google Scholar] [CrossRef]
  4. Yang, Z.K.; Zhang, M.M.; Liu, L.Y.; Zhou, D.Q. Can renewable energy investment reduce carbon dioxide emissions? Evidence from scale and structure. Energy Econ. 2022, 112, 106181. [Google Scholar] [CrossRef]
  5. Yang, W.; Zhang, M.; Long, H.S.; Yan, J. Thoughts on Teaching Reform of Resources Majors in Colleges and Universities under the Background of Carbon Peak and Carbon Neutralization-Taking Mineral Resources Exploration Course as an Example. Sustainability 2022, 14, 6523. [Google Scholar] [CrossRef]
  6. Qiu, X.Z. An empirical analysis of the influence of financial development on export trade: Evidence from Jiangsu province, China. Ekon. Istraz. 2022, 35, 1526–1541. [Google Scholar] [CrossRef]
  7. Luo, H.Y.; Lin, X.Y. Dynamic Analysis of Industrial Carbon Footprint and Carbon-Carrying Capacity of Zhejiang Province in China. Sustainability 2022, 14, 6824. [Google Scholar] [CrossRef]
  8. Ray, R.L.; Singh, V.P.; Singh, S.K.; Acharya, B.S.; He, Y.P. What is the impact of COVID-19 pandemic on global carbon emissions? Sci. Total Environ. 2022, 816, 151503. [Google Scholar] [CrossRef] [PubMed]
  9. Jiang, Y.; Zhou, Z.B.; Liu, C.J. Does economic policy uncertainty matter for carbon emission? Evidence from US sector level data. Environ. Sci. Pollut. Res. 2019, 26, 24380–24394. [Google Scholar] [CrossRef]
  10. Shao, M.T.; Dong, X.W.; Huang, H.T. Measurement of carbon emissions and responsibility sharing for the industrial sector in Zhejiang, China. Heliyon 2024, 10, e26505. [Google Scholar] [CrossRef]
  11. O’Dwyer, J.; Walshe, D.; Byrne, K.A. Wood waste decomposition in landfills: An assessment of current knowledge and implications for emissions reporting. Waste Manag. 2018, 73, 181–188. [Google Scholar] [CrossRef] [PubMed]
  12. Wang, X.; Li, L.; Zhao, F.S. Decomposition Analysis of CO2 Emissions in Northeast China: Insights From Investment Factors. Front. Energy Res. 2021, 9, 777290. [Google Scholar] [CrossRef]
  13. Lach, L. Optimization based structural decomposition analysis as a tool for supporting environmental policymaking. Energy Econ. 2022, 115, 106332. [Google Scholar] [CrossRef]
  14. Lian, L.; Lin, J.Y.; Yao, R.H.; Tian, W. The CO2 emission changes in China’s transportation sector during 1992–2015: A structural decomposition analysis. Environ. Sci. Pollut. Res. 2020, 27, 9085–9098. [Google Scholar] [CrossRef] [PubMed]
  15. Zhang, Y.G. Supply-side structural effect on carbon emissions in China. Energy Econ. 2010, 32, 186–193. [Google Scholar] [CrossRef]
  16. Ang, B.W.; Huang, H.C.; Mu, A.R. Properties and linkages of some index decomposition analysis methods. Energy Policy 2009, 37, 4624–4632. [Google Scholar] [CrossRef]
  17. Karakaya, E.; Bostan, A.; Ozcag, M. Decomposition and decoupling analysis of energy-related carbon emissions in Turkey. Environ. Sci. Pollut. Res. 2019, 26, 32080–32091. [Google Scholar] [CrossRef] [PubMed]
  18. Faridzad, A.; Ghadim, M.G. CO2 intensity decomposition analysis in the Netherlands’ manufacturing industry: An application of monetary and physical indicators. Environ. Dev. Sustain. 2023, 25, 8799–8817. [Google Scholar] [CrossRef]
  19. Ang, B.W. Decomposition analysis for policymaking in energy: Which is the preferred method? Energy Policy 2004, 32, 1131–1139. [Google Scholar] [CrossRef]
  20. Liu, L.C.; Fan, Y.; Wu, G.; Wei, Y.M. Using LMDI method to analyzed the change of China’s industrial CO2 emissions from final fuel use: An empirical analysis. Energy Policy 2007, 35, 5892–5900. [Google Scholar] [CrossRef]
  21. De Oliveira-De Jesus, P.M. Effect of generation capacity factors on carbon emission intensity of electricity of Latin America & the Caribbean, a temporal IDA-LMDI analysis. Renew. Sustain. Energ. Rev. 2019, 101, 516–526. [Google Scholar] [CrossRef]
  22. Chen, J.D.; Gao, M.; Li, D.; Song, M.L.; Xie, Q.J.; Zhou, J.X. Extended Yearly LMDI Approaches: A Case Study of Energy Consumption. Math. Probl. Eng. 2020, 2020, 9207896. [Google Scholar] [CrossRef]
  23. Meng, Z.S.; Wang, H.; Wang, B.N. Empirical Analysis of Carbon Emission Accounting and Influencing Factors of Energy Consumption in China. Int. J. Environ. Res. Public Health 2018, 15, 2467. [Google Scholar] [CrossRef] [PubMed]
  24. Xiang, X.W.; Ma, X.; Ma, Z.L.; Ma, M.D.; Cai, W.G. Python-LMDI: A Tool for Index Decomposition Analysis of Building Carbon Emissions. Buildings 2022, 12, 83. [Google Scholar] [CrossRef]
  25. Quan, C.G.; Cheng, X.J.; Yu, S.S.; Ye, X. Analysis on the in fluencing factors of carbon emission in China’s logistics industry based on LMDI method. Sci. Total Environ. 2020, 734, 138473. [Google Scholar] [CrossRef] [PubMed]
  26. Peng, D.; Liu, H.B. Measurement and Driving Factors of Carbon Emissions from Coal Consumption in China Based on the Kaya-LMDI Model. Energies 2023, 16, 439. [Google Scholar] [CrossRef]
  27. Wang, M.; Zhu, C.Z.; Cheng, Y.; Du, W.B.; Dong, S. The influencing factors of carbon emissions in the railway transportation industry based on extended LMDI decomposition method: Evidence from the BRIC countries. Environ. Sci. Pollut. Res. 2023, 30, 15490–15504. [Google Scholar] [CrossRef]
  28. Chen, S.Q.; Long, H.H.; Chen, B.; Feng, K.S.; Hubacek, K. Urban carbon footprints across scale: Important considerations for choosing system boundaries. Appl. Energy 2020, 259, 114201. [Google Scholar] [CrossRef]
  29. Fan, T.J.; Luo, R.L.; Xia, H.Y.; Li, X.P. Using LMDI method to analyze the influencing factors of carbon emissions in China’s petrochemical industries. Nat. Hazards 2015, 75, S319–S332. [Google Scholar] [CrossRef]
  30. Wang, L. Assessment of land use change and carbon emission: A Log Mean Divisa (LMDI) approach. Heliyon 2024, 10, e25669. [Google Scholar] [CrossRef]
  31. He, Y.; Xing, Y.T.; Zeng, X.C.; Ji, Y.J.; Hou, H.M.; Zhang, Y.; Zhu, Z. Factors influencing carbon emissions from China’s electricity industry: Analysis using the combination of LMDI and K-means clustering. Environ. Impact Assess. Rev. 2022, 93, 106724. [Google Scholar] [CrossRef]
  32. Lin, Z.R.; Wang, H.; Li, W.; Chen, M. Impact of Green Finance on Carbon Emissions Based on a Two-Stage LMDI Decomposition Method. Sustainability 2023, 15, 12808. [Google Scholar] [CrossRef]
  33. Ang, B.W. LMDI decomposition approach: A guide for implementation. Energy Policy 2015, 86, 233–238. [Google Scholar] [CrossRef]
  34. Eeckhout, L. Kaya for Computer Architects: Toward Sustainable Computer Systems. IEEE Micro 2023, 43, 9–18. [Google Scholar] [CrossRef]
  35. Liu, H.X.; Zhang, J.; Yuan, J.H. Can China achieve its climate pledge: A multi-scenario simulation of China’s energy-related CO2 emission pathways based on Kaya identity. Environ. Sci. Pollut. Res. 2022, 29, 74480–74499. [Google Scholar] [CrossRef] [PubMed]
  36. Hua, F.; Alharthi, M.; Yin, W.H.; Saeed, M.; Ahmad, I.; Ali, S.A. Carbon Emissions and Socioeconomic Drivers of Climate Change: Empirical Evidence from the Logarithmic Mean Divisia Index (LMDI) Base Model for China. Sustainability 2022, 14, 2214. [Google Scholar] [CrossRef]
  37. Liu, K.; Xie, X.Y.; Zhao, M.X.; Zhou, Q. Carbon Emissions in the Yellow River Basin: Analysis of Spatiotemporal Evolution Characteristics and Influencing Factors Based on a Logarithmic Mean Divisia Index (LMDI) Decomposition Method. Sustainability 2022, 14, 9524. [Google Scholar] [CrossRef]
  38. Golas, Z. Changes in Energy-Related Carbon Dioxide Emissions of the Agricultural Sector in Poland from 2000 to 2019. Energies 2022, 15, 4264. [Google Scholar] [CrossRef]
  39. Wang, P.; Wu, P.; Song, Y.Z.; Hampson, K.; Zhong, Y. A novel spatio-temporally stratified heterogeneity model for identifying factors influencing carbon emissions. Energy Build. 2023, 280, 112714. [Google Scholar] [CrossRef]
  40. Falahatkar, S.; Mousavi, S.M.; Farajzadeh, M. Spatial and temporal distribution of carbon dioxide gas using GOSAT data over IRAN. Environ. Monit. Assess. 2017, 189, 627, Erratum in Environ. Monit. Assess. 2018, 190, 98. [Google Scholar] [CrossRef]
  41. Yang, J.B.; Ding, H. A Quantitative Assessment of Sustainable Development Based on Relative Resource Carrying Capacity in Jiangsu Province of China. Int. J. Environ. Res. Public Health 2018, 15, 2786. [Google Scholar] [CrossRef] [PubMed]
  42. Kong, H.J.; Shi, L.F.; Da, D.; Li, Z.J.; Tang, D.C.; Xing, W. Simulation of China’s Carbon Emission based on Influencing Factors. Energies 2022, 15, 3272. [Google Scholar] [CrossRef]
  43. Wu, X.Y.; Xu, C.X.; Ma, T.L.; Xu, J.R.; Zhang, C.J. Carbon emission of China’s power industry: Driving factors and emission reduction path. Environ. Sci. Pollut. Res. 2022, 29, 78345–78360. [Google Scholar] [CrossRef] [PubMed]
  44. Zhang, H.N.; Zhang, X.P.; Yuan, J.H. Driving forces of carbon emissions in China: A provincial analysis. Environ. Sci. Pollut. Res. 2021, 28, 21455–21470. [Google Scholar] [CrossRef] [PubMed]
  45. MacDonald, A.E.; Clack, C.T.M.; Alexander, A.; Dunbar, A.; Wilczak, J.; Xie, Y.F. Future cost-competitive electricity systems and their impact on US CO2 emissions. Nat. Clim. Chang. 2016, 6, 526–531. [Google Scholar] [CrossRef]
  46. Jin, J.L.; Zhou, P.; Li, C.Y.; Guo, X.J.; Zhang, M.M. Low-carbon power dispatch with wind power based on carbon trading mechanism. Energy 2019, 170, 250–260. [Google Scholar] [CrossRef]
  47. Zhang, Y.; Yu, Z.; Zhang, J. Analysis of carbon emission performance and regional differences in China’s eight economic regions: Based on the super-efficiency SBM model and the Theil index. PLoS ONE 2021, 16, e0250994. [Google Scholar] [CrossRef]
Figure 1. Location of Jiangsu Province.
Sustainability 16 05276 g001
Figure 2. Effects of carbon emissions driving factors in Jiangsu Province from 2001 to 2020.
Sustainability 16 05276 g002
Figure 3. Carbon emissions in different cities.
Sustainability 16 05276 g003
Table 1. Carbon emissions coefficient of different types of energy. (Unit: 104 tons carbon/104 tons standard coal).
Energy
Type
Raw
Coal
CokeCrude
Oil
GasolineKeroseneDieselLiquefied Petroleum GasFuel
Oil
Carbon emissions
index
1.90032.86043.022.92513.01793.09593.10133.1705
The tons in this table and subsequent text are all metric tons.
Table 2. Contribution of carbon emissions drivers in different cities.
CityIndustrial StructureEnergy
Structure
Energy EfficiencyEconomic DevelopmentPopulation ScaleExternal
Electricity
Nanjing−59.28%−34.82%−617.45%657.07%9.73%134.74%
Suzhou−62.83%−42.25%−837.03%916.14%1.14%124.82%
Wuxi−45.95%−9.99%−102.30%214.60%0.60%43.05%
Zhenjiang−52.22%−9.25%−226.72%318.36%−8.70%78.54%
Changzhou−3.86%−1.77%−244.63%316.85%28.88%4.53%
Yangzhou−4.33%−2.20%−257.51%322.67%19.14%22.23%
Taizhou−30.51%−8.48%−96.44%161.01%27.03%47.40%
Nantong−18.05%−3.93%−137.45%233.68%7.10%18.64%
Xuzhou−11.53%4.52%−101.07%180.02%7.00%21.06%
Huai’an36.72%11.47%−293.61%339.78%−16.50%10.85%
Lianyungang4.73%4.93%−66.58%138.36%−0.05%18.62%
Suqian17.15%3.17%−69.87%124.14%−4.21%29.62%
Yancheng6.26%5.63%−55.02%115.26%−4.99%32.86%
Table 3. Emissions reduction strategies for different types of cities.
TypeCityCharacteristicCarbon Emissions Reduction Policies
INanjing
Suzhou
Ideal carbon reduction effectsFocus on industry structure, develop high-tech industries
Wuxi
Zhenjiang
Focus on energy structure, use clean energy
IIChangzhou
Yangzhou
Good carbon reduction effects;
have a lot of room for emissions reduction
Focus on industry and energy structure
Taizhou
Nantong
Focus on energy efficiency
IIIXuzhouLeast emissions reduction effectsOptimize energy consumption structure, develop wind power
Huai’anOptimize energy and industry structure, develop hydroelectric power
Lianyungang
Suqian
Yancheng
Focus on industry structure, energy structure, and energy efficiency
Disclaimer/Publisher’s Note: The statements, opinions and data contained in all publications are solely those of the individual author(s) and contributor(s) and not of MDPI and/or the editor(s). MDPI and/or the editor(s) disclaim responsibility for any injury to people or property resulting from any ideas, methods, instructions or products referred to in the content.

