Article

Carbon Emission Heterogeneity in Developed Countries: Insights for China’s Neutrality Strategy

1
LNU & CAITEC China Business Development Institute (Beijing), Beijing 100710, China
2
Faculty of Social Science & Public Policy, King’s College London, London WC2R 2LS, UK
3
Institute of Mineral Resources, Chinese Academy of Geological Sciences, Beijing 100037, China
4
Research Center for Strategy of Global Mineral Resources, Chinese Academy of Geological Sciences, Beijing 100037, China
*
Author to whom correspondence should be addressed.
Sustainability 2024, 16(13), 5318; https://doi.org/10.3390/su16135318
Submission received: 2 May 2024 / Revised: 6 June 2024 / Accepted: 19 June 2024 / Published: 22 June 2024

Abstract

:
This study investigates the heterogeneity and driving factors of carbon emission reduction in developed countries, providing insights for formulating carbon neutrality strategies and plans in China. Firstly, typical developed countries worldwide are categorized into four modes: high energy consumption–high emissions, high energy consumption–low emissions, low energy consumption–low emissions and low energy consumption–high emissions, based on the “per capita energy consumption–emission intensity” classification method. Secondly, the LMDI decomposition model is employed to calculate the carbon emission-reduction driving effects of each mode, thereby analyzing the evolution path of carbon emissions. Finally, carbon emission-reduction policy recommendations are proposed based on the current situation of provincial carbon emissions in China. The research findings are as follows: (1) Carbon emissions in developed countries follow the Environmental Kuznets Curve (EKC) law, exhibiting an inverted U-shaped trajectory. In the per capita GDP range of USD 12,000–20,000, carbon emissions in most countries have reached or are close to their peak, with per capita carbon emissions in different modes decreasing and tending towards a level of 4000 kg/person. (2) There is heterogeneity in the EKC of carbon emissions in developed countries, which can be divided into technological, structural, comprehensive and clean types based on differences in emission-reduction factors. The trajectories of carbon emissions in most developed countries follow a clean path, while those in newly developed countries are constrained by environmental pressures and are expected to be between mixed and structural types before the emission peak, and tend towards a clean type after the peak. (3) Energy clean-up is the most direct and efficient method for carbon emission reduction, which can significantly and efficiently achieve carbon emission reduction. Industrial restructuring and technological progress play a significant role in suppressing carbon emissions. Policy recommendations are proposed as follows: first, reduce the proportion of fossil energy and increase energy cleanliness; second, promote industrial restructuring to reduce energy dependence; third, enhance production technology and improve energy-utilization efficiency; fourth, increase technological breakthroughs to support low-carbon transformation; fifth, correctly recognize the differences among provinces in China and formulate differentiated carbon emission-reduction policies.

1. Introduction

In November 2021, the Communist Party of China Central Committee and the State Council released the landmark document “Opinions on Fully Implementing the New Development Philosophy and Doing a Good Job in Carbon Peaking and Carbon Neutrality”, which explicitly stated the need to “balance development and emissions reduction, and implement classification-based policies according to local conditions”. Essentially, given the vast geographical scope of China and the disparities in economic and social development among regions, precise and tailored policies are required. Presently, under the unified leadership and deployment of the Party Central Committee, China is advancing its top-level design for carbon neutrality, formulating carbon neutrality roadmaps for each province and key sectors and accelerating the establishment of a “1 + N” policy system. Research has found that carbon emissions follow the Environmental Kuznets Curve (EKC) model, manifesting in an inverted U-shaped relationship between per capita carbon emissions and economic development [1]. Moreover, the trajectories of carbon emissions in developed countries have generally experienced a peak and are now in a declining phase [2], making their experiences in carbon emission reduction highly valuable. Against this backdrop, in-depth research into the driving factors of carbon emission reduction in developed countries and the summarization of different carbon-reduction patterns under various development modes are of significant reference value for China’s efforts to construct a scientifically rational industrial structure and spatial layout, as well as to formulate differentiated provincial-level carbon-reduction plans.
Since the 1990s, scholars have generally agreed on the existence of an Environmental Kuznets Curve (EKC), suggesting an initial deterioration followed by improvement in environmental quality alongside economic development [3]. However, further research has revealed heterogeneity in the relationship between carbon emissions and economic development beyond the inverted U-shape, including inverted N-shaped, N-shaped or ~-shaped forms, indicating variations in the EKC [4]. The impact pathways of economic development on carbon emissions are complex and can be attributed to internal factors [5], external shocks [6] and the displacement hypothesis [7]. The influence of internal factors on EKC morphology has been widely acknowledged among scholars. For instance, Pata, U. K. (2021) [8] compared carbon emissions between India and China and found significant effects of economic level, technological differences and urbanization rate on carbon emissions. Wu Yuming (2012) [9] used a spatial econometric model to empirically analyze data from 31 provinces in China, revealing that economic level, population size, urbanization rate and technological level influence energy-consumption levels, thereby constraining carbon emission intensity and ultimately shaping the EKC curve. On the other hand, some scholars argue that under the backdrop of globalization, external shocks can influence EKC morphology by altering internal factors. For example, Jun Wen (2021) [10] found a positive correlation between regional globalization levels and carbon emissions by tracking the globalization processes in different regions. Aslan Alper (2021) [11], using a Panel Vector Autoregression (PVAR) model, studied the relationship between foreign direct investment and carbon emissions, revealing that foreign direct investment can increase carbon emissions. Meanwhile, Mahmood, H. (2023) [12] proposed that the decline in EKC morphology in developed countries is a result of the overseas transfer of high-polluting industries. Therefore, comprehensive research on differences in carbon emissions among different countries and the summarization of carbon emission patterns require the analysis of longitudinal data using typical countries as research subjects.
Research on the heterogeneity of the Environmental Kuznets Curve (EKC) often requires the selection of multiple samples for comparative analysis. However, due to significant differences in industrial structure, technological level and energy intensity among different regions, using a single model for cluster analysis can lead to substantial errors. Many scholars have attempted to address this issue by constructing differentiated classification methods. For instance, Han Yujun (2008) [13], using industrial and income levels, divided 165 countries worldwide into four groups for EKC testing and summarized the emission patterns of different categories. Zou Qing (2015) [14], based on urbanization and industrialization levels, divided 30 provinces in China into seven groups and analyzed the income levels at the turning points of EKC curves, revealing significant differences among provinces. Yu Donghua (2016) [15], based on economic development level and development structure, studied 82 countries in groups and found that international trade and industrial proportion have a significant impact on carbon emissions.
In contrast to the aforementioned criteria for classification, this study adopts a classification method based on per capita energy consumption–emission intensity. Firstly, using per capita material consumption can reflect the material living standards, while emission intensity can represent the level of economic cleanliness, making the classification results more closely related to environmental development. Secondly, the classification does not involve GDP as an indicator, avoiding the influence of differences in GDP statistical methods on the rationality of grouping. Thirdly, this study focuses on developed countries that have already reached the peak of their EKC curves and have typical representatives of development types, which are more valuable for reference in China’s economic development and carbon emission-reduction efforts.
Based on this premise, this paper selects statistical data from 19 typical developed countries worldwide from 1970 to 2022 as the research object. By classifying them into four modes based on per capita energy consumption–emission intensity differences, the paper utilizes the Logarithmic Mean Divisia Index (LMDI) decomposition model to calculate the core factors of carbon emission reduction in different modes. It also analyzes the evolution path of carbon emissions, aiming to provide references for China’s overall strategy deployment for carbon neutrality and the formulation of regionally differentiated carbon emission-reduction policies.
The main contributions and innovations of this paper are reflected in the following aspects. Firstly, by utilizing the LMDI decomposition model, an analysis of eight factors influencing carbon emissions, including industrial structure, economic scale and technological level, has been conducted. This provides crucial clues and theoretical support for a deeper understanding of the driving mechanisms behind carbon emissions. Secondly, through a systematic study of the heterogeneity of carbon emissions in developed countries, the carbon emission patterns under different modes have been revealed, offering new perspectives and methodologies for understanding the complexity of carbon emissions. Thirdly, by investigating the carbon emission patterns in developed countries, adaptable carbon-reduction pathways applicable to China have been proposed, providing insights and references for China’s efforts to achieve carbon neutrality goals.

2. Model Construction and Data Sources

2.1. Environmental Kuznets Curve (EKC) Model

This study employs quadratic and cubic regression analyses to explore the intricate relationship between environmental pollution and economic development, and to validate the applicability of the Environmental Kuznets Curve (EKC) across different development patterns. The EKC theory posits an inverted U-shaped relationship between environmental pollution and economic development, yet real-world scenarios may be influenced by various factors, leading to differences in curve shapes [16,17]. By subjecting different development patterns to regression analysis, a more comprehensive investigation into the nonlinear relationship between the environment and the economy, as well as potential inflection or turning points, can be conducted. Compared to simple linear regression, quadratic and cubic regression methods offer a more accurate depiction of the data’s curve trends, thereby enhancing model fitting and predictive capabilities. Thus, this study employs both quadratic and cubic regression methods to avoid potential errors associated with a single approach, enabling a deeper analysis of the data and the derivation of more reliable conclusions.
lnCit = β1lnpgit + β2 (lnpgit)2 + γt + δj + ηit
lnCit = β1lnpgit + β2 (lnpgit)2 + β3 (lnpgit)3 + γt + δj + ηit
In this study, we denote i as the different development modes, where i = 1, 2, 3, 4; t represents time; lnCit represents the natural logarithm of per capita carbon emissions; lnpgit denotes the level of economic development, measured by per capita GDP; β is the coefficient to be estimated; γt represents time fixed effects, δj represents region fixed effects; and ηit is the random error term.

2.2. LMDI Decomposition Model

The LMDI decomposition method was proposed by Ang (1998) [18] and other scholars in the 1990s. It has been widely used due to its advantages such as overcoming issues like zero or negative results, providing a full decomposition, absence of residuals and ease of interpretation. Based on the Kaya Identity and drawing on the research methods of Zhao, M. (2010) [19], Quan, C. (2020) [20], Li, R. (2023) [21], among others, this study utilizes the LMDI method to construct a dual decomposition model of carbon emissions, as shown in Formulas (3) and (4). Compared to existing research, this paper extends the scope of study by constructing a dual LMDI decomposition model, expanding the factors influencing carbon emissions to eight.
C = C E a × E a E × E G D P × G D P P × P = L × M × N × V × P
C = i = 1 n G D P × G D P i t G D P × C i t G i t = i n Y t × S i t × I i t
In the equations, C represents carbon emissions, E a stands for fossil energy consumption, E denotes total energy consumption, G D P represents Gross Domestic Product, G D P i t indicates the value added of the i-th industry at time t, C i t represents the carbon emissions of the i-th industry at time t and P denotes the total population.
Here, L = C/Ea_represents the carbon emission factor of fossil energy, reflecting the structure of fossil energy consumption; M = E a / E represents the proportion of fossil energy consumption in total energy consumption, indicating the level of energy cleanliness; N = E / G D P denotes the level of economic energy consumption, representing the degree of technological advancement; V = G D P / P represents per capita GDP, indicating the level of economic development; S i t = G i t / G t represents the proportion of value added of the i-th industry in GDP at time t, reflecting the industrial structure of time t; I i t = C i t / G i t represents the emission intensity of the i-th industry at time t, indicating the carbon emission efficiency of the i-th industry at time t.
In this paper, we employ the LMDI “sum decomposition” method to decompose the factors of carbon emissions in typical countries. That is, C = C t C 0 , where the carbon emissions during the period can be decomposed as follows:
C = C t C 0 = C L + C M + C N + C V + C P
C = C t C 0 = C Q + C S + C I
where t represents the target year, and 0 represents the base year. C L ,   C M ,   C N ,   C V ,   C P ,   C Q ,   C S ,   C I respectively denote the contributions of emission factor, cleanliness level, technological level, economic level, population scale, economic scale, industrial structure and emission intensity expansion to carbon emissions. The specific calculation formulas are as follows:
C L =   ( C t C 0 )     ( l n C t l n C 0 )   · l n   ( L t L 0 )  
C M =   ( C t C 0 )     ( l n C t l n C 0 )   · l n   ( M t M 0 )  
C N =   ( C t C 0 )     ( l n C t l n C 0 )   · l n   ( N t N 0 )  
C V =   ( C t C 0 )     ( l n C t l n C 0 )   · l n   ( V t V 0 )  
C P =   ( C t C 0 )     ( l n C t l n C 0 )   · l n   ( P t P 0 )  
C Q = i ,   j   ( C i t C i 0 )     ( l n C i t l n C i 0 )   · l n   ( Q t Q 0 )  
C S = i ,   j   ( C i t C i 0 )     ( l n C i t l n C i 0 )   · l n   ( S i t S i 0 )  
C I = i ,   j   ( C i t C i j 0 )     ( l n C i t l n C i j 0 )   · l n   ( I i t I i 0 )  
where t represents the target year, and 0 represents the base year. C i 0 and C i t respectively denote the CO2 emissions from energy consumption of industry i in the base period and the t-th period; Q 0 and Q t represent the GDP in the base period and the t-th period; S i 0 and S i t represent the proportion of value added of industry i in the base period and the t-th period; I i 0 and I i t represent the emission intensity of industry i in the base period and the t-th period.

2.3. Research Object and Data Sources

This paper considers carbon emissions from all fossil CO2 sources, including fossil fuel combustion, non-metallic mineral processing (e.g., cement production), metal (ferrous and non-ferrous) production processes, urea production, agricultural lime and solvent use. Total energy consumption refers to primary energy consumption, including fossil energy, nuclear energy, hydroelectric power and renewable energy; fossil energy includes oil, coal and natural gas; renewable energy includes solar energy, wind power, geothermal energy, biofuels, biomass and others; clean energy includes nuclear energy, hydroelectric power and renewable energy.
This study focuses on typical developed countries as research subjects, selected from G20 countries or the Organisation for Economic Co-operation and Development (OECD). To ensure representativeness, three main factors were considered: first, the per capita GDP is greater than or close to USD 20,000 per person; second, the selected countries exhibit diverse economic development models; third, the selected countries represent diverse development environments (such as geographic location, national area and population size). Ultimately, 19 countries were selected, including Australia, Chile, Denmark, Portugal, South Korea, Japan, Canada, Sweden, Austria, Finland, the United Kingdom, Germany, Spain, the Netherlands, France, Switzerland, Belgium, the United States and Italy. Although Chile is not traditionally recognized as a developed country, considering its significant economic development achievements, successful emergence from the “middle-income trap” [22] and its OECD membership status, it was still included in the research sample.
The energy data in this paper are sourced from BP (British Petroleum) [23]; carbon emissions data for each country are sourced from the Emissions Database for Global Atmospheric Research (EDGAR); GDP and per capita GDP data are obtained from the Groningen Growth and Development Centre (GGDC) using PPP (Purchasing Power Parity) in 1990 GK dollars; population data, manufacturing value-added ratios and other data are sourced from the World Bank’s data repository. China’s carbon emissions data are obtained from the China Emission Accounts and Datasets (CEADS), while China’s energy-consumption data are sourced from the “China Energy Statistical Yearbook”. Population and economic data for China and its provinces are sourced from China Statistical Yearbooks.

3. Heterogeneity of Carbon Emissions in Developed Countries

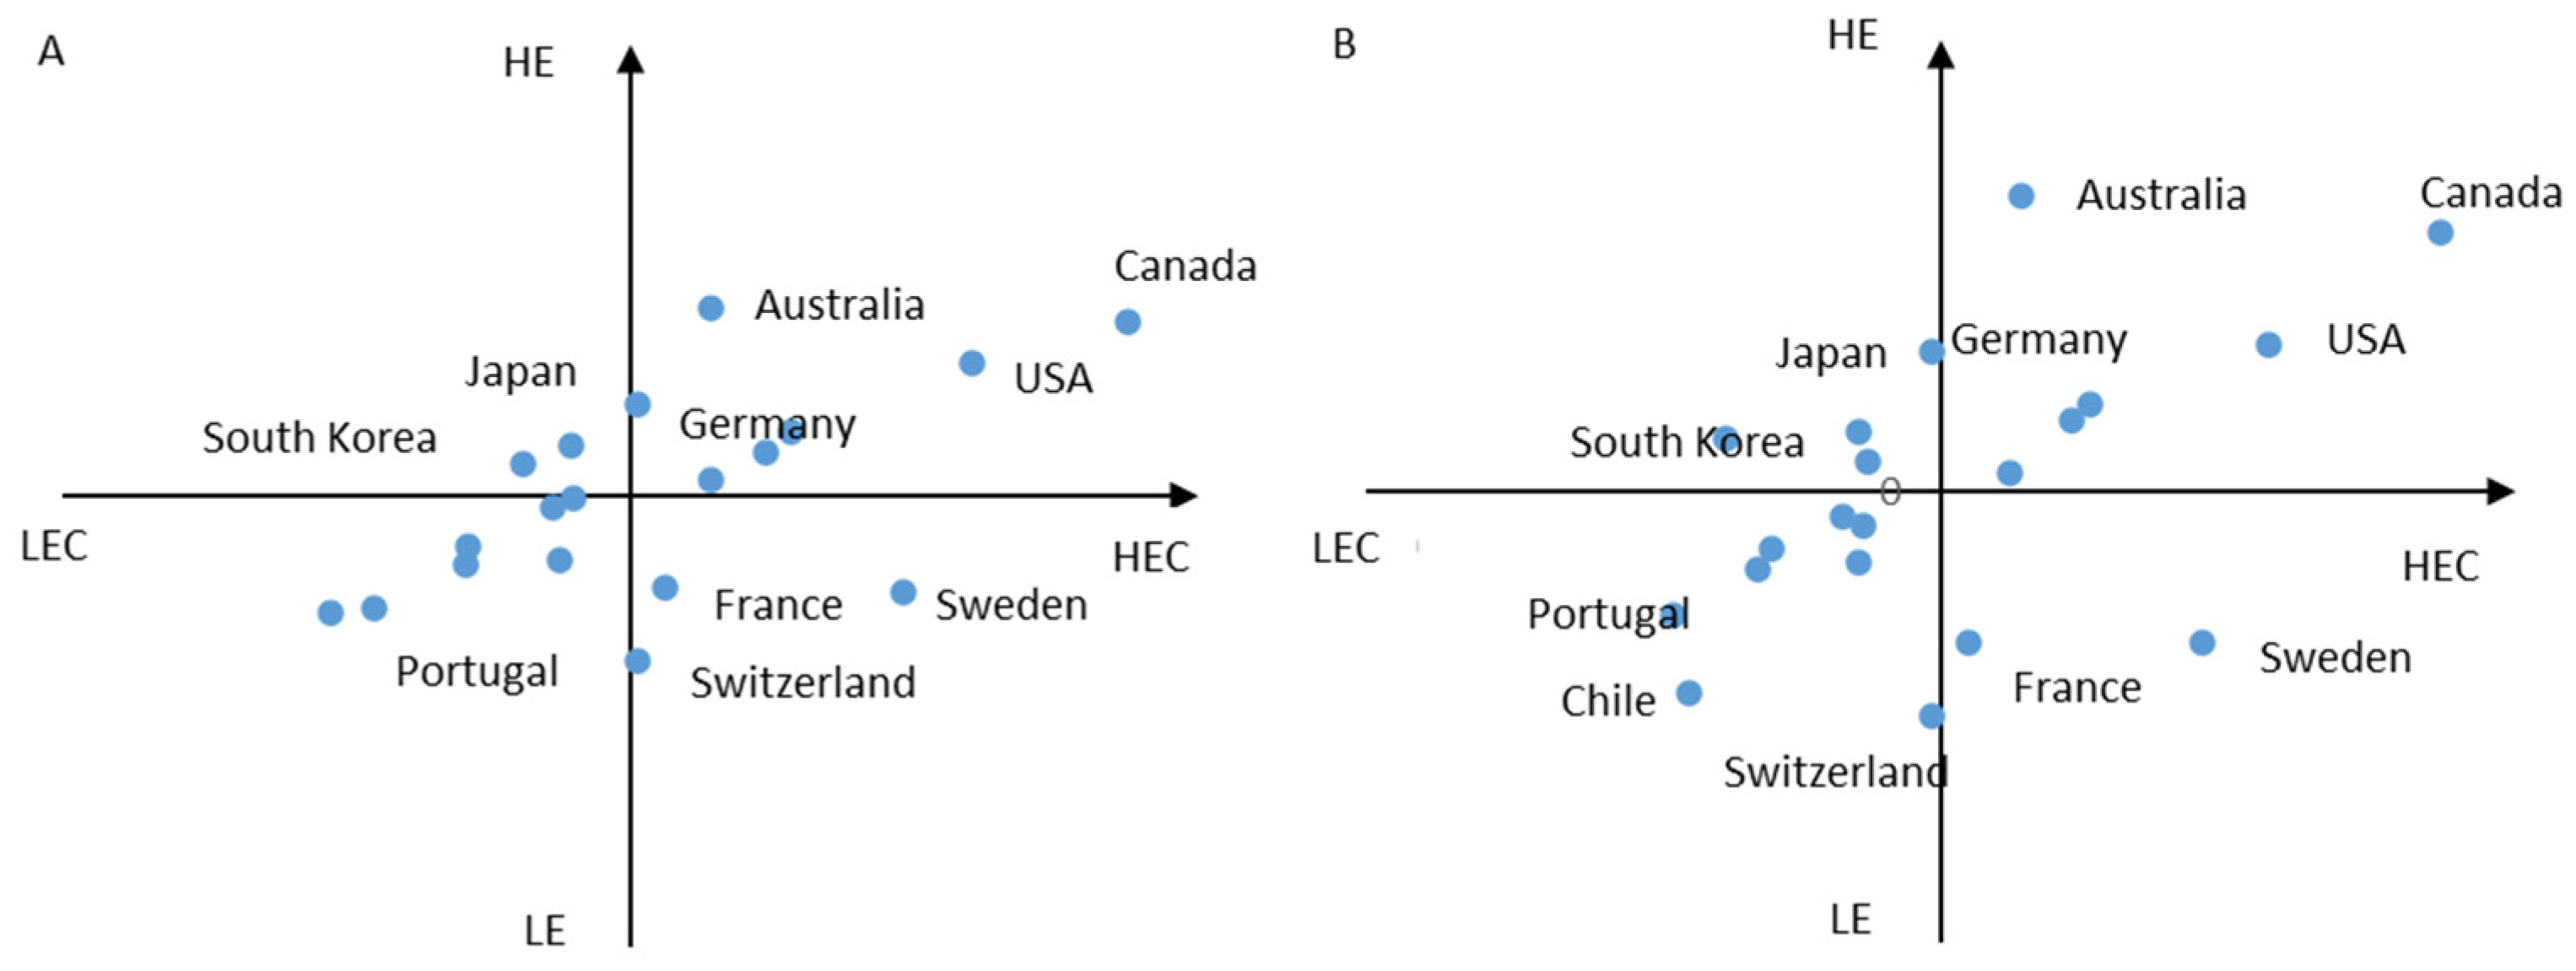
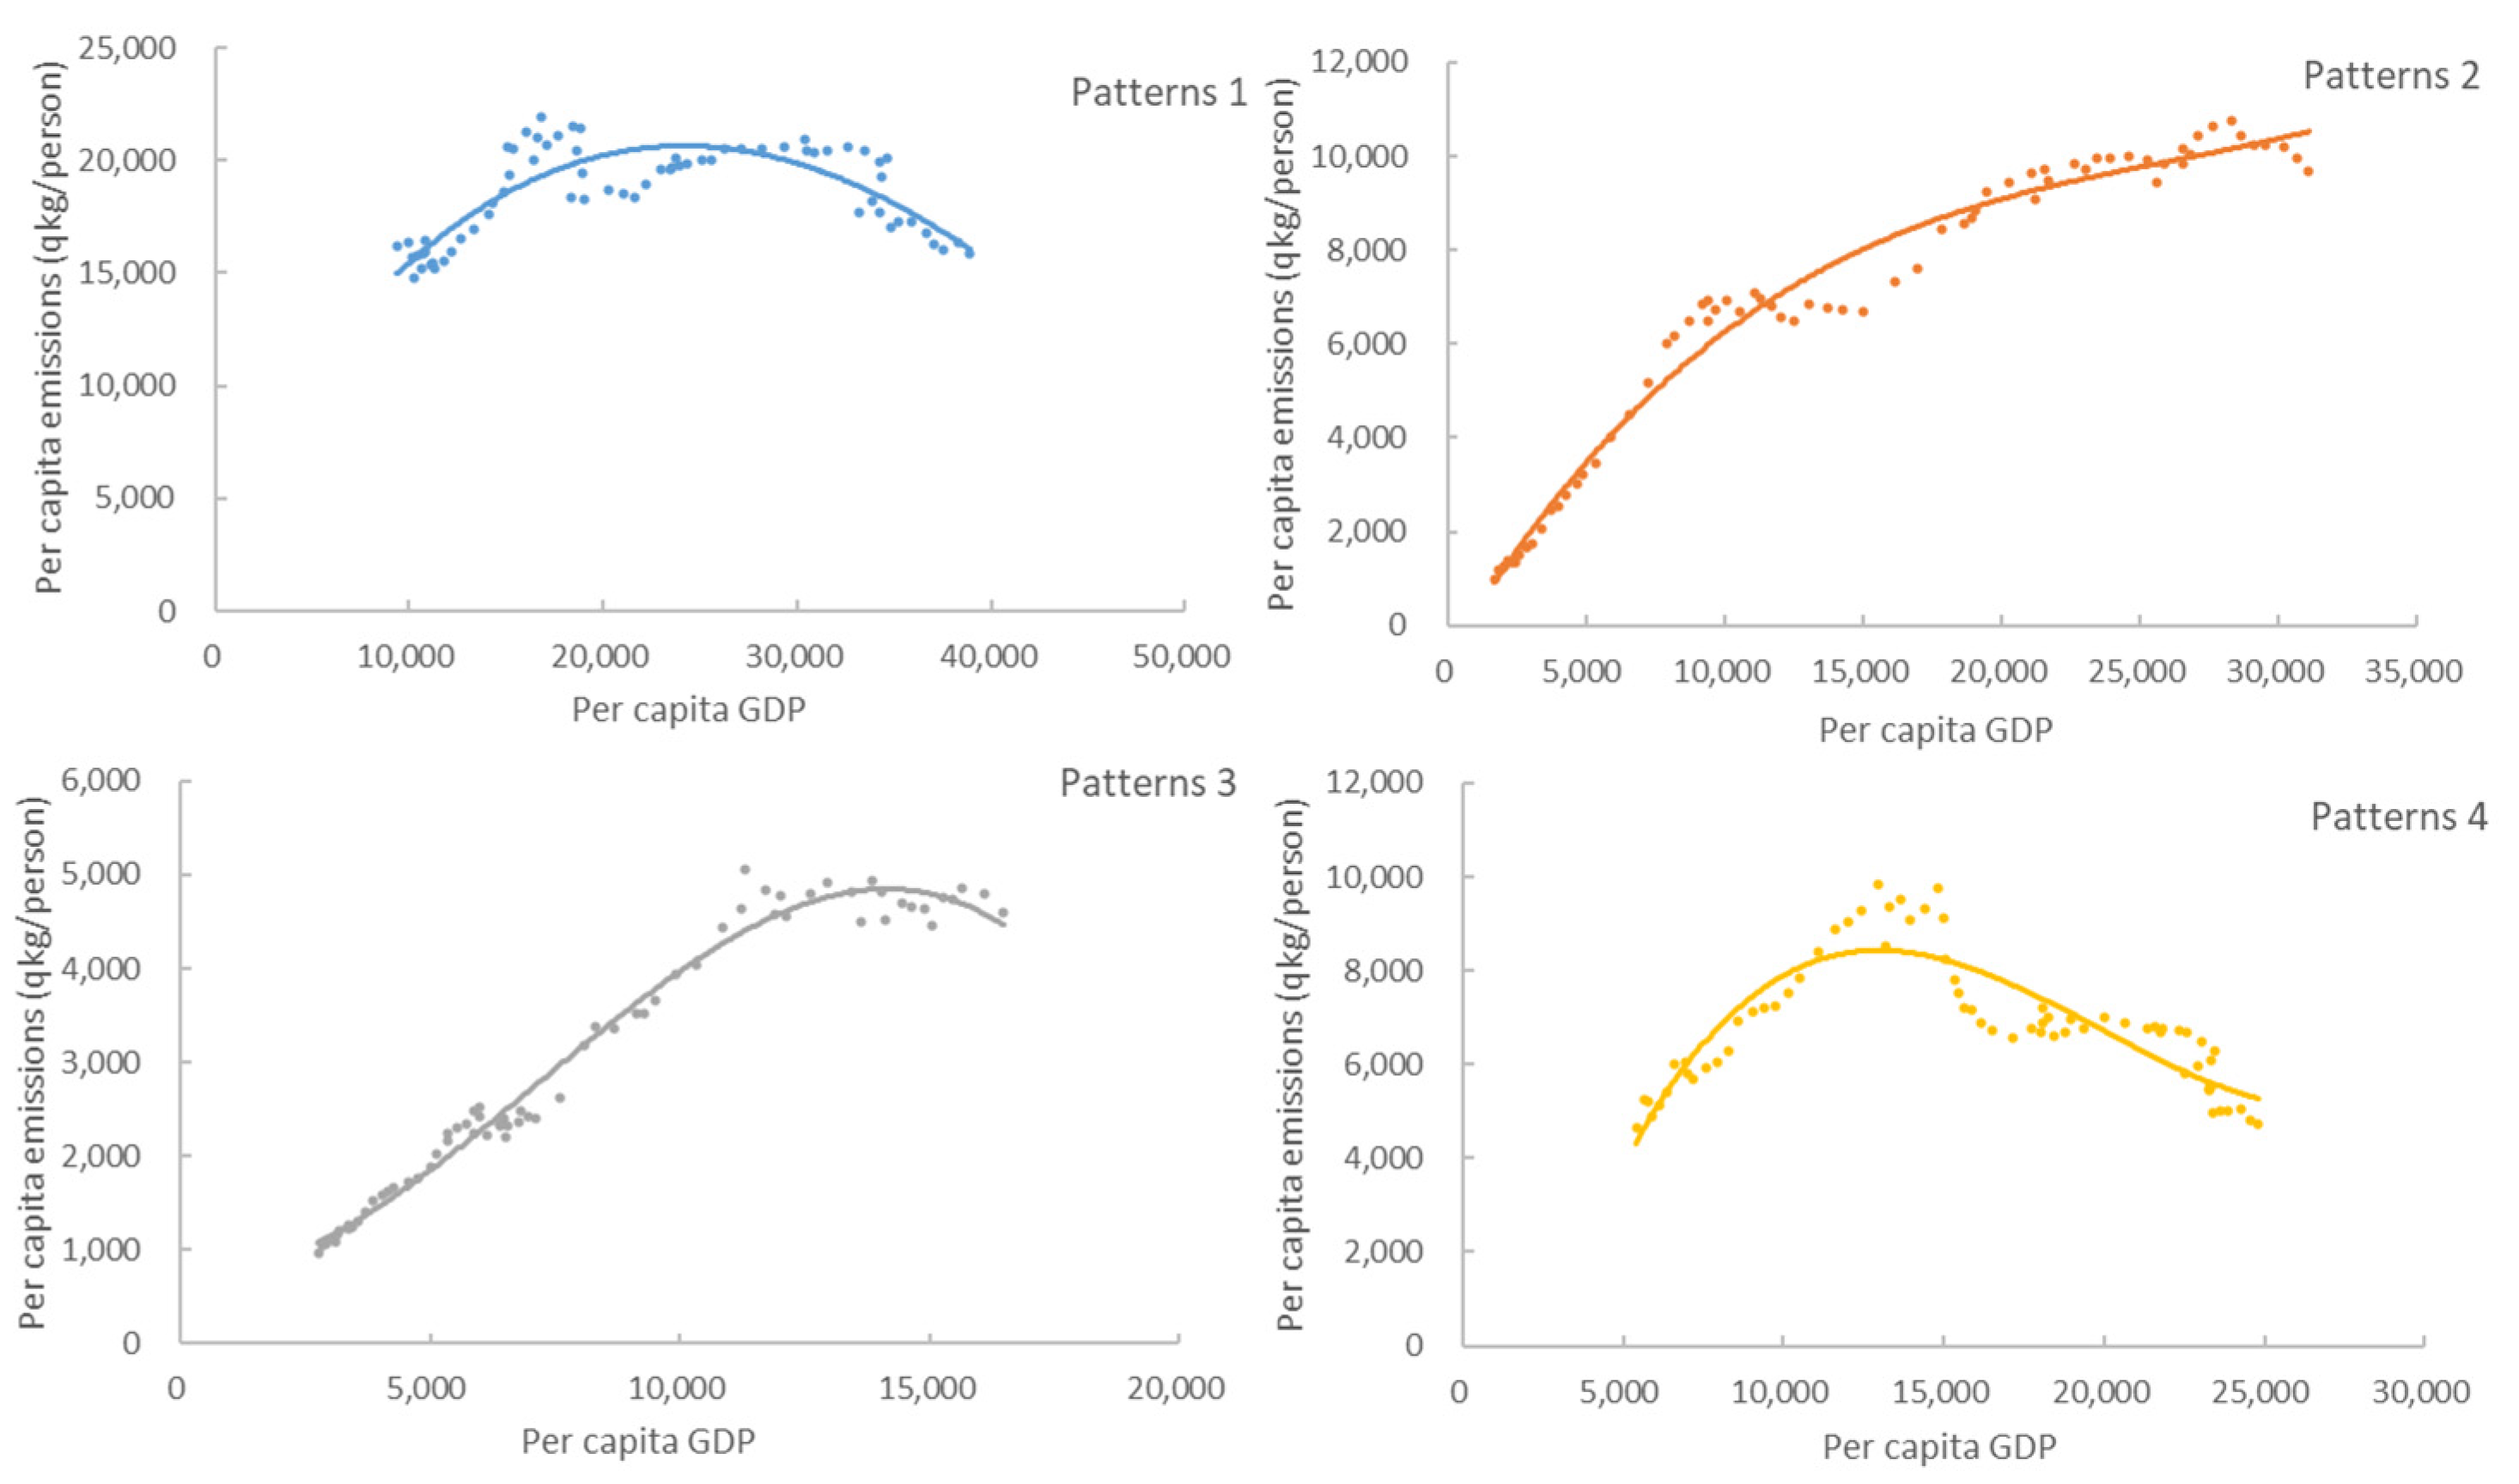
3.1. Classification of Carbon Emission Patterns in Developed Countries

Carbon emissions are closely related to economic scale, population size, energy structure and energy consumption [24]. Statistical data indicate that there is a non-linear relationship between emission intensity and per capita energy consumption in the sample countries. A comparison reveals that countries such as the United States, Canada and Australia have high emission intensity and large per capita energy consumption. Conversely, countries like South Korea, Japan and Germany exhibit high emission intensity but relatively lower per capita energy consumption. Meanwhile, countries such as France, Sweden, Switzerland and Denmark show low emission intensity but high per capita energy consumption. Based on the differences in “per capita energy consumption–emission intensity”, the sample countries are categorized into four types.
Considering the significant differences in the economic stages of the sample countries from 1970 to 2022, to test the robustness of the classification, cross-sectional data for the year when the per capita GDP of the sample countries reached USD 20,000 per person are selected for classification using the above method, and the results are generally consistent (Figure 1B).
Classification of Sample Countries into Four Modes Based on “Per Capita Energy Consumption—Emission Intensity” Differences (Figure 1). Per capita energy consumption represents the average amount of energy consumed per person, reflecting the level of material consumption [25], with higher per capita energy consumption indicating higher quality of life [26]; emission intensity measures the amount of carbon dioxide emitted per unit of GDP, influenced by industrial structure and cleanliness of energy sources [27], indicating the cleanliness of economic development. Therefore (1) High Energy Consumption, High Emission Mode: characterized by high levels of both per capita energy consumption and economic carbon emissions, meeting the demands of high-quality living and economic development with substantial material consumption, represented by the United States and Canada; (2) Low Energy Consumption, High Emission Mode: characterized by low per capita energy consumption and high emission intensity, with economic development primarily driven by labor-intensive or resource-intensive industries [28], represented by Japan and South Korea; (3) Low Energy Consumption, Low Emission Mode: characterized by low levels of both per capita energy consumption and emission intensity, indicating relatively clean economic development, represented by Portugal and Chile; (4) High Energy Consumption, Low Emission Mode: characterized by high per capita energy consumption and low economic carbon emissions, simultaneously reducing carbon emissions while ensuring national economic development and material security, represented by France and Sweden. These four modes exhibit significant differences in economic development, carbon emissions, energy consumption and other indicators, primarily due to differences in economic development patterns and driving factors of carbon emissions. Understanding this heterogeneity and its underlying causes is the focus of this study.

3.2. Testing the Differences among Four Carbon Emission Patterns

To further investigate the differences among the four carbon emission patterns, this section delves into the inherent logic between carbon emissions and economic development using Formulas (1) and (2). Statistical data for different patterns are presented in Table 1.
To avoid spurious regression, it is essential to examine the stationarity of the data first. The unit root test results indicate that the original sample data are non-stationary, but after first-order differencing, all variables exhibit significant stationarity at the 1% level (Table 2). Therefore, the variables lnCO2, lngp, lnpg2 and lngp3 are integrated of order one and suitable for cointegration analysis. Additionally, F-tests and Hausman tests are conducted on the data series. The results suggest that the sample data conform to a fixed-effects model, and there are stationary residual sequences in the sample. This indicates that there exists a cointegration relationship among lnCO2, lngp, lnpg2 and lngp3, implying a long-term stable relationship between carbon emissions and economic development across the four patterns.
According to the quadratic equation (Equation (1)), regression analysis was conducted for the four patterns (Table 3). The results indicate that the coefficients of the linear and quadratic terms of per capita GDP are significant at the 1% level. Notably, the coefficient of the quadratic term of per capita GDP is negative, suggesting an inverted U-shaped relationship between per capita carbon emissions and per capita GDP. Regression analysis using the cubic equation (Equation (2)) for the four patterns shows that the cubic and quadratic terms of per capita GDP are significant at the 1% level. Both the cubic and linear term coefficients are negative, indicating an inverted N-shaped relationship between per capita carbon emissions and per capita GDP (Table 3). However, it was observed that the per capita GDP corresponding to the first inflection point is approximately 100 USD per person, which lacks practical significance. Therefore, Patterns 2 and 3 are still considered to exhibit an inverted U-shaped relationship.
Based on the results, the carbon emission trajectories of the four patterns exhibit an inverted “U” shape from 1970 to 2022 (Figure 2). The carbon emission trajectories of different patterns exhibit heterogeneity, mainly manifested in differences in trajectory shape, vertex position and post-vertex trajectory trends. Among them, Patterns 1, 3 and 4 have reached their per capita carbon emission peaks and are beginning to decline, while the growth rate of per capita carbon emissions in Pattern 2 is slowing down, indicating that it is approaching its emission peak. In terms of carbon emission peaks, Pattern 1 has the highest peak, Pattern 3 has the lowest and the other patterns fall between the two. After reaching the peak, the trajectories diverge, with Pattern 1 maintaining its peak for a longer period, while per capita carbon emissions in Pattern 4 decrease rapidly after reaching the peak. The main factors contributing to the heterogeneity of carbon emissions in different patterns can be summarized as economic foundations, resource endowments, development modes and industrial structures. Pattern 1 represents traditional developed countries with favorable development environments and stable access to mineral resources to meet their large energy demands [29]. Pattern 2 represents emerging developing countries that have absorbed industrial transfers from Western countries and gradually upgraded their industrial structures following the “textile industry light industry steel industry heavy industry electronic industry” pattern [30,31]. Concurrently, with the advancement of urbanization to meet the demand for high-quality living standards, Pattern 2 continues to increase its energy demand, thus delaying the peak of carbon emissions. Pattern 3 has a lower proportion of heavy industry in its industrial structure, with higher proportions of agriculture, trade and services, resulting in lower carbon emissions intensity. Pattern 4 has a solid industrial base, actively develops high-tech industries and attaches importance to ecological benefits and improvements in national welfare, achieving clean development.

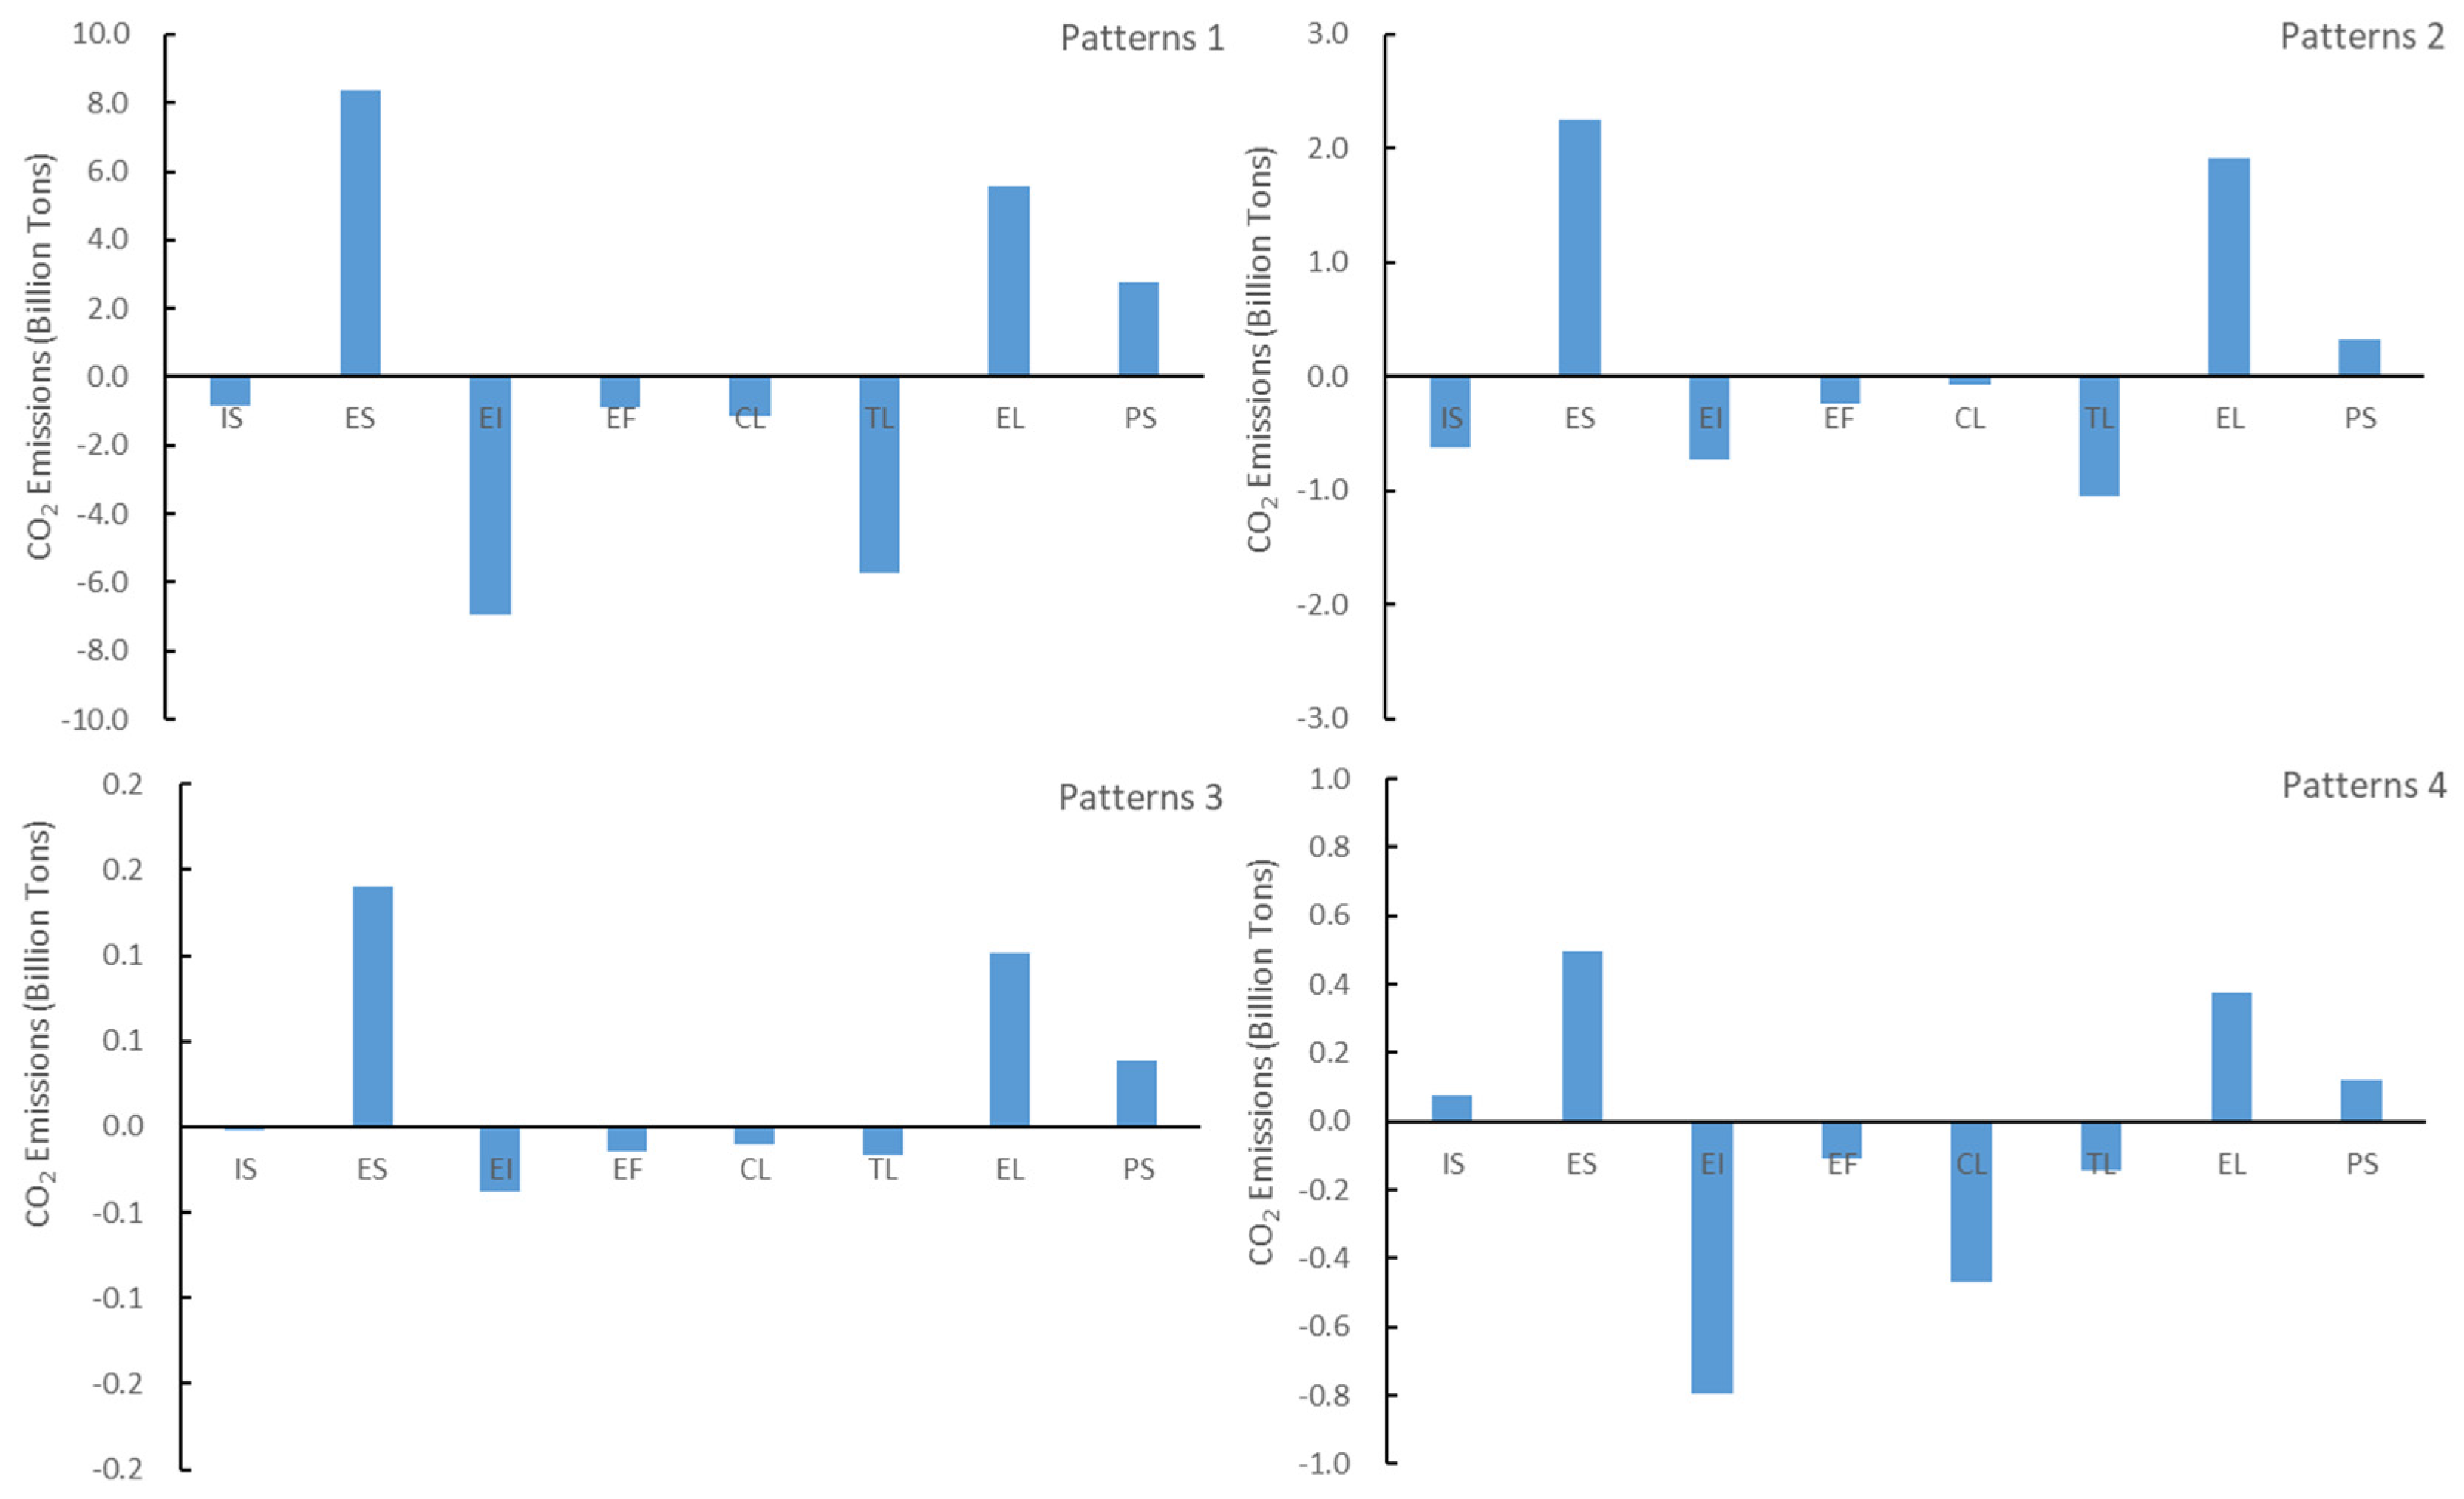
3.3. Driving Effects of Four Carbon Emission Patterns

Using the LMDI model to decompose carbon emissions, different factors driving carbon emissions were identified. The results indicate that emission intensity, technological level, cleanliness level, emission factor and industrial structure are the main driving factors for carbon emission reduction in the four patterns, but the driving effects of each factor vary significantly among different patterns. Among the driving factors of carbon emissions, industrial structure, economic scale, emission factor, cleanliness level, economic level and population size are primarily controlled by the emitting entities and are less influenced by other factors. Emission intensity refers to the carbon emissions per unit GDP, influenced by industrial structure and energy cleanliness level. Technological level refers to the energy consumption per unit GDP, influenced by industrial structure and the degree of energy-saving technology advancement. This allows for a deeper analysis of the reasons for carbon emission reduction in different patterns. Observing the cumulative contribution of carbon emission-reduction driving factors in different patterns (Figure 3), it is found that in Pattern 1, the main factors for emission reduction are emission intensity and technological level, with a lower contribution from industrial structure, indicating that technological progress primarily drives carbon emission reduction in this pattern. In Pattern 2, the main factors for carbon reduction are technological level, emission intensity and industrial structure, with a significant effect of cleanliness level and a larger contribution from industrial structure adjustment, suggesting that technological progress driven by industrial restructuring is the main reason for carbon emission reduction in this pattern. In Pattern 3, carbon reduction is mainly driven by emission intensity, technological level, emission factor and cleanliness level, with a smaller effect from industrial structure, indicating that technological progress and energy cleanliness are the primary reasons for carbon emission reduction. In Pattern 4, carbon reduction is primarily driven by emission intensity and cleanliness level, with energy cleanliness being the key to achieving carbon reduction.
Based on the differences in industrial structure, Pattern 2 represents heavy industry, while Pattern 3 represents light industry. It can be seen that carbon reduction in heavy industry relies mainly on industrial restructuring, while carbon reduction in light industry relies on technological progress and energy cleanliness. Patterns 1 and 4 represent two ways of carbon reduction in highly developed countries. Pattern 1 is characterized as technological, with carbon reduction mainly achieved through the elimination and restructuring of high-emission industries and technological advancements. Pattern 4 is categorized as clean, with carbon reduction primarily relying on adjusting the energy structure and increasing the proportion of clean energy.

4. Analysis of Carbon Emission Characteristics in China

4.1. Statistical Characteristics

Referring to the results of per capita energy consumption and emission intensity for typical developed countries, China has consistently remained in the second quadrant since 1970 (Figure 4). However, there has been a significant decrease in carbon emission intensity, reflecting China’s remarkable achievements in carbon reduction. Further analysis of China’s trajectory of per capita GDP and per capita carbon emissions in comparison to the four carbon emission patterns (Figure 5) shows that China’s carbon emissions are approaching their peak. The curve aligns closely with the characteristics of Pattern 2 in the early stages, but given the context of carbon neutrality, Pattern 4 provides more valuable insights for China’s future carbon-reduction efforts.
Statistical data from China and the four carbon emission patterns from 2014 to 2022 reveal that the carbon emission intensity of Pattern 4 is 203.3 gCO2/USD, significantly lower than Patterns 1 to 3 (Table 4), reflecting the highest level of economic cleanliness in Pattern 4. Further observation shows that the energy intensity of Pattern 4 is 8898.6 kJ/USD, higher than Patterns 1 to 3 (Table 4), indicating that Pattern 4 achieves carbon reduction while developing industry more effectively. In essence, this is achieved by expanding the proportion of clean energy in the energy structure. For example, the proportion of clean energy in Pattern 4’s energy structure is 38.2%, much higher than Pattern 1 (17.1%), Pattern 2 (9.7%) and Pattern 3 (22.1%). Another factor is the improvement of industrial technology level. Countries like France and Sweden emphasize the development of high-end industries, implement global brand strategies, encourage the development of nuclear power, high-end manufacturing, biopharmaceuticals, high-end consumption and new energy and environmental protection industries, thereby increasing industrial value and economic cleanliness. A comparison reveals that while China’s emission intensity is higher than the four patterns, its energy intensity is lower than Patterns 1 and 4. Therefore, future carbon neutrality policies in China should focus on reducing emission intensity.

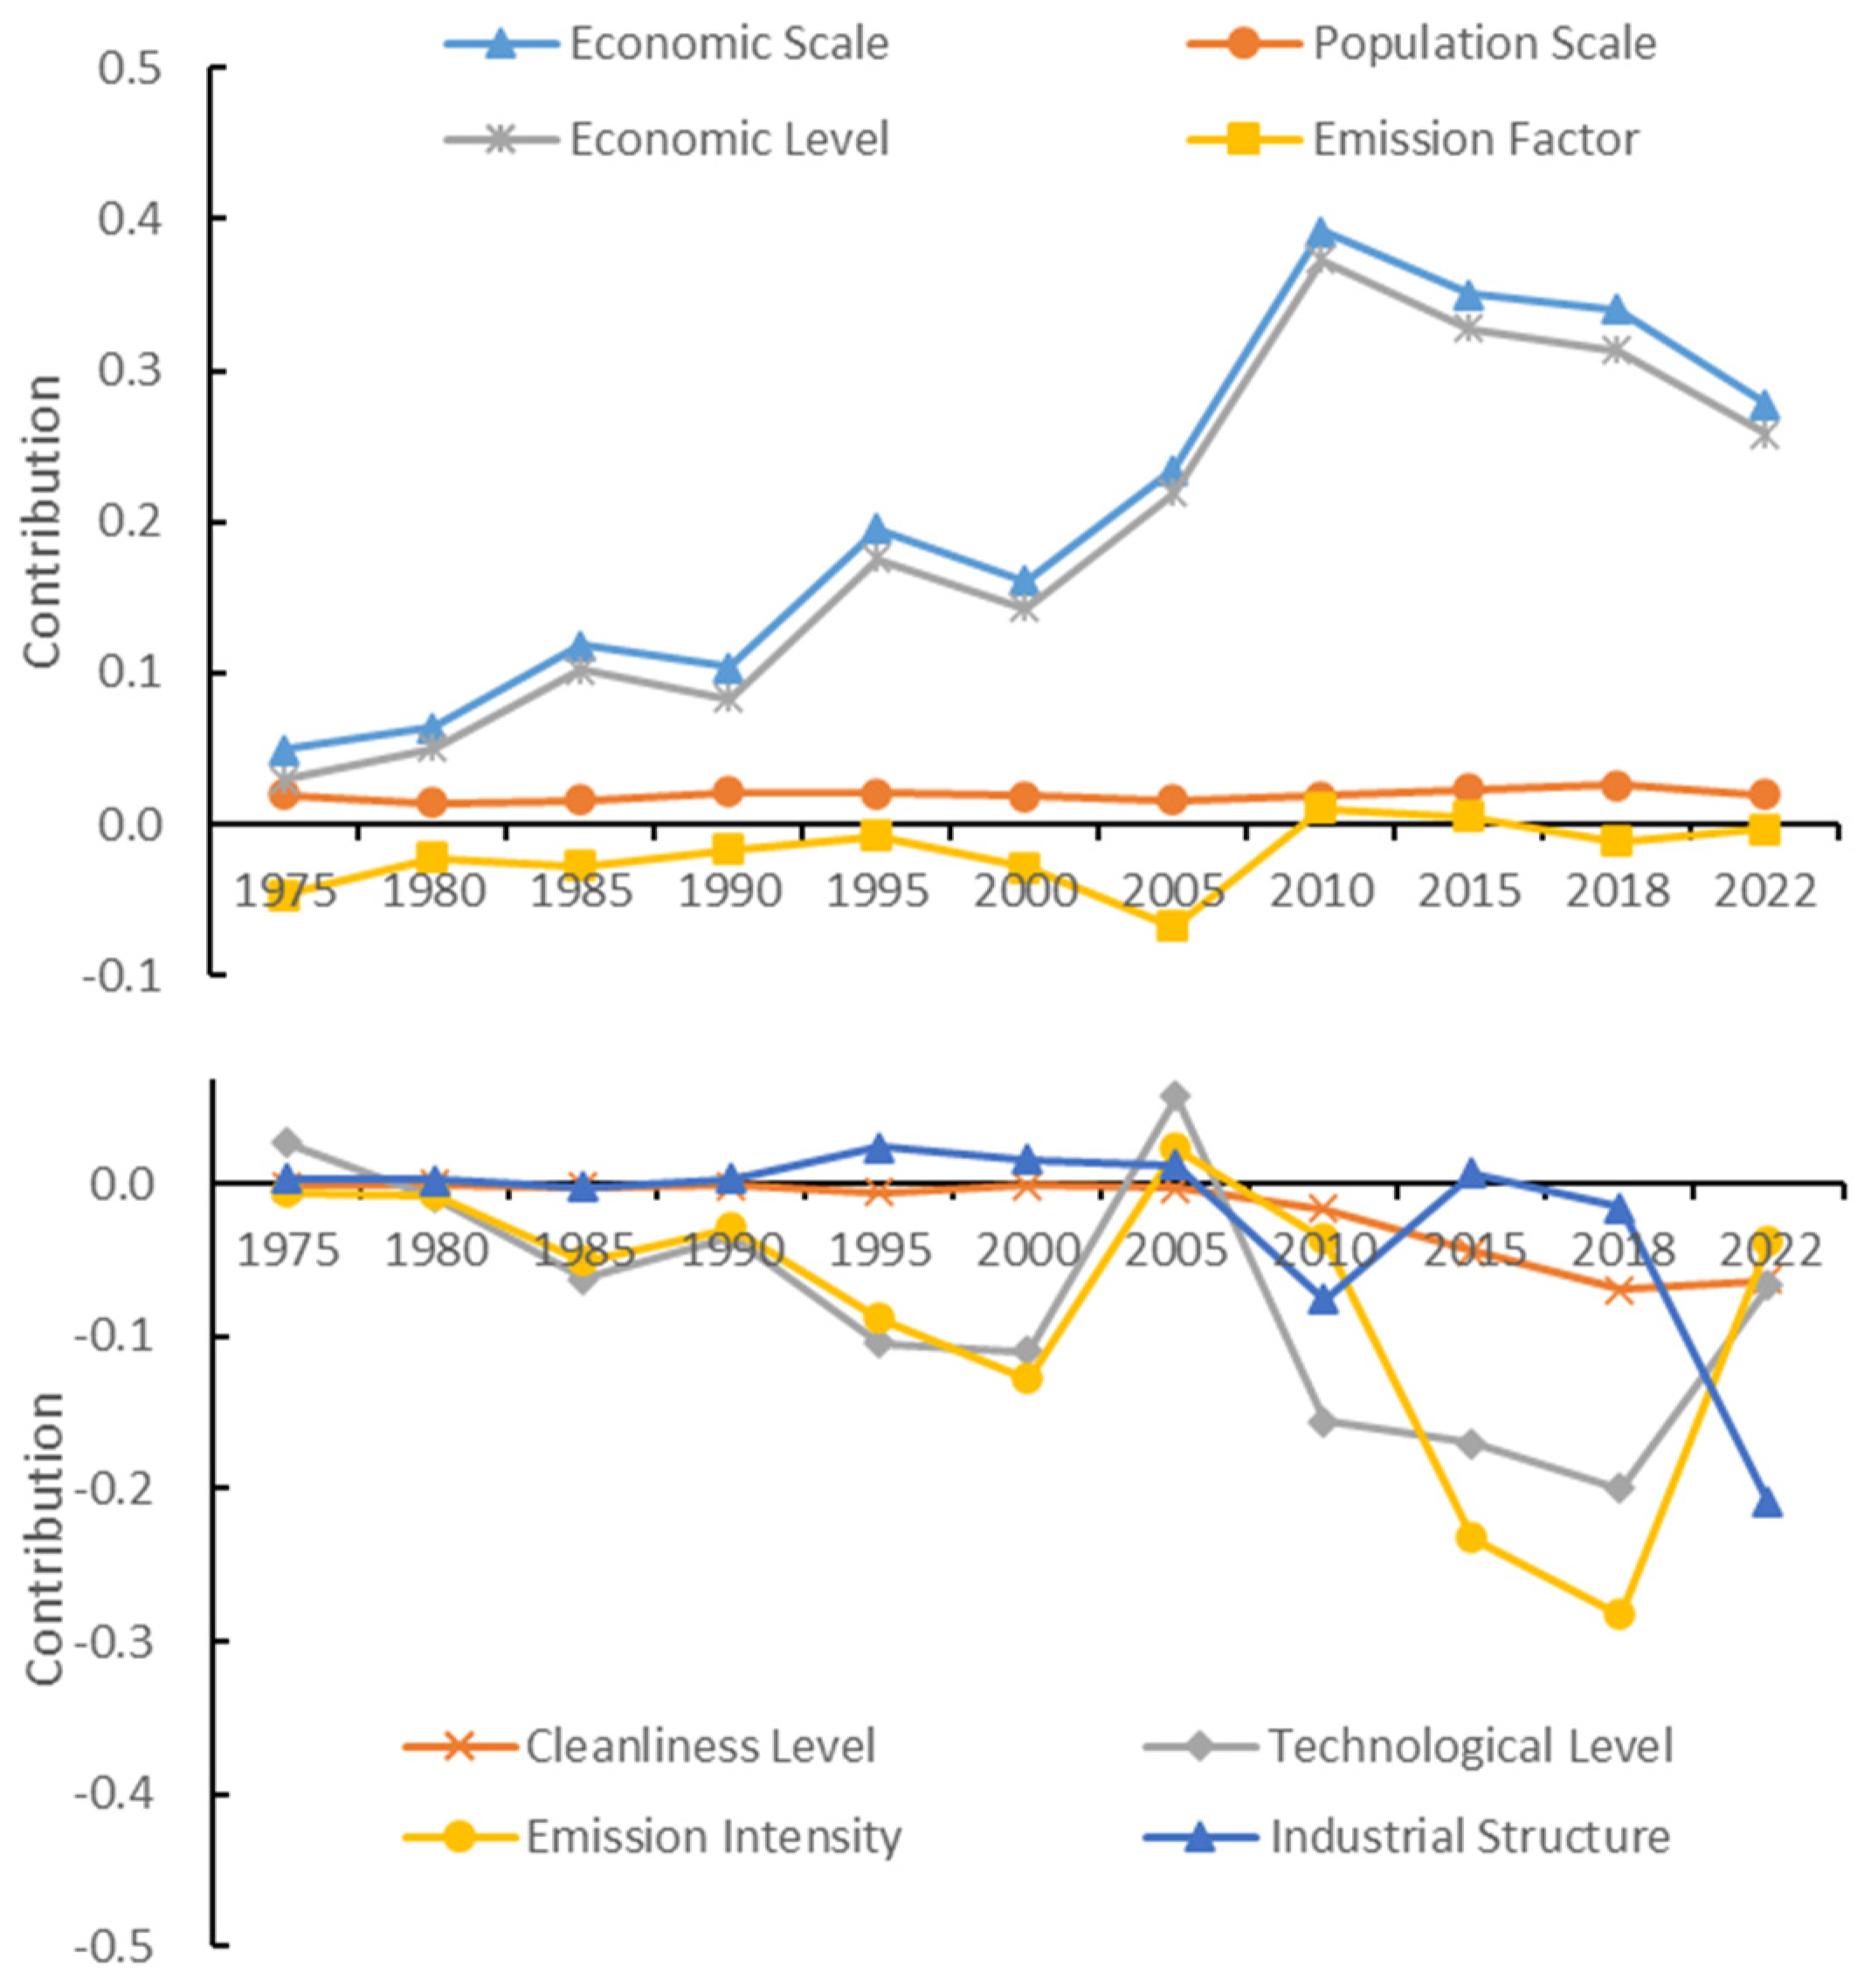
4.2. Driving Effects

Contribution is the ratio of the increase in carbon emissions caused by a certain factor during a certain period to the total increase in carbon emissions during the study period, representing the contribution of that factor to carbon emissions. The contribution of carbon emissions in China is calculated using the LMDI model. From the changes in the coefficients of carbon emission contributions in Figure 6, it can be seen that since 1975, the contributions of various factors to carbon emissions and the differences between factors have gradually increased. According to the direction of the contribution coefficient of each factor, it can be observed that economic scale, economic level and population scale play a positive promoting role in China’s carbon emissions, while technological level, clean level and industrial structure play a negative inhibitory role. The effect of emission factors on carbon emissions fluctuates greatly. According to the differences in contribution coefficient, since 2005, technological level has always been the most important factor in carbon emission reduction, and the carbon emission-reduction effect of clean level has gradually strengthened. However, the effect of industrial structure shows a “increase → decrease → increase” trend with 2010 as the node. In fact, this is related to the increased economic stimulus in China during the 2009 financial crisis, while since 2015, the effect of industrial structure on inhibiting carbon emissions has gradually strengthened, reflecting significant achievements in the high-end industrialization of China’s economy. In 2022, the contribution coefficient of industrial structure in China’s carbon emission inhibition factor was −0.2084, much greater than that of technological level (−0.0666), clean level (−0.0631) and emission factor (−0.0027). Industrial structure adjustment has become the most important reason for carbon emission reduction in China. Compared with the carbon emission-reduction factors in Model 2, the carbon emission-reduction effect of China’s industrial structure is relatively small; compared with Model 4, the carbon emission-reduction effect of China’s clean level is relatively small. Future emphasis on energy cleanliness and industrial structure adjustment should be the focus of carbon emission reduction.

4.3. Provincial Disparities

Using the LMDI decomposition model, carbon emissions across 30 provinces in China from 2017 to 2022 were decomposed. The results, as shown in Figure 7, indicate that green represents factors inhibiting carbon emissions, while red denotes factors promoting carbon emissions, with darker colors indicating stronger driving effects. Overall, technological level emerges as the primary factor in carbon reduction, while economic development stands out as the main driver of carbon emissions. The driving effects across provinces align closely with the national level, albeit with significant inter-provincial disparities. The major promoting factors of provincial carbon emissions include economic scale, economic level and technological level, with the predominant promotion effect of technological level observed in North and Northeast China, followed by economic scale. In other regions, economic scale and economic level take precedence. Additionally, the primary inhibiting factors of provincial carbon emissions mainly consist of technological level, industrial structure and cleanliness level, with industrial structure identified as the most significant inhibiting factor in North China and economic scale in the Northeast. In other regions, technological level predominates. Furthermore, the second most significant inhibiting factor in North China is cleanliness level, while in the Northeast, it is economic scale, and in other regions, it is industrial structure.
Observing interregional differences, it is evident that the industrial restructuring in the Beijing-Tianjin-Hebei region and Beijing’s policies to control rapid population growth have both yielded significant results, effectively reducing carbon emissions within the area. However, in North China and Northeast China, the effect of technological advancement is contrary to the national trend, promoting carbon emissions, indicating a long road ahead in reducing energy consumption. Outward migration of population, slow economic development and sluggish industrial restructuring in Northeast China have all contributed to the reduction of carbon emissions within the region. Meanwhile, rapid economic development, technological progress and significant industrial upgrades in the Yangtze River Delta, the Pearl River Delta and the Sichuan-Chongqing region have attracted a large influx of population, facilitating synergistic economic and environmental development within the respective areas.

5. Conclusion and Implications

Based on the disparity in per capita energy consumption and carbon dioxide emission intensity, this paper categorizes carbon emissions in developed countries into four patterns. Through the LMDI decomposition model, it examines the quantitative relationships between carbon emissions in various patterns and industrial structure, economic scale, emission factors, cleanliness level, economic level, population size, emission intensity and technological level. The following conclusions and implications are drawn:

5.1. Key Findings

(1) Carbon Emission Patterns: Through an analysis of the historical trajectory of carbon emissions in developed countries, it was found that the per capita carbon emissions exhibited an inverted U-shaped curve with respect to per capita GDP, indicating that carbon emissions initially increased and then decreased with economic development. The study revealed similar trends in carbon emission trajectories across different modes, generally reaching their emissions peak as per capita GDP approaches USD 12,000, with most countries reaching or nearing their emission peak at around USD 18,000 per capita GDP. Following the emission peak, per capita carbon emissions decreased and tended toward a level of around 4000 kg per person.
(2) Heterogeneity of Environmental Kuznets Curve (EKC): Variations exist in the EKC of carbon emissions among different countries, primarily manifested in the growth rate of emissions, the position and duration of the peak, and the rate of decline in emissions. These can be summarized into four modes: high energy consumption and high emissions, high energy consumption and low emissions, low energy consumption and low emissions, and low energy consumption and high emissions. The high energy consumption and high emissions mode corresponds to countries with highly developed economies, while the high energy consumption and low emissions mode is characteristic of industrializing countries or stages. The low energy consumption and low emissions mode is typical of early-stage development or light industrial countries, while the low energy consumption and high emissions mode mainly occurs in later stages of development or in economies with a higher proportion of clean energy in their energy mix. The heterogeneity of the EKC is attributed to differences in structural effects, technological effects and clean energy effects. Structural effects involve reducing environmental pressure by reducing pollution-intensive industries, technological effects primarily focus on improving energy efficiency through technological means and clean energy effects entail adjusting the proportion of clean energy in the energy structure to regulate carbon emissions.
(3) Carbon Emission-Reduction Models: Based on the primary factors driving emission reductions, four models can be identified: technological, structural, comprehensive and clean. The technological model, represented by the United States and Canada, achieves emission reductions primarily through technological innovation to lower energy consumption and emissions levels. The structural model, exemplified by Japan and South Korea, achieves emission reductions through industrial restructuring to reduce the proportion of high-energy-consuming industries, thereby advancing technological levels. The comprehensive model, represented by Portugal and Chile, achieves emission reductions through simultaneous adjustments in energy structure, industrial structure and technological progress. The clean model, represented by France and Sweden, achieves emission reductions primarily by increasing the proportion of clean energy in the energy structure. Most trajectories of carbon emissions in developed countries follow the clean model. Newly developed countries, under environmental pressure, are likely to fall between the comprehensive and structural models before the emission peak, with trajectories trending towards the clean model after the emission peak.
(4) Driving Factors: Carbon emission influencing factors are complex, involving industrial structure, economic scale, emission factors, clean level, economic level, population scale, emission intensity and technological level. The results indicate that economic scale, economic level and population scale are the primary factors driving carbon emissions, but industrial structure, emission factors and clean level may also promote emissions depending on the stage of development and mode of development. Technological progress, clean level, industrial structure, emission factors and emission intensity have significant inhibitory effects on carbon emissions, with technological progress, clean level and industrial structure playing primary roles. Analysis of emission contribution reveals that increasing technological advancement and the proportion of clean energy in the energy structure can significantly promote emission reduction. Increasing the proportion of clean energy is the most direct and effective means of reducing carbon emissions and can substantially and efficiently achieve emission reductions. Industrial structural adjustment plays a significant role in inhibiting carbon emissions.

5.2. Key Insights

Based on the conclusions of the study and the differences between domestic regions, the following insights can be drawn to effectively implement China’s industrial development and carbon neutrality requirements.
Firstly, the primary target of China’s carbon-reduction policies should be to decrease emission intensity. To achieve this, efforts should focus on: reducing the proportion of fossil energy, enhancing energy cleanliness; promoting industrial structure upgrading to reduce energy dependency; and improving production technologies to enhance energy-utilization efficiency.
Secondly, considering the significant variations in carbon emission intensity among different regions in China, insights from the four carbon-reduction models of developed countries suggest the following regional carbon-reduction strategies:
(1) In regions like Northwest China, which are rich in energy resources and have a large proportion of energy-intensive GDP in their economic structure, the focus should be on developing clean energy production, enhancing technological levels through industrial structure adjustments and reducing energy consumption.
(2) Regions such as Northeast China, North China, Central China and Southwest China have a relatively large proportion of high-energy-consumption and high-pollution industries in their economic structures. For these areas, the emphasis should be on adjusting industrial structures and improving energy efficiency through technological advancements.
(3) Southeastern regions and the Yangtze River Delta have low per capita energy consumption and low emission intensity, indicating a relatively clean economic structure. The key strategies for these areas include prioritizing technological research and development, fostering innovation, developing high-tech industries to increase industrial value-added and implementing green strategies to build a zero-carbon society.
The study provides an in-depth analysis of the heterogeneity in carbon emissions among developed countries, summarizing specific carbon emission patterns and trends. This has significant implications for China’s implementation of its carbon neutrality strategy. However, the study has several limitations: firstly, the analysis of carbon emission influencing factors is a complex and comprehensive task. While this study selected eight factors using the double LMDI model, numerous other factors such as energy prices were not considered. Secondly, while the study explored carbon emission pathways in developed countries, it did not delve deeply into the interprovincial constraints within China, which remains an important focus for future research. Future research can be expanded to consider more influencing factors, such as energy prices and policy regulations, to achieve a more comprehensive understanding of the mechanisms influencing carbon emissions. Additionally, a more in-depth analysis at the provincial level can be conducted to explore the inter-provincial constraints and the differences in carbon-reduction strategies.

Author Contributions

Conceptualization, Y.Z. (Yansong Zhang); Methodology, Y.Z. (Yansong Zhang); Validation, G.H.; Formal analysis, G.H.; Resources, G.H. and Y.Z. (Yan Zhang); Data curation, Y.Z. (Yansong Zhang); Writing – original draft, Y.Z. (Yansong Zhang) and G.H.; Supervision, Y.Z. (Yan Zhang). All authors have read and agreed to the published version of the manuscript.

Funding

This research was funded by the China Geological Survey Project (No. DD20230563).

Institutional Review Board Statement

Not applicable.

Informed Consent Statement

Not applicable.

Data Availability Statement

Data are contained within the article.

Conflicts of Interest

The authors declare no conflicts of interest.

References

  1. Farooq, S.; Ozturk, I.; Majeed, M.T.; Akram, R. Globalization and CO2 emissions in the presence of EKC: A global panel data analysis. Gondwana Res. 2022, 106, 367–378. [Google Scholar] [CrossRef]
  2. Pata, U.K.; Kartal, M.T.; Erdogan, S. Analyzing the EKC hypothesis for technologically advanced countries: The role of ICT and renewable energy technologies. J. Clean. Prod. 2023, 426, 139088. [Google Scholar] [CrossRef]
  3. Dogan, E.; Inglesi-Lotz, R. The impact of economic structure to the environmental Kuznets curve (EKC) hypothesis: Evidence from European countries. Environ. Sci. Pollut. Res. 2020, 27, 12717–12724. [Google Scholar] [CrossRef] [PubMed]
  4. Marsiglio, S.; Ansuategi, A.; Gallastegui, M.C. The environmental Kuznets curve and the structural change hypothesis. Environ. Resour. Econ. 2016, 63, 265–288. [Google Scholar] [CrossRef]
  5. Zhong, M.C.; Zhang, X.G. A Comprehensive Review of Critiques on the Environmental Kuznets Curve Theory and Research. Chin. J. Popul. Resour. Environ. 2010, 20, 62–67. [Google Scholar]
  6. Yang, L.; Gao, H.G. Can Economic Growth Automatically Solve Environmental Problems?—Is the Inverted U-shaped Environmental Kuznets Curve an Endogenous Mechanism or an Exogenous Control Result? Chin. J. Popul. Resour. Environ. 2012, 22, 160–165. [Google Scholar]
  7. Han, Y.J.; Lu, Y. Threshold Effect, Economic Growth, and Environmental Quality. Stat. Res. 2008, 9, 24–31. [Google Scholar]
  8. Pata, U.K.; Caglar, A.E. Investigating the EKC hypothesis with renewable energy consumption, human capital, globalization and trade openness for China: Evidence from augmented ARDL approach with a structural break. Energy 2021, 216, 119220. [Google Scholar] [CrossRef]
  9. Wu, Y.M.; Tian, B. Extension of Provincial Environmental Kuznets Curve and Its Determinants—Empirical Evidence from Spatial Econometric Models. Geogr. Res. 2012, 31, 627–640. [Google Scholar]
  10. Jun, W.; Mughal, N.; Zhao, J.; Shabbir, M.S.; Niedbała, G.; Jain, V.; Anwar, A. Does globalization matter for environmental degradation? Nexus among energy consumption, economic growth, and carbon dioxide emission. Energy Policy 2021, 153, 112230. [Google Scholar]
  11. Aslan, A.; Altinoz, B.; Atay Polat, M. The nexus among climate change, economic growth, foreign direct investments, and financial development: New evidence from N-11 countries. Environ. Prog. Sustain. Energy 2021, 40, e13585. [Google Scholar] [CrossRef]
  12. Mahmood, H.; Furqan, M.; Hassan, M.S.; Rej, S. The environmental Kuznets Curve (EKC) hypothesis in China: A review. Sustainability 2023, 15, 6110. [Google Scholar] [CrossRef]
  13. Han, Y.J.; Lu, Y. The Relationship between Economic Growth and Environment—An Empirical Study Based on the CO2 Environmental Kuznets Curve. Econ. Theory Econ. Manag. 2009, 03, 5–11. [Google Scholar]
  14. Zou, Q. Study on China’s Carbon Emissions EKC Based on Panel Threshold Regression. China Econ. Issues 2015, 04, 86–99. [Google Scholar]
  15. Yu, D.H.; Zhang, M.Z. Resolution of ‘Heterogeneity Problem’ and Reexamination of Carbon Emissions EKC—A Country Group Study Based on Threshold Regression. China Ind. Econ. 2016, 07, 57–73. [Google Scholar]
  16. Leitão, N.C.; Dos Santos Parente, C.C.; Balsalobre-Lorente, D.; Cantos Cantos, J.M. Revisiting the effects of energy, population, foreign direct investment, and economic growth in Visegrad countries under the EKC scheme. Environ. Sci. Pollut. Res. 2023, 30, 15102–15114. [Google Scholar] [CrossRef] [PubMed]
  17. Mahmood, H. Trade, FDI, and CO2 emissions nexus in Latin America: The spatial analysis in testing the pollution haven and the EKC hypotheses. Environ. Sci. Pollut. Res. 2023, 30, 14439–14454. [Google Scholar] [CrossRef] [PubMed]
  18. Ang, B.W.; Zhang, F.Q.; Choi, K.H. Factorizing changes in energy and environmental indicators through ecomposition. Energy 1998, 23, 489–495. [Google Scholar] [CrossRef]
  19. Zhao, M.; Tan, L.; Zhang, W.; Ji, M.; Liu, Y.; Yu, L. Decomposing the influencing factors of industrial carbon emissions in Shanghai using the LMDI method. Energy 2010, 35, 2505–2510. [Google Scholar] [CrossRef]
  20. Quan, C.; Cheng, X.; Yu, S.; Ye, X. Analysis on the influencing factors of carbon emission in China’s logistics industry based on LMDI method. Sci. Total Environ. 2020, 734, 138473. [Google Scholar] [CrossRef]
  21. Li, R.; Han, X.; Wang, Q. Do technical differences lead to a widening gap in China’s regional carbon emissions efficiency? Evidence from a combination of LMDI and PDA approach. Renew. Sustain. Energy Rev. 2023, 182, 113361. [Google Scholar] [CrossRef]
  22. Felipe, J.; Abdon, A.; Kumar, U. Tracking the middle-income trap: What is it, who is in it, and why? Levy Econ. Inst. Work. Pap. 2012, 715. [Google Scholar] [CrossRef]
  23. BP. BP Energy Outlook. 2023. Available online: https://www.bp.com.cn/zh_cn/china/home/news/reports.html (accessed on 21 May 2024).
  24. Andersson, F.N.; Karpestam, P. CO2 emissions and economic activity: Short-and long-run economic determinants of scale, energy intensity and carbon intensity. Energy Policy 2013, 61, 1285–1294. [Google Scholar] [CrossRef]
  25. Yu, X.; Chen, N.; Li, M. Study on the Characteristics of Carbon Emissions and Carbon Reduction Paths in Low-carbon Pilot Cities in China. Chin. J. Popul. Resour. Environ. 2020, 239, 1–9. [Google Scholar]
  26. Shen, L.; Liu, L.T.; Wang, L.M.; Chen, F.N.; Zhang, C.; Shen, M.; Zhong, S. 2050 energy consumption projection for China. J. Nat. Resour. 2015, 30, 361–373. [Google Scholar]
  27. Li, J.S.; Zhou, H.W.; Meng, J.; Yang, Q.; Chen, B.; Zhang, Y.Y. Carbon emissions and their drivers for a typical urban economy from multiple perspectives: A case analysis for Beijing city. Appl. Energy 2018, 226, 1076–1086. [Google Scholar] [CrossRef]
  28. Li, Z.; Sun, L.; Geng, Y.; Dong, H.; Ren, J.; Liu, Z.; Higano, Y. Examining industrial structure changes and corresponding carbon emission reduction effect by combining input-output analysis and social network analysis: A comparison study of China and Japan. J. Clean. Prod. 2017, 162, 61–70. [Google Scholar] [CrossRef]
  29. Riahi, K.; Grübler, A.; Nakicenovic, N. Scenarios of long-term socio-economic and environmental development under climate stabilization. Technol. Forecast. Soc. Chang. 2007, 74, 887–935. [Google Scholar] [CrossRef]
  30. Stöllinger, R. Structural change and global value chains in the EU. Empirica 2016, 43, 80. [Google Scholar] [CrossRef]
  31. Thelen, K. Transitions to the knowledge economy in Germany, Sweden, and the Netherlands. Comp. Politics 2019, 51, 295–315. [Google Scholar] [CrossRef]
Figure 1. Classification of carbon emission patterns in typical developed countries. HEC: high energy consumption; HE: high emissions; LEC: low energy consumption; LE: low emissions. The specific process is as follows: step one, calculate the emission intensity (I1) and per capita energy consumption (N1) of each sample country from 1970 to 2022; step two, calculate the mean emission intensity (I2) and mean per capita energy consumption (N2) of all sample countries from 1970 to 2022; step three, calculate the differences between the emission intensity and the mean value (I1–I2), and between the per capita energy consumption and the mean value (N1–N2) for each sample country; step four, with per capita energy consumption (N) as the horizontal axis and emission intensity (I) as the vertical axis, plot the energy-consumption situation (N1–N2) and emission situation (I1–I2) of sample countries (A), where different quadrants represent different emission patterns. (A) Results calculated using data from 1970 to 2022; (B) results calculated using data with per capita GDP of USD 20,000.
Sustainability 16 05318 g001
Figure 2. Trajectories of per capita carbon emissions vs. per capita GDP for four patterns.
Sustainability 16 05318 g002
Figure 3. Cumulative contribution of carbon emission driving factors from 1970 to 2022. IS: industrial structure; ES: economic scale; EI: emission intensity; EF: emission factor; CL: cleanliness level; TL: technological level; EL: economic level; PS: population size.
Sustainability 16 05318 g003
Figure 4. China’s per capita energy consumption and emission intensity scatter plot. Left: results calculated using data from 1970 to 2022; right: results calculated using data with per capita GDP of USD 20,000.
Sustainability 16 05318 g004
Figure 5. China and EKC trajectories of four typical models.
Sustainability 16 05318 g005
Figure 6. Contribution of different factors to China’s carbon emissions from 1975 to 2022.
Sustainability 16 05318 g006
Figure 7. Decomposition results of provincial carbon emission influencing factors in China.
Sustainability 16 05318 g007
Table 1. Statistical indicators of the four patterns.
PatternsPer Capita GDPEmission IntensityPer Capita EmissionsPer Capita Energy ConsumptionTotal Energy
Consumption
Emissions during the PeriodGDP
USD per CapitagCO2 per USDkg CO2 per CapitaMega Joules per CapitaTJ10,000 tBillion USD
Patterns 1Mean27,87569219,2993442512.02,870,835.941,465
Standard Deviation764231220171673238,75417,350
Maximum Value37,264135522,0643685833,231,32366,866
Minimum Value16,22642815,9633223992,555,20419,015
Median26,44476519,8913465382,849,51939,379
Patterns 2Mean20,17145090851621135.2757,770.016,823
Standard Deviation740414714403941169,2107177
Maximum Value29,51479810,798201178960,66226,287
Minimum Value8997359717710373512,0886419
Median20,4744599379175152800,77817,486
Patterns 3Mean10,66935938316848.346,660.71299
Standard Deviation371743102923418,134618
Maximum Value15,3984534844911369,1702198
Minimum Value5771315241536324,846548
Median10,143376399071949,0731246
Patterns 4Mean19,3123536813219775.6234,592.56649
Standard Deviation40371851606361637,2381883
Maximum Value23,979750959726092300,8369185
Minimum Value12,803203487515247186,7283925
Median19,178348665722582227,8666567
Table 2. Unit root test results for the sample data.
VariablesLLCIPSADFPPConclusion
lnCO20.1301−2.28691.048001.3788Non-stationary
△lnCO2−2.3729 ***−4.77897 ***36.1409 ***120.6100 ***Stationary
lnp−0.36411.671992.58191.9593Non-stationary
△lnp−0.7252 ***−6.7739 ***55.5336 ***97.5246 ***Stationary
lnp20.15041.53663.93912.4196Non-stationary
△lnp2−5.4981 ***−5.6982 ***45.0200 ***97.3671 ***Stationary
lnp30.66021.48145.15972.9671Non-stationary
△lnp3−5.7177 ***−5.6932 ***44.9062 ***95.0029 ***Stationary
Note: *** represent significance at the 1% level.
Table 3. Regression results of carbon emissions for four patterns.
VariablesPatterns 1Patterns 2Patterns 3Patterns 4
Quadratic EquationCubic EquationQuadratic EquationCubic EquationQuadratic EquationCubic EquationQuadratic EquationCubic Equation
lnpg3/−0.0399 ***/−0.0202 ***/−0.0404 ***/−0.0863 ***
/(−3.9639)/(−10.8459)/(−3.5050)/(−5.7674)
lnpg2−0.4544 ***0.6659 **−0.1013 ***0.3329 ***−0.1820 ***0.8734 ***−0.8713 ***1.4811 ***
(−9.0843)(2.3263)(−5.7177)(8.0239)(−5.0989)(2.8833)(−12.7677)(3.5973)
lnpg9.0901 ***−1.33942.6193 ***−0.23284.1508 ***−5.0023 **16.4406 ***−4.8712
(9.1836)(−0.4819)(8.1666)(−0.7129)(6.5716)(−1.8693)(12.7753)(−1.2674)
Constant term−35.5438 ***−3.3120−6.8489 ***−1.5179−14.5704 ***11.7983−68.5384 ***−4.3127
(−7.2710)(−0.3577)(−4.7728)(−1.5234)(−5.2311)(1.4836)(−11.3217)(−0.3536)
F-value54.796049.7904936.68461750.7391512.9781182.647081.626391.7097
R-squared0.62050.69350.96540.98750.97830.981730.70900.8065
ShapeInverted U-shapedInverted N-shapedInverted U-shapedInverted N-shapedInverted U-shapedInverted N-shapedInverted U-shapedInverted N-shaped
Per capita GDP at emission peak (USD per person) 22,036.221,832.7389,808.139,245.189,476.134,774.112,504.712,576.2
Per capita emissions at emission peak (kg CO2 per person) 20,109.320,415.622,266.810,474.68894.56390.88190.78308
Note: **, *** represent significance at the 5% and 1% levels, respectively.
Table 4. Carbon emission intensity and other indicators for different carbon emission patterns.
PatternPer Capita GDPPer Capita Carbon EmissionsEmission IntensityEnergy Intensity
Maximum ValueMinimum ValueCurrent ValueMaximum ValueMinimum ValueCurrent Value
USD/PersonkgCO2/Persong CO2/USDg CO2/USDg CO2/USDkJ/USDkJ/USDkJ/USD
Patterns 137,26422,064135542842820,96386508650
Patterns 229,51410,79879835935911,42262016201
Patterns 315,3984844453315315711659415941
Patterns 423,979959775020320313,39888998899
China13,7717908252357457427,63468766876
Disclaimer/Publisher’s Note: The statements, opinions and data contained in all publications are solely those of the individual author(s) and contributor(s) and not of MDPI and/or the editor(s). MDPI and/or the editor(s) disclaim responsibility for any injury to people or property resulting from any ideas, methods, instructions or products referred to in the content.

