Article

Using BIM and LCA to Calculate the Life Cycle Carbon Emissions of Inpatient Building: A Case Study in China

China Academy of Building Research, Beijing 100013, China
*
Author to whom correspondence should be addressed.
Sustainability 2024, 16(13), 5341; https://doi.org/10.3390/su16135341
Submission received: 17 May 2024 / Revised: 13 June 2024 / Accepted: 16 June 2024 / Published: 23 June 2024

Abstract

:
Hospital buildings provide healthcare services at the costs of significant amounts of energy consumption and carbon emissions, further exacerbating the environmental load. Because of the limited research on the life cycle carbon emissions of Chinese hospitals, this study conducted a detailed carbon-accounting and comparative study. Firstly, BIM and LCA were used to quantify the carbon emissions of the inpatient building in each stage of the life cycle. Secondly, the differences in carbon emissions by stage were compared on the basis of 20 cases of public buildings. The results show that the whole-life carbon emissions of the inpatient building was 10,459.94 kgCO2/m2. The proportion of operational carbon emissions was 94.68%, with HVAC (52.57%), equipment (27.85%), and lighting (10.11%) being the main sources. Embodied carbon emissions accounted for 4.54%, and HRB400 steel and C30 concrete were the main sources of carbon emissions. Hospitals are second only to emporiums in terms of operational carbon intensity, being 1.71 and 1.41 times that of schools and office buildings, with inpatient buildings being 3 and 1.7 times that of medical complexes and outpatient buildings, respectively. The future sustainable development of hospital buildings should promote efficient building performance and good environmental quality, both in terms of energy efficiency and carbon reduction.

1. Introduction

The current situation is one in which the twin crises of the environment and public health are converging [1]. Global warming is having a significant impact on ecosystems and human health as global temperatures have risen by 0.8 °C over the last century, a result of accelerated industry and population growth [2]. The building sector accounts for 30% of global end-use energy consumption and 28% of carbon emissions [3]. As the core of the public healthcare system, hospitals have complex functions, a high density of power-consuming equipment, and they operate year-round, requiring the consumption of large amounts of operational energy and generating considerable carbon emissions [4,5,6]. Healthcare-related carbon emissions are equal to around 200 million tons globally, accounting for 4.4% of total global carbon emissions [7]. Hospitals in Europe account for 7% of nonresidential buildings and 10% of the total energy consumption in the sector [8]. In the United States, hospitals have one of the highest energy intensities of any commercial building [9], with twice the energy intensity per square foot of an office building [10]. In China, hospital buildings have three to four times the energy consumption and two to three times the carbon emissions of the average public building [11]. Buildings that provide healthcare services that require massive energy consumption and carbon emissions will further exacerbate environmental loads in the future [6,12].
At the United Nations Climate Change Conference COP26, in Glasgow, in November 2021, 36 countries committed to developing low-carbon health systems, with a further 14 countries committing to a target of near-zero carbon health services by 2050 [13]. China has pledged to stop increasing its carbon emissions by around 2030, as the largest carbon emitter [14]. To achieve this goal, it is important to further assess the impact of carbon emitted by existing hospitals and promote the development of low-carbon healthcare buildings while ensuring their safe operation [15]. Since the 1990s, Peuportier [16] has developed specialized frameworks for the life cycle assessment (LCA) of buildings, which are widely used to determine the environmental impacts of related products [17,18]. Many researchers have combined an LCA with building information modeling (BIM) to assess the life cycle carbon emissions of buildings; explore the current status of carbon emissions according to different regions, types, structures, construction processes, green technologies, etc.; and propose corresponding carbon reduction strategies [19].
Nematchoua [20] used Designbuilder and Pleiades LCA software to assess the life cycle carbon emissions of the Shanghai Centre Building in China and the World Trade Center in the United States. The carbon intensity of the Shanghai Centre Building (20.9 kgCO2/m2) was lower than that of the World Trade Center (21.5 kgCO2/m2), assuming that fossil fuels such as coal were no longer included in the buildings’ energy mixes. The embodied carbon of the World Trade Center was 50% of that of the Shanghai Centre, as all building materials contained 25% recycled content. Wang [21] analyzed the life cycle carbon emissions of the Yiku Building 3 in Nanhai, China, and the Pixel Building in Australia, which are the two highest-rated green buildings in the region, to show the relationship between green buildings and low greenhouse gas emissions, measure the reduction in carbon due to the use of various low-carbon technologies in buildings, and highlight the importance of applying LCA theory in assessing environmental impacts. Li [22] built an assessment model using Simapro software and compared the life cycle carbon emissions of homes, schools, hospitals, and offices in China, and the results showed that hospitals had the highest carbon emission intensity and schools the lowest. Zhang [23] discussed differences in the life cycle carbon emissions of typical residential and office buildings in China according to their different structures. It was shown that a reinforced concrete block masonry structure is a more environmentally friendly choice, reducing carbon emissions by 38~112 kgCO2/m2 compared to brick–concrete and concrete structures. Yang [24] found that the use of wood in the construction of buildings can achieve life cycle carbon reductions ranging from 14.7% to 51.8%, with an average carbon reduction of 32.7%. Zhou and Li [25,26] used BIM technology to assess the difference in the life cycle carbon footprints between prefabricated and conventional cast-in-place buildings, demonstrating the significant low-carbon benefits of prefabrication. Gustavsson [27] studied the life cycle energy consumption and carbon emissions of a wooden apartment building and found that combining it with a biomass energy system resulted in a carbon-negative building life cycle. Wu [28] used the building environmental load evaluation system (BELES) to compare the differences in the life cycle carbon emissions between green and nongreen buildings in China. By analyzing 26 residential and commercial buildings in cold regions and hot-summer and cold-winter regions, it was found that the green residential and commercial buildings achieved carbon reductions of 10% and 32%, respectively.
While China has conducted a large number of carbon emission studies on residential and office buildings in the past, there has been limited research on the life cycle carbon emissions of hospitals, which are specialized buildings that host the urban healthcare system. China’s healthcare industry is huge, with more than 80% of hospitals operating at capacity or even over capacity, and more than half of hospitals having planned or in-progress construction [29]. As hospitals expand their operations and improve the quality of their services, growths in energy consumption and carbon emissions are inevitable trends [11,30]. To clarify the differences in carbon emissions between hospitals and other types of public buildings at different stages of the whole life cycle, this study used BIM and LCA to quantify the whole-life carbon emissions of an inpatient building of a Chinese hospital for infectious diseases and to compare the whole life carbon emissions of 20 cases of different public buildings in China, including office buildings, schools, emporiums, factories, and hospitals. The methodology adopted will help to estimate hospital carbon emissions where partial data are lacking, provide data to support decision making for the optimization of low-carbon design, and also provide case references for the assessment of hospital carbon emissions.
The full text Is structured as follows: Section 2 describes the inpatient building, the modeling process, the carbon emissions calculations, and the methodology used in the stock case study. Section 3 shows the carbon emissions of the inpatient building at each stage of its life cycle. It also shows the carbon emissions of the stock cases. Section 4 discusses the differences between the inpatient building and the stock cases, the impact of the operating mode on carbon emissions, the choice of indicators to assess carbon emissions, and the limitations of this study. Finally, Section 5 presents the conclusions.

2. Materials and Methods

2.1. Life Cycle Assessment

Life cycle assessment (LCA) is a methodology for evaluating the resource and environmental impacts of a product during the stages of raw material extraction, processing, manufacturing, packaging, transport, consumption, recycling, and final disposal (i.e., the entire “cradle-to-grave” life cycle of the product) [31]. Since its introduction in 1990, it has been recognized as an important tool for assessing the environmental impact of products [32]. The application of LCA theory to construction can not only quantitatively assess the degree of the environmental impact of buildings but also guide the selection of schemes, materials, construction methods, and operational strategies at the design stage [33].
In this study, the life cycle carbon emissions boundary of the hospital was divided into the following three parts: embodied stage (stage 1), operational stage (stage 2), and demolition stage (stage 3) [34]. The embodied stage consists in the production of building materials, transport, and construction; the operational stage consists in operational energy consumption and carbon emissions due to maintenance and renewal; and the demolition stage consists in the energy consumption of the demolition machinery and waste transport.

2.2. Case Description

2.2.1. Case Introduction

This case is the inpatient building of an infectious disease hospital in China (Figure 1), which is equipped with the “normal-emergency conversion” function and can quickly respond to public health emergencies by switching its mode of operation. In “normal times”, the building will be used as a hospital for the prevention and treatment of respiratory infectious diseases, such as tuberculosis and hepatitis, and contact infectious diseases. In “emergency times”, it can be quickly converted into a treatment facility for outbreaks of virulent infectious diseases. To avoid cross-infection as much as possible, the layout is designed according to the local standard of “three zones and two passages” [35], which includes a clean zone (Zone 1), semi-contaminated zone (Zone 2), contaminated zone (Zone 3), and corridors for human and logistic flows. Detailed information on this case is shown in Table 1.

2.2.2. Simulation

Building energy modeling (BEM) is a powerful tool for assessing the energy performances of buildings [36]. This study employed the energy simulation software Designbuilder (V6.1.3.008) with the design documents for the model construction and energy simulation, as shown in Figure 2. Detailed building parameters, envelope characteristics, heating and cooling data, and thermal disturbance data of the building required for the simulation [37] are given in Table 2. The occupancy, heating, ventilation and air conditioning (HVAC), equipment, and lighting operating strategies for the model were set concerning the General code for energy efficiency and renewable energy application in buildings GB55015-2021 [38], Design standard for energy efficiency of public buildings GB 50189-2015 [39], and Technical Guidelines for the Construction of Negative Pressure Wards in Emergency Treatment Facilities for COVID-19 (Trial) [40]. Furthermore, this model partition sets the number of air changes per hour (ac/h).

2.3. Detailed Calculation Methodology

This study mainly adopted a combination of the inventory analysis method and the emission factor method to assess carbon emissions. As a carbon emission calculation method recommended by the IPCC, the basic principle of the emission factor method is “carbon emission = activity data × emission factor” [34], which has been widely adopted because it can comprehensively measure the greenhouse gas emissions of buildings, and the inventory analysis method was developed on the basis of this method. However, the inventory analysis method takes the process analysis as a starting point, calculates the carbon emissions of each process of the building in detail, and finally accumulates the carbon emissions of the whole life cycle, which facilitates the analysis of specific stages.

2.3.1. Total Carbon Emissions

The carbon emissions generated over the whole life cycle of a building are made up of embodied carbon emissions, operational carbon emissions and demolition carbon emissions, as shown in Equation (1).
C l c a = C 1 + C 2 + C 3
where C l c a are the life cycle carbon emissions (kgCO2); C 1 are the embodied carbon emissions (kgCO2); C 2 are the operational carbon emissions (kgCO2); and C 3 are the demolition carbon emissions (kgCO2).

2.3.2. Stage 1

The embodied carbon emissions consist of the following three components: production of building materials, transport, and construction. This study used the inventory analysis method of calculation, as detailed in Equation (2).
C 1 = C P + C T + C C
where C P is the carbon emissions from the production of building materials (kgCO2); C T is the carbon emissions from the transportation of building materials (kgCO2); and C C is the carbon emissions during construction (kgCO2).
Carbon emissions from the production of building materials are the carbon emissions generated during the production and processing of a building’s main structural materials, envelope materials and other components, etc., as shown in Equation (3).
C P = i = 1 n ( M i × E F i )
where M i is the consumption of the i -th building material used in the project (unit), and E F i is the carbon emission factor for the production of the i -th building material (kgCO2/unit).
Related studies have shown that according to the Pareto principle or 80/20 rule, only the highest categories of building materials can be calculated to estimate the carbon emissions of all building materials [19,41]. This study collected consumption data on six major building materials, including concrete, cement, steel, brick, wood, and other materials, based on the building list, and the carbon emission factors of the building materials are mainly from the relevant standard [42], as shown in Table 3.
Carbon emissions from the transport of building materials are generated during the transport of building materials to the construction site, as shown in Equation (4).
C T = i = 1 n ( M i × T i × E F t )
where T i is the distance of the i-th building material from the production site to the construction site (km); E F t is the carbon emission factor for different modes of transport.
Transport vehicles typically include trucks, trains, and ships [18]. This case follows the principle of proximity, with the main materials, such as concrete, steel, sand, gravel, and cement, coming from Nanjing, and the rest of the building materials being procured in Jiangsu. Building material factories in Nanjing are usually located in the suburbs of Jiangning, Pukou, and Liuhe [43]. In this study, the procurement distance was 40 km in Nanjing and 400 km in Jiangsu; heavy-duty diesel trucks were chosen as the only means of transport, and the transport carbon emission factor was taken as 0.162 kgCO2/(t·km) [42].
Construction carbon emissions are mainly generated by the consumption of energy such as diesel, petrol, and electricity during the use of construction machinery, as shown in Equation (5).
C C = k = 1 n ( M m , k × B m , k × E F e , j )
where M m , k is the class consumption of the k-th mechanical equipment (unit); B m , k is the energy consumption quota of the k -th mechanical equipment; and E F e , j is the carbon emission factor of the j -th energy (kgCO2/unit).
As shown in Table 4, this study collected data on the consumption of 20 major types of machinery and equipment during the construction process. The energy consumption per unit shift of each piece of machinery and equipment refers to the relevant standards in China, and the main energy consumed is petrol, diesel, and electricity, and the carbon emission coefficients of energy are given in Table 5.

2.3.3. Stage 2

Operational carbon emissions consist in both operational energy consumption and maintenance, as shown in Equation (6).
C 2 = C E + C M
where C E are the carbon emissions caused by operational energy consumption (kgCO2); C M are the carbon emissions of maintenance (kgCO2).
The main types of energy consumed in the operation of the hospital are electricity, gas, and domestic water. In this study, Designbuilder software was used to assess the building’s energy consumption for heating, cooling, lighting, and equipment; Equation (7) was used to calculate the carbon emissions due to electricity and gas consumption; and the carbon emissions due to domestic water consumption were estimated with reference to Equation (8) [46]. The energy carbon emission factors required for the above calculations are shown in Table 5.
C E = Q C C O P c + Q H φ η 1 q 1 q 2 + S E l + E e E F e A + C W
C W = D × S × A × E F w
where Q C is the cumulative annual cooling consumption (kWh); C O P c is the coefficient of performance for cooling systems in public buildings, taken as 3.5; Q H is the cumulative annual heat consumption (kWh); η 1 is the combined efficiency of the heating system, where the heat source is a gas-fired boiler, taken as 0.85; q 1 is the standard calorific value of natural gas, taken as 9.87 kWh/m3; q 2 is the combined coal consumption for power generation, taken as 0.33 kgce/kWh; φ is the conversion factor between natural gas and standard coal, taken as 1.21 kgce/m3; S is the area of the building (m2); E l is the annual lighting energy consumption (kWh/m2); E e is the annual equipment energy consumption (kWh/m2); E F e , j is the electricity carbon emission factor (kgCO2/kWh); A is the design life of the building, taken as 50 years; C W are the carbon emissions caused by domestic water (kgCO2); D is the daily consumption, taken as 2 t/m2; and E F w is the carbon emission factor of water (kgCO2/t).
Maintenance carbon emissions are those from the renewal and maintenance of equipment and components, which can be quickly estimated by multiplying the embodied carbon emissions by a maintenance factor [46], referring to Equations (9) and (10).
C M = M × C 1
M = 1 % × n 1 + 20 % × n 2 + 25 % × n 3
where M is the maintenance coefficient, taken as 0.65 [46]; n 1 , n 2 , and n 3 are the number of minor, intermediate, and major repairs, respectively.

2.3.4. Stage 3

Demolition carbon emissions include carbon emissions from demolition and waste disposal. As this is a new building and data on demolition are not available, a quick assessment was made using the empirical formula proposed in a related study [46], as shown in Equation (11).
C 3 = S ( 2.88 X + 19.37 )
where X is the number of floors above ground.

2.4. Stock Cases

This study collected data on carbon emissions from public buildings in China by researching related studies. The research included the basic design factors of buildings (such as geographical location, climatic environment, building scale, and structure) and carbon emissions data (such as total carbon emissions, carbon emissions and percentages at each stage, and types of accounting data at each stage). Considering that different scholars have drawn different carbon emissions boundaries for the accounting process, this will lead to difficulties in conducting comparative studies [47]. Therefore, in this study, the life cycle boundary of each stock case was uniformly divided into the embodied stage, operational stage, and demolition stage according to the content described in Section 2.1.

2.5. Evaluation Indices for Carbon Emissions

This study chose to use carbon emissions per unit area, C A , to make a side-by-side comparison of the carbon emissions at each stage of the life cycle of different buildings, as shown in Equation (12).
C A = C l S
where C A are the carbon emissions per unit area (kgCO2/m2), and C l are the carbon emissions in stage l (kgCO2).

3. Results

3.1. Embodied Carbon Emissions

3.1.1. Building Materials Production

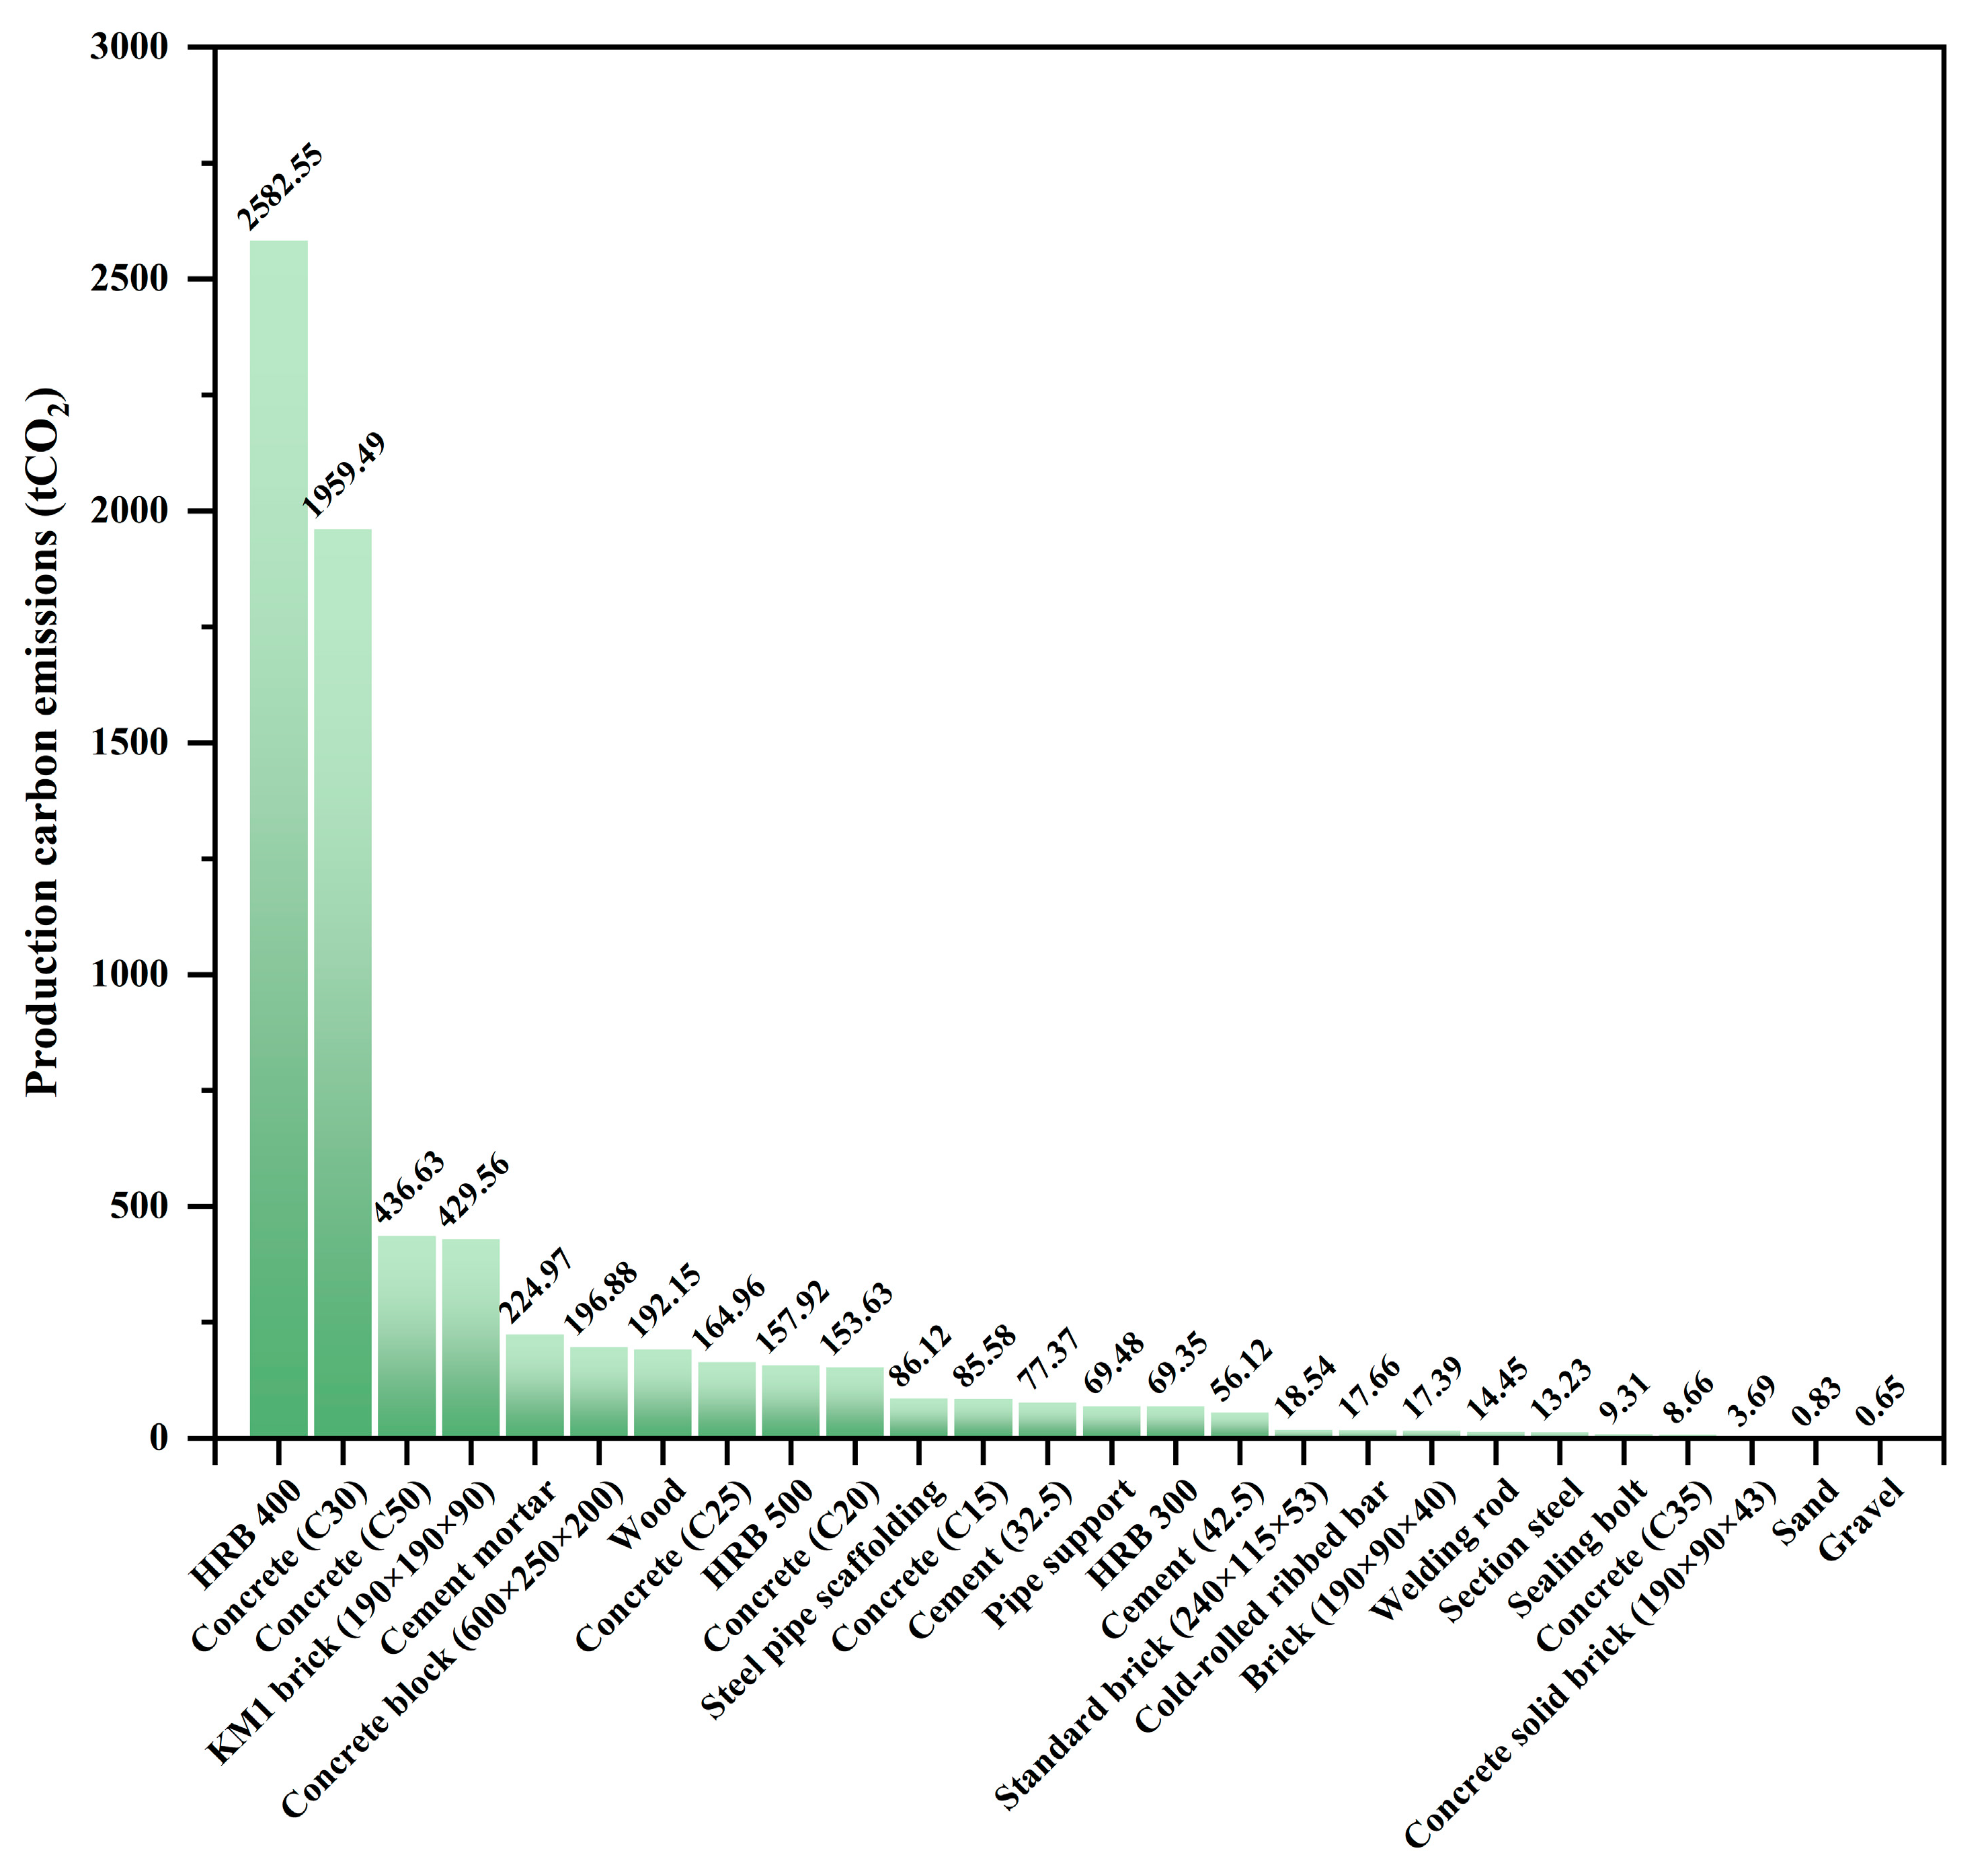
As shown in Figure 3, the total carbon emissions from the production of building materials in the inpatient building were 7050.28 tCO2, and the carbon emissions per unit area were 449.65 kgCO2/m2. Only carbon emissions from the production of steel and concrete accounted for 82.38% of carbon emissions, and the carbon emissions and consumption for steel and concrete were analyzed in detail, as follows:
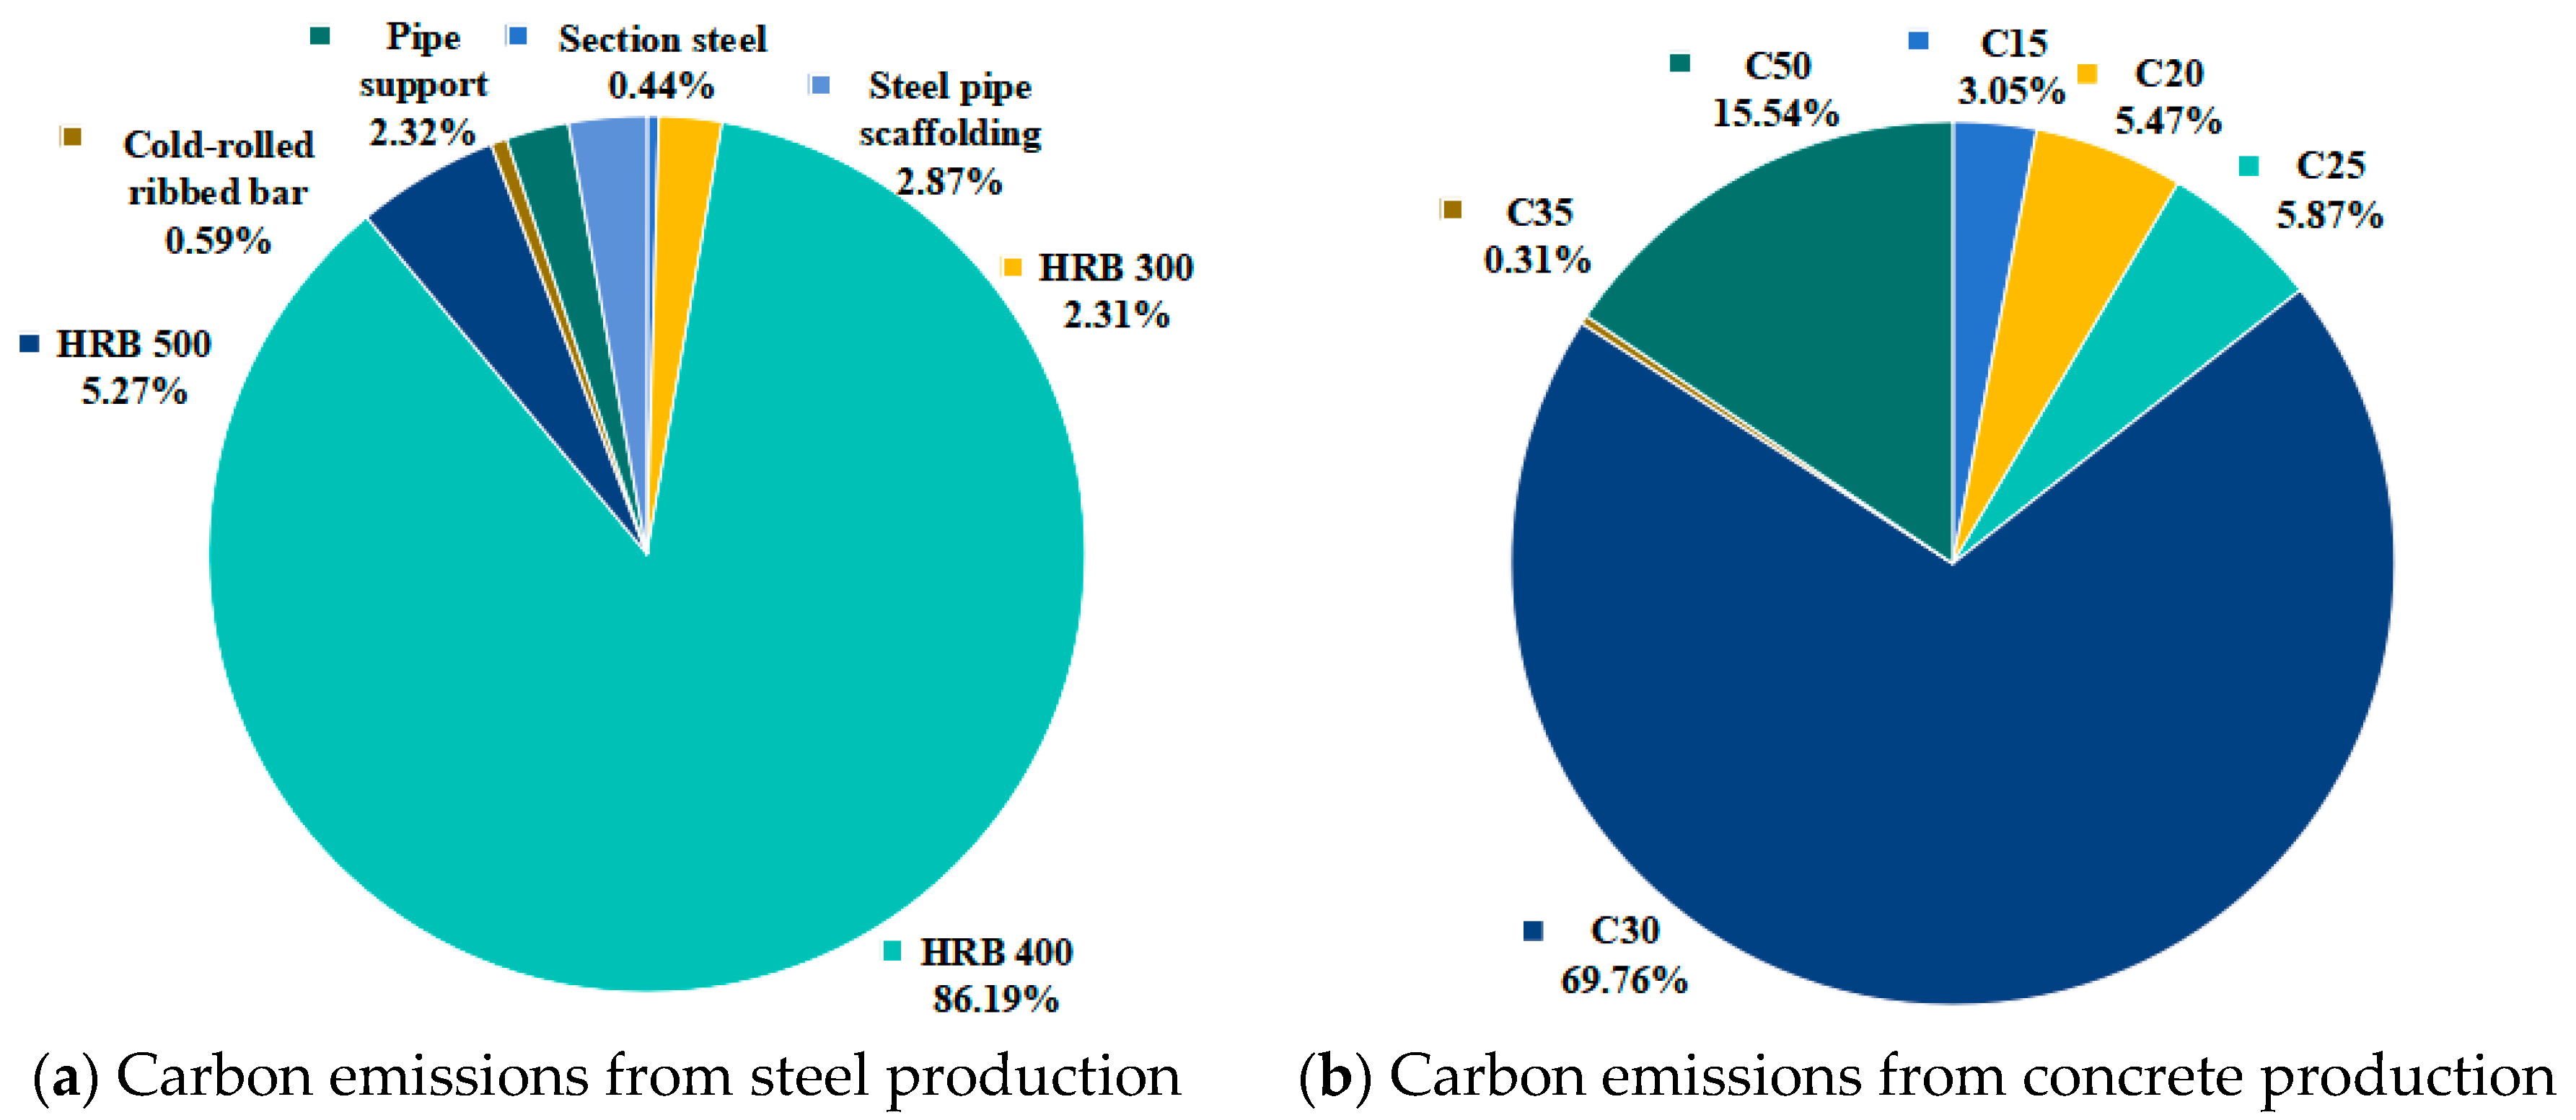
  • The carbon emissions from the production of all steel materials were 2996.31 tCO2, accounting for 42.52%. Among them, the carbon emissions of HRB400 steel were 2582.55 tCO2, as shown in Figure 4a.
  • The carbon emissions from the production of all concrete amounted to 2808.95 tCO2, accounting for 39.86%. The carbon emissions of C30 concrete and C50 concrete were 2396.12 tCO2, which were the two largest concrete materials (85.32% of all concrete) in terms of carbon emissions, as shown in Figure 4b.
  • The two most carbon-intensive building materials were HRB400 steel and C30 concrete, accounting for 64.42% of the carbon emissions from the production of building materials.
  • As shown in Table 6, the consumptions of concrete and steel, in this study, were 0.497 m3/m2 and 68.39 kgCO2/m2, respectively, which is in line with the statistical values for concrete (0.3~0.5 m3/m2) and steel (40~70 kg/m2) consumption for Chinese buildings [46].
Figure 3. Carbon emissions from production of major building materials.
Sustainability 16 05341 g003

3.1.2. Transport

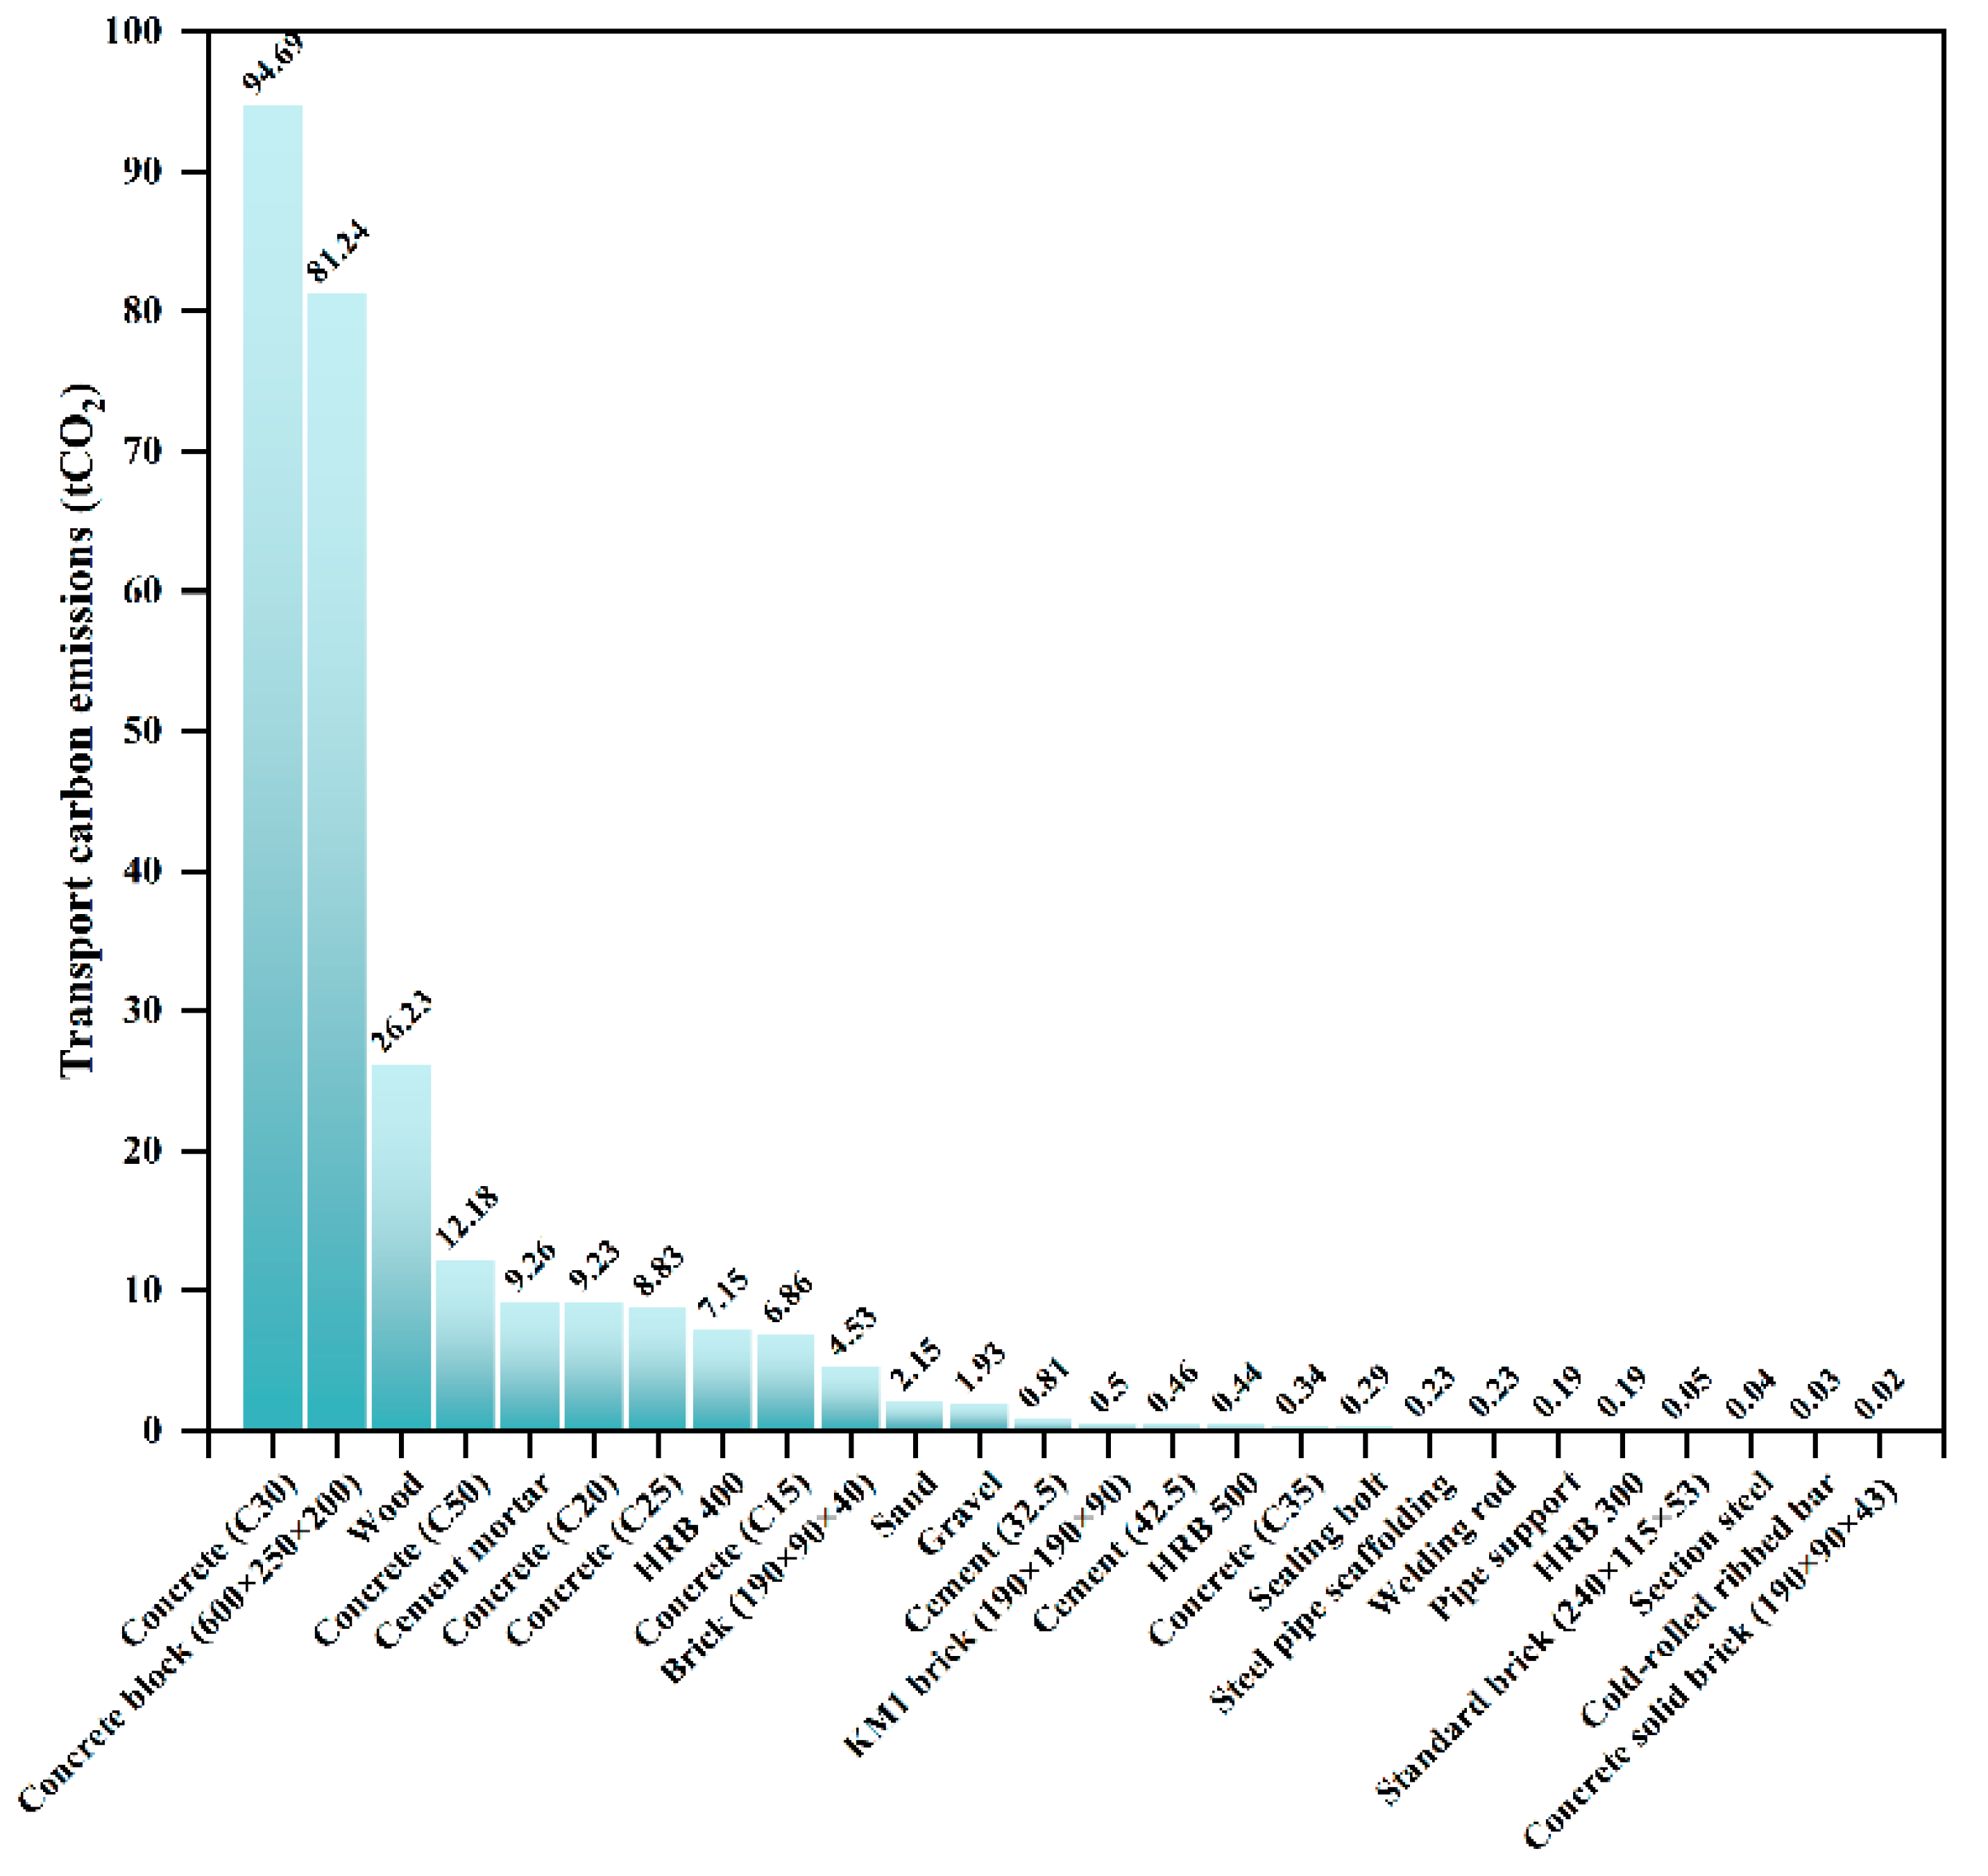
As shown in Figure 5, the total carbon emissions from the transport of building materials were 269.45 tCO2, with a carbon emission per unit area of 17.18 kgCO2/m2. Among these, C30 concrete and concrete blocks (600 × 250 × 200) were the two types of building materials that emitted the most carbon during transport, generating 94.69 tCO2 and 81.24 tCO2 of the carbon emissions from transport, respectively, with a combined percentage of 65.29%.

3.1.3. Construction

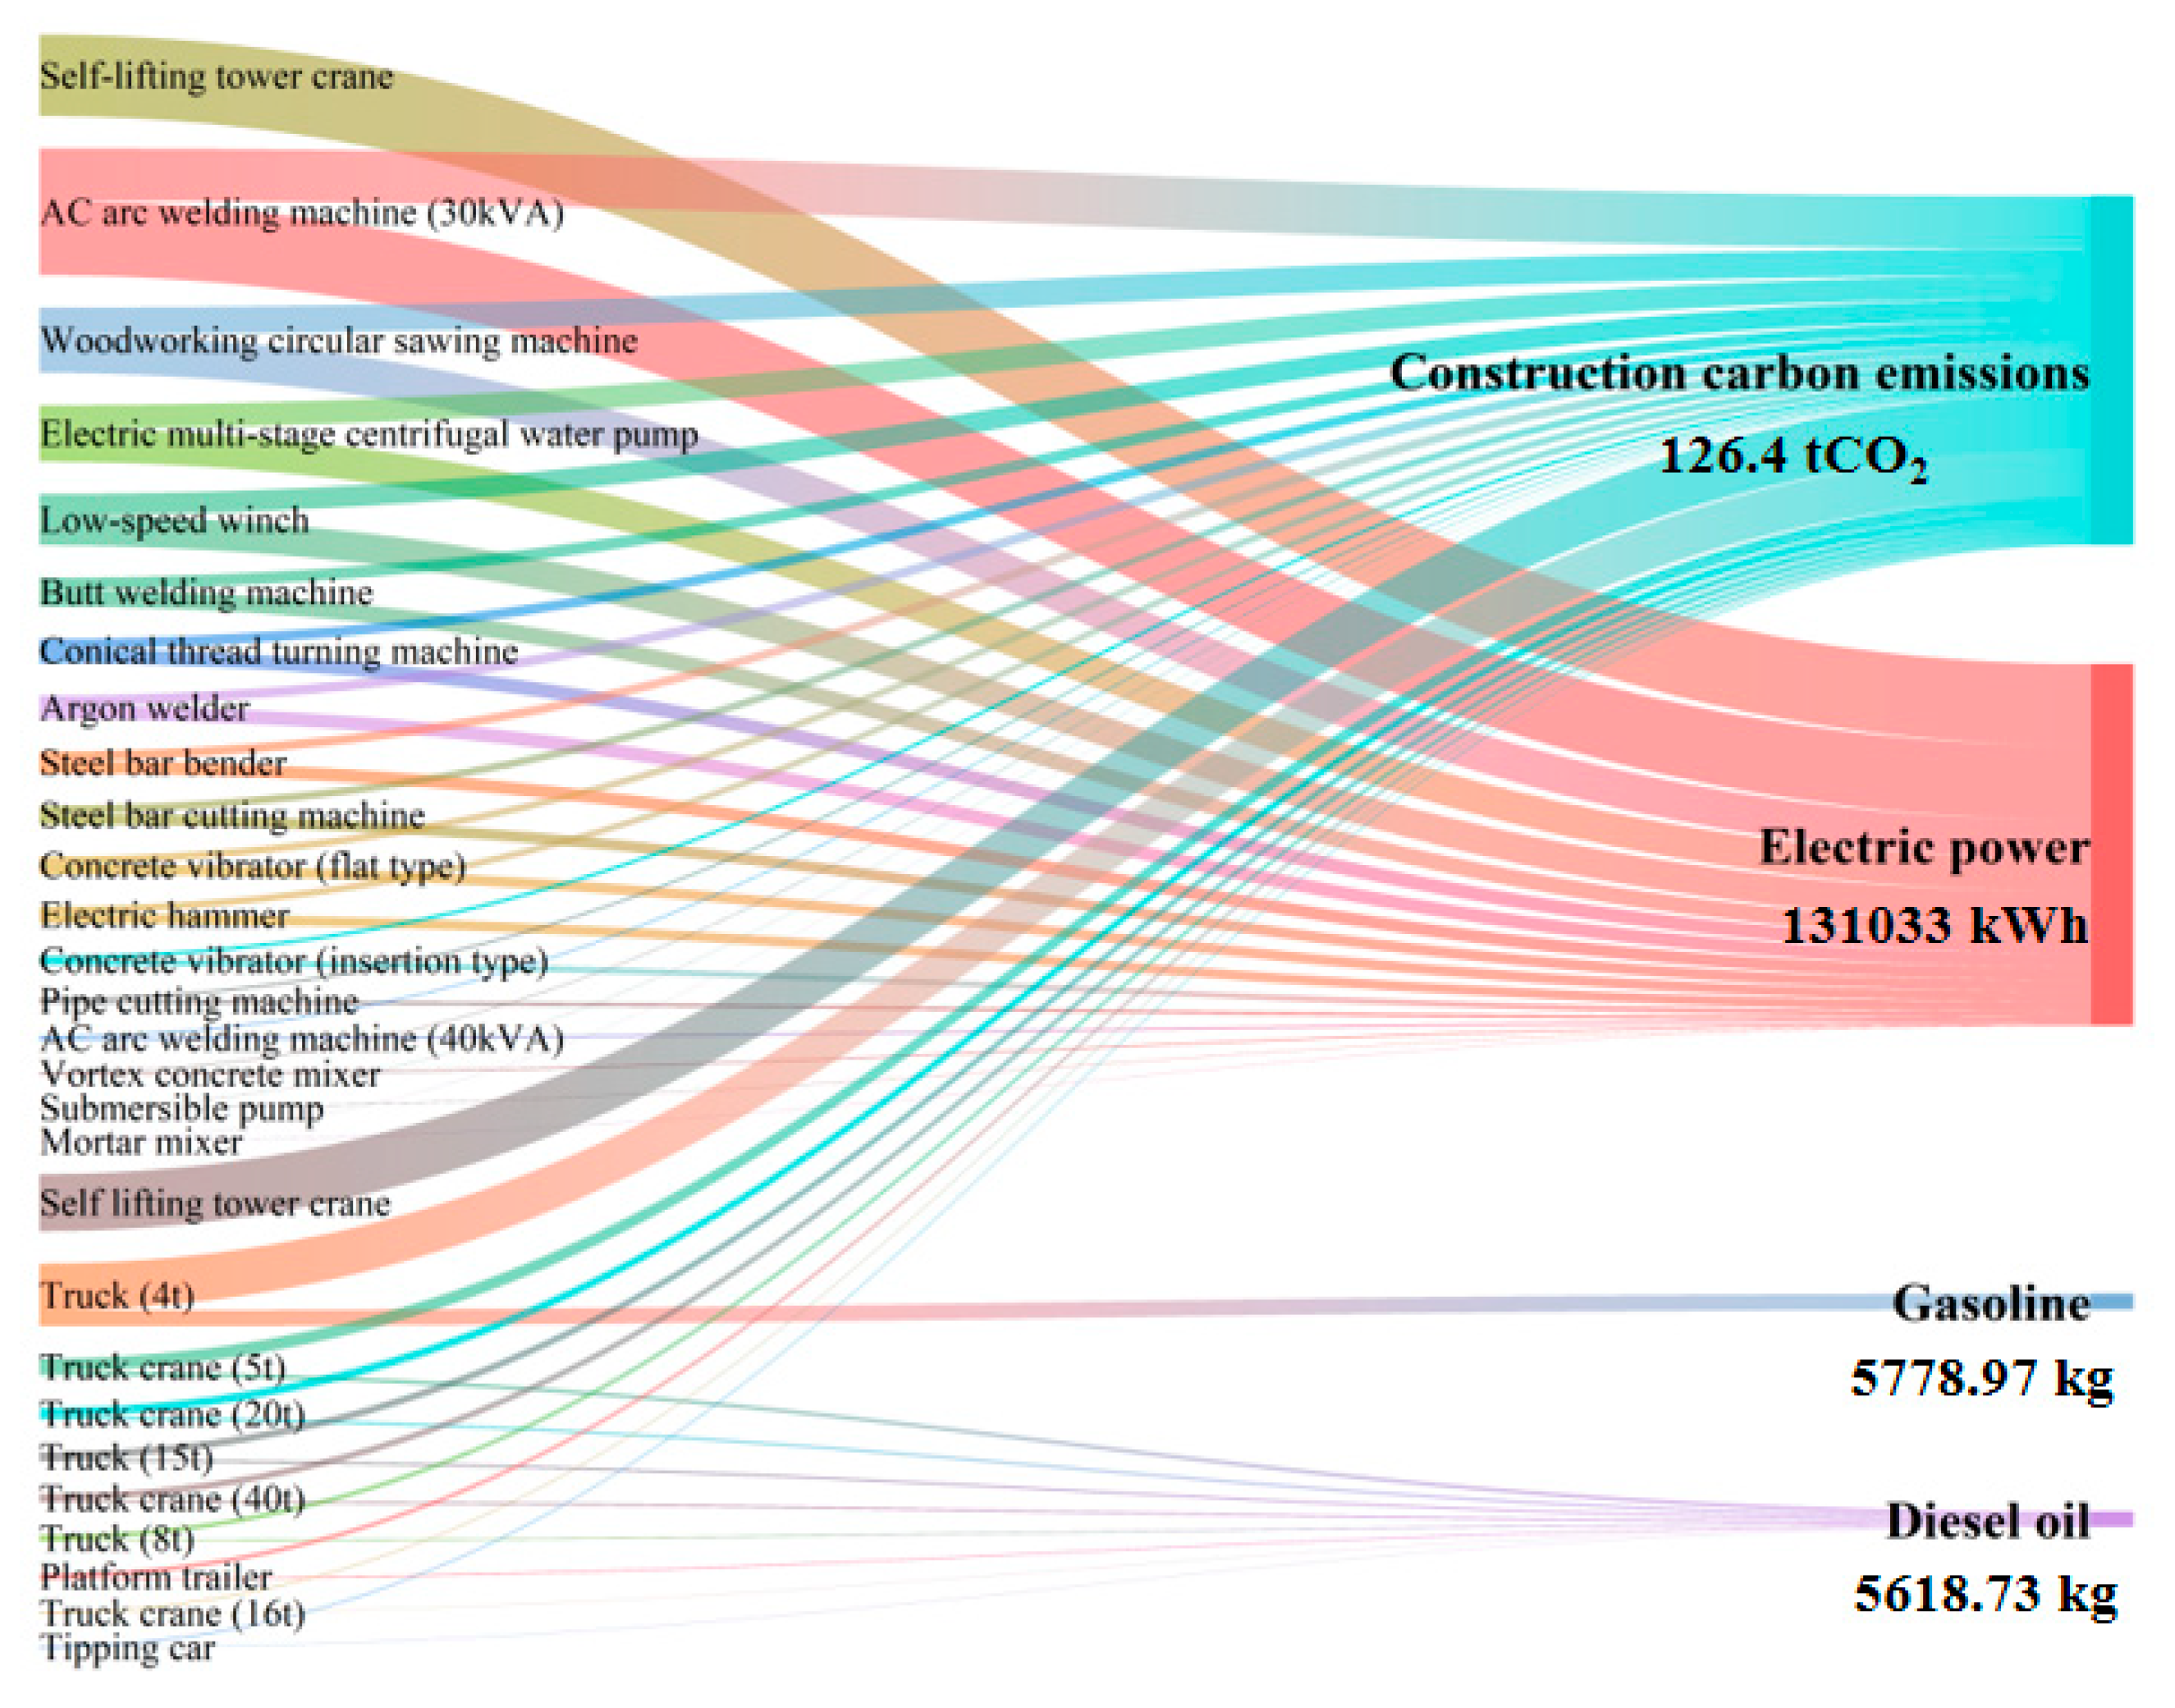
As shown in Figure 6, the total carbon emissions from the construction phase were 126.4 tCO2 and 8.06 kgCO2/m2 per unit area. The three pieces of mechanical equipment with the largest share were the self-lifting tower crane, the AC arc welding machine (30 kVA), and the truck (4 t), accounting for 16.4%, 15%, and 13.4%, respectively. In addition, electricity, gasoline, and diesel were the main sources of carbon emissions during the construction phase, and the project consumed a cumulative total of 131,033 kWh of electricity, 5778.97 kg of gasoline, and 5618.73 kg of diesel during construction. Electricity generated 92.05 tCO2 of the carbon emissions, accounting for 73% of the total. Gasoline and diesel produced 16.93 tCO2 and 17.42 tCO2, respectively.

3.2. Operational Carbon Emissions

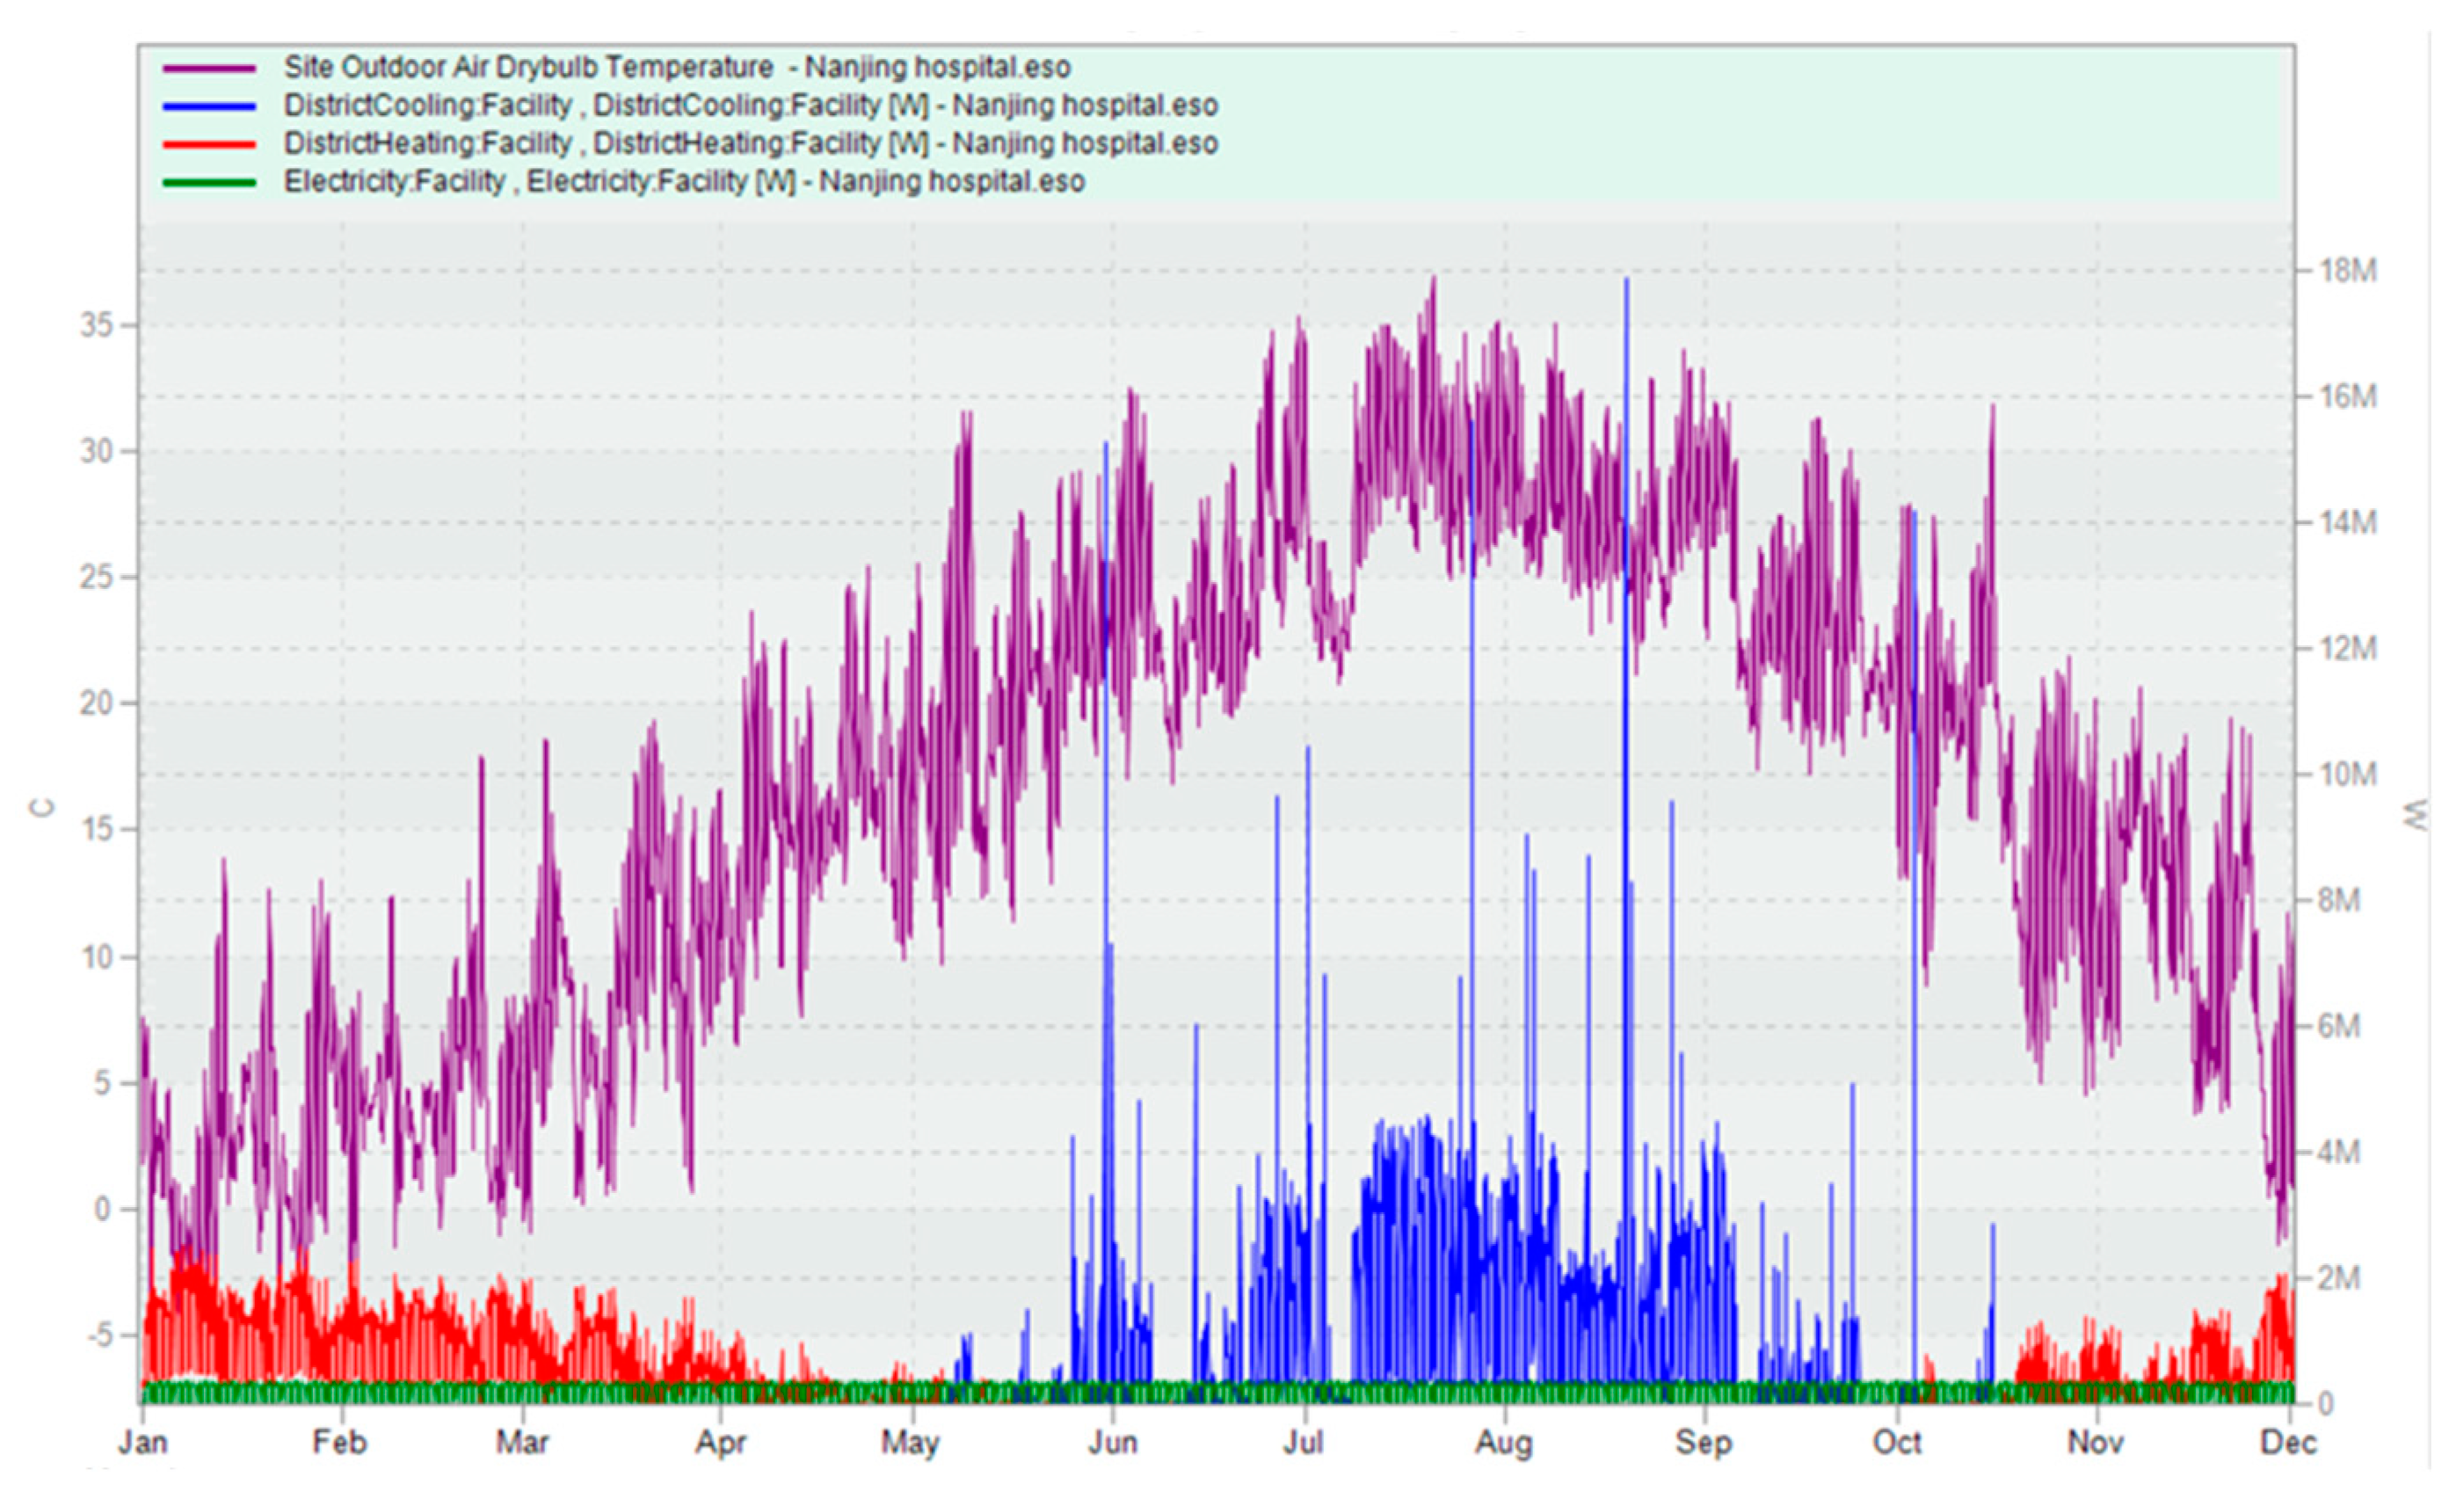
The simulation results are shown in Figure 7. The energy intensity of the hospital is 270.52 kWh/m2, of which 66.96 kWh/m2 is for cooling, 90.12 kWh/m2 is for heating, 30.22 kWh/m2 is for lighting, and 83.22 kWh/m2 is for other equipment. The total carbon emissions due to energy consumption are 148,715.32 tCO2, and the carbon emissions per unit area are 9485 kgCO2/m2. Among them, the carbon emission intensity of heating is 3154.2 kgCO2/m2, accounting for 33.25%; the carbon emission intensity of cooling is 2343.6 kgCO2/m2, accounting for 24.71%; the carbon emission intensity of lighting is 1057.7 kgCO2/m2, accounting for 11.15%; and the carbon emission intensity of other equipment is 2912.7 kgCO2/m2, accounting for 30.71%. The carbon emission intensity of other equipment is 2912.7 kgCO2/m2, accounting for 30.71%; the carbon emission intensity of domestic water is 16.8 kgCO2/m2, accounting for 0.18%.
In addition, carbon emissions of approximately 4839.98 tCO2 were generated by the maintenance and renewal of the inpatient building.

3.3. Demolition Carbon Emissions

On the basis of Equation (11), the carbon emissions from the demolition of the inpatient building were 629.9 tCO2 and 40.17 kgCO2/m2 per unit area.

3.4. Life Cycle Carbon Emissions

As shown in Table 7, the inpatient building generates a total of 164,001.34 tCO2 carbon emissions over 50 years, with a carbon emissions per unit area of 10,459.94 kgCO2/m2. The embodied stage accounts for 4.54% of the carbon emissions, the demolition stage for only 0.38%, and the operational stage for 95.08%, which is significantly higher than the other stages, with a carbon emissions per unit area of 9944.85 kgCO2/m2. Heating, equipment, and cooling were the largest contributors to carbon emissions, accounting for 30.16%, 27.85%, and 22.41%, respectively.

3.5. Comparison of Stock Cases

This study compiled 20 cases of public buildings in China, as shown in Table 8. In terms of the building types, 10 cases of office buildings (C1–C10), 5 cases of schools (C11–C15), 2 cases of emporiums (C16–C17), 1 case of factories (C18), and 2 cases of hospitals (C19–C20) were included. In terms of location distribution, two cases in a severe cold zone (I), three cases in a cold zone (II), eight cases in a hot-summer and cold-winter zone (III), and six cases in a hot-summer and warm-winter zone (IV) were included. In terms of the calculation methods, six cases in stage 1 applied Revit and SimaPro to consider the detailed consumption related to building materials; seven cases applied the complete list actually obtained; and seven cases only assessed the consumption of major building materials. The carbon emissions assessment in stage 2 mainly adopted four methods, namely, software simulation (11 cases), monitoring and measurement (5 cases), statistical averaging (3 cases), and predictive modeling (1 case) method. Among them, software simulation is widely used as a reliable method to assess energy consumption, and common software includes DeST-c, IBE, E-Quest, Energyplus, Designbuilder, and Green Building Studio (GBS). Because of the difficulty in obtaining data and the small proportion of carbon emissions in stage 3, estimation methods tend to be used for rapid assessment.
As shown in Figure 8, the average carbon emissions of the stock cases were counted by building type. In terms of the total life cycle carbon emissions, from lowest to highest, the order is factory (2913.69 kgCO2/m2), school (3103.67 kgCO2/m2), office (3669.39 kgCO2/m2), hospital (4842.76 kgCO2/m2), and emporium (5133.75 kgCO2/m2). The operational stage is the key to making a difference, and the order, from lowest to highest, is school (2345.74 kgCO2/m2), factory (2665.26 kgCO2/m2), office (2844.19 kgCO2/m2), hospital (4004.2 kgCO2/m2), and emporium (4603.54 kgCO2/m2). The operational carbon intensity of hospitals is second only to emporiums and 1.71 times that of schools and 1.41 times that of office buildings.

4. Discussion

4.1. Comparison of Inpatient Building and Stock Cases

As shown in Table 9, the embodied and demolition stages of each building type contribute a relatively minor proportion of the carbon emissions, with the operational stage representing the largest contributor. This is directly related to the 50-year operational cycle. Office buildings and schools account for a relatively small proportion of the operational carbon emissions compared to emporiums and hospitals (78% and 76%, respectively), and embodied carbon is 22% in both cases. Emporiums and hospitals generate a large amount of operational carbon emissions, 90% and 83%, respectively, due to the significant increase in building energy consumption over long periods of operation, while the share of embodied carbon emissions is only 10%. Demolition of all types of buildings accounted for less than 2% of carbon emissions. Life cycle carbon emissions in this study were 2.03~3.33 times higher than for other buildings, with operational carbon emissions 3.5 times higher than office buildings and 2.48 times higher than hospitals. The primary reason for the discrepancy is that the indoor temperatures of inpatient buildings must be maintained within a specified range (20~26 °C) throughout the year. This is necessary to provide optimal comfort and ensure safety. The numbers of air changes in Zone 1, Zone 2, and Zone 3 were 3 ac/h, 6 ac/h, and 12 ac/h, respectively. This results in a considerable quantity of heating and cooling carbon emissions from ventilation and air changes compared to a conventional hospital building.
In addition, C19, C20, and this study researched the whole life cycle carbon emission intensity of the medical complex building, outpatient building, and inpatient building, respectively. The inpatient building had the highest carbon emissions due to long-term operation, and the medical complex had the lowest carbon emissions. The results demonstrate that despite their common classification as hospital buildings, the diverse utilization of these facilities gives rise to notable discrepancies in carbon emissions. Future research on hospital buildings should employ a clear analysis of the specific mode of operation.

4.2. Impact of Operating Modes on Carbon Emissions

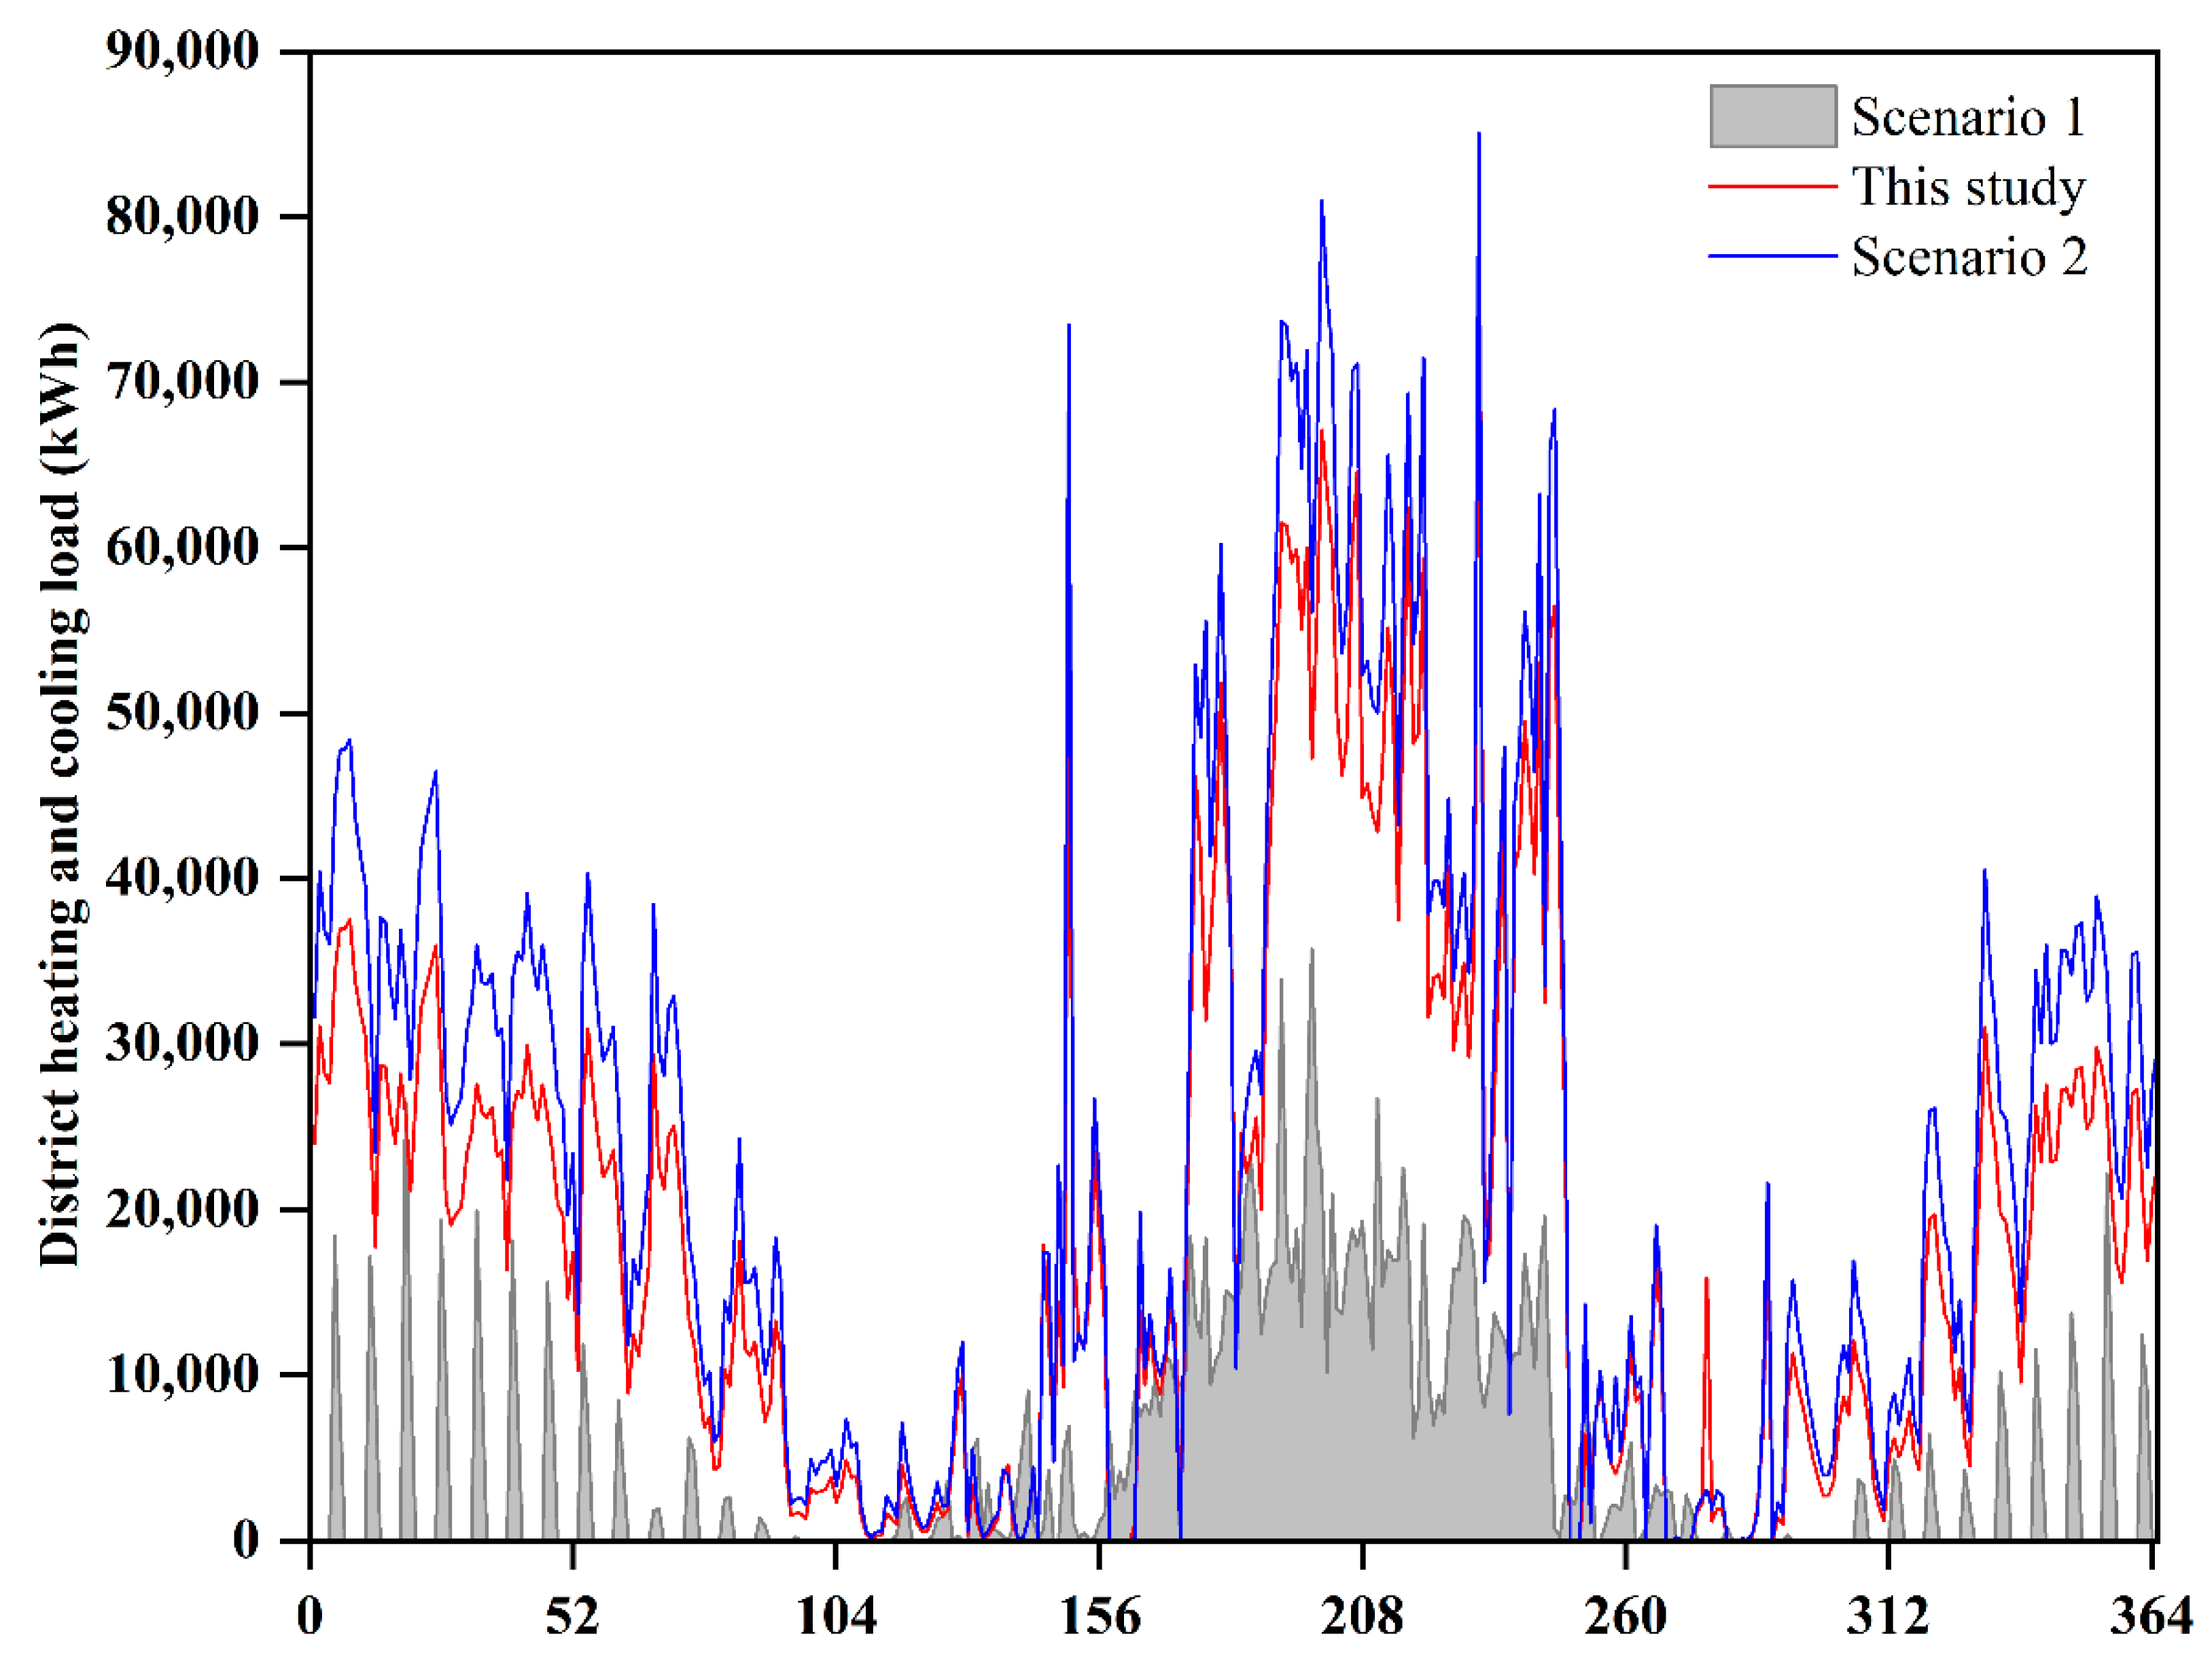
As shown in Figure 9, this section discusses the carbon emissions of inpatient buildings under different modes of operation. Scenario 1 is a standard operational mode of a hospital, in which the air changes in each of the three zones are set according to the relevant standards [63]. In this study, the “normal times” operational mode was adopted. Scenario 2 is the “emergency times” operational mode, and the number of air changes in each of the three zones is set according to the requirements issued by the Chinese government during the COVID-19 pandemic [40], as shown in Table 10. The results show that the operational carbon intensity and share in Scenario 1 are basically the same as those of the outpatient building in C20, which are 5725.89 kgCO2/m2 and 5748.39 kgCO2/m2, respectively, further verifying the reliability of the calculations. The operational energy consumption in this study is 1.8 times higher than in Scenario 1, and the carbon emissions are 1.74 times higher. The operational energy consumption in Scenario 2 is 2.08 times higher than in Scenario 1, and the carbon emissions are 2.72 times higher.

4.3. Limitation

This study has some limitations that can be further discussed in future studies. Firstly, although relevant studies have shown that the energy consumption of medical devices can account for up to 25% of the energy consumed during operation [64], this study did not consider the energy consumption and carbon emissions of medical devices. It is difficult to make a detailed assessment because of the limitations of the simulation software and the lack of monitoring data, as well as the wide variation in hospital types and operating methods. Secondly, most hospitals are accompanied by a large amount of renewal and maintenance of building components and equipment during their long-term operation. A detailed assessment was not carried out in this study because of data limitations. Finally, the impact of carbon trading in hospitals was not discussed in this study. Implementing sustainability in hospitals involves multiple stages and stakeholders, including decision making, implementation, and management [65].
With the promotion and popularization of energy consumption and carbon emissions data collection technologies in the future, more energy consumption and carbon emissions data for hospital buildings can be further obtained. Using this as a basis for exploring the carbon emission characteristics of buildings in different climate zones and countries will be of great significance in understanding the current situation, challenges, and trends in energy conservation and carbon reduction in hospital buildings in China.

5. Conclusions

This study assessed, in detail, the whole life cycle carbon emissions of an inpatient building in China using BIM and LCA and conducted a comparative study based on a collection of 20 cases from other public buildings in China. The following conclusions were obtained:
  • The carbon intensity of the inpatient building was 10,459.94 kgCO2/m2, of which 94.68% was operational carbon emissions, 4.54% was embodied carbon emissions, and only 0.38% was demolition carbon emissions. HVAC, equipment, and lighting were the largest contributors to carbon emissions, accounting for 52.57%, 27.85%, and 10.11%, respectively. HRB400 steel and C30 concrete were the two building materials with the largest carbon emissions.
  • By comparing the life cycle carbon emissions of office buildings, schools, emporiums, factories, and hospitals, the most significant differences were found in the operational stage. Regarding operational carbon intensity, hospitals were second only to emporiums, with 1.71 and 1.41 times the carbon intensity of schools and office buildings, respectively. The inpatient building was 3 and 1.7 times that of the medical complex and the outpatient building, respectively, and although all three were part of the hospital, the different operating modes resulted in significant differences in carbon emissions.
  • This study discussed the differences in energy consumption and carbon emissions of the inpatient building under the following three scenarios: standard operation (Scenario 1), “normal times” operation (this study), and “emergency times” operation (Scenario 2). The energy consumption and carbon emissions in Scenario 2 were 2.08 and 2.72 times greater than those in Scenario 1, and those in this study were 1.8 and 1.74 times greater than those in Scenario 1.
This study provides a calculation method and data reference for related scholars to assess the carbon emissions of hospital buildings in China. Hospitals generate a large amount of carbon emissions from HVAC, equipment, and lighting due to the use of 24/7 services to ensure patient comfort and health. Hospital operators should make more efforts in these three aspects by carrying out low-carbon renovations (improving thermal insulation, replacing smart lighting, etc.), adopting energy management contracts, and utilizing renewable energy sources. Future research will analyze the operational characteristics of hospitals in different regions of China, and study the green and low-carbon pathways applicable to different scenarios in hospitals.

Author Contributions

L.Z., conceptualization, investigation, visualization, formal analysis, and writing—original draft; C.G., methodology and writing—review and editing; L.C., funding acquisition and project administration; L.Q., resources and data curation; W.W., funding acquisition, supervision, validation, and writing—review and editing; Q.W., project administration. All authors have read and agreed to the published version of the manuscript.

Funding

This research was funded by the Research Fund of China, Academy of Building Research (20220111330730018), and Research and Demonstration of Low Carbon Emission Reduction Design Methods and Key Technologies for Hospitals and Biological Laboratory Buildings (Grant No. 20220106330730007).

Institutional Review Board Statement

Not applicable.

Informed Consent Statement

Not applicable.

Data Availability Statement

The original contributions presented in the study are included in the article, further inquiries can be directed to the corresponding author.

Acknowledgments

We thank Chao Guo for providing a detailed list of construction materials and equipment for this study, and Hongya Fan for providing the design drawings.

Conflicts of Interest

All authors were employed by the company China Academy of Building Research. The authors declare that the research was conducted in the absence of any commercial or financial relationships that could be construed as a potential conflict of interest.

References

  1. Alam, I.; Alam, G.; Ayub, S.; Siddiqui, A.A. Assessment of bio-medical waste management in different hospitals in Aligarh city. In Advances in Waste Management; Springer: Singapore, 2019; pp. 501–510. [Google Scholar] [CrossRef]
  2. Wild, M.; Ohmura, A.; Makowski, K. Impact of Global Dimming and Brightening on Global Warming. Geophys. Res. Lett. 2007, 34, 2006GL028031. [Google Scholar] [CrossRef]
  3. United Nations Environment Programme. Global Status Report for Buildings and Construction: Beyond Foundations: Mainstreaming Sustainable Solutions to Cut Emissions from the Buildings Sector; United Nations Environment Programme: Nairobi, Kenya, 2024. [Google Scholar] [CrossRef]
  4. Balali, A.; Valipour, A. Prioritization of Passive Measures for Energy Optimization Designing of Sustainable Hospitals and Health Centres. J. Build. Eng. 2021, 35, 101992. [Google Scholar] [CrossRef]
  5. Rahman, N.M.A. Optimizing the Energy Saving Potential of Public Hospital through a Systematic Approach for Green Building Certification in Malaysia. J. Build. Eng. 2021, 43, 103088. [Google Scholar] [CrossRef]
  6. Tarkar, P. Role of Green Hospitals in Sustainable Construction: Benefits, Rating Systems and Constraints. Mater. Today 2022, 60, 247–252. [Google Scholar] [CrossRef]
  7. Pichler, P.-P.; Jaccard, I.S.; Weisz, U.; Weisz, H. International Comparison of Health Care Carbon Footprints. Environ. Res. Lett. 2019, 14, 064004. [Google Scholar] [CrossRef]
  8. Dobosi, I.S.; Tanasa, C.; Kaba, N.-E.; Retezan, A.; Mihaila, D. Building Energy Modelling for the Energy Performance Analysis of a Hospital Building in Various Locations. E3S Web Conf. 2019, 111, 06073. [Google Scholar] [CrossRef]
  9. Eckelman, M.J.; Sherman, J. Environmental Impacts of the U.S. Health Care System and Effects on Public Health. PLoS ONE 2016, 11, e0157014. [Google Scholar] [CrossRef] [PubMed]
  10. Kaiser, B.; Eagan, P.D.; Shaner, H. Solutions to Health Care Waste: Life-Cycle Thinking and “Green” Purchasing. Environ. Health Perspect. 2001, 109, 205–207. [Google Scholar] [CrossRef]
  11. Wu, R. The Carbon Footprint of the Chinese Health-Care System: An Environmentally Extended Input–Output and Structural Path Analysis Study. Lancet Planet. Health 2019, 3, e413–e419. [Google Scholar] [CrossRef]
  12. Nematchoua, M.K.; Yvon, A.; Kalameu, O.; Asadi, S.; Choudhary, R.; Reiter, S. Impact of Climate Change on Demands for Heating and Cooling Energy in Hospitals: An in-Depth Case Study of Six Islands Located in the Indian Ocean Region. Sustain. Cities Soc. 2019, 44, 629–645. [Google Scholar] [CrossRef]
  13. Wise, J. COP26: Fifty Countries Commit to Climate Resilient and Low Carbon Health Systems. BMJ 2021, 375, n2734. [Google Scholar] [CrossRef] [PubMed]
  14. Hu, S.; Zhang, Y.; Yang, Z.Y.; Yan, D.; Jiang, Y. Challenges and Opportunities for Carbon Neutrality in China’s building Sector-Modelling and Data. Build. Simul. 2022, 3, 141–155. [Google Scholar] [CrossRef]
  15. McAlister, S.; Morton, R.L.; Barratt, A. Incorporating Carbon into Health Care: Adding Carbon Emissions to Health Technology Assessments. Lancet Planet. Health 2022, 6, e993–e999. [Google Scholar] [CrossRef] [PubMed]
  16. Pichler, P.P.; Jaccard, I.S.; Weisz, U.; Weisz, H. International Comparison of Health Care Carbon Footprints. Environ. Res. Lett. 1997, 14, 064004. [Google Scholar]
  17. Unger, S.; Landis, A. Assessing the Environmental, Human Health, and Economic Impacts of Reprocessed Medical Devices in a Phoenix Hospital’s Supply Chain. J. Clean. Prod. 2016, 112, 1995–2003. [Google Scholar] [CrossRef]
  18. Yang, X.; Hu, M.; Wu, J.; Zhao, B. Building-Information-Modeling Enabled Life Cycle Assessment, a Case Study on Carbon Footprint Accounting for a Residential Building in China. J. Clean. Prod. 2018, 183, 729–743. [Google Scholar] [CrossRef]
  19. Fenner, A.E.; Kibert, C.J.; Li, J.; Razkenari, M.A.; Hakim, H.; Lu, X.; Kouhirostami, M.; Sam, M. Embodied, Operation, and Commuting Emissions: A Case Study Comparing the Carbon Hotspots of an Educational Building. J. Clean. Prod. 2020, 268, 122081. [Google Scholar] [CrossRef]
  20. Nematchoua, M.K.; Asadi, S.; Reiter, S. Estimation, Analysis and Comparison of Carbon Emissions and Construction Cost of the Two Tallest Buildings Located in United States and China. Int. J. Environ. Sci. Technol. 2022, 19, 9313–9328. [Google Scholar] [CrossRef]
  21. Wang, T.; Seo, S.; Liao, P.-C.; Fang, D. GHG Emission Reduction Performance of State-of-the-Art Green Buildings: Review of Two Case Studies. Renew. Sustain. Energy Rev. 2016, 56, 484–493. [Google Scholar] [CrossRef]
  22. Li, H.; Deng, Q.; Zhang, J.; Xia, B.; Skitmore, M. Assessing the Life Cycle CO2 Emissions of Reinforced Concrete Structures: Four Cases from China. J. Clean. Prod. 2019, 210, 1496–1506. [Google Scholar] [CrossRef]
  23. Zhang, X.; Wang, F. Life-Cycle Assessment and Control Measures for Carbon Emissions of Typical Buildings in China. Build. Environ. 2015, 86, 89–97. [Google Scholar] [CrossRef]
  24. Yang, X.; Zhang, S.; Wang, K. Quantitative Study of Life Cycle Carbon Emissions from 7 Timber Buildings in China. Int. J. Life Cycle Assess. 2021, 26, 1721–1734. [Google Scholar] [CrossRef]
  25. Li, X.; Xie, W.; Xu, L.; Li, L.; Jim, C.Y.; Wei, T. Holistic Life-Cycle Accounting of Carbon Emissions of Prefabricated Buildings Using LCA and BIM. Energy Build. 2022, 266, 112136. [Google Scholar] [CrossRef]
  26. Zhou, W. Carbon Emission Estimation of Prefabricated Buildings Based on Life Cycle Assessment Model. NEPT 2021, 20, 147–152. [Google Scholar] [CrossRef]
  27. Gustavsson, L.; Joelsson, A.; Sathre, R. Life Cycle Primary Energy Use and Carbon Emission of an Eight-Storey Wood-Framed Apartment Building. Energy Build. 2010, 42, 230–242. [Google Scholar] [CrossRef]
  28. Wu, X.; Peng, B.; Lin, B. A Dynamic Life Cycle Carbon Emission Assessment on Green and Non-Green Buildings in China. Energy Build. 2017, 149, 272–281. [Google Scholar] [CrossRef]
  29. Tsinghua University Building Energy Conservation Research Center. Annual Report on China Building Energy Efficiency; China Construction Industry Press: Beijing, China, 2021. (In Chinese) [Google Scholar]
  30. Sim, J.; Sim, J.; Park, C. The Air Emission Assessment of a South Korean Apartment Building’s Life Cycle, along with Environmental Impact. Build. Environ. 2016, 95, 104–115. [Google Scholar] [CrossRef]
  31. ISO 14040; Environmental Management-Life Cycle Assessment-Principles and Framework. ISO: Geneva, Switzerland, 2006.
  32. Wang, Y.; Yang, X.; Hou, Q.; Tao, J.; Dong, J. Quantitative Study on the Life-Cycle Carbon Emissions of a Nearly Zero Energy Building in the Severe Cold Zones of China. Sustainability 2022, 14, 1448. [Google Scholar] [CrossRef]
  33. Braune, A.; Durán, C.R. Life Cycle Assessments—A Guide on Using the LCA; DGNB: Stuttgart, Germany, 2018. [Google Scholar]
  34. Cheng, B.; Li, J.; Tam, V.W.Y.; Yang, M.; Chen, D. A BIM-LCA Approach for Estimating the Greenhouse Gas Emissions of Large-Scale Public Buildings: A Case Study. Sustainability 2020, 12, 685. [Google Scholar] [CrossRef]
  35. GB 50849-2014; Code for Design of Infectious Diseases Hospital. China Architecture & Building Press: Beijing, China, 2014. (In Chinese)
  36. Buratti, C.; Moretti, E.; Belloni, E.; Cotana, F. Unsteady Simulation of Energy Performance and Thermal Comfort in Non-Residential Buildings. Build. Environ. 2013, 59, 482–491. [Google Scholar] [CrossRef]
  37. Zini, M.; Carcasci, C. Machine Learning-Based Monitoring Method for the Electricity Consumption of a Healthcare Facility in Italy. Energy 2023, 262, 125576. [Google Scholar] [CrossRef]
  38. GB 55015-2021; General Code for Energy Efficiency and Renewable Energy Application in Buildings. China Architecture & Building Press: Beijing, China, 2021. (In Chinese)
  39. GB 50189-2015; Design Standard for Energy Efficiency of Public Buildings. China Architecture & Building Press: Beijing, China, 2015. (In Chinese)
  40. Ministry of Housing and Urban-Rural Development of the People’s Republic of China (MOHURD). Technical Guidelines for the Construction of Negative Pressure Wards in Emergency Treatment Facilities for COVID-19 (Trial); China Architecture & Building Press: Beijing, China, 2020. (In Chinese)
  41. Koch, R. The 80/20 Principle: The Secret of Achieving More with Less: Updated 20th Anniversary Edition of the Productivity and Business Classic; Hachette: London, UK, 2011. [Google Scholar]
  42. GB 51366-2019; Standard for Building Carbon Emission Calculation. China Architecture & Building Press: Beijing, China, 2019. (In Chinese)
  43. Peng, C. Calculation of a Building’s Life Cycle Carbon Emissions Based on Ecotect and Building Information Modeling. J. Clean. Prod. 2016, 112, 453–465. [Google Scholar] [CrossRef]
  44. GB/T 2589-2020; General Rules for Calculation of the Comprehensive Energy Consumption. China Architecture & Building Press: Beijing, China, 2020. (In Chinese)
  45. China City Greenhouse Gas Working Group, China Products Carbon Footprint Factors Database (CPCD). 2024. Available online: http://Lca.Cityghg.com (accessed on 3 March 2024).
  46. Guo, C.; Zhang, X.; Zhao, L.; Wu, W.; Zhou, H.; Wang, Q. Building a Life Cycle Carbon Emission Estimation Model Based on an Early Design: 68 Case Studies from China. Sustainability 2024, 16, 744. [Google Scholar] [CrossRef]
  47. Fenner, A.E.; Kibert, C.J.; Woo, J.; Morque, S.; Razkenari, M.; Hakim, H.; Lu, X. The Carbon Footprint of Buildings: A Review of Methodologies and Applications. Renew. Sustain. Energy Rev. 2018, 94, 1142–1152. [Google Scholar] [CrossRef]
  48. Rong, P.; Zhang, Y.; Qin, Y.; Liu, G.; Liu, R. Spatial Differentiation of Carbon Emissions from Residential Energy Consumption: A Case Study in Kaifeng, China. J. Environ. Manag. 2020, 271, 110895. [Google Scholar] [CrossRef] [PubMed]
  49. Zhang, L. Carbon Emission Analysis of a Green Building Project in Enshi, Hubei. Constr. Wall Innov. Build. Energy 2019, 4, 34–36. (In Chinese) [Google Scholar]
  50. Guo, C.M.; Liu, Q.H.; Li, S.Y. Green Building Life Cycle Carbon Emission Accounting Modelling and Case Analysis Based on Green Building Evaluation System. Green Build. 2019, 11, 13–18. (In Chinese) [Google Scholar]
  51. Huang, Z.J.; Zhao, L.L.; Zhang, T. The Assessment Method of Life-Cycle CO2 Emission for Residential Buildings. J. Civ. Environ. Eng. 2011, 33, 103–105. (In Chinese) [Google Scholar]
  52. Jia, J. Research on the Carbon Emission of a Green Building in the Whole Life Cycle. Constr. Sci. Technol. 2016, 17, 78–81. (In Chinese) [Google Scholar]
  53. Wang, C.Y. Life Cycle Assessment of Carbon Emissions from Office Buildings in Yangtze River Delta; Southeast University: Nanjing, China, 2016. (In Chinese) [Google Scholar]
  54. Yin, S.C. Study of Life-Cycle Carbon Emission in Buildings; Harbin Institute of Technology: Harbin, China, 2012. (In Chinese) [Google Scholar]
  55. Ma, J.-J.; Du, G.; Zhang, Z.-K.; Wang, P.-X.; Xie, B.-C. Life Cycle Analysis of Energy Consumption and CO2 Emissions from a Typical Large Office Building in Tianjin, China. Build. Environ. 2017, 117, 36–48. [Google Scholar] [CrossRef]
  56. Wang, Y.S.; Yang, X.; Yan, H. Carbon Emission Accounting for Buildings Based on Whole Life Cycle: A Case Study of Reconstruction Project at College in Guangzhou. J. Eng. Manag. 2017, 31, 19–24. [Google Scholar]
  57. Peng, B. Case Study on Life Cycle Energy Consumption and CO2 Emissions of Green Buildings; Tsinghua University: Beijing, China, 2012. (In Chinese) [Google Scholar]
  58. Wang, J.Y. BIM-Based Green Building Life Cycle Carbon Emissions Measurement and Benchmarking Research; Hunan University of Technology: Zhuzhou, China, 2019. (In Chinese) [Google Scholar]
  59. Zou, Y.N. Research on the Calculation of the Whole Life Cycle Carbon Emission and the Carbon Reduction Strategy of Chaoyang Wanda Plaza; Shenyang Jianzhu University: Shenyang, China, 2020. (In Chinese) [Google Scholar]
  60. Dong, K.H. Study on Carbon Emission Calculation from the Life-Cycle of Large-Scale Complex Building in the South; South China University of Technology: Guangzhou, China, 2018. (In Chinese) [Google Scholar]
  61. Liu, Y. The Carbon Emission Evaluation Model Based on Building Lifecycle; Dalian University of Technology: Dalian, China, 2015. (In Chinese) [Google Scholar]
  62. Lu, K.; Wang, H. Estimation of Building’s Life Cycle Carbon Emissions Based on Life Cycle Assessment and Building Information Modeling: A Case Study of a Hospital Building in China. GEP 2019, 7, 147–165. [Google Scholar] [CrossRef]
  63. GB GB50736-2012; Design Code for Heating Ventilation and Air Conditioning of Civil Buildings. China Architecture & Building Press: Beijing, China, 2012. (In Chinese)
  64. Hu, P. A Medical Building Energy Consumption Analysis and Energy-Saving Resconstrction in Hunan Province; Hunan University: Changsha, China, 2018. (In Chinese) [Google Scholar]
  65. Silva, B.V.F.; Holm-Nielsen, J.B.; Sadrizadeh, S.; Teles, M.P.R.; Kiani-Moghaddam, M.; Arabkoohsar, A. Sustainable, Green, or Smart? Pathways for Energy-Efficient Healthcare Buildings. Sustain. Cities Soc. 2024, 100, 105013. [Google Scholar] [CrossRef]
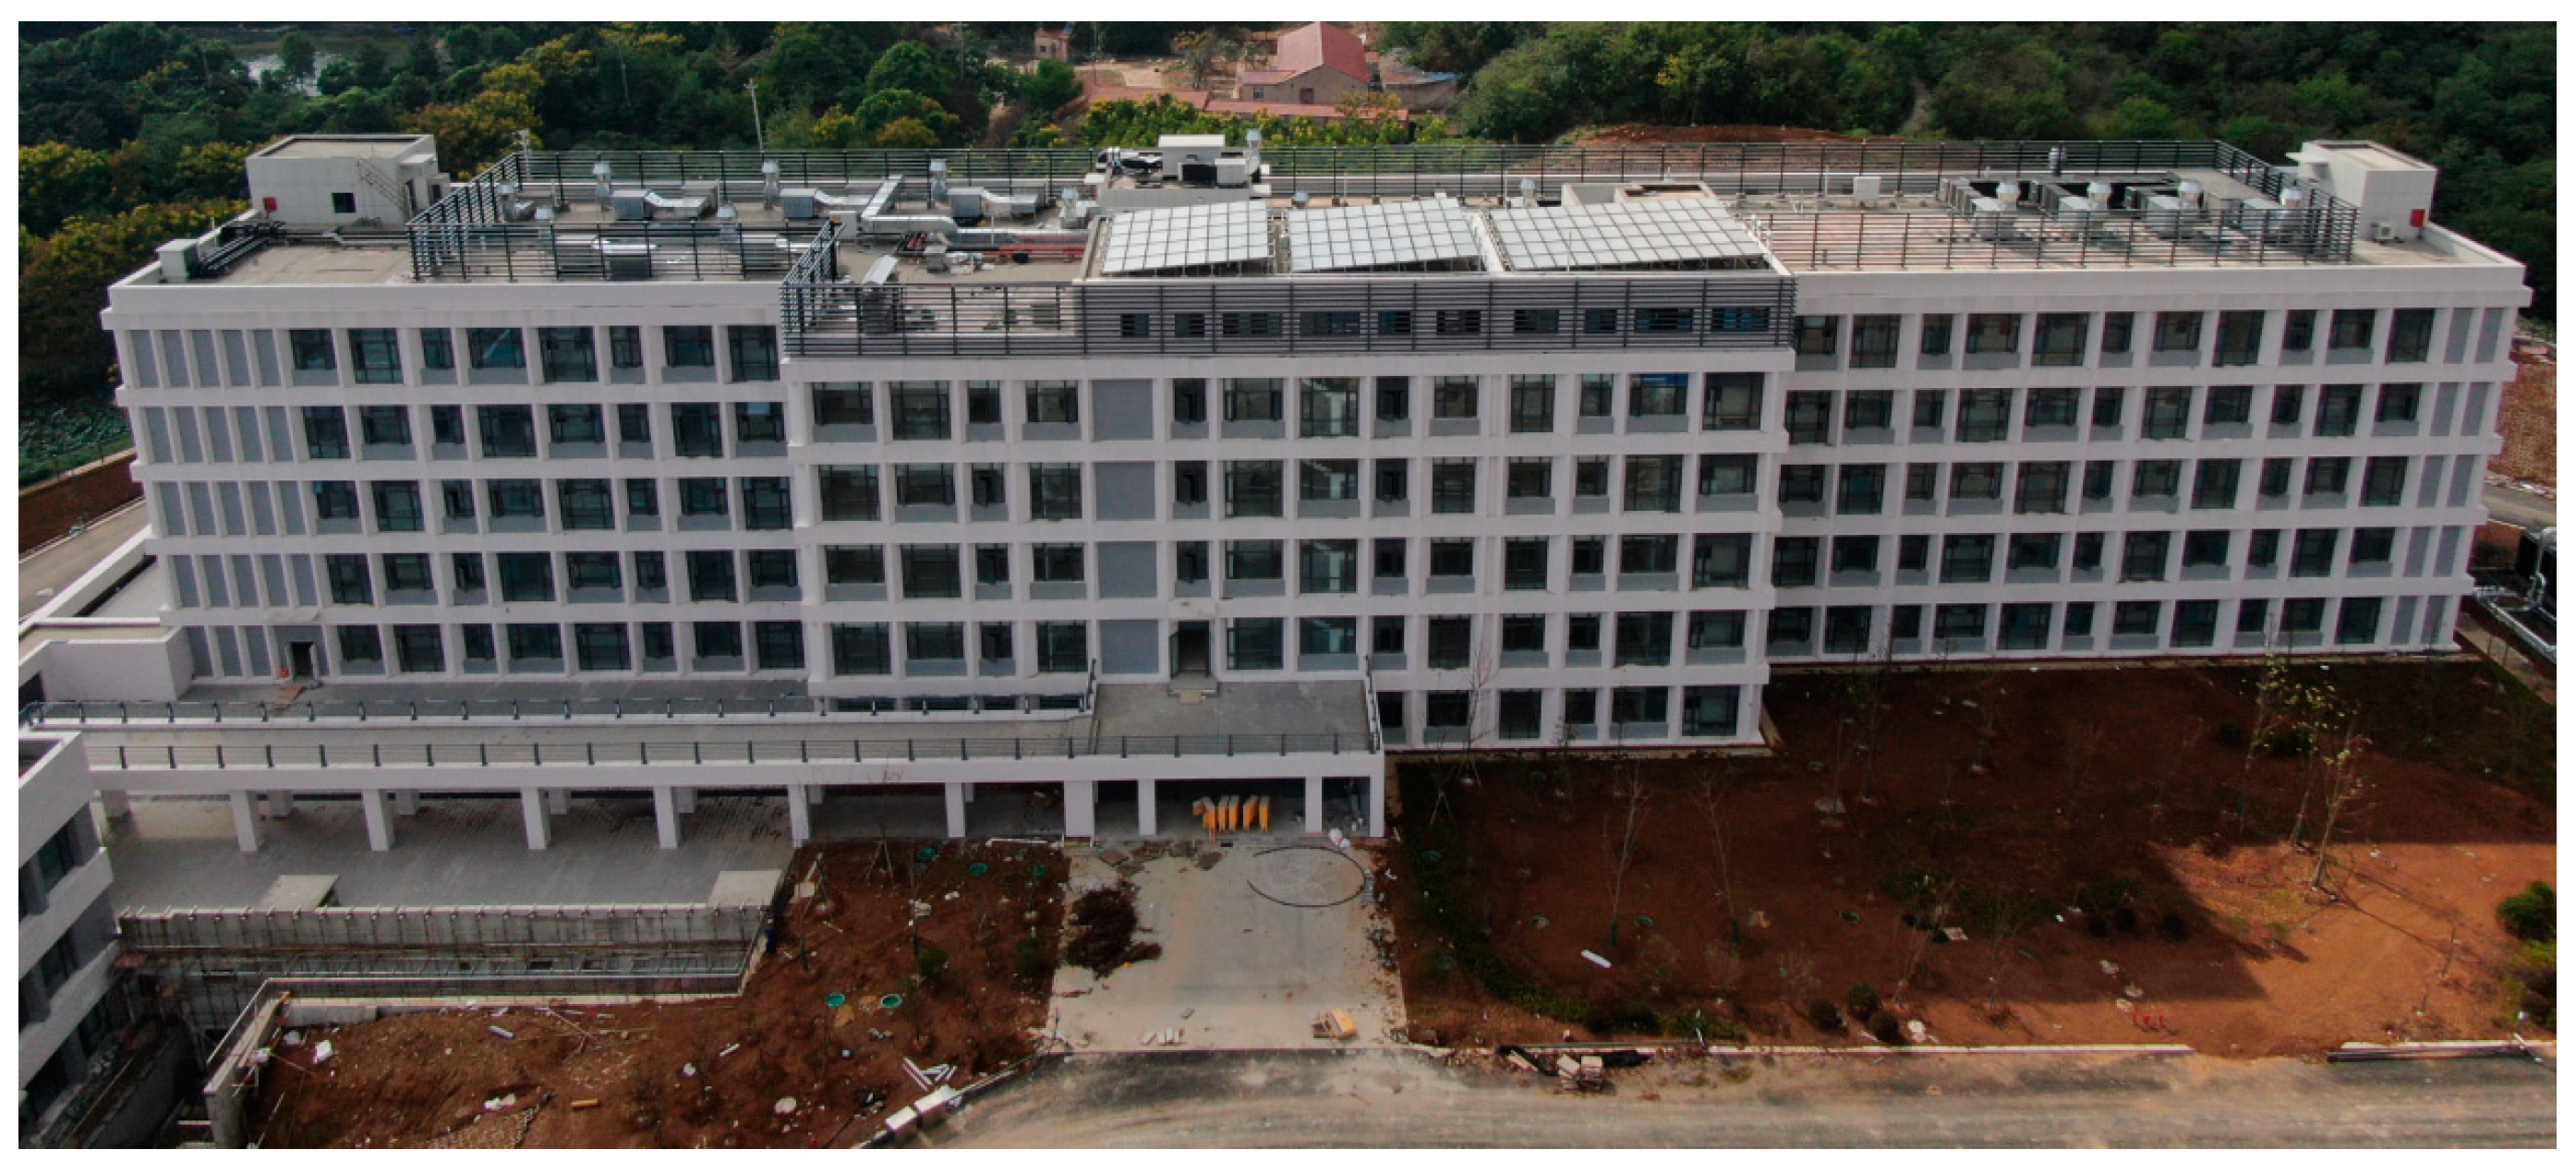
Figure 1. Overhead view of the inpatient building.
Sustainability 16 05341 g001
Figure 2. Models and layouts of the case.
Sustainability 16 05341 g002
Figure 4. Percentage of carbon emissions from various types of steel and concrete.
Sustainability 16 05341 g004
Figure 5. Carbon emissions from the transport of major construction materials.
Sustainability 16 05341 g005
Figure 6. Energy consumption and carbon emissions of construction machinery.
Sustainability 16 05341 g006
Figure 7. Annual energy simulation results for the inpatient building.
Sustainability 16 05341 g007
Figure 8. Comparison of carbon emissions in stock cases.
Sustainability 16 05341 g008
Figure 9. Annual energy consumption under different modes of operation.
Sustainability 16 05341 g009
Table 1. Parameters of the inpatient building.
ParametersDetailed Information
Building locationNanjing, Jiangsu
Climate zoneHot-summer, cold-winter zone
Construction periodDesigned in 2021 and completed in 2023
Area15,679.57 m2
Height5 floors above ground, 1 floor below ground, total height 23.95 m
StructureFrame structure
Form factor0.15
Number of beds150 negative pressure wards with a total of 300 beds
Zone 13103.8 m2, including consultation room, lounge, dining room, duty room, and shower room
Zone 23029.2 m2, including nurses’ station, treatment room, store room, office, and healthcare corridor
Zone 39246.6 m2, including wards, buffer rooms, soiled storage rooms, soiled washrooms, and patient corridor
Table 2. Parameter settings required for simulation.
ParametersValues
External walls U-value, Uwall0.58 W/(m2·K)
Roof U-value, Uroof0.4 W/(m2·K)
Window U-value, Uwindow2.2 W/(m2·K)
Solar heat gain coefficient, SHGCSHGCeast = 0.37, SHGCwast = 0.37, SHGCsouth = 0.37, SHGCnorth = 0.37
Window-to-wall ratio, WWRWWReast = 0.24, WWRwast = 0.22, WWRsouth = 0.12, WWRnorth = 0.04
Occupancy density0.04 people/m2
Domestic hot water0.21 L/(m2·day)
Summer setting temperature, Tsummer26 °C
Winter setting temperature, Twinter20 °C
Ventilation rateZone 1 = 3 ac/h, Zone 2 = 6 ac/h, Zone 3 = 12 ac/h
Default display lighting density6 W/m2
Power density15 W/m2
Table 3. Consumption of key building materials and carbon emission factors.
No.Material TypeUnitAmount E F i
1ConcreteC15m3481.33177.8
2C20m3647.37237.32
3C25m3619.74266.18
4C30m36642.35295
5C35m323.88362.6
6C50m3854.46511
7Cement32.5kg124,597.120.621
842.5kg70,595.280.795
9Cement mortarm3714.18315
10SteelSection steelkg5593.692.365
11HRB 300kg29,638.142.34
12HRB 400kg1,103,654.282.34
13HRB 500kg67,488.32.34
14Cold-rolled ribbed barkg5243.823.368
15Pipe supportkg28,593.132.43
16Steel pipe scaffoldingkg35,442.282.43
17BrickBrick (190 × 90 × 40)m351.76336
18Standard brick (240 × 115 × 53)One hundred377.1749.15
19KM1 brick (190 × 190 × 90)3934.75109.17
20Concrete solid brick (190 × 90 × 43)149.4224.71
21Concrete block (600 × 250 × 200)m3928.7212
22Woodm31079.51178
23OthersSandt332.122.51
24Gravelt297.752.18
25Sealing boltkg6048.191.54
26Welding rodkg4773.853.027
Table 4. Consumption list of major construction machinery and equipment.
No.Machinery and EquipmentEnergy Consumption per ShiftNumber of Shifts
Gasoline (kg)Diesel (kg)Electricity (kWh)
1Pipe cutting machine (150 mm)//12.9096.79
2Conical thread turning machine (45 mm)//9.24566.45
3Truck crane (5 t)/26.43/56.10
4Truck crane (16 t)/35.85/4.50
5Truck crane (20 t)/38.41/28.00
6Truck crane (40 t)/48.52/16.00
7Self-lifting tower crane (400 t)//164.31179.54
8Truck (4 t)25.48 //226.80
9Truck (8 t)/35.49/16.00
10Truck (15 t)/56.74/15.00
11Platform trailer (20 t)/45.39/12.00
12Tipping car (1 t)/6.03/26.41
13Low-speed winch (30 kN)//28.76380.43
14Mortar mixer (200 L)//8.6123.41
13Concrete vibrator (flat type)//6.72561.01
14Concrete vibrator (insertion type)//5.38403.11
15Vortex concrete mixer (500 L)//107.715.78
16Steel bar cutting machine (40 mm)//32.10123.38
17Steel bar bender (40 mm)//12.80365.06
18Woodworking circular sawing machine (500 mm)//24.00579.81
19Electric multistage centrifugal water pump (100 mm)//180.4066.76
20Submersible pump (100 mm)//25.0010.32
21AC arc welding machine (30 kVA)//96.53279.68
22AC arc welding machine (40 kVA)//132.236.22
23Butt welding machine//122.0050.07
24Argon welder//70.7071.32
25Electric hammer//4.20839.68
Table 5. Carbon emission factors of major energy sources.
TypeCO2 Emission FactorData Sources
Gasoline2.93 kgCO2/kg[42,44]
Diesel oil3.1 kgCO2/kg
Natural gas2.16 kgCO2/m3
Tap water0.168 kgCO2/t[42]
Electricity (Jiangsu Province)0.7 kgCO2/kWh[45]
Table 6. Consumption of main building materials.
MaterialConsumption per Unit Area
Concrete0.497 m3/m2
Steel68.39 kg/m2
Cement87.04 kg/m2
Wood0.011 m3/m2
Brick95.24 kg/m2
Sand33.77 kg/m2
Table 7. Carbon emissions throughout the life cycle of the inpatient building.
Carbon Emission
(tCO2)
Carbon Emission Intensity (kgCO2/m2)Percentage (%)
Embodied stage7446.13474.914.54%
Production of building materials7050.28449.664.30%
Transport of building materials269.4517.190.16%
Construction126.48.060.08%
Operational stage155,925.319944.8595.08%
Cooling36,745.312343.6022.41%
Heating49,454.713154.2030.16%
Lighting16,583.681057.7010.11%
Equipment45,668.222912.7027.85%
Domestic water2633.41167.961.61%
Maintenance4839.98308.692.95%
Demolition stage629.940.170.38%
Total life cycle carbon emissions164,001.3410,459.94100.00%
Table 8. Composition of the stock cases.
NoLocationZoneTypeStructureArea
(m2)
FloorsCalculation MethodSources
Stage 1Stage 2Stage 3
C1GuangdongIVOfficeReinforced concrete192,18136SimaProSimaProSimaPro[22]
C2XiamenIVOfficeFrame24,533.199Main materials (10 types)DeST-cEstimation[48]
C3EnshiIIIOfficeFrame-shear wall44,615.569Main materials (3 types)IBEEstimation[49]
C4TianjinIIOfficeSteel12,878.55Detailed listMeasurementEstimation[50]
C5EnshiIIIOfficeFrame-shear wall20,036.819Main materials (3 types)IBEEstimation[51]
C6ShenzhenIVOfficeFrame25,023.95Detailed listMeasurementEstimation[21]
C7ShanghaiIIIOfficeReinforced concrete24,2617Main materials (11 types)E-QuestEstimation[52]
C8HarbinIOfficeConcrete15,51428Main materials (14 types)EnergyplusList[53]
C9Xi’anIIOfficeFrame11,3516Detailed listDesignbuilderList[54]
C10TianjinIIOfficeFrame57,0009Detailed listMeasurementList[55]
C11ZhejiangIIISchoolReinforced concrete49815SimaProSimaProSimaPro[22]
C12GuangzhouIVSchoolFrame27,066.710Main materials (6 types)StatisticEstimation[56]
C13HangzhouIIISchoolFrame20,9335Detailed listStatisticEstimation[57]
C14ChangshaIIISchoolShear wall2347.433RevitGBSList[58]
C15NanjingIIISchoolConcrete16,87315RevitPrediction modelEstimation[53]
C16ChaoyangIEmporiumFrame97,0005Detailed listMeasurementEstimation[59]
C17FoshanIVEmporiumFrame130,0004Detailed listMeasurementEstimation[60]
C18BeijingIIFactorySteel50,461.142Main materials (10 types)StatisticEstimation[61]
C19GuangdongIVHospitalReinforced concrete16017SimaProSimaProSimaPro[22]
C20ChuzhouIIIHospitalFrame63674RevitGBSEstimation[62]
Table 9. Average carbon emissions of different building types and comparison.
Carbon Emission Intensity
(kg CO2/m2)
Embodied StageOperational StageDemolition StageTotal
Office795.142844.1930.213669.39
School679.842345.7477.563103.67
Emporium482.204603.5448.015133.75
Hospital604.194004.20229.874842.76
This study474.919944.8540.1710,459.94
Table 10. Energy consumption and carbon emissions under different operational modes.
NoOperational SchemeEnergy Consumption [kWh/(m2·Year)]Operational Carbon Intensity
(kg CO2/m2)
Scenario 1Zone 1 = 2 ac/h, Zone 2 = 2 ac/h, Zone 3 = 2 ac/h149.985725.89
This studyZone 1 = 3 ac/h, Zone 2 = 6 ac/h, Zone 3 = 12 ac/h270.529944.85
Scenario 2Zone 1 = 12 ac/h, Zone 2 = 12 ac/h, Zone 3 = 12 ac/h312.0415,587.81
Disclaimer/Publisher’s Note: The statements, opinions and data contained in all publications are solely those of the individual author(s) and contributor(s) and not of MDPI and/or the editor(s). MDPI and/or the editor(s) disclaim responsibility for any injury to people or property resulting from any ideas, methods, instructions or products referred to in the content.