Abstract
This study delves deeply into the multifaceted nature of investor value creation, focusing on financial health, growth, profitability, cash flow, and ESG (environmental, social, and governance) risk ratings. The research employs partial least squares structural equation modeling (PLS-SEM) to dissect the interactions among these variables in a sample of 482 S&P 500 firms. Data were obtained from the FINRA database (2023) and Sustainalytics ESG risk ratings (2023). The results indicate that solid financial health enhances investor value creation. While growth fosters profitability, its direct impact on value creation and cash flow appears limited. The study also uncovers that ESG risk ratings negatively moderate the relationship between cash flow and value creation. This finding suggests that higher ESG risks lead to increased operational and compliance costs, which can reduce working capital and operating cash flow. Additionally, although sustainability investments may initially incur higher costs, they generate long-term value in terms of investment cash flow. A high perception of ESG risk can also raise financing costs, negatively impacting financial cash flow. These findings offer significant contributions to both academic theory and practical applications, shedding light on the complex interplay between financial and sustainability indicators in driving value creation for investors.
1. Introduction
Understanding how financial health, growth, profitability, cash flow, and ESG (environmental, social, and governance) risk ratings interact is crucial for effective corporate management and value creation for investors. Recent research has primarily focused on the individual impacts of these factors on financial decisions and value creation. However, a significant knowledge gap remains regarding their interactions and combined effects on market value perception and investment decisions. This study aims to fill this gap by providing a deeper understanding of these factors’ integral dynamics and their collective impact on investment decisions. The present study is not just another piece of research but a significant contribution to the evolution of corporate finance and social responsibility literature.
This study conducts an exhaustive review of Valaskova et al. [1] theories on “financial agility”, highlighting how effective management of financial indicators empowers companies to adapt to market changes quickly. Additionally, it examines Aigbedo [2] perspectives on how revenue growth and factors such as business size and industry concentration influence environmental performance and value creation. The impact of cash flow and climate risks on infrastructure projects, as discussed by In et al. [3], is analyzed alongside Barko et al. [4] research on how investor activism influences ESG ratings. The studies of Chen and Xie [5] and Gil [6], which explore the heterogeneous effects of ESG information disclosure and how environmental and social risks affect financial returns, are also incorporated. Using partial least squares structural equation modeling (PLS-SEM), this analysis provides a comprehensive view of how these elements interact to impact value creation in companies listed on the S&P 500.
It is expected that the results of this study will enhance our understanding of how financial health, growth, profitability, cash flow, and ESG risk ratings interact in creating value for investors. These findings will offer significant implications for corporate management and investment strategies. By unraveling the complex dynamics among these factors, the study aims to provide companies with crucial insights to optimize their financial policies and sustainability strategies in an increasingly environmentally, socially, and governance-aware global market.
In this context, the research structure is as follows: Section 1, Introduction; Section 2, Materials and Methods, which develops the literature review in Section 2.1. Financial health and its role in value creation, Section 2.2. Company growth and its impact on company valuation, Section 2.3. Profitability as a key indicator, Section 2.4. Cash flow and its influence on investment decisions, Section 2.5. Creation of value for the investor, and Section 2.6. ESG risk rating and its impact on the creation of value for the investor. This is followed by Section 3, Data and Methodology, which includes Section 3.1. Data Collection and Section 3.2. Measurement Instrument. Section 4 presents the data analysis, followed by Section 5, Results; Section 6, Discussion; and Section 7, Conclusions.
2. Materials and Methods
2.1. Financial Health and Its Role in Value Creation
Financial health, evaluated through financial ratios like the quick ratio, current ratio, and interest coverage, reveals a company’s ability to remain solvent and prosperous. Pavlicko et al. [7] significantly advanced our understanding of financial health’s role in value creation by introducing an advanced ensemble model to predict financial difficulties. However, the model’s reliance on historical data may not adequately reflect the financial agility needed in unpredictable events, representing a limitation in volatile economic environments. Despite this, the study’s strength lies in its methodological contribution to financial risk prediction, providing a solid foundation for future research that aims to integrate factors of adaptability and resilience.
Valaskova et al. [1], responding to the growing interest in financial health’s influence on value creation, introduced the theory of “financial agility”. This theory suggests that a company’s ability to adapt quickly to market changes through effective management of financial indicators is crucial for sustained success beyond solvency and liquidity. Ratios such as the quick ratio, current ratio, and interest coverage transcend their traditional role as stability indicators, becoming dynamic tools that reflect an organization’s ability to respond proactively to unexpected situations and market evolutions.
Academic literature has extensively explored financial health, highlighting financial metrics’ crucial role in assessing stability and potential value creation in companies. Demirci et al. [8] emphasized the importance of the quick ratio and current ratio as essential indicators of corporate solvency. They expanded their utility by linking them to corporate diversification and debt cost reduction in REITs, emphasizing the interest coverage ratio in contexts of high diversification. Gupta et al. [9] and An and Yoon [10] demonstrated how effective working capital management, including the current ratio, contributes to corporate value by improving profitability and long-term growth.
Complementarily, studies such as those by Sfakianakis [11], Yakymova and Kuz [12], Yousaf and Bris [13], and Zhu et al. [14] demonstrated the applicability and relevance of these ratios across various sectors and industries, underscoring their ability to act as barometers of economic solidity and catalysts for value creation under varied market conditions. Jenčová et al. [15] identified the quick ratio as a significant predictor of bankruptcy in the Slovak electrical industry, demonstrating its relevance in insolvency prediction.
Pavlicko et al. [7] furthered our understanding of financial health’s impact on value creation by utilizing econometric models to predict financial difficulties. However, relying on historical data may limit these models’ effectiveness amid rapid economic changes. There is an opportunity to adapt these models to enhance financial agility in volatile markets, using indicators such as the quick ratio, current ratio, and interest coverage. This research explores how to adjust financial models to current market dynamics, filling a significant gap in decision-making during economic uncertainties. This study seeks to address this gap with the following hypothesis:
H1a–c.
Financial health has a significant and positive effect on the reflective constructs of cash flow, value creation for investors, and profitability.
2.2. Corporate Growth and Its Impact on Company Valuation
Business growth, a key driver of valuation, is influenced by expansion and operational improvements, which enhance perceived value and attract investors. Zahra [16] seminal study is pivotal in understanding the intricate connection between corporate growth, the external environment, corporate entrepreneurship, and financial performance. Zahra research uncovers that the relationship between corporate entrepreneurship and financial performance is not constant but varies significantly with the business environment, influencing growth and profitability. However, it is important to note that the study’s applicability is limited to specific SIC codes, raising questions about the generalizability of results to other sectors or geographic contexts. Nevertheless, the study’s primary strength lies in its detailed insight into how different business environments impact growth strategies and corporate entrepreneurship.
Aigbedo [2] research offers a fresh perspective on the impact of revenue growth on environmental performance. It underscores how company size and industrial concentration mediate this relationship. Aigbedo work suggests that industry affiliation, rather than financial performance, is a stronger predictor of ecological performance. The study also evaluates how market perception and response to corporate growth, as reflected in indicators such as revenue %, operating income %, and net income %, influence value creation.
Studies by Zahra and Hayton [17] and Laforet [18] emphasize the importance of internal capabilities such as R&D and innovation, which drive revenue growth and profitability but also face management challenges and operational risks. Smriti and Das [19] identify human capital as crucial for increasing sales and market value, directly influencing key indicators like revenue percentage, operating income, and net profit. Kamukama et al. [20] highlight how intellectual capital enhances competitive advantage and financial performance, which is essential for understanding the relationship between internal resources and economic success.
Further research, such as that of Fry and Cohen [21] and O’Reilly et al. [22], underscores how organizational culture and leadership influence these indicators, promoting a productive work environment. Pohle and Chapman [23] and Bontis et al. [24] show that innovation in business models and efficient capital use are crucial for maintaining competitiveness and improving profitability.
Lastly, Brazel et al. [25] warn of the need to monitor discrepancies between financial indicators (such as revenue growth) and non-financial indicators (such as facility growth) to manage risks like fraud. These findings illustrate the complexity of business growth dynamics and highlight effective resource management through financial metrics.
Aigbedo [2] study on revenue growth’s impact on environmental performance emphasizes business size and industrial concentration as moderating factors. It reveals that industry affiliation significantly influences ecological performance more than financial performance. This analysis suggests that the market’s perception of corporate growth, reflected in economic indicators, plays a crucial role in value creation. Further investigation into how these dynamics vary by sector could guide corporate decisions and industry-specific sustainability strategies. This research seeks to address this gap with the following hypothesis:
H1d–f.
Growth exerts a significant and positive effect on the reflective constructs of cash flow, value creation for investors, and profitability.
2.3. Profitability as a Key Indicator
Profitability, expressed through indicators such as return on assets (ROA), return on equity (ROE), price/sales (P/S), and price/cash flow (P/CF), plays a crucial role in business valuation and performance assessment. Swink and Schoenherr [26] expand the traditional focus on profitability by examining how internal integration impacts financial indicators. They discovered that while this integration reduces sales and administrative costs, it does not directly impact asset productivity. This finding emphasizes the importance of internal operational practices in cost optimization and their indirect contribution to profitability. Their study stands out due to its use of objectively reported financial data and the application of information processing theory, which provides a robust foundation for understanding internal integration effects. However, its scope is limited to specific industries and regions, limiting the generalization of the results to other contexts.
Valaskova et al. [1] introduce a new perspective on profitability and business performance evaluation, focusing on predicting financial development through indicators such as ROA, ROE, P/S, and P/CF. These indicators are essential for assessing profitability and predicting potential insolvency, offering valuable tools for managing financial risks and providing a deeper assessment of a company’s financial stability. This approach enhances traditional financial metrics by incorporating risk assessment capabilities, significantly advancing financial analysis and corporate management.
Various studies support Valaskova et al. [1] theory. For instance, Olson and Zoubi [27] demonstrate convergence in bank profitability, particularly between 2010 and 2014, highlighting the crucial role of these indicators. Boisjoly et al. [28] observe significant changes in profitability financial metrics, linking them to financial management. Ganda [29] explains how carbon performance, assessed through these metrics, affects ROA and firm value both in the short and long term. Additionally, Saidat et al. [30] show that board composition significantly affects financial performance, especially in family firms, with a negative relationship between board size and ROA.
Garcia-Blandon et al. [31] indicate that high environmental performance can lead to lower price/sales multiples, reflecting possibly adverse market perceptions towards solid ecological policies. Amenc et al. [32] suggest that including intangible assets significantly improves capital valuation. Ong et al. [33] find that price/sales multiples are particularly relevant in IPOs, offering critical valuation for investors. Joshi and Chauhan [34] highlight that price/sales multiples are particularly suited for valuing companies in emerging markets, emphasizing the variability in the applicability of these indicators.
Calhoun [35] discusses the utility of financial multiples in evaluating mergers and acquisitions, and Batrancea [36] directly relates market metrics such as P/E and P/S with the financial performance of companies between economic crises. Xiao et al. [37] use an innovative methodology to refine the accuracy of market valuation predictions. Yuliani et al. [38] apply valuation multiples to determine whether stocks are overvalued or undervalued based on key financial ratios.
Valaskova et al. [1] highlight the importance of critical financial indicators such as ROA, ROE, P/S, and P/CF in predicting business development and insolvency. However, it remains to identify a gap in knowledge regarding how these indicators vary according to company size and their impact on investor value creation. This research seeks to address this gap with the following hypothesis:
H1g.
Profitability has a significant and positive effect on value creation for investors, underscoring the importance of profitability as a key indicator of financial performance that contributes to the increase in shareholder value.
2.4. Cash Flow and Its Influence on Investment Decisions
Effective management of operating, investing, and financing cash flows, along with working capital and capital expenditure, is crucial for shaping corporate strategies and influencing investors’ perceptions of a company’s stability and growth potential. Megaravalli and Sampagnaro [39] add a significant dimension to traditional cash flow and capital management research by highlighting how liquidity ratios and working capital predict business growth. They innovate by using balance sheet ratios from the previous year as growth predictors, utilizing a robust sample of 45,000 small and medium-sized family businesses in Italy. However, their focus on a single country and business type and exclusive use of Probit regression may limit the generalization of results and fail to capture the complexity of factors influencing business growth fully.
In et al. [3] propose an innovative framework that emphasizes the importance of cash flow, working capital, and capital expenditure in assessing the financial impact of climate risks on energy infrastructure projects. Using simulations of operating, investing, and financing cash flows and scenario analysis, this approach estimates the likelihood of default and economic losses in infrastructure assets. This method underscores that effectively managing these financial elements is crucial for corporate strategy. It profoundly affects investors’ perceptions of a company’s viability and economic resilience in the face of systemic risks.
Recent studies highlight the relevance of cash flow management and other financial indicators in corporate strategy and business valuation. Deng and Zhao [40] and Al-Nasser et al. [41] show how investment sensitivity to cash flow influences business value and its capacity to manage future investments, especially under financial constraints. Devine and Yönder [42] demonstrate that REITs with sustainable practices achieve superior market valuation premiums, implying lower risk and highlighting the impact of cash flow on net operating income. Li and Ryan [43] find that company value decreases with greater family control, with the sensitivity of R&D investment to internal cash flow being crucial. Wen and Tikoo [44] identify that unique corporate strategies increase investment sensitivity to cash flow, highlighting difficulties in obtaining external financing.
Bergmann et al. [45] note that while high-quality materials offer environmental benefits, their performance in cash flow models is slightly inferior but with a risk index that can positively influence sustainable decisions. Czerwonka and Jaworski [46] find that although company size positively impacts working capital management, other factors, such as growth and tangibility, have adverse effects. Hull [47] adds that allocating operating cash flows to interest payments in financial services firms can maximize company value. Collectively, these studies show that efficient cash flow management and consideration of factors like credit rating and corporate strategy are fundamental to optimizing financial performance and investor perception.
Megaravalli and Sampagnaro [39] explore how cash flow management and capital decisions influence business solidity and growth perceptions. However, gaps still need to be addressed regarding how these practices vary by company size and sector. This study proposes to explore how cash flow decisions influence value creation in diverse contexts, paying particular attention to companies with different levels of ESG risk. This study aims to provide insights on optimizing financial management to enhance value creation for investors across various economic and business situations. This research seeks to address this gap with the following hypothesis:
H1h.
Cash flow has a significant and positive effect on value creation for investors, emphasizing the importance of cash flow efficiency as a key indicator of financial performance that contributes to the increase in shareholder value.
2.5. Creation of Value for the Investor
Optimizing value creation for investors occurs when the return on capital (ROC) exceeds the weighted average cost of capital (WACC), reflecting efficient management that maximizes returns. Atan et al. [48] challenge traditional perceptions by demonstrating that, while individual ESG factors do not significantly relate to profitability (ROE) or company value (Tobin’s Q), a combined ESG score positively influences WACC. Their study employs a robust methodology using panel data regressions, including pooled OLS, fixed effects, and random effects, to assess ESG factors’ impact on financial performance in Malaysia. However, the small sample size of 54 companies and the short analysis period from 2010 to 2013 limit the study’s ability to capture current trends or generalize to other jurisdictions or more extended periods.
Barko et al. [4] propose a new theory suggesting that investor activism significantly influences ESG ratings. Activism can particularly benefit companies with low initial scores by improving their performance and ESG profiles. However, activism can also harm companies with high scores by revealing previously unknown issues. The research indicates that companies with sensitive ESG profiles subject to successful activism improve sales and offer superior risk-adjusted excess returns, demonstrating investor activism’s potential to catalyze positive and tangible changes in corporate management and value creation.
Recent research has focused on the interaction between sustainable practices and financial performance, highlighting how strategies related to social responsibility, sustainability, and green innovation influence vital financial indicators. Smriti and Das [19] emphasize the importance of human and structural capital in increasing sales and market value, suggesting that intellectual capital is crucial for value creation and is directly reflected in financial performance. Gangi et al. [49] and Visnjic et al. [50] highlight how internal strategies such as CSR and shifting toward service models enhance competitiveness and adjust offerings to meet customer needs, improving financial and operational performance.
Farza et al. [51] and Zhou and Cui [52] find that green innovation and issuing green bonds improve profitability and resource efficiency while enhancing corporate reputation, translating into increased market value. However, Hoang et al. [53] and Jyoti and Khanna [54] warn about the mixed or adverse effects of environmental transparency and high ESG scores on capital efficiency and long-term performance. In contrast, Pham et al. [55] identify a positive relationship between corporate sustainability and asset performance. However, the relationship with market-based financial measures like Tobin’s Q must be conclusive. These findings suggest that while certain sustainability practices enhance specific financial aspects, their impact can vary depending on the implementation and business context.
Atan et al. [48] have improved our understanding of how value creation impacts profitability, but questions remain about how return on invested capital (ROIC) significantly influences this relationship. Examining how ROIC consistently exceeds WACC across various economic and sectoral environments is necessary to indicate management that maximizes returns. This research proposes to explore strategies and policies that optimize ROIC above WACC, contributing to improved profitability and value creation. This investigation aims to address this gap with the following hypothesis:
H2.
The reflective indicators will demonstrate significant and positive factor loadings on the latent variable “Creation of Value for the Investor”, thereby validating its internal consistency and high reliability.
2.6. ESG Risk Rating and Its Impact on the Creation of Value for the Investor
Sustainalytics’ ESG risk ratings evaluate how companies manage environmental, social, and governance risks that directly impact their valuation and cash flow. These ratings help investors understand these factors’ effects on financial performance and long-term sustainability. By identifying risk levels ranging from negligible to severe across various industries globally, these ratings provide an essential tool for decision-making in responsible investment, financial product development, and sustainability-focused portfolio management.
Tan and Zhu [56] introduce an innovative dimension to traditional financial risk analysis, highlighting ESG ratings’ positive influence on green innovation and alleviating financial constraints. Companies with high ESG ratings attract more favorable financing conditions and demonstrate a more significant commitment to sustainable projects, especially during growth phases. Integrating ESG factors into corporate valuation reflects responsible business practices and drives a proactive approach toward sustainable innovation and long-term value creation. Despite focusing exclusively on Chinese companies listed on A-shares, limiting its applicability to other markets or geographical contexts, the study provides valuable insights into ESG and green innovation in emerging markets.
Chen and Xie [5] propose that ESG information disclosure enhances corporate financial performance, exhibiting significant heterogeneous effects depending on contextual factors. These impacts are pronounced in companies attracting ESG-oriented investors, receiving high media attention, facing high agency costs, or having a long market tenure. ESG-oriented investors play a crucial moderating role, enhancing the relationship between ESG disclosure and financial performance. This perspective complements previous studies by highlighting how companies’ context and specific characteristics influence ESG policies’ effectiveness.
Various researchers’ findings confirm ESG practices’ significant impact on financial performance and market valuation, supporting Chen and Xie’s [5] theory regarding ESG information disclosure benefits. Said and ElBannan [57] highlight the positive association between ESG performance and stock behavior in emerging markets. Giese et al. [58] observe that an optimized ESG risk profile leads to lower capital costs and higher valuations. Zhou et al. [59] identify financial performance and operational capability as key mediators enhancing market value through ESG performance. Landi and Sciarelli [60] and Barko et al. [4] offer a nuanced view, suggesting ESG ratings do not always directly translate into perceptible market benefits but emphasize activist engagement to improve ESG performance.
Billio et al. [61] and Folger-Laronde et al. [62] warn about ESG ratings’ lack of uniformity and limited effectiveness during economic crises. Dorfleitner et al. [63], Popescu et al. [64], and Dmuchowski et al. [65] complement these findings by showing how ESG-based strategies can outperform peers in specific contexts. Linnenluecke [66] and Li et al. [67] emphasize the need for more robust and sustainability-oriented evaluation approaches. Sandberg et al. [68] observe a modest but positive relationship between high ESG ratings and financial performance, measured by indicators such as ROA and ROE. Al Amosh et al. [69] demonstrate that sustainability disclosure, especially in terms of environmental, social, and governance (ESG) issues, has a significant impact on the financial performance of companies, and highlight that governance performance specifically influences ROA. Chen et al. [70] confirm a significant correlation between ESG and corporate performance, particularly in large companies. Patel et al. [71] analyze how ESG ratings’ predictability and dynamism affect market volatility, showing that effective ESG management can reduce volatility in contexts of high ESG dynamism.
ESG risk ratings are crucial in corporate evaluation, affecting management and strategic investments across industries. Hassan and Meyer [72] note that ESG risk perception significantly modifies demand in the Visegrád countries’ tourism sector, while Pishchalkina et al. [73] find a positive correlation between high ESG ratings and operational efficiency in the mining and metallurgical sector. Gil [6] shows how environmental and social risks negatively impact financial returns, highlighting investors’ trends since 2018 toward companies with strong environmental policies. Kabra [74] offers the criticism that high CSR levels do not necessarily align with good ESG practices, indicating a possible disconnect in corporate strategies. Bolibok [75] adds that firm size exhibits a nonlinear relationship with ESG risk, complicating accurate rating assessments. Kim et al. [76] emphasize that post-2019 methodological improvements have optimized ESG ratings’ predictive capacity from financial report texts, highlighting the constant evolution in measuring these parameters.
Chen et al. [70] significantly contribute to the study of ESG ratings and their effect on financial performance and market valuation. Despite advancements, a gap persists in understanding how variations in ESG risk ratings impact the dynamic relationship between cash flow and value creation in high capital intensity and operational risk sectors. Exploring these interactions across industrial sectors could provide insights to develop adaptive ESG strategies, enhancing risk management and fostering value creation in diverse business environments. This research aims to address this gap with the following hypotheses:
H1i.
The ESG risk rating positively influences investor value creation, indicating that better management of environmental, social, and governance risks is associated with greater value generation perceived by investors.
H1j.
The ESG risk rating moderates the relationship between cash flow and Investor Value Creation negatively. Specifically, as the ESG risk rating increases, indicating higher risks, the ability of cash flow to generate value for the investor decreases, reflecting an adverse impact of ESG risks on the effectiveness of cash flow in value creation.
3. Data and Methodology
3.1. Data Collection
The data collection for this study centered on a sample of 482 companies listed on the S&P 500, encompassing a broad range of sectors in the U.S. market. Researchers extracted financial information from the FINRA database (https://www.finra.org/finra-data, accessed on 20 March 2024), a trusted source offering detailed and current data on publicly traded companies. Additionally, they obtained ESG risk ratings from Sustainalytics (https://www.sustainalytics.com/esg-ratings, accessed on 20 March 2024), integrating sustainability measures into the analysis. The financial data from FINRA and the ESG risk ratings from Sustainalytics correspond to the year 2023, ensuring temporal alignment in the data used for the study. Morningstar Sustainalytics provided comprehensive evaluations on which the ESG risk ratings are based.
Table 1 offers a clear overview of the sectoral distribution of the analyzed companies, showing higher representation in critical sectors such as industrials (14.52%), technology (14.73%), and healthcare (13.07%). These sectors’ prominence reflects their importance within the economy and influence on market behavior. Conversely, sectors like basic materials and energy show lower representation, each accounting for approximately 4%, indicating their lesser weight in the S&P 500 index. The coherence of these sectoral data is crucial for analyzing the determinants of value creation from a holistic and multifaceted perspective.

Table 1.
Percentage composition of Companies according to Industry Type.
3.2. Measurement Instrument
Table 2 serves as a well-defined measurement tool to unravel the determinants of value creation for investors. It identifies and codes indicators for formative constructs like financial health, growth, and ESG risk rating alongside reflective constructs such as profitability and cash flow. The table includes investor value creation, comparing return on capital (ROC) with the weighted average cost of capital (WACC). This dual approach enables a comprehensive analysis, providing a rigorous assessment of a company’s efficiency in generating value on its capital, which is crucial for strategic investment decision-making. This structured framework thoroughly examines how various financial and sustainability factors influence overall investor value creation.
Table 2.
Composition of items by construct types.
In assessing ESG risk ratings, the study adopts a Likert scale ranging from 1 to 5, where each level corresponds to a specific risk category from “negligible” to “severe”. A score of “1” indicates “negligible” risk, while “5” indicates “severe” risk, facilitating a straightforward interpretation of a company’s ESG risk profile. A scale from 1 to 9 is employed for characterizing investment style, ranging from “small core” to “large growth”. This classification integrates the company’s size and strategic investment focus, offering a structured framework for categorization and analysis. This approach ensures clarity and precision in measuring and interpreting vital investment-related metrics.
4. Analysis of Data
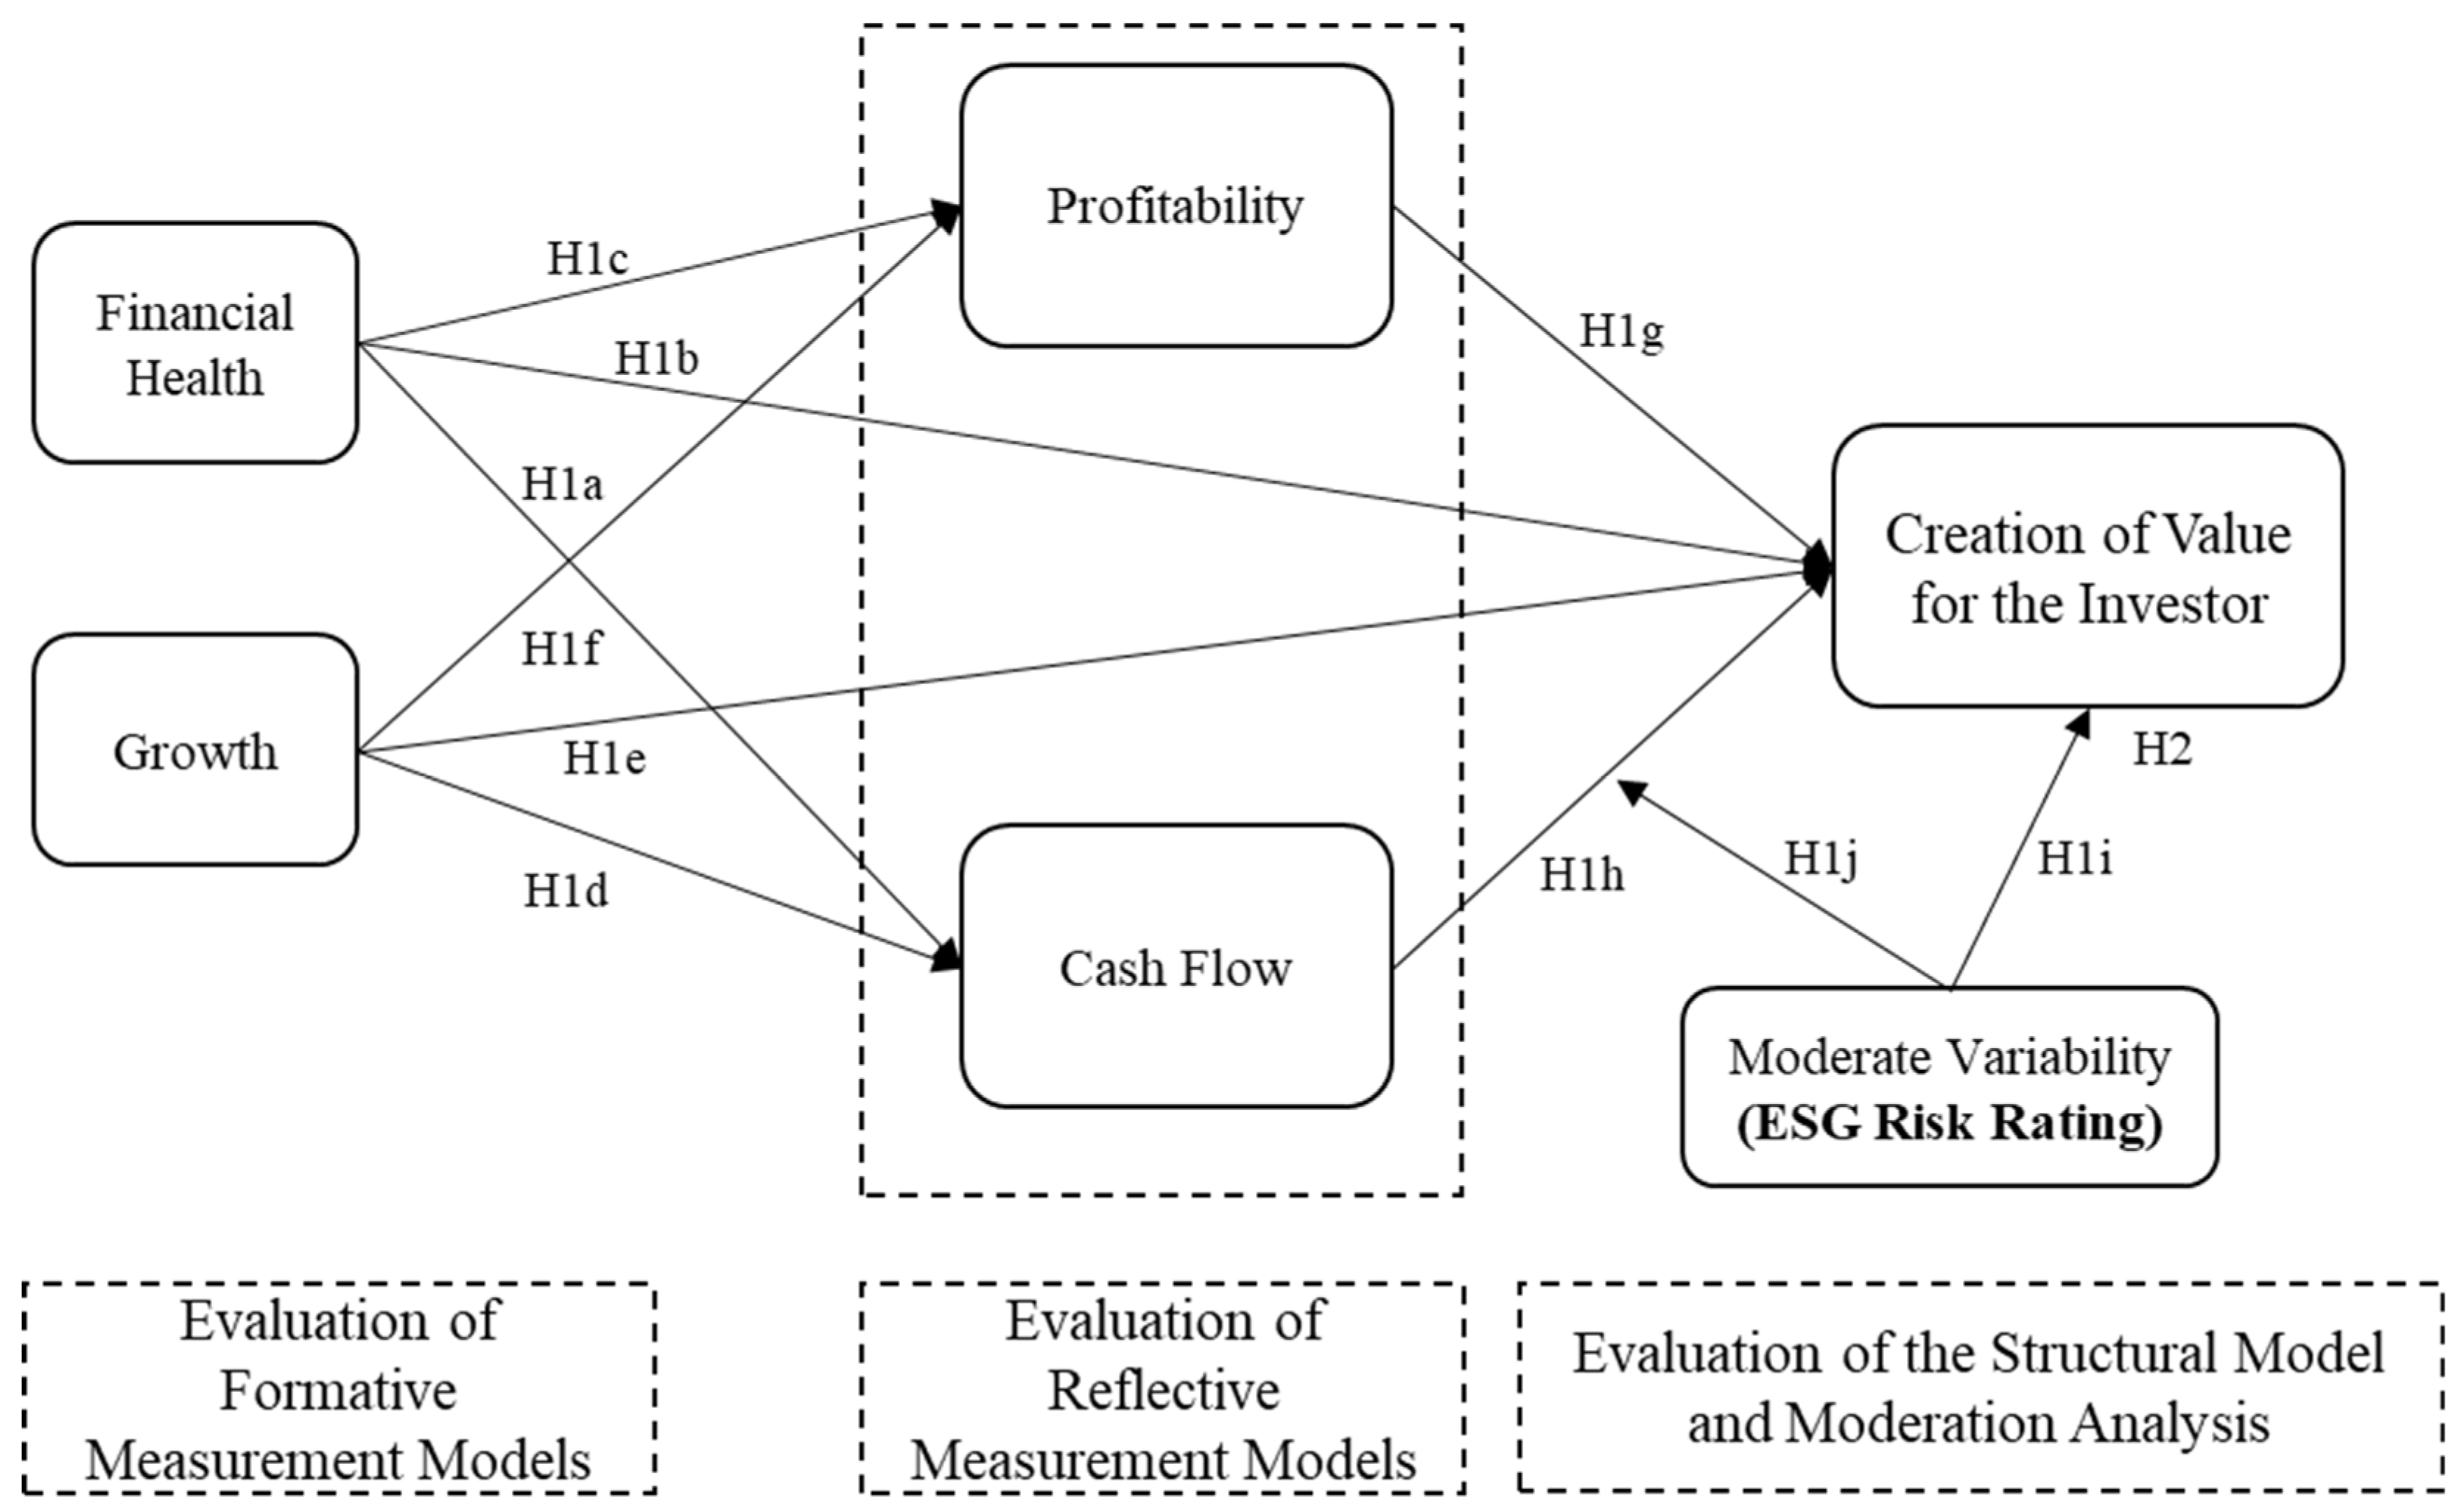
This study used the structural equation modeling (SEM) approach with the partial least squares (PLS) method to analyze the intricate relationships between the driving and reflected latent variables. This PLS-SEM method is particularly effective for models that integrate formative and reflective variables, allowing for a precise evaluation of the interactions within the study’s context. The structural model analysis, detailed in Figure 1, underscores the validity of both types of constructs. Employing the bootstrapping method with SmartPLS, the study conducted a robust statistical estimation supported by a substantial sample size of 10,000 iterations. This rigorous approach ensures a high-resolution interpretation of the data, providing credible and nuanced insights into the complex dynamics under investigation.

Figure 1.
Proposed Research Framework and Hypotheses.
Two-tailed tests rigorously examined the statistical significance of each proposed relationship in the model, using a significance threshold of 0.05 within the confidence interval of the bootstrap percentile. This methodological precision ensures a thorough analysis of the reciprocal influences between variables. Such an approach is crucial for the robustness of the results. The statistical framework thus provides a reliable basis for confirming or rejecting the study hypotheses, thereby consolidating the validity and reliability of the conclusions derived from the structural model.
5. Results
5.1. Analysis of the Formative Measurement Model
Table 3 presents significant results for the external weights test of formative constructs, highlighting the relationship among various indicators and aspects of financial health and growth and ESG risk ratings adjusted by cash flow. This detailed assessment elucidates each indicator’s underlying interactions and contributions, providing a comprehensive understanding of their impact on the constructs examined.
Table 3.
Formative Constructs Outer Weights Significance Testing Results.
For financial health, only two out of three indicators (FinHea_2 and FinHea_3) demonstrated statistical significance (p < 0.05), with p-values of 0.008 and 0.000, respectively, indicating that these components significantly contribute to financial health. In contrast, FinHea_1 did not show significance. All growth indicators (Grow_1, Grow_2, Grow_3) exhibited statistical significance with low p-values, reflecting a robust association with growth. Regarding the ESG risk rating, both indicators (esg_1 and esg_2) were significant, although esg_1 hurt ESG risk-adjusted for cash flow. The VIF values remained relatively low (<5), indicating the absence of severe multicollinearity issues. This analysis suggests that the selected indicators are valid predictors of their respective constructs, except FinHea_1.
5.2. Analysis of the Reflective Measurement Model
In Table 4, the analysis of the reflective measurement model identifies issues with convergence and consistency in the latent variables studied. Specifically, the “profitability” variable raises significant concerns. Although the Prof_1 indicator shows a high loading and adequate reliability, the other indicators (Prof_2 to Prof_5) present loadings and reliabilities below acceptable thresholds (>0.70 for loadings and >0.50 for indicator reliability). Consequently, the AVE is 0.383, well below the desired threshold of 0.50, indicating poor convergence of the indicators on the latent variable. Additionally, while Cronbach’s alpha and rho_a approach the recommended lower limit of 0.70, this does not compensate for the low AVE.
Table 4.
Results Summary for Reflective Measurement Models.
On the other hand, the indicators for “cash flow” and “creation of value for the investor” present a more positive picture. While CaFl_1 shows an unusually low loading and reliability, other “cash flow” indicators demonstrate satisfactory loadings and an AVE (0.534) that meets expectations. The indicators for “creation of value for the investor’ consistently surpass the established thresholds for loading and indicator reliability, achieving an AVE of 0.705, which indicates strong convergence and internal consistency. This is further supported by the adequate values of Cronbach’s alpha and composite reliability measures (rho_a and rho_c).
This analysis underscores the necessity to review or potentially replace the indicators for “profitability” to improve convergent validity and model reliability. In contrast, the constructs for “cash flow” and “creation of value for the investor” appear sturdy and reliable based on the established criteria. It is crucial to emphasize that detailed financial information has played a pivotal role in identifying the factors that influence value creation for investors, thereby highlighting the significance of financial metrics in evaluating performance and value generation within a business context.
5.3. Structural Model Analysis
Figure 2 and the structural model results underscore the critical dynamics between financial health and other vital financial indicators related to investor value creation. Notably, the negative and significant effect of financial health on cash flow (−0.135) suggests a strategy of accumulating cash reserves to indicate a robust financial position. Concurrently, both the positive impact of financial health (0.173) and an even more substantial effect of profitability (0.623) on investor value creation are significant. These findings underscore the importance investors place on a solid financial foundation and profitability in evaluating a company’s value.
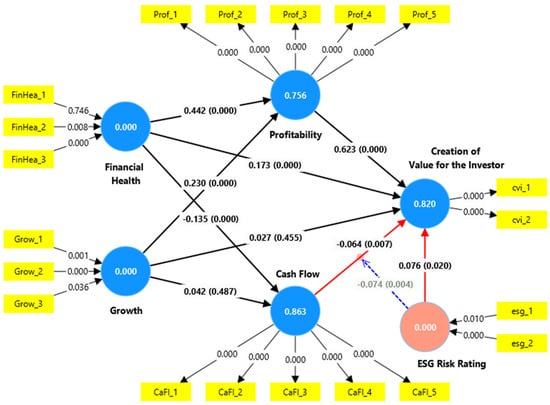
Figure 2.
Significance Testing Results of the Structural Model Path Coefficients.
Conversely, growth does not significantly affect cash flow or investor value creation, as indicated by p-values that do not meet the significance threshold (p > 0.05). This finding suggests that growth alone may not be a reliable short-term predictor for these financial aspects. Profitability, however, is a strong predictor of investor value creation, highlighting its critical role in investor valuation. Interestingly, cash flow negatively impacts value creation, implying that investors prefer reinvestment over liquidity. Additionally, the ESG risk rating and its interaction with cash flow significantly influence investor value creation, with positive and negative effects. This suggests that a better ESG risk rating is viewed favorably, but that when adjusted for cash flow, it may indicate higher risk or a less attractive investment prospect.
Table 5 details the total effects analysis from the structural model, demonstrating the significance and magnitude of independent variables’ influence on investor value creation. The findings reveal a direct and significant correlation between financial health and value creation, with a total positive effect of 0.456, underscoring that investors favorably perceive higher financial health. Furthermore, financial health is linked to increased profitability (total effect of 0.442) but negatively impacts cash flow (−0.135).
Table 5.
Significance Testing Results of the Structural Model Total Effects.
Regarding growth, its impact on profitability and investor value creation is significant, with total effects of 0.230 and 0.167, respectively. This indicates that investors consider growth a crucial indicator of future success. Profitability emerges as the most influential predictor with a total effect of 0.623, reinforcing the idea that profitability is central to value generation.
Interestingly, the total effect of cash flow on investor value creation is negative (−0.064). This may suggest a preference among investors for reinvestment over liquidity. Furthermore, the ESG risk rating has a positive influence (total effect of 0.076), while the interaction of ESG risk with cash flow shows a negative impact (−0.074). This could imply that high cash flows might lead to concerns about neglecting sustainable business practices. Overall, these total effects and their statistical significance provide valuable insights into the financial and sustainability factors that investors prioritize.
5.4. Analysis of the Moderating Variable
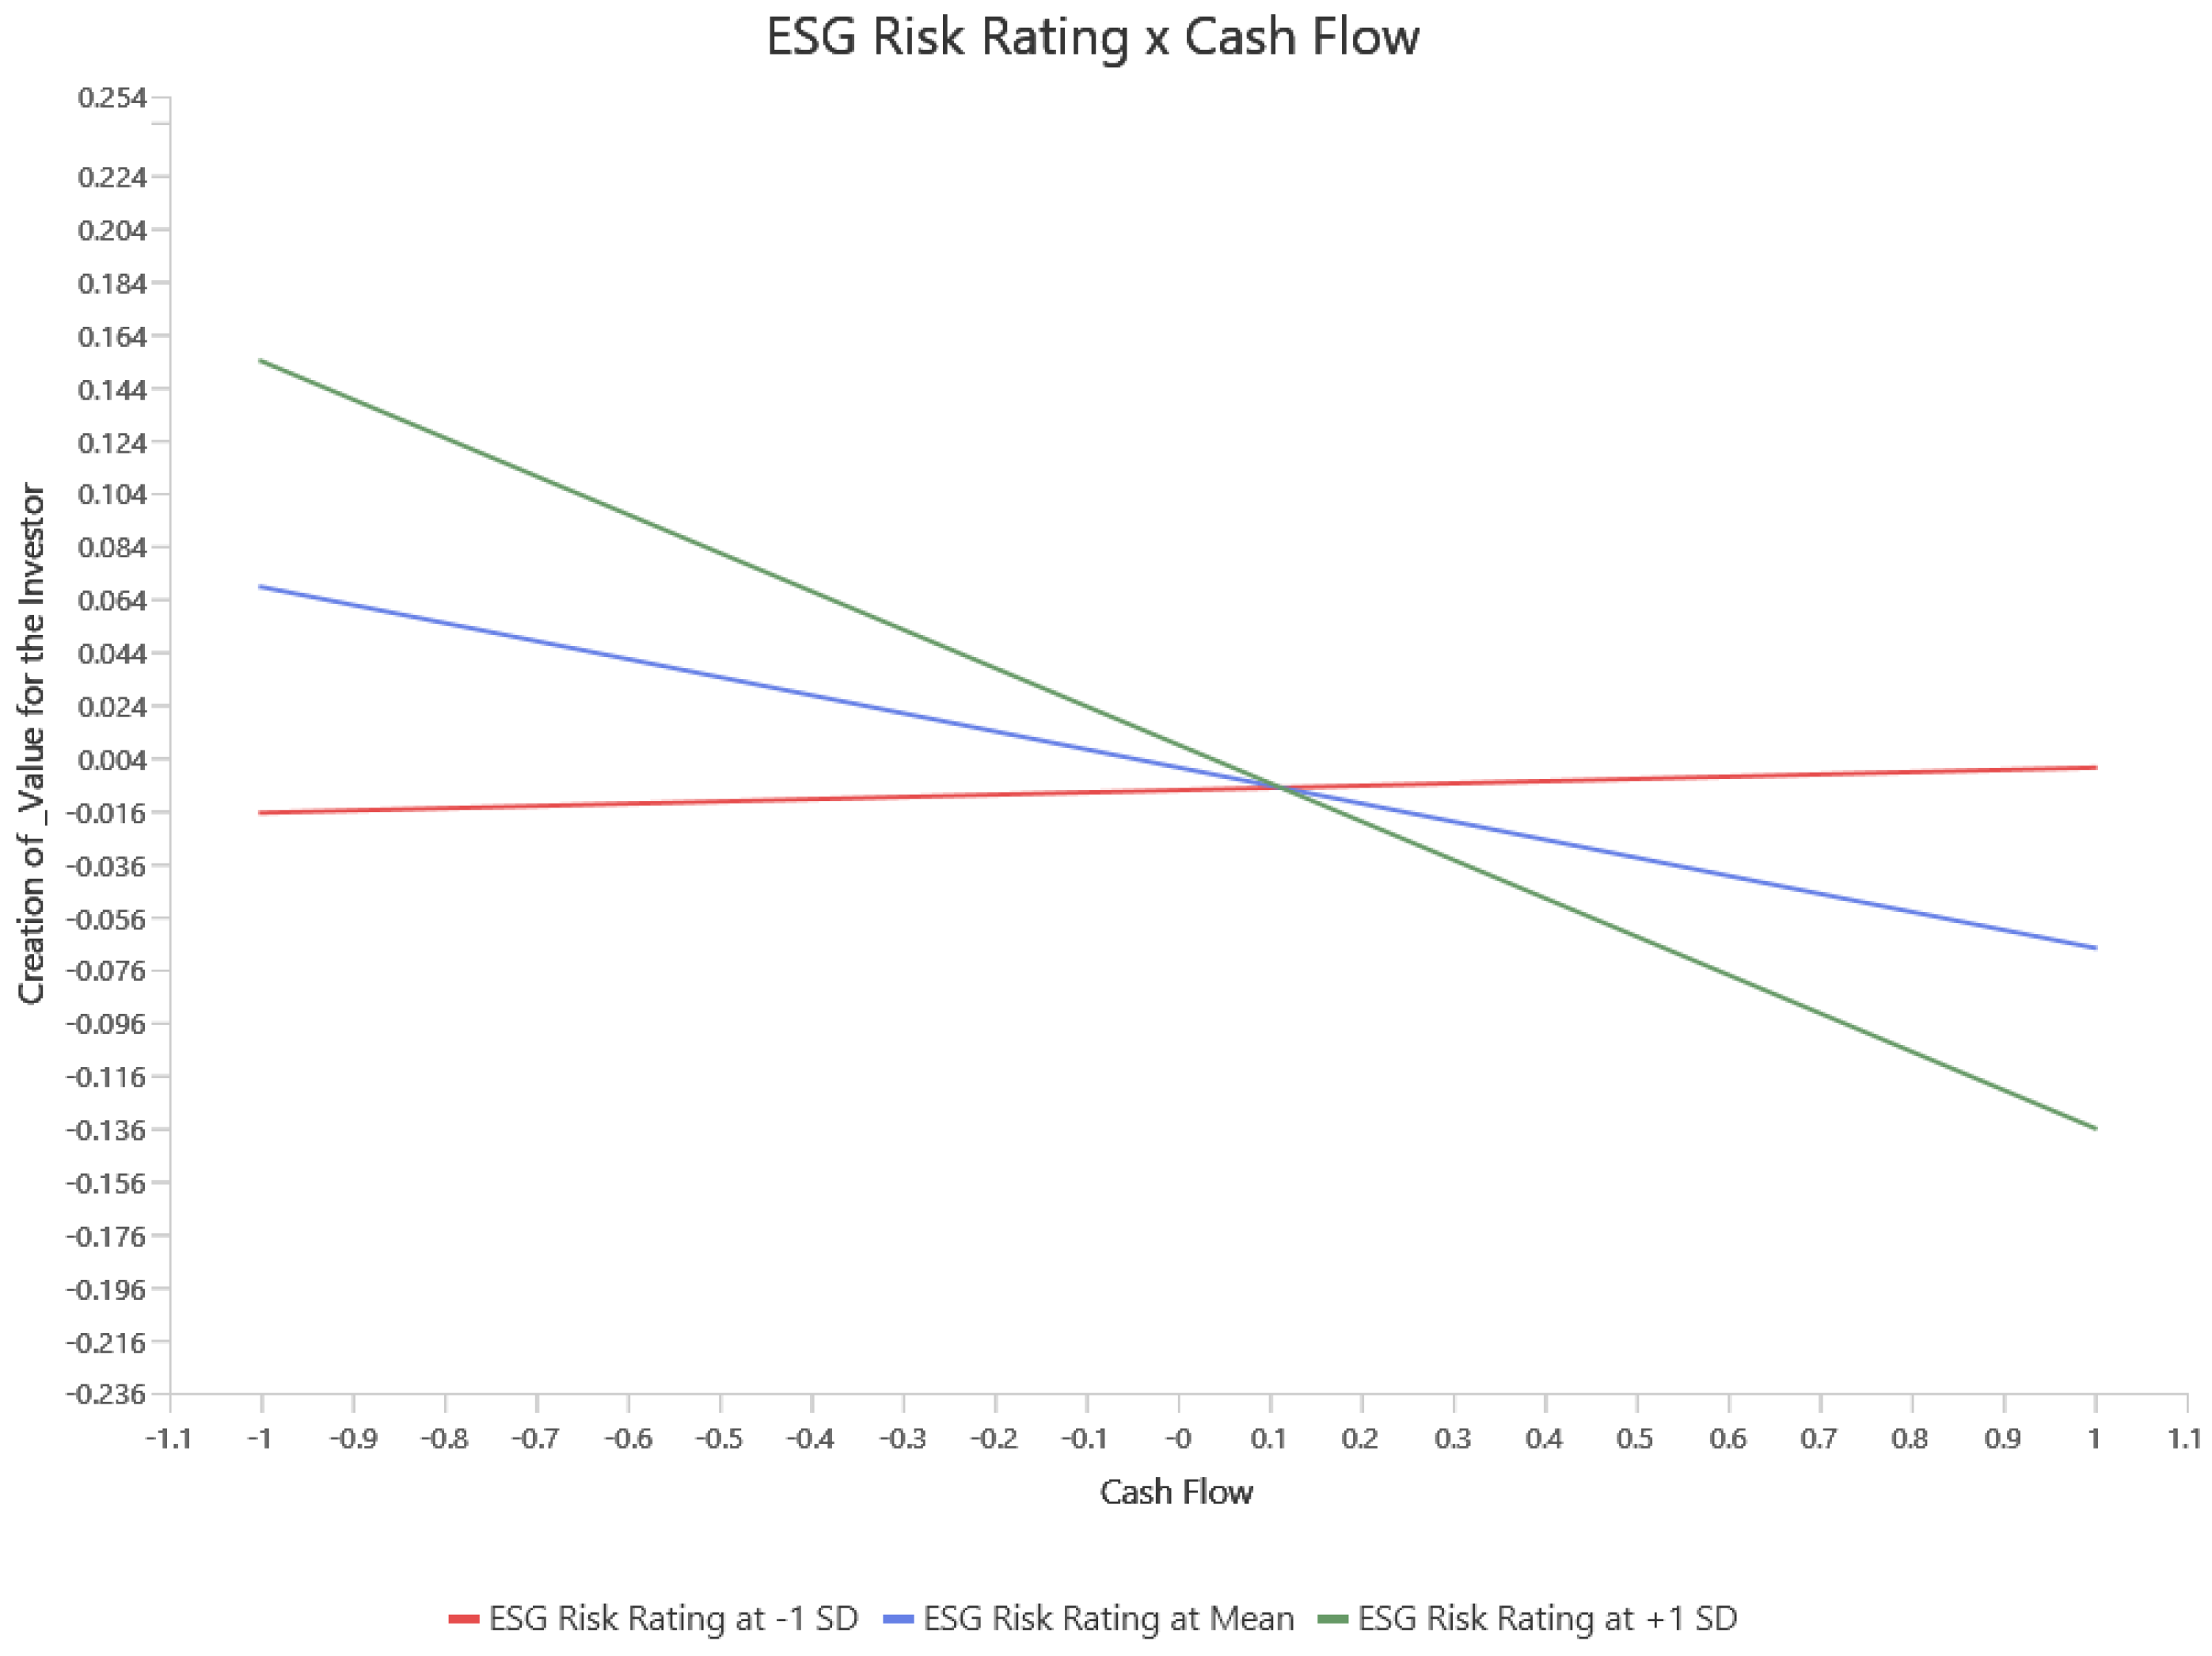
The simple slope illustrated in Figure 3, representing the moderation of ESG risk rating in the relationship between cash flow and investor value creation, reveals a significant interaction (B = −0.074, p = 0.004). This finding indicates that higher levels of ESG risk rating notably attenuate the impact of cash flow on value creation.
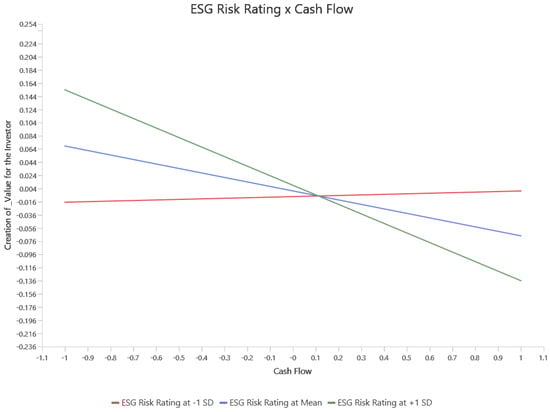
Figure 3.
Simple Slope Graph of ESG Risk Rating as a Moderating Variable.
Specifically, the slope of the cash flow–value creation relationship appears positive at low levels of ESG risk rating (red line), indicating a beneficial effect of cash flow on value creation. However, this slope flattens and becomes negative as the ESG risk rating increases, transitioning from a neutral effect at the mean (blue line) to a distinctly negative effect at high levels of ESG risk rating (green line). This trend suggests a decline in the effectiveness of cash flow in generating value under high-ESG-risk conditions. This phenomenon might be attributed to the need for more significant investments in sustainable practices or investors’ perception of increased risk. Therefore, the combined effect of cash flow and ESG risk rating on value creation for investors represents a complex interaction that intensifies negatively to −0.138 in the presence of a high ESG risk rating, highlighting the growing importance of ESG factors in contemporary financial decision-making.
6. Discussion
This study provides a detailed perspective on how financial health, growth, profitability, and ESG influence investor value creation. Confirming findings from previous research, such as those by Demirci et al. [8] and Valaskova et al. [1], it reaffirms the crucial importance of robust financial indicators, such as the quick ratio and current ratio, in assessing companies’ stability and growth potential. This approach aligns with the results regarding the significant influence of financial health on profitability and value creation.
Regarding growth, the research highlights that while it contributes to profitability, it only sometimes translates into value creation or cash flow. This dynamic resonates with the observations of Zahra [16] and Aigbedo [2] on how the perception of the external environment and business adaptability affect financial performance. The complexity of growth also echoes the studies by Smriti and Das [19] and Kamukama et al. [20], which link the development of human and intellectual capital with improvements in financial performance.
For ESG factors, findings such as those by Chen and Xie [5] and Billio et al. [61] suggest that ESG ratings can enhance financial performance. However, their effectiveness varies depending on economic circumstances and sectors. This variability is complemented by research from Giese et al. [58] and Dorfleitner et al. [63] indicating that ESG-based strategies can outperform peers in specific contexts. Additional studies by Zhou et al. [59] and Barko et al. [4] highlight how investor activism and sensitivity to ESG policies can catalyze significant changes in market perception and value creation.
Further studies by Kim et al. [76] reinforce the idea that high ESG ratings attract significant investments and enhance long-term financial performance. On the other hand, ESG risk ratings are pivotal for corporate evaluation and significantly impact management and investments across various industries. Hassan and Meyer [72] highlight that ESG risks alter demand in the tourism sector of Visegrád countries, and Gil [6] observes that environmental and social risks can diminish financial returns. Kabra [74] indicates that high levels of CSR do not always align with effective ESG practices, revealing discrepancies in corporate strategies. Bolibok [75] mentions that firm size nonlinearly affects the relationship with ESG risk, complicating its precise evaluation.
This study details how financial health, growth, profitability, and ESG factors influence investor value creation, underscoring the importance of integrating these dimensions into business management. It highlights that robust financial health is essential for increasing profitability (total effect = 0.442, p-value = 0.000) and enhancing the perception of value (total effect = 0.173, p-value = 0.000). However, although growth boosts profitability (total effect = 0.230, p-value = 0.000), it does not significantly improve cash flow (total effect = 0.042, p-value = 0.487) or immediate value creation (total effect = 0.027, p-value = 0.455), suggesting the need to align investor expectations with long-term growth strategies more effectively.
Additionally, the study indicates that profitability significantly impacts value creation (total effect = 0.623, p-value = 0.000). Still, the perception of cash flow is negative (total effect = −0.064, p-value = 0.007), highlighting investors’ preference for reinvestment over cash distributions. These findings reinforce the need to communicate clear reinvestment strategies that justify their contribution to future growth and value. The observations about the impact of ESG risk ratings on cash flow and value creation for investors require a more substantiated and detailed interpretation.
Firstly, it is necessary to consider that, without the moderating effect of ESG risks, cash flow indicators such as working capital, operating cash flow, investing cash flow, financing cash flow, and capital expenditure present a direct and less complex relationship with value creation (see Appendix A). However, when the moderating effect of ESG risk ratings is incorporated (see Figure 2), an additional layer of complexity significantly affects these indicators. For example, an increase in ESG risks generally raises operational and compliance costs, which can reduce working capital and operating cash flow, as suggested by the literature (Kaplan and Norton [77,78]; Bohldar [79]). Additionally, investment decisions may shift towards sustainable technologies, initially increasing investing cash flow costs but generating long-term value (Eccles et al. [80]). Similarly, the perception of high ESG risk can make financing more expensive, affecting financing cash flow (Freeman [81]). Finally, additional ESG compliance costs can impact capital expenditure and provide long-term benefits by improving corporate sustainability (Hart and Dowell [82]).
The research also validates the effectiveness of “creation of value for the investor” indicators, demonstrating high internal consistency (AVE = 0.705). On the other hand, ESG risk ratings show a moderately positive impact on value creation (total effect = 0.076, p-value = 0.020). However, their interaction with cash flow reveals a negative effect (total effect = −0.074, p-value = 0.004), highlighting how associated costs or risks may offset the benefits of sustainability practices. This underscores the importance of prudent management of sustainability strategies to ensure long-term economic viability and positive perception.
This research highlights future directions for exploring the interaction among financial health, growth, profitability, and ESG risk ratings. A critical line of inquiry is to examine how growth affects long-term cash flow across sectors to better understand the dynamics of expansion strategies. Additionally, it is essential to discuss in detail how ESG risk ratings affect investors’ perceptions of value and how companies can optimize sustainability costs without negatively impacting cash flow. Finally, studying the impact of communicating corporate strategies on investor perceptions could provide valuable insights into the influence of investor expectations on financial decisions. These approaches help companies develop strategies that maximize long-term value while effectively managing the risks and costs associated with ESG risk ratings.
A critical analysis of the results was conducted, identifying possible limitations. A significant limitation could be the need for more statistical significance in some effects, such as the impact of growth on value creation for investors and cash flow, which limits the generalization of our conclusions to broader contexts. Despite these limitations, it is crucial to highlight the identified strengths, such as the strong positive relationship between financial health and profitability, which support the overall robustness of our results and provide a solid basis for the conclusions. If another ESG evaluation methodology, such as Refinitiv, had been used, the results could have varied due to differences in the evaluation and weighting of ESG risks, underscoring the importance of the selected methodology in interpreting the results.
7. Conclusions
This study confirms that financial health, growth, profitability, and ESG influence investor value creation. The results demonstrate that solid financial health significantly enhances profitability and value perception, highlighting the importance of implementing prudent financial management as a central strategy to attract and retain investors. While growth increases profitability, it does not necessarily translate into immediate cash flow or short-term value creation, emphasizing the importance of managing investor expectations and effectively communicating long-term goals.
Profitability emerges as a critical factor affecting investor value, underscoring the need to maximize this indicator through operational improvements and cost-effective strategies. Additionally, ESG risk ratings positively affect value creation, with a total effect of 0.076 (p-value = 0.020). However, this impact is moderated negatively by the interaction with cash flow, showing a total effect of −0.074 (p-value = 0.004). This suggests that costs or risks associated with ineffective sustainability practices may attenuate the expected benefits. This finding underscores the necessity for companies to implement sustainability practices that are both beneficial and economically viable to sustain their competitiveness and appeal in the long run.
The original contribution of this article lies in applying ESG risk ratings as a moderating effect in analyzing cash flow and value creation for investors. This innovative approach, insufficiently explored in the existing literature, provides a deeper and more detailed understanding of how ESG risk ratings interact with crucial financial indicators. By integrating this moderating variable, the study offers a new perspective that fills a research gap and provides a more robust framework for evaluating the impact of ESG risk ratings on financial decisions and value creation for companies and investors. It is crucial to distinguish this work from other ESG studies focusing on sustainability practices implemented by companies. Unlike these studies, which do not include ESG risk ratings, this analysis uses ratings from Sustainalytics (https://www.sustainalytics.com/esg-ratings, accessed on 20 March 2024), allowing for the integration of sustainability measures into the analysis. As a result, this inclusion provides a more comprehensive and nuanced view of the impact of ESG risks on financial metrics and value creation.
The practical implications derived from the findings suggest several specific actions to improve a company’s image and value. Robust financial health is vital for enhancing profitability and attracting investors. Growth strategies should be carefully planned and communicated, emphasizing their long-term contribution. Maximizing profitability through optimizing operations and cost strategies should be a strategic priority. It is vital to communicate the strategy behind cash flow reinvestment, justify how it will contribute to future growth, and maintain high standards in value measurement quality. Additionally, a low ESG risk rating is beneficial, so companies should intensify sustainable practices and manage sustainability costs to minimize negative impacts on cash flow.
Funding
This research received no external funding.
Institutional Review Board Statement
Not applicable.
Informed Consent Statement
Not applicable.
Data Availability Statement
The data from FINRA and Sustainalytics, which are freely available on the websites https://www.finra.org/finra-data (accessed on 20 March 2024) and https://www.sustainalytics.com/esg-ratings (accessed on 20 March 2024), respectively, were used for this study.
Conflicts of Interest
The author declares unequivocally that there are no conflicts of interest with respect to the research presented in this paper. Throughout the course of this study entitled “Drivers of Value Creation and the Effect of ESG Risk Rating on Investor Perceptions through Financial Metrics”, the author has diligently and transparently adhered to the highest ethical standards, ensuring that the pursuit of knowledge and the dissemination of results remain the sole focus.
Appendix A
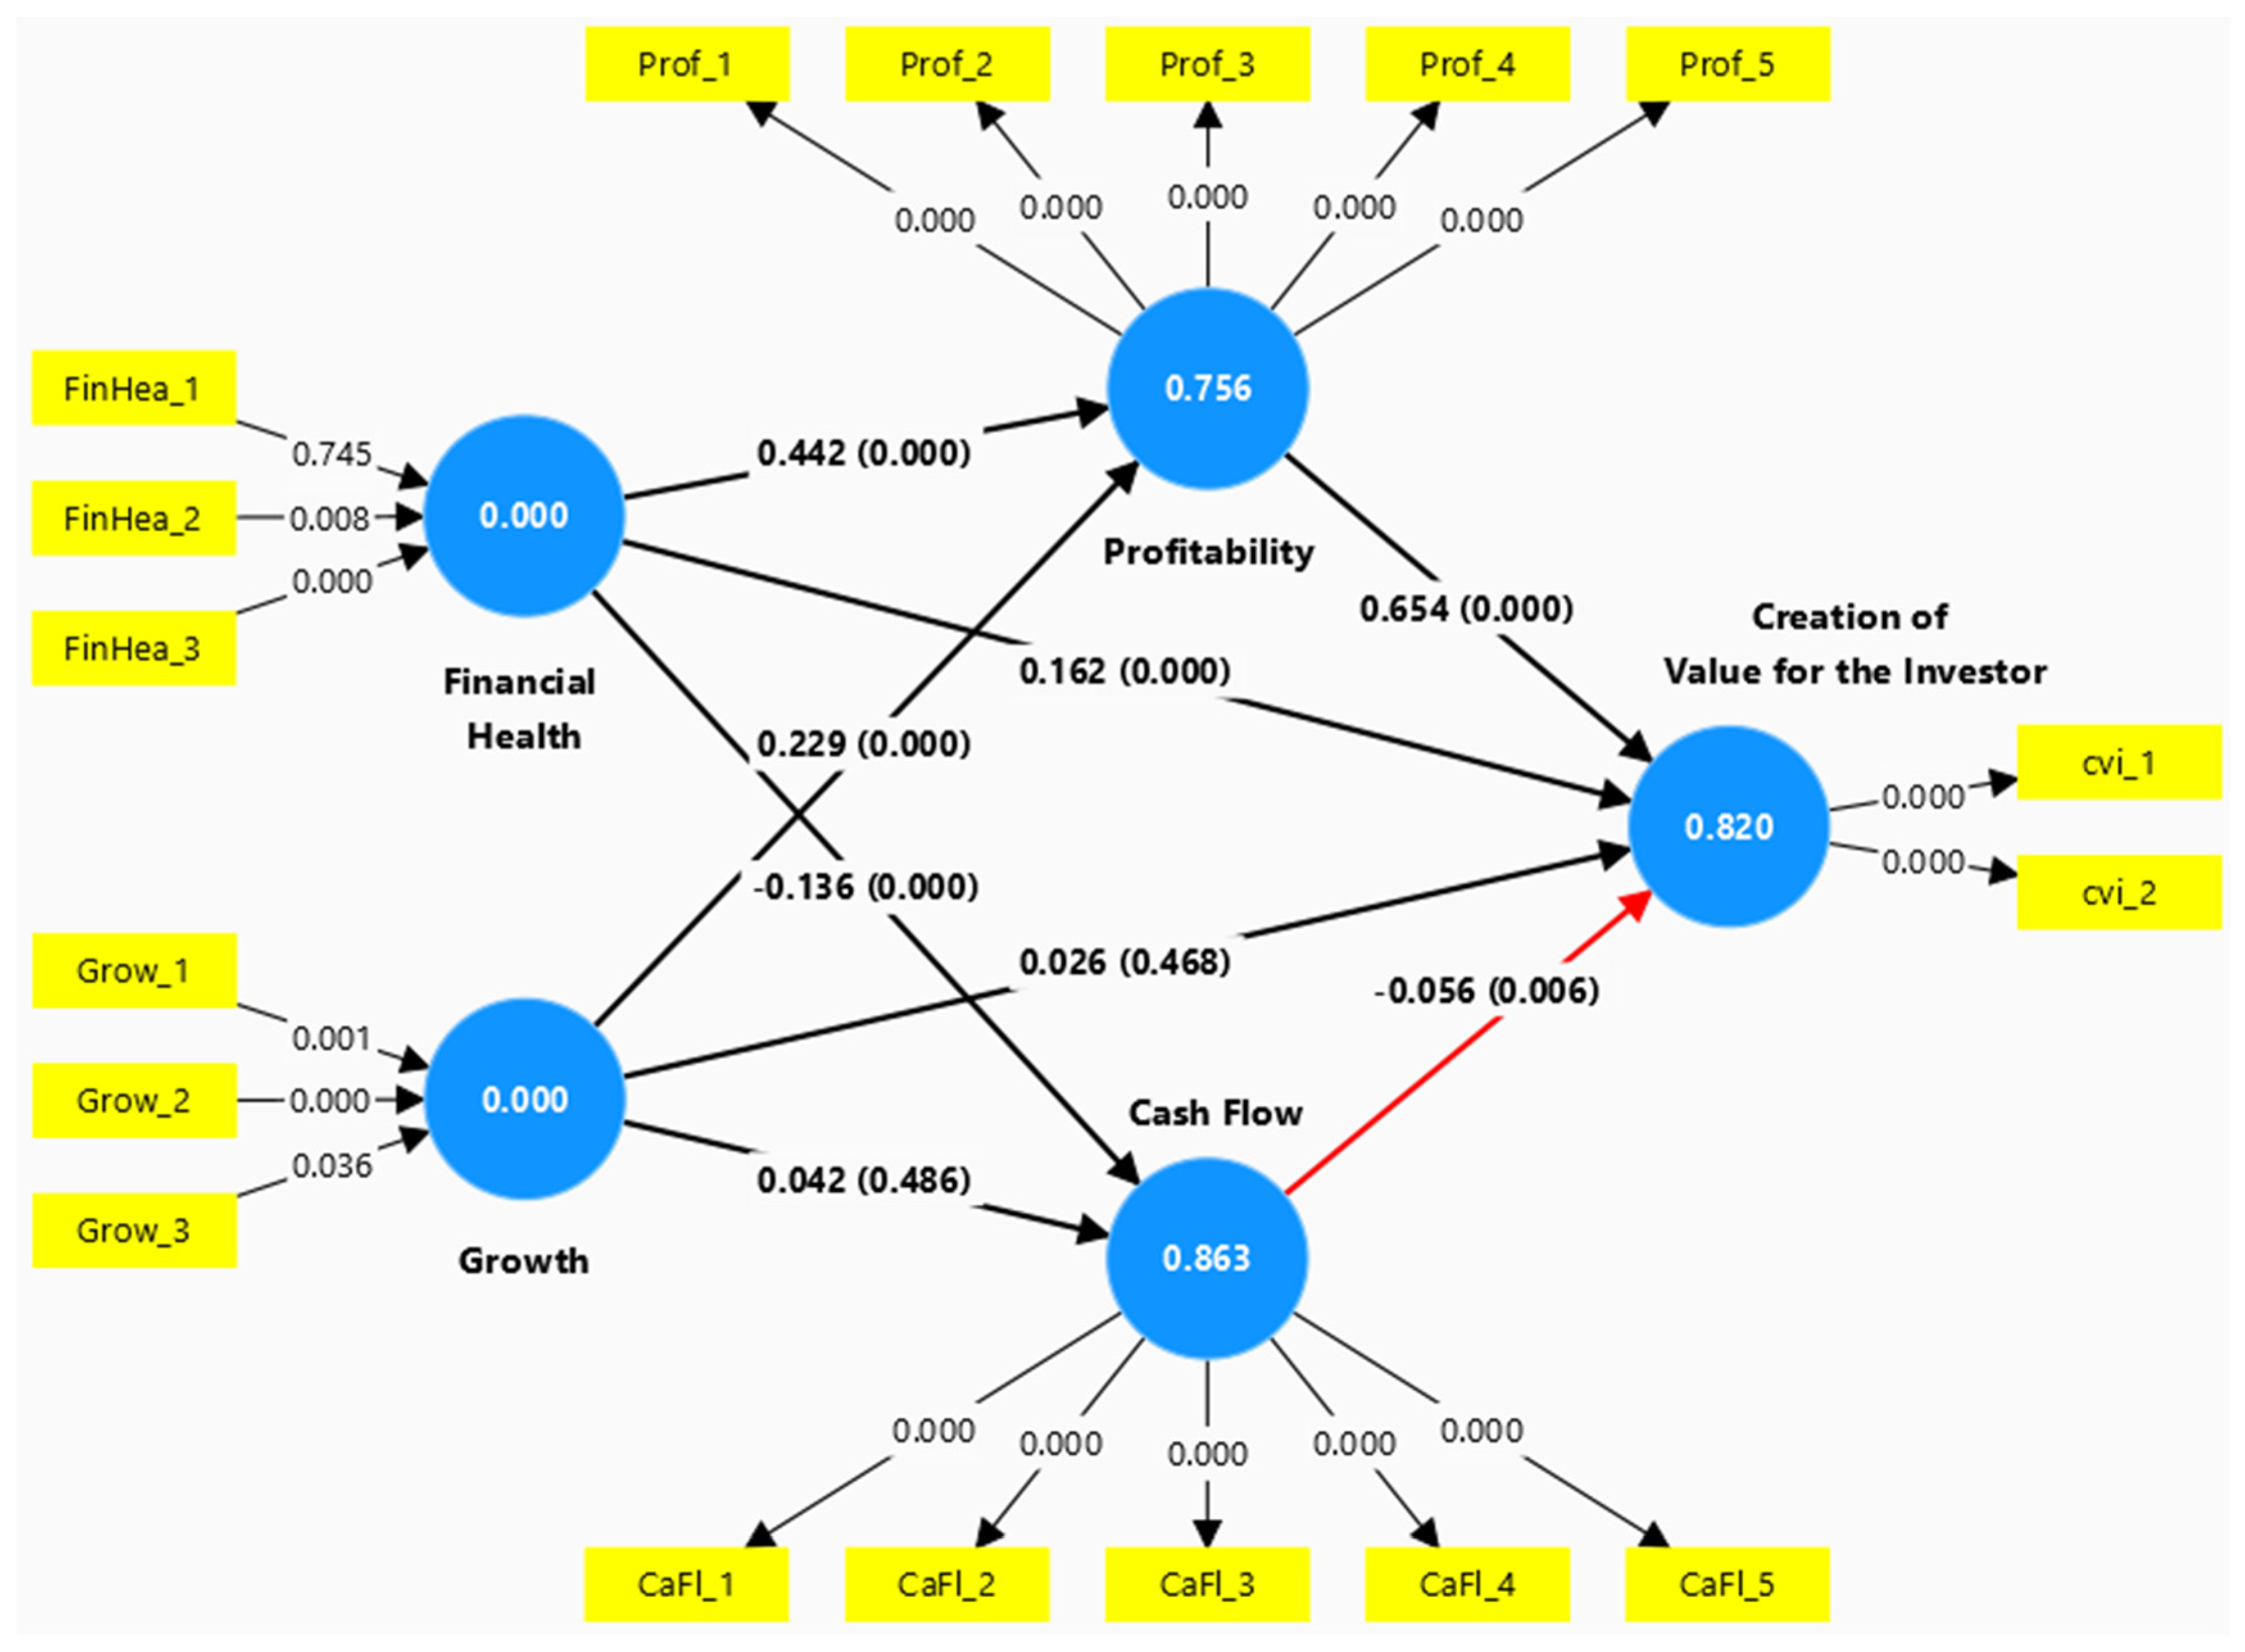
Figure A1 highlights a negative relationship between cash flow and investor value creation, influenced by various internal and external factors. The cash flow indicators considered include working capital, operating cash flow, investing cash flow, financing cash flow, and capital expenditure.
It is crucial to emphasize that external factors such as high inflation, elevated interest rates, and strict regulatory policies are already reflected in the 2023 financial indicator results of the latent variables, particularly in the cash flow indicators. These factors directly influence operating costs, access to financing, and investment decisions, affecting companies’ cash flows. Therefore, incorporating these factors into the analysis provides a more realistic and comprehensive view of the impact of ESG risk ratings on investor value creation.
The comparison between the scenarios in Figure A1 and Figure 2, with and without the moderating effect of the ESG risk rating, offers a clearer view of this dynamic. The estimation methods used, specifically SEM-PLS, have both advantages and disadvantages. Partial least squares structural equation modeling (SEM-PLS) helps handle complex models with multiple latent variables and indicators. According to Hair et al. [83], SEM-PLS is suitable for initial explorations and predictive models because it does not require strict normality assumptions in the data. However, one of its limitations is that it may have less power to detect causal relationships than other covariance-based SEM methods, as noted by Henseler [84]. Despite this limitation, the choice of SEM-PLS in this study is justified due to its ability to handle the complexity of the model and the interactions between variables.
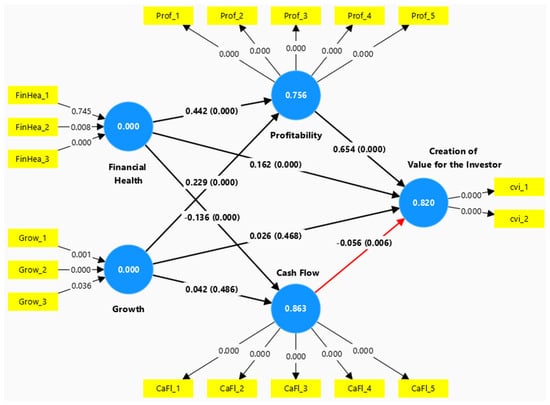
Figure A1.
Effect of Cash Flow on Value Creation for the Investor Without the Moderating Effect of ESG Risk Rating.
Figure A1.
Effect of Cash Flow on Value Creation for the Investor Without the Moderating Effect of ESG Risk Rating.
References
- Valaskova, K.; Kliestik, T.; Kovacova, M. Management of financial risks in Slovak enterprises using regression analysis. Oeconomia Copernic. 2018, 9, 105–121. [Google Scholar] [CrossRef]
- Aigbedo, H. An empirical analysis of the effect of financial performance on environmental performance of companies in global supply chains. J. Clean. Prod. 2021, 278, 121741. [Google Scholar] [CrossRef]
- In, S.Y.; Weyant, J.P.; Manav, B. Pricing climate-related risks of energy investments. Renew. Sustain. Energy Rev. 2022, 154, 111881. [Google Scholar] [CrossRef]
- Barko, T.; Cremers, M.; Renneboog, L. Shareholder Engagement on Environmental, Social, and Governance Performance. J. Bus. Ethics 2022, 180, 777–812. [Google Scholar] [CrossRef]
- Chen, Z.; Xie, G. ESG disclosure and financial performance: Moderating role of ESG investors. Int. Rev. Financ. Anal. 2022, 83, 102291. [Google Scholar] [CrossRef]
- Gil, C. What can we learn from the financial market about sustainability? Environ. Syst. Decis. 2022, 42, 1–7. [Google Scholar] [CrossRef]
- Pavlicko, M.; Durica, M.; Mazanec, J. Ensemble model of the financial distress prediction in visegrad group countries. Mathematics 2021, 9, 1886. [Google Scholar] [CrossRef]
- Demirci, I.; Eichholtz, P.; Yönder, E. Corporate Diversification and the Cost of Debt: Evidence from REIT Bank Loans and Mortgages. J. Real Estate Financ. Econ. 2020, 61, 316–368. [Google Scholar] [CrossRef]
- Gupta, R.; Jatav, S.; Prakash, G. Does management of working capital enhance firm value? Empirical analysis of manufacturing enterprises in India. Invest. Manag. Financ. Innov. 2023, 20, 224–237. [Google Scholar] [CrossRef]
- An, S.-B.; Yoon, K.-C. The Effects of Changes in Financial Performance on Value Creation in Digital Transformation: A Comparison with Undigitalized Firms. Sustainability 2023, 15, 2083. [Google Scholar] [CrossRef]
- Sfakianakis, E. Bankruptcy prediction model for listed companies in Greece. Invest. Manag. Financ. Innov. 2021, 18, 166–180. [Google Scholar] [CrossRef]
- Yakymova, L.; Kuz, V. The use of discriminant analysis in the assessment of municipal company’s financial health. Econ. Sociol. 2019, 12, 64–78. [Google Scholar] [CrossRef]
- Yousaf, M.; Bris, P. Assessment of bankruptcy risks in Czech companies using regression analysis. Probl. Perspect. Manag. 2021, 19, 46–55. [Google Scholar] [CrossRef] [PubMed]
- Zhu, W.; Tian, Y.; Hu, X.; Ku, Q.; Dai, X. Research on relationship between government innovation funding and firms value creation using clustering-rough sets. Kybernetes 2020, 49, 578–600. [Google Scholar] [CrossRef]
- Jenčová, S.; Štefko, R.; Vašaničová, P. Scoring model of the financial health of the electrical engineering industry’s non-financial corporations. Energies 2020, 13, 4364. [Google Scholar] [CrossRef]
- Zahra, S.A. Environment, corporate entrepreneurship, and financial performance: A taxonomic approach. J. Bus. Ventur. 1993, 8, 319–340. [Google Scholar] [CrossRef]
- Zahra, S.A.; Hayton, J.C. The effect of international venturing on firm performance: The moderating influence of absorptive capacity. J. Bus. Ventur. 2008, 23, 195–220. [Google Scholar] [CrossRef]
- Laforet, S. A framework of organisational innovation and outcomes in SMEs. Int. J. Entrep. Behav. Res. 2011, 17, 380–408. [Google Scholar] [CrossRef]
- Smriti, N.; Das, N. The impact of intellectual capital on firm performance: A study of Indian firms listed in COSPI. J. Intellect. Cap. 2018, 19, 935–964. [Google Scholar] [CrossRef]
- Kamukama, N.; Ahiauzu, A.; Ntayi, J.M. Competitive advantage: Mediator of intellectual capital and performance. J. Intellect. Cap. 2011, 12, 152–164. [Google Scholar] [CrossRef]
- Fry, L.W.; Cohen, M.P. Spiritual leadership as a paradigm for organizational transformation and recovery from extended work hours cultures. J. Bus. Ethics 2009, 84, 265–278. [Google Scholar] [CrossRef]
- O’reilly, C.A.; Caldwell, D.F.; Chatman, J.A.; Doerr, B. The Promise and Problems of Organizational Culture: CEO Personality, Culture, and Firm Performance. Group Organ. Manag. 2014, 39, 595–625. [Google Scholar] [CrossRef]
- Pohle, G.; Chapman, M. IBM’s global CEO report 2006: Business model innovation matters. Strategy Leadersh. 2006, 34, 34–40. [Google Scholar] [CrossRef]
- Bontis, N.; Janošević, S.; Dženopoljac, V. Intellectual capital in serbia’s hotel industry. Int. J. Contemp. Hosp. Manag. 2015, 27, 1365–1384. [Google Scholar] [CrossRef]
- Brazel, J.F.; Jones, K.L.; Zimbelman, M.F. Using nonfinancial measures to assess fraud risk. J. Account. Res. 2009, 47, 1135–1166. [Google Scholar] [CrossRef]
- Swink, M.; Schoenherr, T. The effects of cross-functional integration on profitability, process efficiency, and asset productivity. J. Bus. Logist. 2015, 36, 69–87. [Google Scholar] [CrossRef]
- Olson, D.; Zoubi, T. Convergence in bank performance for commercial and Islamic banks during and after the Global Financial Crisis. Q. Rev. Econ. Financ. 2017, 65, 71–87. [Google Scholar] [CrossRef]
- Boisjoly, R.P.; Conine, T.E.; McDonald, M.B. Working capital management: Financial and valuation impacts. J. Bus. Res. 2020, 108, 1–8. [Google Scholar] [CrossRef]
- Ganda, F. Carbon performance, company financial performance, financial value, and transmission channel: An analysis of South African listed companies. Environ. Sci. Pollut. Res. 2022, 29, 28166–28179. [Google Scholar] [CrossRef]
- Saidat, Z.; Silva, M.; Seaman, C. The relationship between corporate governance and financial performance: Evidence from Jordanian family and nonfamily firms. J. Fam. Bus. Manag. 2019, 9, 54–78. [Google Scholar] [CrossRef]
- Garcia-Blandon, J.; Castillo-Merino, D.; Chams, N. Sustainable development: The stock market’s view of environmental policy. Bus. Strategy Environ. 2020, 29, 3273–3285. [Google Scholar] [CrossRef]
- Amenc, N.; Goltz, F.; Luyten, B. Intangible capital and the value factor: Has your value definition just expired? J. Portf. Manag. 2020, 46, 83–99. [Google Scholar] [CrossRef]
- Ong, C.Z.; Mohd-Rashid, R.; Taufil-Mohd, K.N. IPO valuation using the price-multiple methods: Evidence from Malaysia. J. Financ. Report. Account. 2020, 19, 540–570. [Google Scholar] [CrossRef]
- Joshi, H.; Chauhan, R. Determinants of Price Multiples for Technology Firms in Developed and Emerging Markets: Variable Selection Using Shrinkage Algorithm. Vision 2024, 28, 55–66. [Google Scholar] [CrossRef]
- Calhoun, G. Price and Value: A Guide to Equity Market Valuation Metrics. In Price and Value: A Guide to Equity Market Valuation Metrics; Apress: New York, NY, USA, 2020. [Google Scholar] [CrossRef]
- Batrancea, L. Stock market price and company performance between two major downturns: The financial crisis and the COVID-19 pandemic. In Impact of Infodemic on Organizational Performance; IGI Global: Hershey, PA, USA, 2021. [Google Scholar] [CrossRef]
- Xiao, Y.; Zhao, X.; Wu, Y. Research and Optimazation on Evaluation Index Prediction Using Grey Neural Network and Big Data. In Proceedings of the 2021 IEEE International Conference on Electronic Technology, Communication and Information, Changchun, China, 27–29 August 2021; pp. 233–237. [Google Scholar] [CrossRef]
- Yuliani, R.; Saudi, M.H.; Sinaga, O. Of Intrinsic Value Relative Valuation Techniques: Specific Geographical Review on Listed Companies (Overvalued, Undervalued or Fairvalued) In Indonesia Stock Exchange-30. Rev. Int. Geogr. Educ. Online 2021, 11, 767–773. [Google Scholar] [CrossRef]
- Megaravalli, A.V.; Sampagnaro, G. Predicting the growth of high-growth SMEs: Evidence from family business firms. J. Fam. Bus. Manag. 2019, 9, 98–109. [Google Scholar] [CrossRef]
- Deng, L.; Zhao, Y. Investment Lag, Financially Constraints and Company Value—Evidence from China. Emerg. Mark. Financ. Trade 2022, 58, 3034–3047. [Google Scholar] [CrossRef]
- Al-Nasser Abdallah, A.; Abdallah, W.; Saad, M. Institutional characteristics, investment sensitivity to cash flow and Tobin’s q: Evidence from the Middle East and North Africa region. Int. Financ. 2020, 23, 324–339. [Google Scholar] [CrossRef]
- Devine, A.; Yönder, E. Impact of Environmental Investments on Corporate Financial Performance: Decomposing Valuation and Cash Flow Effects. J. Real Estate Financ. Econ. 2023, 66, 778–805. [Google Scholar] [CrossRef]
- Li, H.; Ryan, H.E. Founding family ownership and firm performance: Evidence from the evolution of family ownership and firm policies. J. Bus. Financ. Account. 2022, 49, 1391–1424. [Google Scholar] [CrossRef]
- Wen, Y.; Tikoo, S. Corporate strategy uniqueness, analyst herding, and financing constraints. Strateg. Organ. 2022, 20, 368–388. [Google Scholar] [CrossRef]
- Bergmann, P.; Kamarás, E.; Gleißner, W.; Guenther, E. Enhanced cash flow valuation in real estate management by integrating innovative materials and risk assessment. Sustainability 2020, 12, 2201. [Google Scholar] [CrossRef]
- Czerwonka, L.; Jaworski, J. Determinants of working capital management in small and medium enterprises: Evidence from Central and Eastern Europe. J. Int. Stud. 2023, 16, 162–180. [Google Scholar] [CrossRef]
- Hull, R.M. Credit ratings and firm value. Invest. Manag. Financ. Innov. 2020, 17, 157–168. [Google Scholar] [CrossRef]
- Atan, R.; Alam, M.; Said, J.; Zamri, M. The impacts of environmental, social, and governance factors on firm performance: Panel study of Malaysian companies. Manag. Environ. Qual. Int. J. 2018, 29, 182–194. [Google Scholar] [CrossRef]
- Gangi, F.; Mustilli, M.; Varrone, N. The impact of corporate social responsibility (CSR) knowledge on corporate financial performance: Evidence from the European banking industry. J. Knowl. Manag. 2019, 23, 110–134. [Google Scholar] [CrossRef]
- Visnjic, I.; Neely, A.; Jovanovic, M. The path to outcome delivery: Interplay of service market strategy and open business models. Technovation 2018, 72–73, 46–59. [Google Scholar] [CrossRef]
- Farza, K.; Ftiti, Z.; Hlioui, Z.; Louhichi, W.; Omri, A. Does it pay to go green? The environmental innovation effect on corporate financial performance. J. Environ. Manag. 2021, 300, 113695. [Google Scholar] [CrossRef]
- Zhou, X.; Cui, Y. Green bonds, corporate performance, and corporate social responsibility. Sustainability 2019, 11, 6881. [Google Scholar] [CrossRef]
- Hoang, T.; Przychodzen, W.; Przychodzen, J.; Segbotangni, E.A. Does it pay to be green? A disaggregated analysis of U.S. firms with green patents. Bus. Strategy Environ. 2020, 29, 1331–1361. [Google Scholar] [CrossRef]
- Jyoti, G.; Khanna, A. Does sustainability performance impact financial performance? Evidence from Indian service sector firms. Sustain. Dev. 2021, 29, 1086–1095. [Google Scholar] [CrossRef]
- Pham, D.C.; Do, T.N.A.; Doan, T.N.; Nguyen, T.X.H.; Pham, T.K.Y. The impact of sustainability practices on financial performance: Empirical evidence from Sweden. Cogent Bus. Manag. 2021, 8, 1912526. [Google Scholar] [CrossRef]
- Tan, Y.; Zhu, Z. The effect of ESG rating events on corporate green innovation in China: The mediating role of financial constraints and managers’ environmental awareness. Technol. Soc. 2022, 68, 101906. [Google Scholar] [CrossRef]
- Said, M.T.; ElBannan, M.A. Do ESG ratings and COVID-19 severity score predict stock behavior and market perception? Evidence from emerging markets. Rev. Account. Financ. 2024, 23, 222–255. [Google Scholar] [CrossRef]
- Giese, G.; Lee, L.-E.; Melas, D.; Nagy, Z.; Nishikawa, L. Foundations of esg investing: How esgaffects equity valuation, risk, and performance. J. Portf. Manag. 2019, 45, 69–83. [Google Scholar] [CrossRef]
- Zhou, G.; Liu, L.; Luo, S. Sustainable development, ESG performance and company market value: Mediating effect of financial performance. Bus. Strategy Environ. 2022, 31, 3371–3387. [Google Scholar] [CrossRef]
- Landi, G.; Sciarelli, M. Towards a more ethical market: The impact of ESG rating on corporate financial performance. Soc. Responsib. J. 2019, 15, 11–27. [Google Scholar] [CrossRef]
- Billio, M.; Costola, M.; Hristova, I.; Latino, C.; Pelizzon, L. Inside the ESG ratings: (Dis)agreement and performance. Corp. Soc. Responsib. Environ. Manag. 2021, 28, 1426–1445. [Google Scholar] [CrossRef]
- Folger-Laronde, Z.; Pashang, S.; Feor, L.; ElAlfy, A. ESG ratings and financial performance of exchange-traded funds during the COVID-19 pandemic. J. Sustain. Financ. Invest. 2022, 12, 490–496. [Google Scholar] [CrossRef]
- Dorfleitner, G.; Kreuzer, C.; Sparrer, C. ESG controversies and controversial ESG: About silent saints and small sinners. J. Asset Manag. 2020, 21, 393–412. [Google Scholar] [CrossRef]
- Popescu, I.-S.; Hitaj, C.; Benetto, E. Measuring the sustainability of investment funds: A critical review of methods and frameworks in sustainable finance. J. Clean. Prod. 2021, 314, 128016. [Google Scholar] [CrossRef]
- Dmuchowski, P.; Dmuchowski, W.; Baczewska-Dąbrowska, A.H.; Gworek, B. Environmental, social, and governance (ESG) model; impacts and sustainable investment—Global trends and Poland’s perspective. J. Environ. Manag. 2023, 329, 117023. [Google Scholar] [CrossRef] [PubMed]
- Linnenluecke, M.K. Environmental, social and governance (ESG) performance in the context of multinational business research. Multinatl. Bus. Rev. 2022, 30, 1–16. [Google Scholar] [CrossRef]
- Li, C.; Ba, S.; Ma, K.; Xu, Y.; Huang, W.; Huang, N. ESG Rating Events, Financial Investment Behavior and Corporate Innovation. Econ. Anal. Policy 2023, 77, 372–387. [Google Scholar] [CrossRef]
- Sandberg, H.; Alnoor, A.; Tiberius, V. Environmental, social, and governance ratings and financial performance: Evidence from the European food industry. Bus. Strategy Environ. 2023, 32, 2471–2489. [Google Scholar] [CrossRef]
- Al Amosh, H.; Khatib, S.F.; Ananzeh, H. Environmental, social and governance impact on financial performance: Evidence from the Levant countries. Corp. Gov. 2023, 23, 493–513. [Google Scholar] [CrossRef]
- Chen, S.; Song, Y.; Gao, P. Environmental, social, and governance (ESG) performance and financial outcomes: Analyzing the impact of ESG on financial performance. J. Environ. Manag. 2023, 345, 118829. [Google Scholar] [CrossRef]
- Patel, P.C.; Pearce, J.A., II; Oghazi, P. Not so myopic: Investors lowering short-term growth expectations under high industry ESG-sales-related dynamism and predictability. J. Bus. Res. 2021, 128, 551–563. [Google Scholar] [CrossRef]
- Hassan, A.S.; Meyer, D.F. Does countries’ environmental, social and governance (ESG) risk rating influence international tourism demand? A case of the Visegrád Four. J. Tour. Futures 2022, 1–20. [Google Scholar] [CrossRef]
- Pishchalkina, I.; Pishchalkin, D.; Suloeva, S. Research of the Efficiency of Mining and Metallurgical Enterprises Based on the Environmental, Social, and Governance Risk Rating in the Context of Digital Transformation. Int. J. Technol. 2022, 13, 1442–1451. [Google Scholar] [CrossRef]
- Kabra, A. Locating the future of ESG in India’s present sustainability framework. Asian J. Bus. Ethics 2024, 13, 137–173. [Google Scholar] [CrossRef]
- Bolibok, P.M. Does Firm Size Matter for ESG Risk? Cross-Sectional Evidence from the Banking Industry. Sustainability 2024, 16, 679. [Google Scholar] [CrossRef]
- Kim, M.G.; Kim, K.S.; Lee, K.C. Analyzing the Effects of Topics Underlying Companies’ Financial Disclosures about Risk Factors on Prediction of ESG Risk Ratings: Emphasis on BERTopic. In Proceedings of the 2022 IEEE International Conference on Big Data (Big Data), Osaka, Japan, 17–20 December 2022; pp. 4520–4527. [Google Scholar] [CrossRef]
- Kaplan, R.S.; Norton, D.P. The balanced scorecard—Measures that drive performance. Harv. Bus. Rev. 1992, 70, 71–79. Available online: https://hbr.org/1992/01/the-balanced-scorecard-measures-that-drive-performance-2 (accessed on 5 May 2024). [PubMed]
- Kaplan, R.S.; Norton, D.P. The balanced scorecard: Measures That drive performance. Harv. Bus. Rev. 2005, 83, 172–180. Available online: https://www.researchgate.net/publication/298043780_The_Balanced_Scorecard_measures_that_drive_performance (accessed on 5 May 2024).
- Bohldar, N. Strategy and society: The link between competitive advantage and corporate social responsibility. Harv. Bus. Rev. 2007, 85, 136. [Google Scholar]
- Eccles, R.G.; Ioannou, I.; Serafeim, G. The impact of corporate sustainability on organizational processes and performance. Manag. Sci. 2014, 60, 2835–2857. [Google Scholar] [CrossRef]
- Freeman, R.E. Strategic Management: A Stakeholder Approach; Cambridge University Press: Cambridge, UK, 2015. [Google Scholar] [CrossRef]
- Hart, S.L.; Dowell, G. A natural-resource-based view of the firm: Fifteen years after. J. Manag. 2011, 37, 1464–1479. [Google Scholar] [CrossRef]
- Hair, J.J.F.; Hult, G.T.M.; Ringle, C.M.; Sarstedt, M. A Primer on Partial Least Squares Structural Equation Modeling (PlS-SEM), 3rd ed.; SAGE Publications Inc.: Thousand Oaks, CA, USA, 2021. [Google Scholar]
- Henseler, J. Partial least squares path modeling. Adv. Methods Model. Mark. 2017, 1, 361–381. [Google Scholar]

Disclaimer/Publisher’s Note: The statements, opinions and data contained in all publications are solely those of the individual author(s) and contributor(s) and not of MDPI and/or the editor(s). MDPI and/or the editor(s) disclaim responsibility for any injury to people or property resulting from any ideas, methods, instructions or products referred to in the content. |
© 2024 by the author. Licensee MDPI, Basel, Switzerland. This article is an open access article distributed under the terms and conditions of the Creative Commons Attribution (CC BY) license (https://creativecommons.org/licenses/by/4.0/).