Article

Can Pilot Free Trade Zones Promote Sustainable Growth in Urban Innovation?

1
Graduate School, Yunnan University of Finance and Economics, Kunming 650221, China
2
School of Economics, Yunnan University of Finance and Economics, Kunming 650221, China
*
Author to whom correspondence should be addressed.
Sustainability 2024, 16(13), 5360; https://doi.org/10.3390/su16135360
Submission received: 10 April 2024 / Revised: 13 June 2024 / Accepted: 17 June 2024 / Published: 24 June 2024

Abstract

:
China’s pilot free trade zones play an important role in promoting deep-level reform and high-standard opening up. Based on the panel data of 284 prefecture-level cities in China from 2009 to 2021, the article explores the impact of pilot free trade zones on urban innovation using the multi-period difference-in-differences model, mediation effect model, and spatial difference-in-differences model, treating the pilot free trade zone as a quasi-natural experiment. The study shows the following: the establishment of pilot free trade zones boosts sustained growth in urban innovation, and the results still hold after a series of robustness tests; the enabling effect of pilot free trade zones on urban innovation is most significant in eastern regions and large-scale cities; and the role of pilot free trade zones in promoting innovation varies by stage. The mediation impact study revealed that pilot free trade zones can influence urban innovation via talent concentration, foreign direct investment, market scale, and financial support. The pilot free trade zones enhance the innovation performance of its geographically adjacent cities with economic ties and the innovation level of the region. The analysis offers a policy basis for the sustainable growth of urban innovation.

1. Introduction

China’s pilot free trade zones (FTZs) are a critical initiative in its efforts to expand its economy and foster high-quality development. The China (Shanghai) FTZ was formally launched in September 2013, and as of September 2023, a total of 21 FTZs have been developed, relying on 49 prefectures and cities, which have formed an opening pattern covering the east, west, south, north, southeast, interior, and coast. In 2022, the 21 FTZs covered less than four thousandths of the country’s land area, achieving a total import and export volume of 7.5 trillion yuan, which accounted for 17.8% of the country’s total. The growth rate was 6.8 percentage points higher than the national average level, and the actual foreign direct investment was 222.52 billion yuan, representing 18.1% of the country’s total, according to the China Pilot Free Trade Zone Development Report 2023.
Traditional development zones, primarily governed by local authorities, are susceptible to non-market factors, conventional inertia patterns, etc., which significantly diminish the efficacy of policy execution [1,2]. Unlike traditional economic development zones, FTZs are an important initiative for China to implement a more proactive approach to opening up its economy in light of the changing dynamics of global trade. They aim to enhance China’s level of openness through institutional innovation and the creation of replicable and widely adopted practices. The greatest incentive for scientific and technological innovation is a stable market environment. It is pivotal to determine whether the establishment of FTZs can enhance innovation and foster the high-quality development of Chinese economy in order to construct an innovative country.
FTZs are an essential strategy for nations to acquire competitive benefits in the process of globalization and international commerce [3]. Scholars have concentrated their research on its effects on export trade, economic development, industrial upgrading, and capital flows since the concept was introduced. Establishing FTZs can substantially increase the magnitude of regional exports [4,5,6]. The rapid growth of the economies in regions where FTZs are located may be attributed to the government’s policy support [7,8,9]. Meanwhile, China’s economy is transitioning from a period of rapid growth to one of high-quality development. Within the framework of China’s “four sectors + three economic belts” regional strategy, FTZs promote global trade and accelerate capital flows while reducing tariff barriers [10]. Consequently, enterprises are incentivized to enhance their production inputs, consistently raise product quality, and increase sectoral efficiency [11], thereby effectively facilitating green and high-quality economic growth [12,13]. Industry is the foundation of regional economic development. The liberalization of trade in FTZs has facilitated the unrestricted exchange of technology, information, and products among enterprises, which has further stimulated the transformation and upgrading of industrial structure [14], especially the upgrading of the industrial structure of the manufacturing industry, but the proactive effect on the rationalization of the industrial structure is unstable and decreases over time after the establishment of FTZs [15]. Additionally, enterprises in FTZs are subject to a negative list management model, which improves the transparency of government management and establishes a fair and equitable competitive environment for businesses, thereby facilitating the rapid growth of the regional service industry [16,17]. As China’s manufacturing advantage is gradually eroded by low-cost competitors in Southeast Asia, the establishment of FTZs as one of the bridges between China and the world has facilitated the removal of restrictions on foreign investment, effectively promoting the amount of actual Chinese utilization of foreign direct investment [18]. Trade will stimulate business innovation [19,20]. While there are fewer studies on the impact of FTZs and innovation, a favorable institutional environment in FTZs is advantageous for technology and knowledge spillovers, which, in turn, promote innovation [21,22].
In summary, there are several issues need to be further explored in the existing research on FTZs: First, most of the studies use Shanghai as the experimental group, and the research methodology used is the synthetic method, where the control group of provinces is weighted to obtain the “synthetic region”. Shanghai was the first city in China to set up an FTZ, serving as a strategic point for China’s high-level opening to the outside world, and a single-sample study of Shanghai may overestimate the policy effect. The synthetic control method has a certain degree of subjectivity in the selection of synthetic indicators, which leads to a lack of scientific validity in the conclusions. Second, the majority of existing studies are based on the provincial level, and there are fewer studies on prefecture-level cities with detailed samples. The layout of the FTZs is at the prefecture level, covering an area of about 120 square meters. Utilizing provincial data for the study may lead to certain errors in the results, and the policy revelations obtained are very limited. Third, although there are articles that study the impact of FTZs on innovation, the existing studies are exclusively centered on the city of Shanghai, and no comprehensive analysis of the mechanism between FTZs and innovation has been conducted.
Based on the above discussion, the marginal contributions of this paper are as follows: (1) The paper studies the impact of FTZs on the innovation performance of prefecture-level cities, which provides the basis for the development of regional innovation. (2) We analyze how FTZs affects urban innovation. Additionally, we analyze the impact of FTZs on urban innovation in detail, taking into account the differences in location, city size, quality of innovation, and establishment batch. By analyzing the heterogeneity of the impact on urban innovation, we aim to provide targeted suggestions for the implementation of opening up policy and improvement of urban innovation performance. (3) Furthermore, we use a spatial difference-in-differences model to investigate the impact of FTZs on innovation in adjacent cities.
The rest of the paper is organized as follows: the Section 2 is the policy background and research hypotheses; the Section 3 consists of the model setting, variable determination, and data description; the Section 4 is the empirical analysis; the Section 5 is the spatial effect analysis of the establishment of FTZs on urban innovation performance; and finally, the conclusion is presented.

2. The Policy Background and Research Hypothesis

2.1. The Background of the Establishment of FTZs

The 18th National Congress of the Communist Party of China recognized the necessity of implementing a more proactive opening-up strategy in response to the challenges and pressures posed by new international trade regulations. As a result, the first FTZ was established in Shanghai in September 2013. In 2015, FTZs were established in Guangzhou, Shenzhen, Zhuhai, and Tianjin to build an important hub along the Maritime Silk Road and create a high-level platform for coordinated development in the Beijing-Tianjin-Hebei region. In 2017, there was more growth, with the establishment of FTZs in Fuzhou, Xiamen, Shenyang, Dalian, Yingkou, Zhoushan, Zhengzhou, Kaifeng, Luoyang, Wuhan, Xiangyang, Yichang, Chongqing, Chengdu Xi’an, and Xianyang. The geographical distribution was gradually shifting from coastal cities to inland cities. Finally, Hainan Province established FTZs in 2018, covering an area of 31,500 square kilometers, making it an important gateway for opening up to the Pacific Ocean and Indian Ocean. In 2019, FTZs were set up in cities including Jinan, Qingdao, Yantai, Nanjing, Suzhou, Lianyungang, Nanning, Qinzhou, Chongzuo, Baoding, Shijiazhuang, Tangshan, Kunming, Harbin, Heihe, Mudanjiang, etc. In 2020, FTZs were established in the cities of Beijing, Changsha, Yueyang, Chenzhou, Hefei, Wuhu, Bengbu, Ningbo, Hangzhou, and Jinhua. As of September 2023, China has set up FTZs in 49 prefecture-level cities in 21 provinces (see Figure 1).

2.2. Research Hypothesis

Innovation development relies mainly on the market and enterprises, but it also requires the government to act as an investor and insurer. Over ten years, FTZs have always insisted on the integration of foreign opening and domestic reform. For instance, in 2021, the State Council issued “Several Measures on Piloting the Systematic Liberalization in Conditional Pilot Free Trade Zones and Free Trade Ports to Match the International High Standards” with the aim of attracting a large number of enterprises to relocate to the area. In Hainan, for example, the Hainan pilot free trade zone was established, attracting 28 Fortune 500 enterprises to settle in Hainan, and the growth rates of both the number of new foreign-funded enterprises and the actual utilization of foreign capital exceeded 100% [23]. FTZs provide a platform for the agglomeration of businesses, thus increasing market competition among enterprises. Driven by the goal of profit maximization, firms are forced to engage in innovation to expand their market share, especially those located at the forefront of technology.
Hypothesis 1.
FTZs will promote urban innovation.
With the increasing opening of China to the global market, there has been a surge in enterprise exchanges. Enterprise communication essentially involves the transfer of skilled workers, namely, the migration of highly talented personnel. In 2021, Beijing published the “Directory of Human Resource Development for the Establishment of Comprehensive Demonstration Zones for the Expansion and Opening Up of the National Service Industry and the China (Beijing) Pilot Free Trade Zone”. The purpose of this publication is to guide human resource development and optimal allocation of resources in key sectors. The mobility of talent drives the overflow of knowledge between different regions and improves the level of regional innovation. In turn, enterprises need to recruit high-quality talent to improve market competitiveness. Therefore, the establishment of FTZs will result in the gathering of talent, which will have an impact on innovation performance [24]. As a comprehensive experimental platform for reform and opening up, FTZs have continuously expanded investment areas, optimized the business environment, increased the number of foreign-invested enterprises, and attracted foreign direct investment after 10 years of development. The entry of foreign-invested enterprises stimulates the inflow of capital and technology, and the overflow of knowledge and technology, in turn, has an impact on the local innovation, particularly in cases when there exists a technology gap [25].
The main purpose of the establishment of FTZs is to enhance the facilitation of foreign trade through institutional innovation and financial reforms. This includes reducing trade barriers, in other words, reducing “iceberg costs”, which is perceived to increase the market size of the destination with the reduction of trade costs under the condition that other factors remain unchanged in the EK model [26]. With reference to Ufuk Akcigit (2021), under a perfectly competitive market, the final product is formulated [27]:
Y t = L t β 1 β 0 N q j t β k j t 1 β d j
In Equation (1), k j t represents the quantity of intermediate product j at time t , q j t denotes the quality of that intermediate good; L t denotes the total labor force, subject to market size, normalizing the price of the final good to 1; and β ( 0 , 1 ) represents the fixed factor share of intermediate good j in production and the elasticity of reverse substitution. The production maximization problem of the final producer can be expressed as:
max L , k j L β 1 β 0 N q j β k j 1 β d j p j k j L w
According to the first-order condition of Equation (2), the price and wage of intermediate goods j can be obtained as:
w = β 1 β L β 1 0 N q j β k j 1 β d j p j = L β q j β k j β
In monopolistic competition, the marginal cost of the monopolist is ( η 0 ) for each intermediate product j , and the profit maximization function faced by producer j is as follows:
π j = max p j k j p j k j η k j
In Equation (3), the quantity and price of intermediate goods in equilibrium are:
w = β 1 β 1 β L q j p j = η ( 1 β )
Hence, the profit of the producer is:
w = 1 β η 1 β β β L q j
The innovation activity of the intermediate goods’ producers is random; if the innovation is successful, the production quality of the enterprise will increase from q j t to ( 1 + λ ) q j in the next stage ( λ > 0 ); if it is unsuccessful, the production quality of the enterprise will be q j t ; and the probability of enterprise innovation success is x j . There is a cost to firms to innovate; to simplify the calculation, the innovation cost function is assumed to be θ q j x j 2 among θ 0 , considering that the probability of other firm entering sector j is z j 0 , 1 , were the purpose of the entrant firm is to permanently replace the incumbent firms, such that the profits gained by the incumbent firms through innovation in the next period are as follows:
Ε π j = ( 1 z j ) x j π j ( 1 + λ ) + ( 1 x j ) π j θ q j x j 2 = q j ( 1 z j ) ( 1 β η ) 1 β β β L ( x j λ + 1 ) θ x j 2
The probability of choosing innovation when maximizing profits is as follows:
x j ( 1 z j ) λ L 2 θ ( 1 β η ) 1 β β β x j L > 0
In Equation (8), an expansion in market scale leads to an increased probability of enterprises opting for innovation, thereby elevating the level of urban innovation.
The financial ecosystem exerts a significant influence on innovation, and the development of innovation cannot be separated from financial support. One of the tasks of the FTZs is to deepen openness and innovation in the financial sector. For instance, the People’s Bank of China issued “30 Articles on Financial Reform” to bolster the development of the pilot free trade zone at the beginning of its establishment in Shanghai. In addition, the China Banking Regulatory Commission (CBRC) released policies to assist financial institutions in establishing branches, trust institutions, financial leasing entities, etc., while permitting foreign banks to establish subsidiaries, branches, and joint venture banks within these areas, thereby further enhancing their financial ecosystems. FTZs set up in the following years will pertain to the financial programs of the pilot free trade zone in Shanghai. The improvement of the financial system facilitates financing for self-trade enterprises and provides a fiscal guarantee for enterprise-level innovations, consequently promoting urban innovation.
Hypothesis 2.
The establishment of FTZs can promote urban innovation through talent agglomeration, foreign direct investment, market size, and financial support.
The establishment of FTZs as a national strategic deployment extends beyond its impact on the innovation level of the cities where they are situated. Additionally, it should also consider whether the policy has a spillover effect or siphon effect on the level of innovation in neighboring cities. Growth theory and new economic geography suggest that economic activities and growth are characterized by spatial agglomeration due to localized externalities stemming from knowledge activities and spatially constrained growing returns. Knowledge spillovers play a crucial role in innovation agglomeration. On the one hand, enterprise operations are closely intertwined with societal institutions, sharing networks of suppliers, universities, research institutes, and other public and private entities during the development of new products and processes. On the other hand, these institutions display clear localization characteristics due to their geographical and cultural proximity. Knowledge can be categorized into coded knowledge and implicit knowledge; implicit knowledge relates to individuals’ work experience that can only be realized through work communication. Consequently, innovation exhibits a strong local bias for these two reasons and represents a process of mutual learning. The presence of a “dry middle school” and the spillover effect of knowledge in the process of social exchange will have a radiating effect on the surrounding areas. FTZs will result in a clustering of enterprises, fostering heightened competition and facilitating the interexchange between these businesses, which will result in the spillover of technology and knowledge.
Hypothesis 3.
The establishment of FTZs will enhance the level of innovation in the region and stimulate innovation in neighboring cities.

3. Research Design

3.1. Multi-Period Difference-in-Differences Model

The establishment of the FTZs is a policy shock, and the time of the establishment of FTZs in cities is inconsistent; in order to scientifically evaluate the impact of the policy on urban innovation, we take a DID approach to examining the impact of FTZs on innovation. DID-based causal inference offers a clear advantage in addressing potential endogeneity arising from omitted variable bias [28]. As is well known, there are many factors that affect regional innovation, analyzing regional innovations requires controlling for a long list of variables, but failure to do so can lead to biased result—omitted variable bias. We sidestep this problem by defining the treatment and control groups in a convincing way and focusing on a relatively short time period before and after the intervention. As a result, our quasi-experiment can partially rule out the influence of other influences on regional innovation, and the results are reliable. The empirical model is constructed as follows:
I n n o v a t i o n i , t = α + β F T A P o l i c y i , t + γ C o n t r o l V a r i , t + C i t y F E + Y e a r F E + ε i , t
In Equation (9), Innovation is urban innovation performance, FTA Policy indicates the policy for the FTZs, Control Var denotes the set of control variables, C i t y F E means the urban fixed effect, Y e a r F E means the fixed effect of time, ε means stochastic error, β means the estimated coefficient.

3.2. Model Variable

  • Independent Variable (innovation). Currently, researchers primarily focus their research on innovation in two aspects: innovation input and innovation output. The innovation input index is mainly measured by the amount of R&D, and it is well known that it takes at least 1–2 years for innovation inputs to be converted into innovation outcomes. The innovation output is mainly characterized by the sales of new products. However, this process involves not only patent application, product design, etc., but also significant market influences, making it challenging to adequately assess the extent of urban innovation. Refer to the innovation index constructed from the patent data on innovation output to measure urban innovation. The Report on Industrial Innovation Capability of Chinese Cities 2017 (published by the Research Center for Industrial Development (FIND) of Fudan University, the China Center for Economic Research (Think Tank) of Fudan University, and the First Financial Research Institute) obtained the city and industry innovation indexes for the years 2009–2021 by calculating based on the patent data of industries and cities from the State Intellectual Property Office (SIPO) of China. Computing the incremental innovation index for each year by deducting the innovation index of the previous year from the innovation index of the current year to quantify urban innovation. The report’s data conclude in 2016. To calculate the urban innovation index for the years 2017–2021, we supplement the city innovation index by multiplying (patents granted in the current year/patents granted in the previous year) by the city innovation index of the previous year, and the number of patent grants per 10,000 people is used for a robustness test.
  • Dependent Variable. The article considers FTZs as a quasi-natural experiment, setting the city on where FTZs are located as the experimental group and the other cities as the control group. The policy shocks to FTZs are characterized by the interaction term of the time dummy variable for policy shocks and the city dummy variable. In order to accurately measure the time of policy shocks to the control group, a value is assigned to the experimental group. If the experimental group establishes a FTZ in a specific year, the month in which the FTZ is established is used to determine the value assigned to the control group in that year. This value represents the proportion of the year that has passed since the establishment of the FTZ. For example, if FTZ of Shanghai is set up in September 2013, the value assigned to the control group in 2013 would be 1/3, indicating that one-third of the year has passed since the establishment of FTZ. FTZs are established at various points in time, resulting in non-identical time dummy variables for the cities where FTZs are located.
  • Control Variable. Considering that other characteristics of the city can affect innovation, other influencing factors are controlled: (1) R&D expenditures, measured by the natural logarithm of urban R&D expenditures; (2) education expenditures, measured by the natural logarithm of urban education expenditures; (3) GDP per capita, measured by the natural logarithm of GDP per capita of the city; (4) population size, measured using the natural logarithm of the urban resident population; and (5) infrastructure development, measured by the urban road space per capital.
The data on the cities in which FTZs were established and the time of their establishment come from the approval documents granted by the State Council. The data for other variables come from the China Urban Statistical Yearbook and various city yearbooks, including Chaohu City in Anhui Province, which has been reorganized as a county-level city and administered by Hefei City since 2011, and the cities of the Tibet Autonomous Region, Bijie, Tongren, Haidong, Hami, Turpan, Sansha, and Danzhou. Shashi City, Danzhou City, and Danzhou City are omitted due to serious quantities of missing data. For the few missing values, we adopted the linear interpolation method and searched for the yearly reports of the national economic and social development statistics of each city. Finally, the urban data of 284 cities for the period of 2009-2021 were obtained. In order to analyze the data of different units of measurement, the data were logarithmically processed (Table 1).

4. Result

4.1. Benchmark Regression

Table 2 reports the regression results. Column 1 shows the regression results without adding the control variables and fixed effects; column 2 shows the double fixed effects of city and time added based on column 1; and columns 3 and 4 show the regression results with control variables added based on columns 1 and 2, respectively. The regression results show that the estimated coefficient of the FTZs is positive at the 10% level, and the estimated coefficient decreases after adding the double fixed effects as well as the control variables, but it is still significantly positive, which can indicate that the FTZs will promote urban innovation performance by 22.62 units to a certain extent, thus verifying Hypothesis 1.

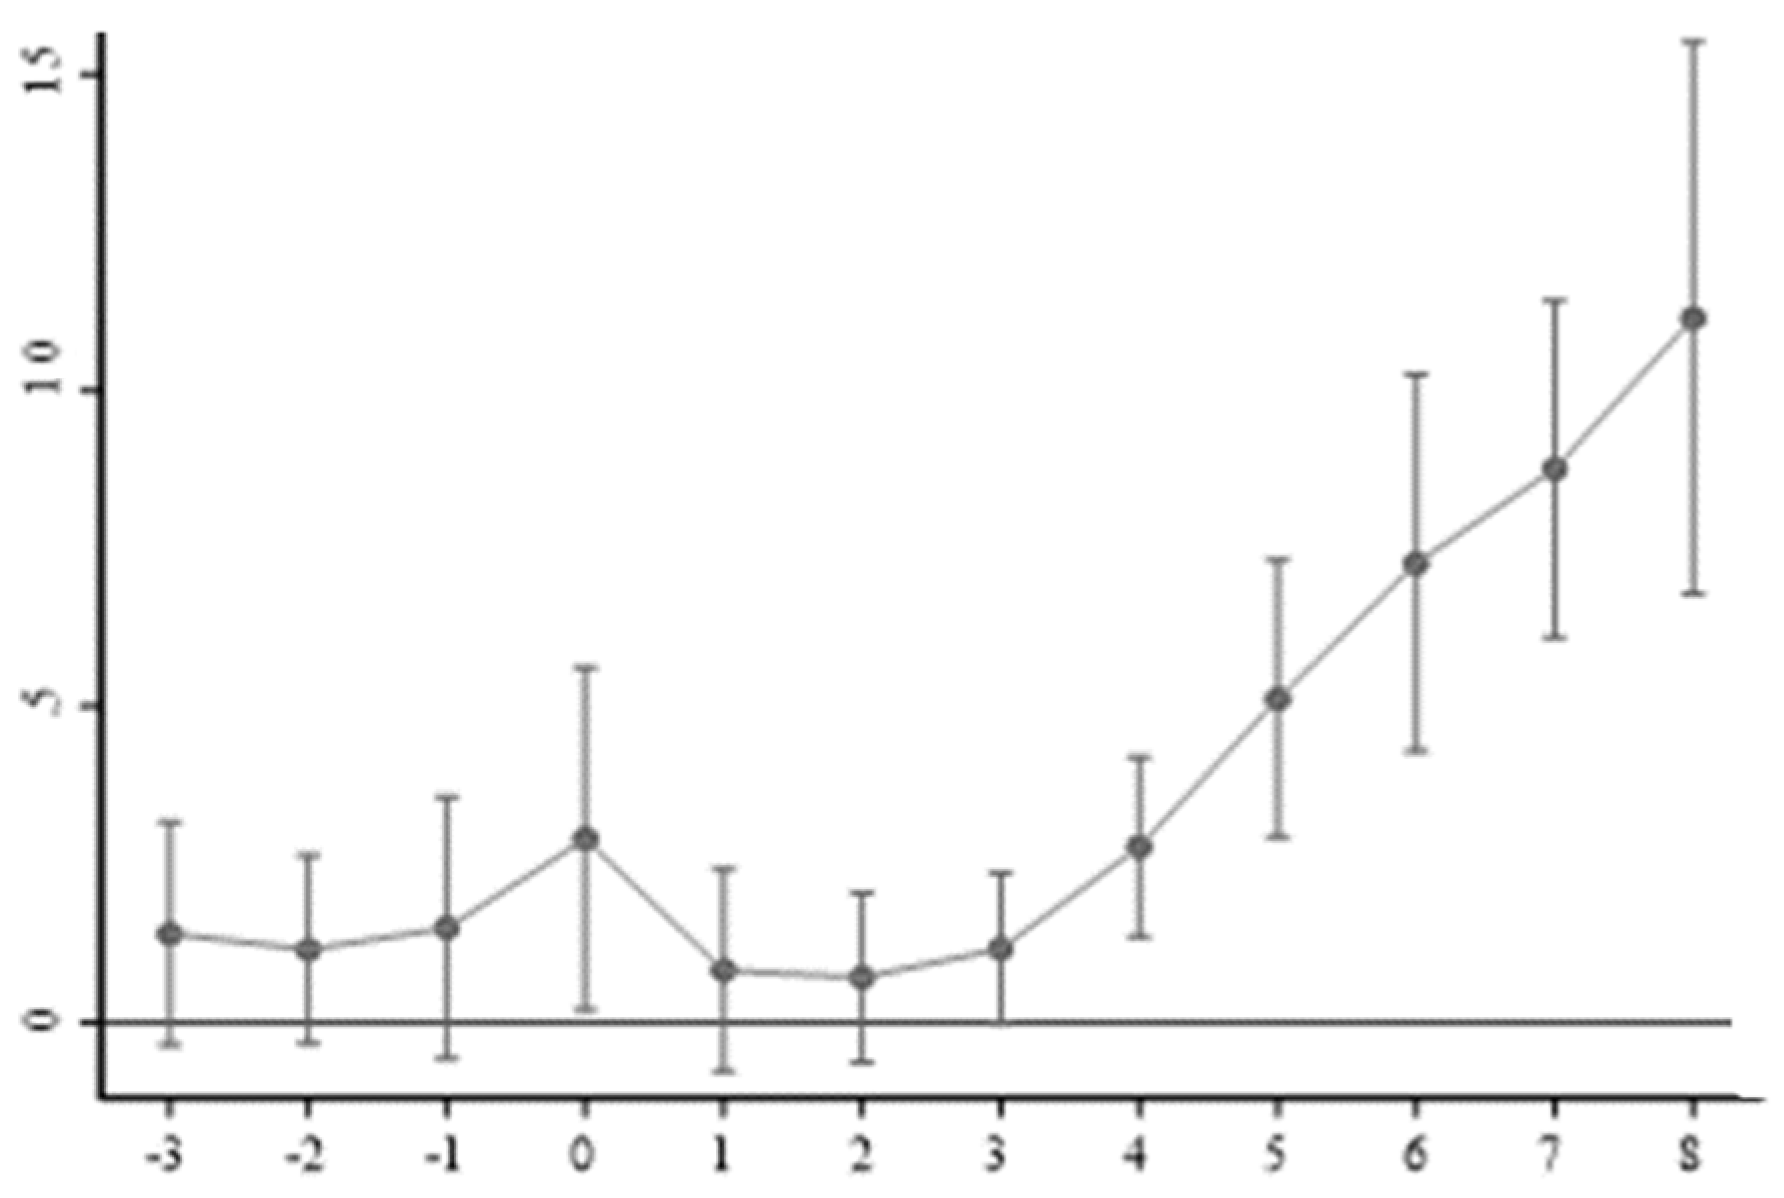
4.2. Analysis of Parallel Trend Test

Parallel trend test is prerequisite for the analysis of the multi-period DID model. This means that the experimental group and the control group have the same trend of change before the policy shock. Since FTZs were established at different dates in each city, it is not possible to use a single year as the reference point for the policy shock. Therefore, it is necessary to set the relative time dummy variable values for the cities affected by the policy impact. The formula for conducting a parallel trend test is as follows:
I n n o v a t i o n i t = + β 1 B e f o r e 3 i t + β 2 B e f o r e 2 i t + β 3 B e f o r e 1 i t + β 4 C u r r e n t i t + β 5 A f t e r 1 + β 6 A f t e r 2 + β 7 A f t e r 3 + β 8 A f t e r 4 + β 9 A f t e r 5 + β 10 A f t e r 6 + β 11 A f t e r 7 + β 12 A f t e r 8 + γ C o n t r o l _ V a r i t + C i t y F E + Y e a r F E + ε i t
The time dummy variable in Equation (10) represents the observed values of the year preceding, current, and after the establishment of FTZs in each city. The dummy variable for cities in the control group is assigned a value of 0. The research period for this study spans from 2009 to 2021, with the earliest FTZs established in 2013, so the dummy variables of the cities are at most -4 periods, and the time variables for the -4 periods and the previous period are excluded to avoid multicollinearity. The parallel trend test shows that there is no significant difference between the innovations of the experimental group and the control group before the policy, indicating that the policy conforms to parallel trend hypothesis (see Figure 2). In terms of the dynamic effect of the policy, the impact of the establishment of the FTZs on innovation is unstable in the short term, and the impact coefficient increases after three years of implementation, indicating that the policy can promote urban innovation with a certain lag.

4.3. Robustness Check

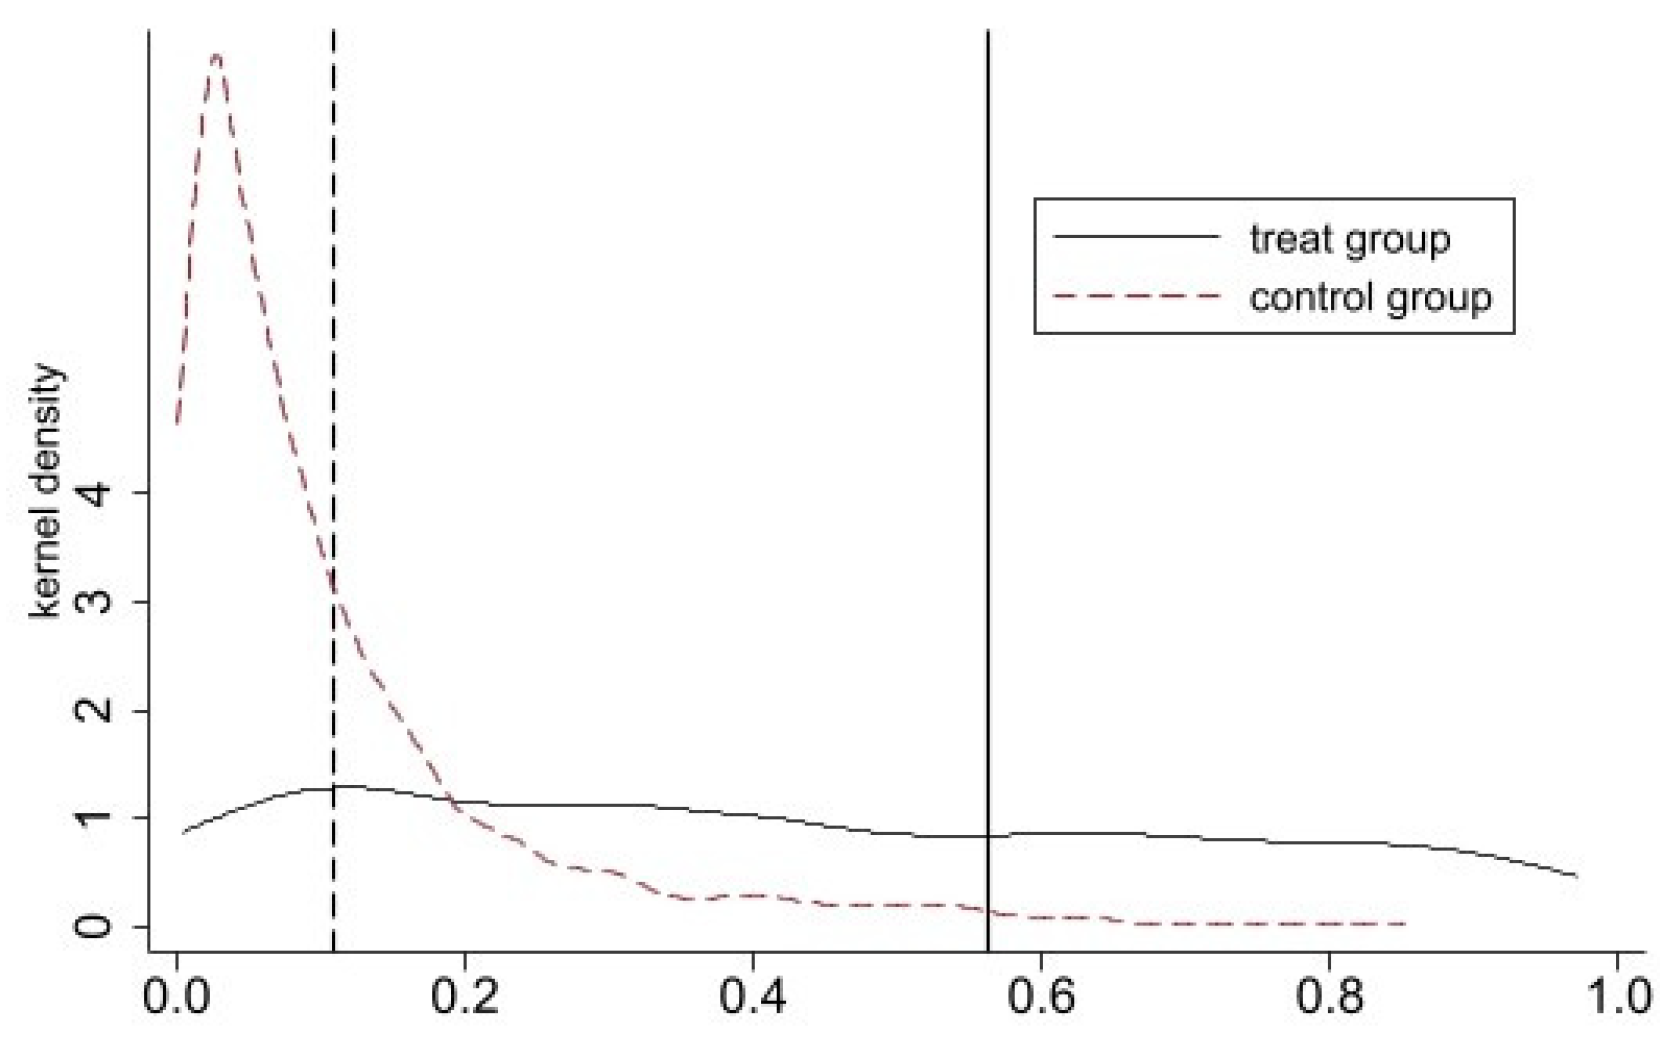
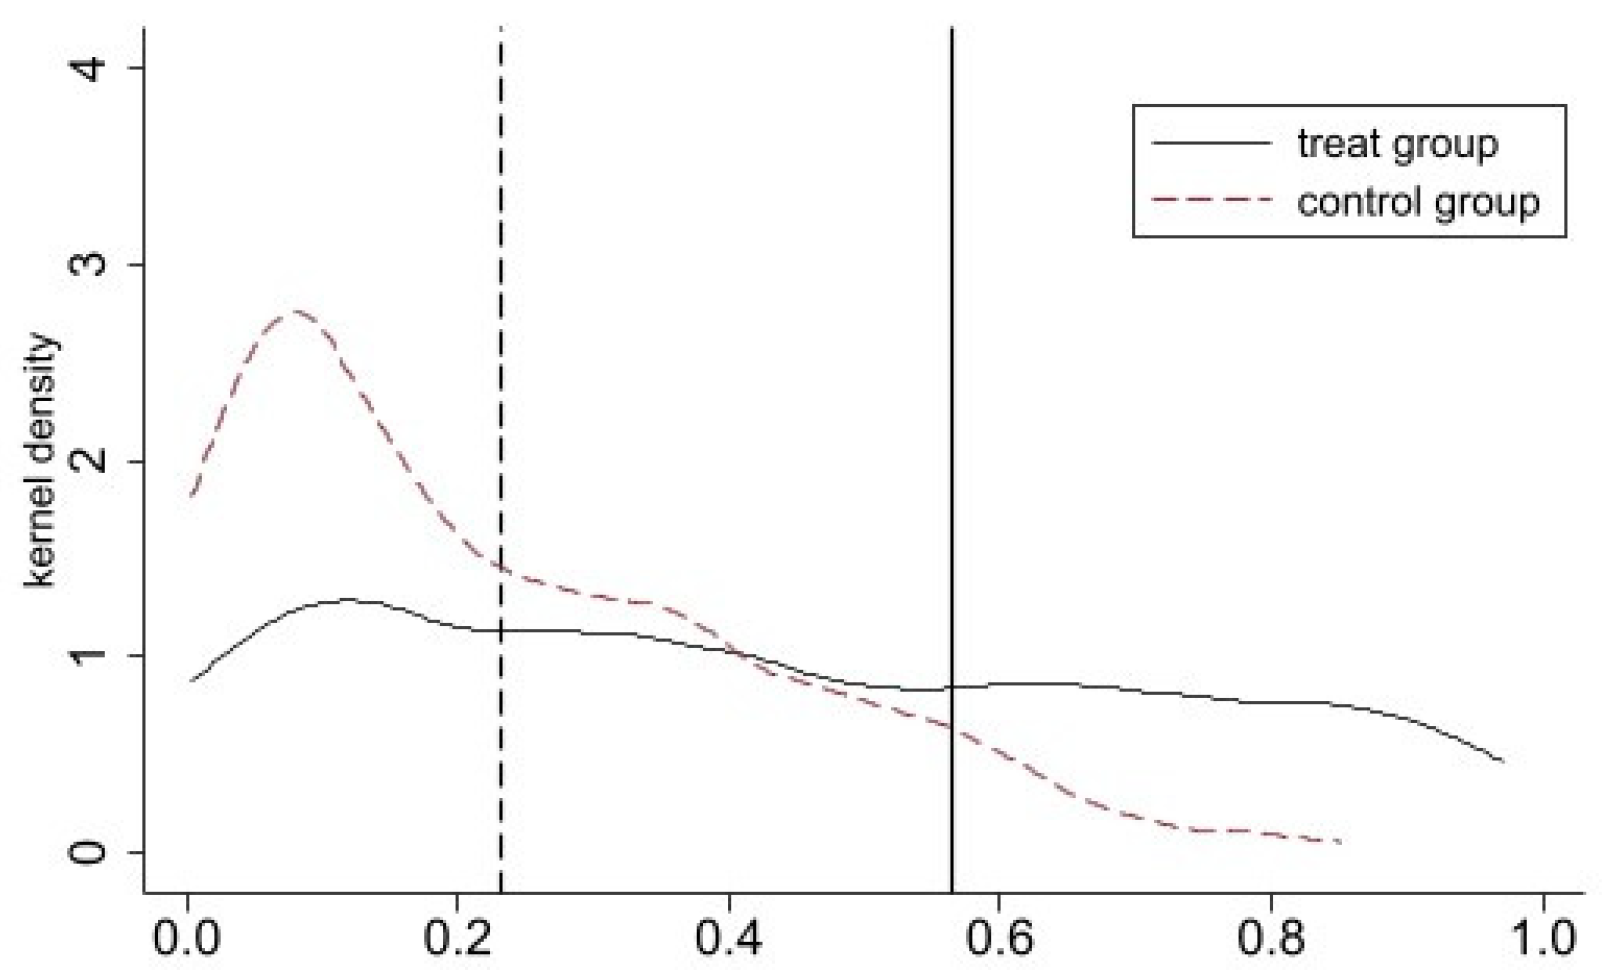
  • Multi-temporal Propensity Score Matching-difference-in-differences model (PSM-DID). Ideally, we should study the difference between the same people affected and those not affected by the policy, but such an ideal situation can hardly be realized in reality. Meanwhile, the FTZs are not strictly natural experiments, and there is the problem of selection bias; hence, PSM-DID was used for the robustness test. Figure 3, Figure 4, Figure 5 and Figure 6 report the kernel density plots of the experimental and control groups before and after matching under the cross-sectional and year-by-year methods. The deviation of the two kernel density curves is relatively large regardless of the method, and the distance between the mean lines is shortened and the two curves are closer after matching, showing the treatment effect of the cross-section and year-by-year to reduce the sample selectivity bias. Columns 1 and 2 in Table 3 report the results of difference-in-differences regressions under both methods. The estimated coefficients of the policy are significantly positive, which is consistent with the estimation results in Table 2.
  • Replace the explanatory variables. The explanatory variable is replaced by the number of patents granted per 10,000 people for analysis. The result is shown in column 3 of Table 3, the estimated coefficient of the policy is 8.1971 and is significantly positive at the 1% level, indicating that the FTZs will increase the number of patents granted in cities and thus positively affect urban innovation, and the results are still robust.
  • Exclude the influence of other policies. During the research period, the country issued the “innovative city” that is closely related to the research of this paper. Therefore, the interaction term between the year dummy variable and the city dummy variable of the implementation of the policy of the “innovative city” is added to the benchmark regression to control its effect, and the result is shown that the estimated coefficient of FTZs is still significantly positive after the exclusion of the policy of “innovative city” in column 4 of Table 3, indicating that the estimated result is robust to a certain extent and further confirming the validity of Hypothesis 1.

4.4. Heterogeneity Analysis

  • Regional heterogeneity analysis. To test whether there are regional disparities in the impact of FTZs on urban innovation, the three regions of the East, Central, and West are further analyzed. Column 1–3 in Table 4 show that FTZs has a significantly positive impact on the innovation of the eastern, central, and western regions, with estimated coefficients of 27.30, 10.93, and 9.65. This indicate that the establishment of FTZs has a higher promotional effect on the east than on the central and western regions. It is possible that the level of economic development, talent concentration, financial support, and other innovative environments in the eastern region are better than those in the central and western regions.
  • Innovation heterogeneity analysis. Invention patents are regarded as high-quality innovations due to their novelty and technical creativity, while utility model or design patents are regarded as low-quality innovations because of their relatively low technical content. Columns 4–5 of Table 4 demonstrate that the policy has a substantial promotional effect on invention patents and utility patents. The estimated coefficient for invention patents is 1.7526, while for utility patents it is 6.4445. This suggests that the policy has a greater influence on low-quality innovations compared to high-quality innovations. The reason may be that invention patents require longer time and more funds compared with utility patents, the large-scale establishment of FTZs started in 2017, which the policy effect has not yet been fully played.
  • Heterogeneity analysis of city size. The expansion of urban scale leads to the agglomeration of innovation factors and thus improves the performance of urban innovation [29,30]. According to the Notice of the State Council on the Adjustment of the Criteria for the Division of Urban Scale, the cities were divided into mega-cities (urban resident population > 10 million), mega-cities (urban resident population 5 million to 10 million), big cities (urban resident population 1 million to 5 million), medium-sized cities (urban resident population 0.5 million to 1 million), and small cities (urban resident population below 500,000). To facilitate the analysis, the article divides the city size into large cities (with a resident population of more than 1 million), medium-sized cities (with a resident population of 500,000–1,000,000), and small cities (with a resident population of less than 500,000). Columns 1, 2, and 3 of Table 5 show that the policy is significantly positive for the innovation performance of large cities, and not significant for small and medium-sized cities.
  • Establishment of batch heterogeneity analyses. FTZs are established in different batches, and in 2017, FTZs were established in eight provinces (Liaoning, Zhejiang, Henan, Hebei, Hubei, Chongqing, Sichuan, and Shaanxi). The article chose the cut-off point 2017; the first batch is from 2013 to 2017, and the second batch is from 2018 to 2021. To set up different batches of the free trade area analysis of heterogeneity, the regression results are in Table 5 in the first column (4) and (5). The results show that the establishment of the FTZs has a positive effect on urban innovation performance at both time points. From the estimated coefficients, the estimated coefficient of the first batch is 7.2566, and the estimated coefficient of the second batch is 10.5481. i.e., the policy effect of the second batch is stronger than the first batch.

4.5. Mechanism Analysis

According to the theoretical analysis in the Section 2, we use instrumental variable regression to analyze the causal relationship of the establishment of FTZs on the mechanism variables (talent concentration, foreign direct investment scale, market scale, financial support) to investigate the mechanism of FTZs on urban innovation. This analysis the role of the independent variables on the mechanism variables in the first step and, analyzing the relationship between the mechanism variables and the dependent variables in second step using the double-fixed-effects model. The construction of the mediation effect test model is as follows:
M e d i a t o r i , t = 0 + 1 F T A P o l i c y i , t + γ C o n t r o l V a r i , t + C i t y F E + Y e a r F E + ε i , t
I n n o v a t i o n i , t = 0 + 2 M e d i a t o r i , t + γ C o n t r o l V a r i , t + C i t y F E + Y e a r F E + ε i , t
Equation (11) represents the effect of the establishment of FTZs on the mediator variable, M e d i a t o r i , t indicates the mediator variable, and Equation (12) represents the effect of the mediator variable on the urban innovation performance, if the sign of 1 and 2 is consistent, the mediating effect is established.
  • Talent agglomeration. The talent agglomeration is characterized by the number of employees in the information transmission, computer services, and software industries plus the number of employees in the scientific research, technical services, and geological survey industries divided by the total number of employees. Columns (1) and (2) of Table 6 report the regression results of talent agglomeration. The influence of the establishment of FTZs on talent agglomeration is analyzed based on the instrumental variable method at the city time level in column (1), which controls the fixed effect of city and time, and column (2) shows the regression results of talent agglomeration on the level of innovation in the city. The results show that the impact of the establishment of the FTZs on talent aggregation is significantly positive, confirming that talent aggregation is one of the channels through which FTZs influence urban innovation.
  • Foreign direct investment (FDI). The magnitude of foreign direct investment (FDI) is quantified by taking the natural logarithm of the actual level of FDI utilization. Given the substantial discrepancy in FDI data and mitigate the influence of extreme value samples on the findings, FDI was re-estimated by shrinking the upper and lower 1% in addition to the logarithmic treatment. The regression results are shown in columns (3) and (4) of Table 6. After controlling for the fixed effects of city and time, the results show that the impact of the establishment of FTZs on FDI is significantly positive, and the estimated coefficient of FDI on urban innovation is significantly positive, confirming that FDI is one of the channels of the establishment of FTZs on urban innovation.
  • Financial support. This paper interprets the level of financial support in term of financial scale, which is characterized by the ratio of total deposits and loans of financial institutions to the Gross Domestic Product (GDP). The regression results are shown in columns (5) and (6) of Table 6. After two regression tests, the findings confirm that financial institutions are one of the channels for the establishment of FTZs to influence urban innovation.
  • Market size. This indicator is measured using the logarithm of GDP. The regression results are shown in (7) and (8) of Table 6. Controlling for city and time-fixed effects, the coefficient of the establishment of the FTZs on market size is positive, and the coefficient of market on innovation in the city is also significantly positive, thus confirming that market size is one of the influencing mechanisms of the establishment of FTZs on urban innovation, thus verifying Hypothesis 2.

5. Analysis of the Spatial Effects

According to the above, the establishment of FTZs will have an affect the innovation of local cities (the direct effect) and adjacent cities through spillover effects (the spillover effect). To better examine the spatial effect of the establishment of the FTZs on urban innovation, we apply spatial difference-in-differences, which combine the difference-in-differences and spatial Durbin model [31], the model is constructed as follows:
I n n o v a t i o n i t = ρ I n n o v a t i o n i t + β 1 F T A p o l i c y j t + β 2 j = 1 N W i j X j t + C i t y F E + Y e a r F E + i t
Equation (13), W i j shows the spatial weight matrix, ρ indicates the impact of the spatial lag term on the dependent variable of urban innovation called “spatial autoregressive coefficient”, β 1 represents the impact of the establishment of FTZs on urban innovation. The remaining variables are consistent with formula (2). In spatial analysis, spatial linkage is the premise and key to spatial modeling, and the spatial weight matrix indicating the strength of inter-regional linkage is crucial. At present, there is ambiguity among researchers on the selection of a spatial weight matrix. We choose a 0–1 spatial weight matrix and an economic geography matrix, an economic geography nested matrix, for analysis, and the spatial regression results are shown in Table 7.
Columns (1), (3), and (5) of Table 7 show the overall impact of the establishment of FTZs on urban innovation under different spatial matrix matrices. The results show that the establishment of FTZs increases local innovation by 18 units, with statistically significant results at the 1% level. The regression results were evaluated to examine the spatial spillover effects of the establishment of FTZs on innovation. The findings are shown in columns (2), (4), and (6) of the table. The impact of FTZs on local innovation is highly positive and statistically significant at the 1% level under the three spatial matrices. Nevertheless, the establishment of FTZs is not significant on the innovation of neighboring cities under the 0–1 proximity weight matrix, and there is a spillover effect on the innovation of the surrounding cities when considering the economic-geographical weight matrix and the economic-geographical nested matrix. This indicates that FTZs will have spillover effects on innovation in cities with local proximity and economic ties, verifying Hypothesis 3.

6. Conclusions

By constructing panel data set comprising a broad sample (284) of prefecture-level cities in China from 2009 to 2021, we provide the evidence of the FTZ–innovation link.
One of the key findings is that FTZs can significantly boost urban innovation. Considering that this positive effect is influenced by model, variables, and other policies during the sample period, we conducted a series of rigorous tests included multi-temporal propensity score matching double differential analysis, substituting key explanatory variables, and removing the influence of other policies. The empirical findings remained statistically significant. Consequently, we found that the positive impact of FTZs on innovation is directly correlated with the level of economic growth and the size of the city, as well as the duration of time that the pilot FTZ has been established. Compared to different levels of innovation, FTZs have a more significant impact on lower levels of innovation.
The second main conclusion related to the impact of FTZs on innovation. We found that foreign direct investment, financial support, talent pooling, and market scale are all channels through which FTZs affect innovation.
The third main conclusion is that the establishment of FTZs has a substantial positive impact on the innovation of the local area, as well as the cities that have strong economic connections with their neighboring regions, as measured by the economic-geographical matrix and the economic-geographical nested matrix using spatial difference-in-differences.
From the policy perspective, FTZs have the potential to greatly enhance urban innovation, particularly cities in China with a high level of economic development. In underdeveloped regions, it is crucial for governments to carefully consider the arrangement of FTZs in combination with other policies in order to optimize the impact of these zones. Meanwhile Chinese government should enhance the level of institutional liberalization, give more autonomy for reforms to FTZs, and adjust the size of the zones in accordance with the real growth of the region, reinforce the connection between the neighboring cities of FTZs to expedite the duplication and dissemination of successful. Future, China’s free trade zones are a key part of its efforts to innovate its institutions and demonstrate its ongoing commitment to opening up to global trade. The Chinese Government should further enhance its efforts to increase international integration, establish diverse external development platforms to achieve the most efficient distribution of innovative factors, and consistently elevate the level of urban innovation.
The limitation of this research is that the impact of FTZs on urban innovation is analyzed at the macro level. The impact of the establishment of free trade zones on the innovation of enterprises can be further explored from a micro perspective in the future, as enterprises are a primary component of innovation.

Author Contributions

Conceptualization, C.L. and G.F. The two authors discussed and wrote this article together. The two authors contributed equally to the writing of this paper. All authors have read and agreed to the published version of the manuscript.

Funding

This research has been supported by a Project (42062020) of the National Natural Science Foundation of China (NSFC).

Institutional Review Board Statement

Not applicable.

Informed Consent Statement

Not applicable.

Data Availability Statement

Data are contained within the article.

Conflicts of Interest

Both authors approved the submitted manuscript. The authors declare that they have no conflicts of interest.

References

  1. Glaeser, E.L.; Gottlieb, J.D. The Economics of Place-Making Policies (No. w14373). Natl. Bur. Econ. Res. 2008, 39, 155–253. [Google Scholar]
  2. Glaeser, E.L.; Rosenthal, S.S.; Strange, W.C. Urban economics and entrepreneurship. J. Urban Econ. 2010, 67, 1–14. [Google Scholar] [CrossRef]
  3. Akbari, M.; Azbari, M.E.; Chaijani, M.H. Performance of the Firms in a Free-Trade Zone: The Role of Institutional Factors and Resources. Eur. Manag. Rev. 2018, 16, 363–378. [Google Scholar] [CrossRef]
  4. Liao, L.M.; Lu, T.R.; Lei, Y.J. Free trade zone, foreign trade dependence and inland opening highlands. Spec. Zone Econ. 2019, 8, 22–24. [Google Scholar]
  5. Chauffour, J.P.; Maur, J.C. Preferential Trade Agreement Policies for Development: A Handbook; World Bank Publications: Chicago, IL, USA, 2011. [Google Scholar]
  6. Waugh, M.E.; Ravikumar, B. Measuring openness to trade. J. Econ. Dyn. Control 2016, 72, 29–41. [Google Scholar] [CrossRef]
  7. Hua, Y.; Weihe, G. Do the pilot free trade zones cause the effects of institutional dividends? Evidence from Shanghai PFTZs. J. Financ. Econ. 2017, 43, 48–59. [Google Scholar]
  8. Liu, B.; Lv, C. Impact analysis of free trade zones in regional economies: A comparative study based on synthetic control method. J. Int. Trade 2018, 423, 51–66. [Google Scholar]
  9. Lihui, W.; Zhihong, L. Research on the Impact of Shanghai Free Trade Zone on Regional Economy-Based on the Perspective of “Counterfactual Thinking”. Int. Trade Issues 2017, 106, 3–15. [Google Scholar]
  10. Ghosh, S.; Reynolds, C.L.; Rohlin, S.M. The spillover effects of United States foreign trade zones. Appl. Econ. 2016, 48, 4112–4130. [Google Scholar] [CrossRef]
  11. Nataraj, S. The impact of trade liberalization on productivity: Evidence from India’s formal and informal manufacturing sectors. J. Int. Econ. 2011, 85, 292–301. [Google Scholar] [CrossRef]
  12. Zhou, G.; Zhang, Z.; Fei, Y. How to Evaluate the Green and High-Quality Development Path? An FsQCA Approach on the China Pilot Free Trade Zone. Int. J. Environ. Res. Public Health 2022, 19, 547. [Google Scholar] [CrossRef]
  13. Zhao, T.; He, F. Does the Pilot Free Trade Zone Promote the Quality of Urban Economic Growth: An Empirical Research Based on Quasi-Natural Experiment. Sustainability 2022, 14, 7352. [Google Scholar] [CrossRef]
  14. Wang, H.; Zhang, Y.; Liu, Z.; Liu, R.; Li, K. The impact and mechanisms of the Shanghai pilot free-trade zone on the green total factor productivity of the Yangtze River Delta Urban Agglomeration. Environ. Sci. Pollut. Res. 2022, 29, 40997–41011. [Google Scholar] [CrossRef]
  15. Shahid, R.; Shahid, H.; Shijie, L.; Mahmood, F.; Yifan, N. Impact of opening-up on industrial upgrading in global value chain: A difference-in-differences estimation for Shanghai pilot free trade zone. Kybernetes 2023. [Google Scholar] [CrossRef]
  16. Yao, D.; Whalley, J. The China (Shanghai) Pilot Free Trade Zone: Background, Developments and Preliminary Assessment of Initial Impacts. World Econ. 2016, 39, 2–15. [Google Scholar] [CrossRef]
  17. Tan, W.; Cui, F.; Yang, Z. The impact of negative list management model on capital flow in service industry in Shanghai free trade zone: An analysis based on synthetic control method. Macroecon. Res. 2019, 5, 117–132. [Google Scholar]
  18. Liu, Z.; Li, J. The rule of law experiment in China’s pilot free trade zones: The problems and prospects of introducing Hong Kong law into Guangdong. Hague J. Rule Law 2018, 10, 341–364. [Google Scholar] [CrossRef]
  19. Grossman, G.M.; Helpman, E. Trade, Innovation, and Growth. Am. Econ. Rev. 1990, 80, 86–91. [Google Scholar]
  20. Navas, A. Trade liberalisation and innovation under sector heterogeneity. Reg. Sci. Urban Econ. 2015, 50, 42–62. [Google Scholar] [CrossRef]
  21. Li, H.; Chen, J.; Wan, Z.; Zhang, H.; Wang, M.; Bai, Y. Spatial evaluation of knowledge spillover benefits in China’s free trade zone provinces and cities. Growth Chang. 2020, 51, 1158–1181. [Google Scholar] [CrossRef]
  22. Liu, B.; Wang, Y. Innovative Performance Promotion Effect of Free-Trade Zone-Evidence from the Quasi-Experiment of the Shanghai Free-Trade Zone. Res. Econ. Manag. 2018, 39, 65–74. [Google Scholar]
  23. Yan, X.; He, T.; Qian, P.; Liu, Z. Does the construction of Pilot Free Trade Zones promote the development of green economy? A quasi-natural experiment evidence from China. Econ. Anal. Policy 2024, 81, 208–224. [Google Scholar] [CrossRef]
  24. Almeida, P.; Kogut, B. Localization of knowledge and the mobility of engineers in regional networks. Manag. Sci. 1999, 45, 905–917. [Google Scholar] [CrossRef]
  25. Aghion, P.; Bechtold, S.; Cassar, L.; Herz, H. The Causal Effects of Competition on Innovation: Experimental Evidence. J. Law Econ. Organ. 2018, 34, 162–195. [Google Scholar] [CrossRef]
  26. Eaton, J.; Kortum, S. Technology, geography, and trade. Econometrica 2002, 70, 1741–1779. [Google Scholar] [CrossRef]
  27. Akcigit, U.; Ates, S.T. Ten Facts on Declining Business Dynamism and Lessons from Endogenous Growth Theory. Am. Econ. J. Macroecon. 2021, 13, 257–298. [Google Scholar] [CrossRef]
  28. Ou, Y.; Song, W.; Nam, K.M. Metro-line expansions and local air quality in Shenzhen: Focusing on network effects. Transp. Res. Part D-Transp. Environ. 2024, 126, 103991. [Google Scholar] [CrossRef]
  29. Hanlon, W.W.; Miscio, A. Agglomeration: A long-run panel data approach. J. Urban Econ. 2017, 99, 1–14. [Google Scholar] [CrossRef]
  30. Hamidi, S.; Zandiatashbar, A. Does urban form matter for innovation productivity? A national multi-level study of the association between neighbourhood innovation capacity and urban sprawl. Urban Stud. 2018, 56, 1576–1594. [Google Scholar] [CrossRef]
  31. Chagas, A.L.; Azzoni, C.R.; Almeida, A.N. A spatial difference-in-differences analysis of the impact of sugarcane production on respiratory diseases. Reg. Sci. Urban Econ. 2016, 59, 24–36. [Google Scholar] [CrossRef]
Figure 1. Sketch map of the distribution of pilot free trade zones (“南海诸岛” translate into the South China Sea Islands).
Sustainability 16 05360 g001
Figure 2. Results of parallel trend test.
Sustainability 16 05360 g002
Figure 3. Kernel density distribution before cross-section PSM matching.
Sustainability 16 05360 g003
Figure 4. Kernel density distribution after cross-section PSM matching.
Sustainability 16 05360 g004
Figure 5. Year-by-year distribution of kernel density before PSM matching.
Sustainability 16 05360 g005
Figure 6. Year-by-year distribution of kernel density after PSM matching.
Sustainability 16 05360 g006
Table 1. Descriptive statistics.
VariablesObserved ValueMeanStandard Deviationminmax
urban innovation36924.903821.0904−0.8087421.3967
FTZs36920.04730.205701
GDP per capital 369210.64680.6018.372412.4564
R&D expenditure36925.69581.44222.018910.9241
education expenditure36928.43950.8334.889611.6508
resident population36925.87420.70133.04888.1499
infrastructure development369217.49477.49911.3760.07
talent gathering36920.02950.0204−0.13150.2069
market size36921.70281.0752−1.65995.1974
financial support36922.44591.20450.587921.3015
FDI36927.21832.0409−2.018613.9548
Table 2. Benchmark regression results.
(1)(2)(3)(4)
urban innovationurban innovationurban innovationurban innovation
FTZs41.8721 ***
(29.3837)
27.8354 ***
(4.0855)
26.5290 ***
(18.9515)
22.6285 ***
(4.1645)
GDP per capita 1.0214
(1.4084)
−5.8639 *
(−1.8259)
resident population −0.6869
(−0.8887)
25.2508 ***
(2.7536)
R&D expenditure 3.5995 ***
(9.3220)
0.0409
(0.0593)
education expenditure 3.7006 ***
(5.4310)
9.7265
(1.5931)
infrastructure development −0.4007 ***
(−10.8130)
−0.3708 ***
(−3.2278)
constant2.5661 ***
(9.2310)
0.3854
(0.5284)
−47.3651 ***
(−6.1036)
−156.1387 **
(−2.4659)
observed value3692369236923692
R20.16660.19410.31730.2532
city effectnoyesnoyes
Year effectnoyesnoyes
Note: *** mean p < 0.01,** mean p < 0.05, * mean p < 0.1.
Table 3. Robustness test.
(1)(2)(3)(4)
cross-sectional PSMyearly PSMpatents granted per capitalexclusion of other policies
FTZs4.3011 *
(1.9068)
7.2745 ***
(3.6513)
8.1971 ***
(4.1760)
21.2274 ***
(4.2541)
innovative city policy 1.3252
(0.7681)
control variableyesyesyesyes
observed value3692369236923692
Adjusted R20.41170.35710.57830.2463
city effectyesyesyesyes
year effectyesyesyesyes
Note: *** mean p < 0.01, * mean p < 0.1.
Table 4. Heterogeneity analysis.
(1)(2)(3)(4)(5)
eastern regionCentral regionwestern regionpatents of inventionutility patent
FTZs27.2975 ***
(3.6392)
10.9276 **
(2.2516)
9.6528 ***
(2.6882)
1.7526 ***
(4.5703)
6.4445 ***
(3.7206)
constant−274.3863 **
(−2.2471)
−140.4297 ***
(0.5284)
−79.1987 ***
(−2.8627)
−20.9582 ***
(−3.3016)
−117.0648 ***
(−3.1550)
control variableyesyesyesyesyes
observed value15601040109236903690
Adjusted R20.29710.41100.49630.39590.5696
city effectyesyesyesyesyes
year effectyesyesyesyesyes
Note: *** mean p < 0.01, ** mean p < 0.05.
Table 5. Heterogeneity analysis of urban size.
(1)(2)(3)(4)(5)
big citiesmedium-sized citiessmall citiesfirst batchsecond batch
FTZs21.8543 ***
(4.2319)
0.6304
(0.8726)
0.4176
(1.3006)
7.2566 **
(2.5372)
10.5481 **
(2.4347)
constant−253.5752 ***
(−2.6761)
−31.0999 **
(−2.5423)
−9.9673 ***
(−4.1811)
−87.7793 **
(−2.4383)
−273.6855 ***
(−2.6092)
control variableyesyesyesyesyes
observed value2079111849536923692
Adjusted R20.29220.40120.46380.14250.1969
city effectyesyesyesyesyes
year effectyesyesyesyesyes
Note: *** mean p < 0.01, ** mean p < 0.05.
Table 6. Influence mechanism analysis.
(1)(2)(3)(4)(5)(6)(7)(8)
talent agglomerationinnovationFDIinnovationfinancial supportinnovationmarket sizeinnovation
FTZs0.0132 ***
(5.1479)
0.0106 *
(0.0601)
0.1215 **
(2.1963)
0.0476 ***
(2.9002)
talent agglomeration 29.4538 **
(2.5753)
FDI 0.6011 *
(1.6723)
financial support 4.6893 **
(2.3550)
market size 32.8176 ***
(2.8183)
constant0.0164
(0.3668)
−178.2482 ***
(−2.8457)
−23.8396 ***
(−6.4589)
−161.1592 **
(−2.5334)
19.7311 ***
(11.4813)
−80.2893
(−1.2139)
−6.8619 ***
(−7.9947)
−14.9452
(−0.2336)
control variableyesyesyesyesyesyesyesyes
observed value36923692369236923692369236923692
Adjusted R20.11360.29500.12730.24880.70480.25390.76310.1968
city effectyesyesyesyesyesyesyesyes
year effectyesyesyesyesyesyesyesyes
Note: *** mean p < 0.01, ** mean p < 0.05, * mean p < 0.1.
Table 7. Panel space double difference model regression results.
0–1 Weighting MatrixEconomic Geography
Weighting Matrix
Economic Geography
Nested Matrix
(1)(2)(3)(4)(5)(6)
FTZs21.70 ***
(1.153)
18.07 ***
(1.123)
18.32 ***
(1.151)
total effect 21.11 ***
(3.523)
35.93 ***
(6.048)
42.05 ***
(6.663)
direct effect 21.72 ***
(1.207)
18.71 ***
(1.178)
19.10 ***
(1.199)
indirect effect −0.613
(3.032)
17.22 ***
(5.691)
22.95 ***
(6.349)
control variableyesyesyesyesyesyes
year effectyesyesyesyesyesyes
city effectyesyesyesyesyesyes
rho0.215 ***
(0.0236)
0.215 ***
(0.0236)
0.447 ***
(0.0301)
0.447 ***
(0.0301)
0.452 ***
(0.0350)
0.452 ***
(0.0350)
sigma2_e110.1 ***
(2.577)
110.1 ***
(2.577)
101.1 ***
(2.389)
101.1 ***
(2.389)
105.3 ***
(2.507)
105.3 ***
(2.507)
R20.0830.0830.1570.1570.1740.174
Note: *** mean p < 0.01.
Disclaimer/Publisher’s Note: The statements, opinions and data contained in all publications are solely those of the individual author(s) and contributor(s) and not of MDPI and/or the editor(s). MDPI and/or the editor(s) disclaim responsibility for any injury to people or property resulting from any ideas, methods, instructions or products referred to in the content.

